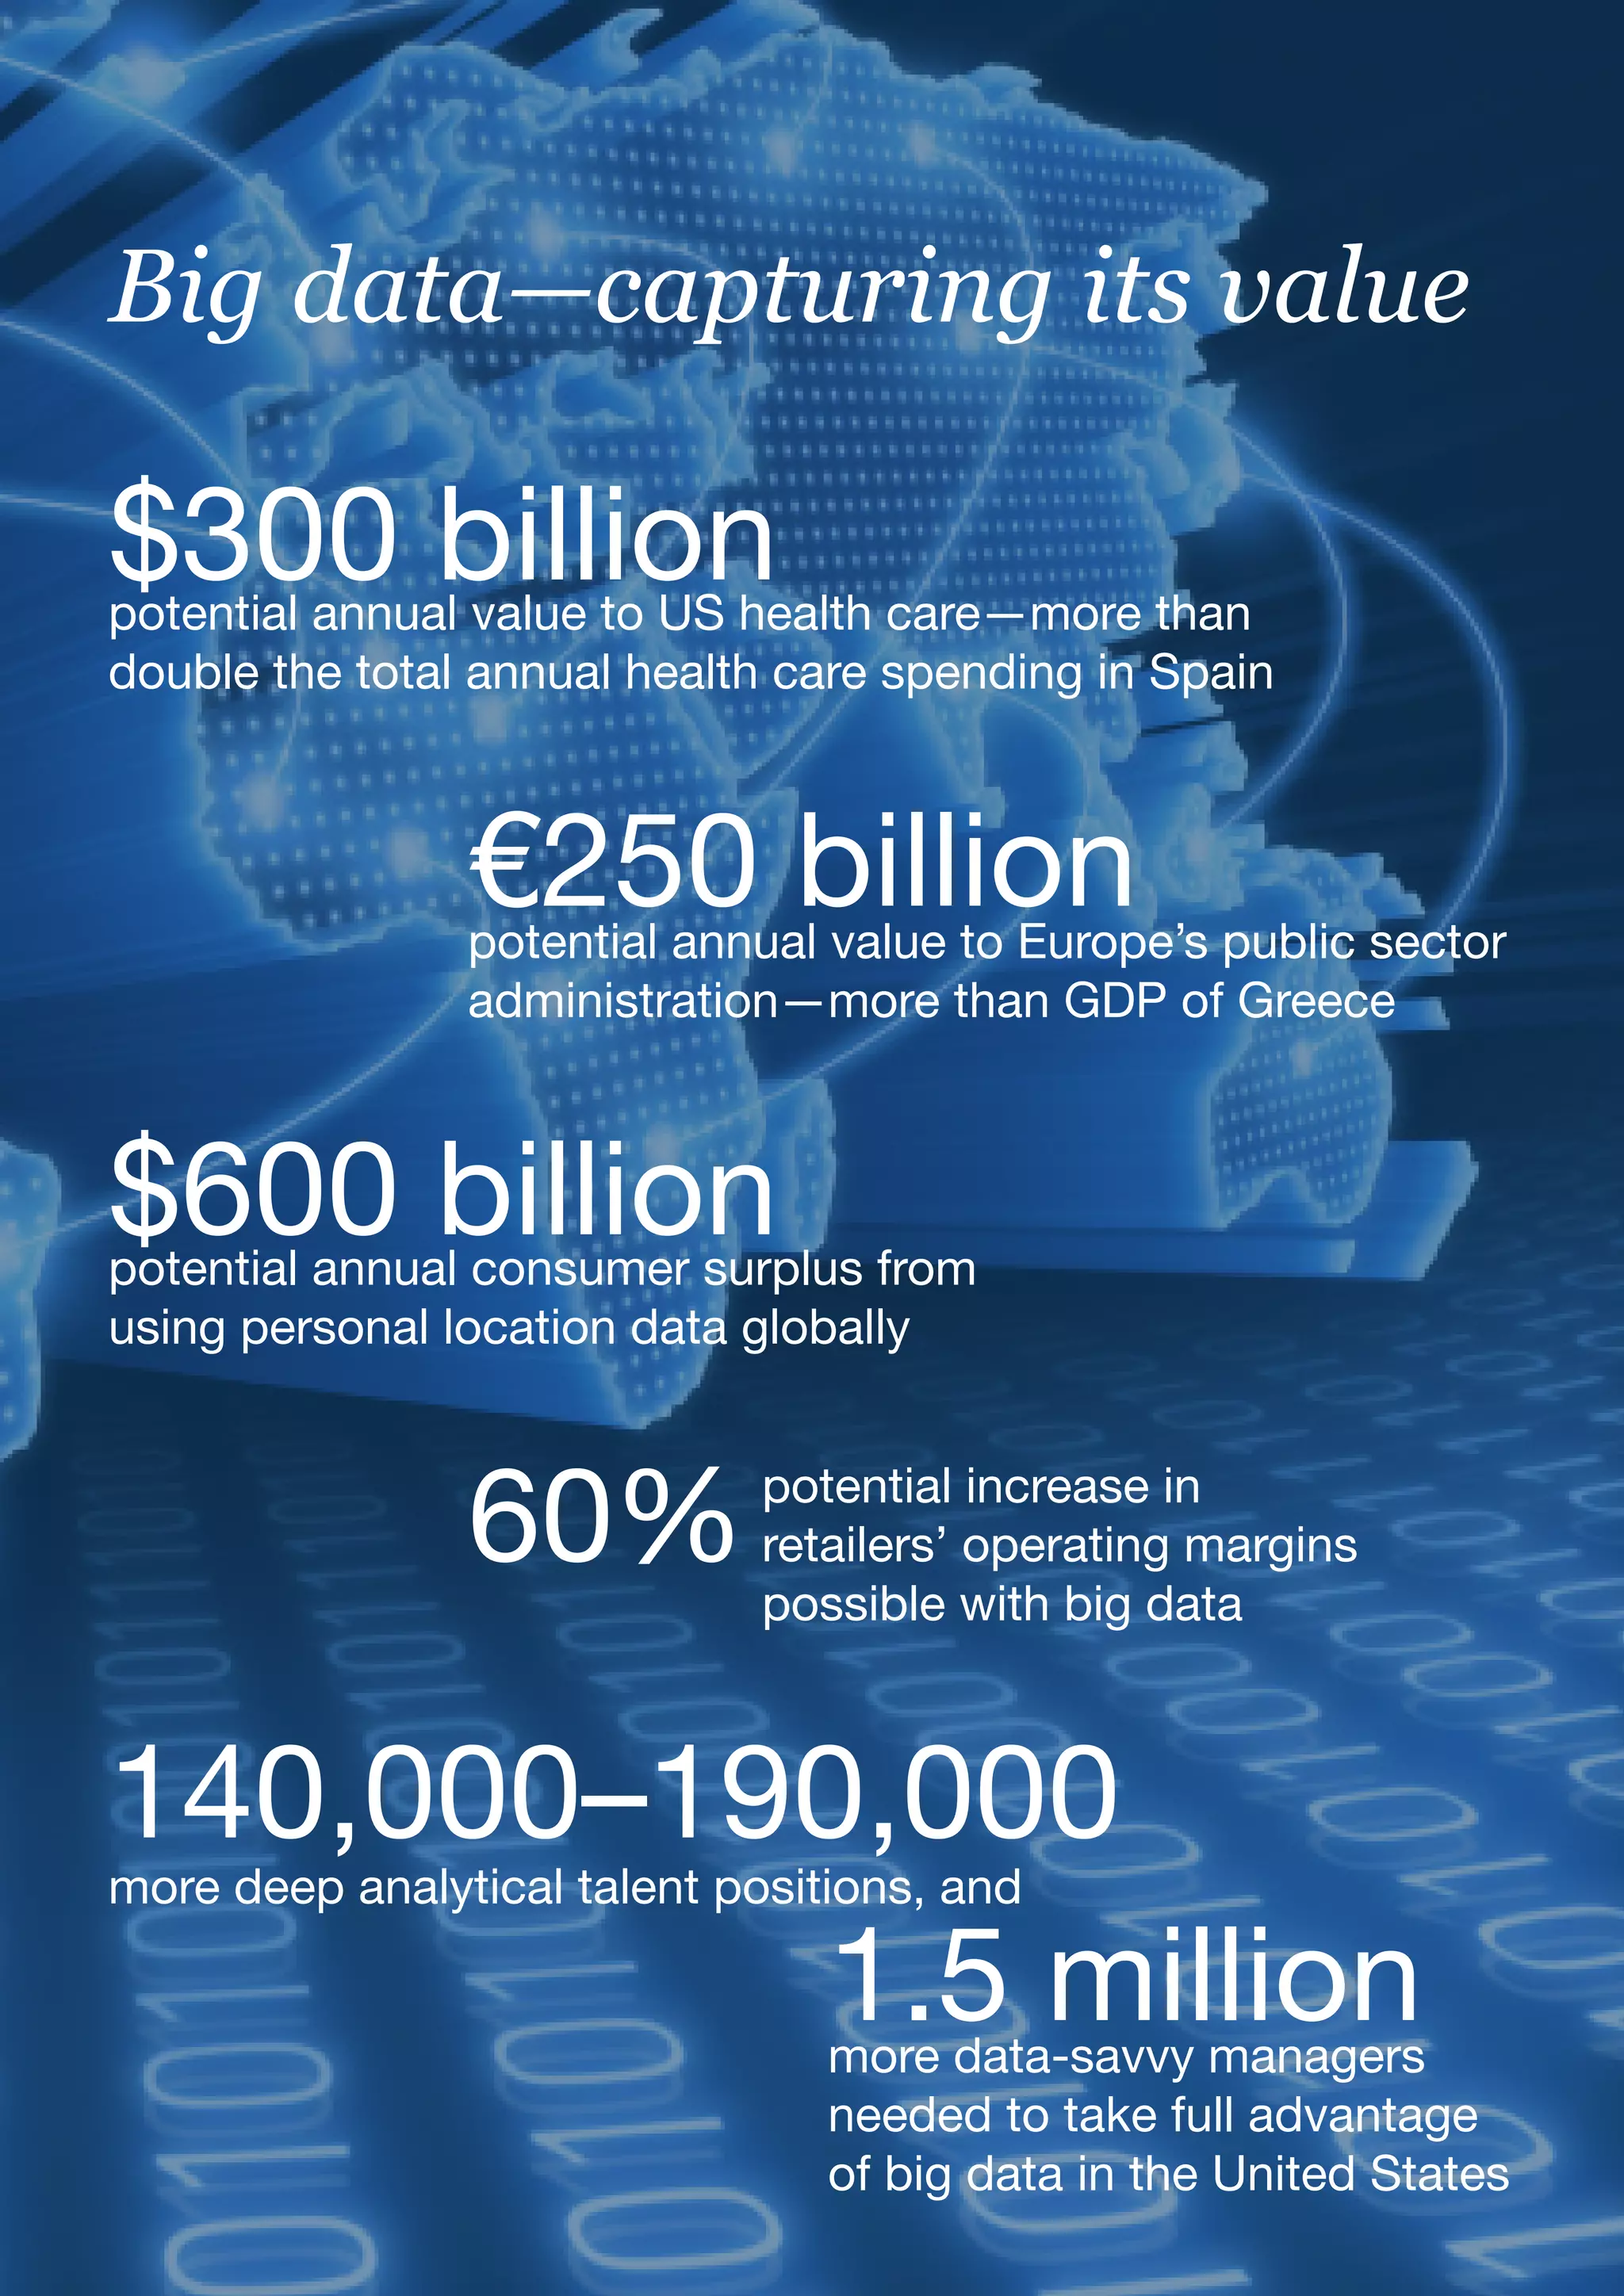
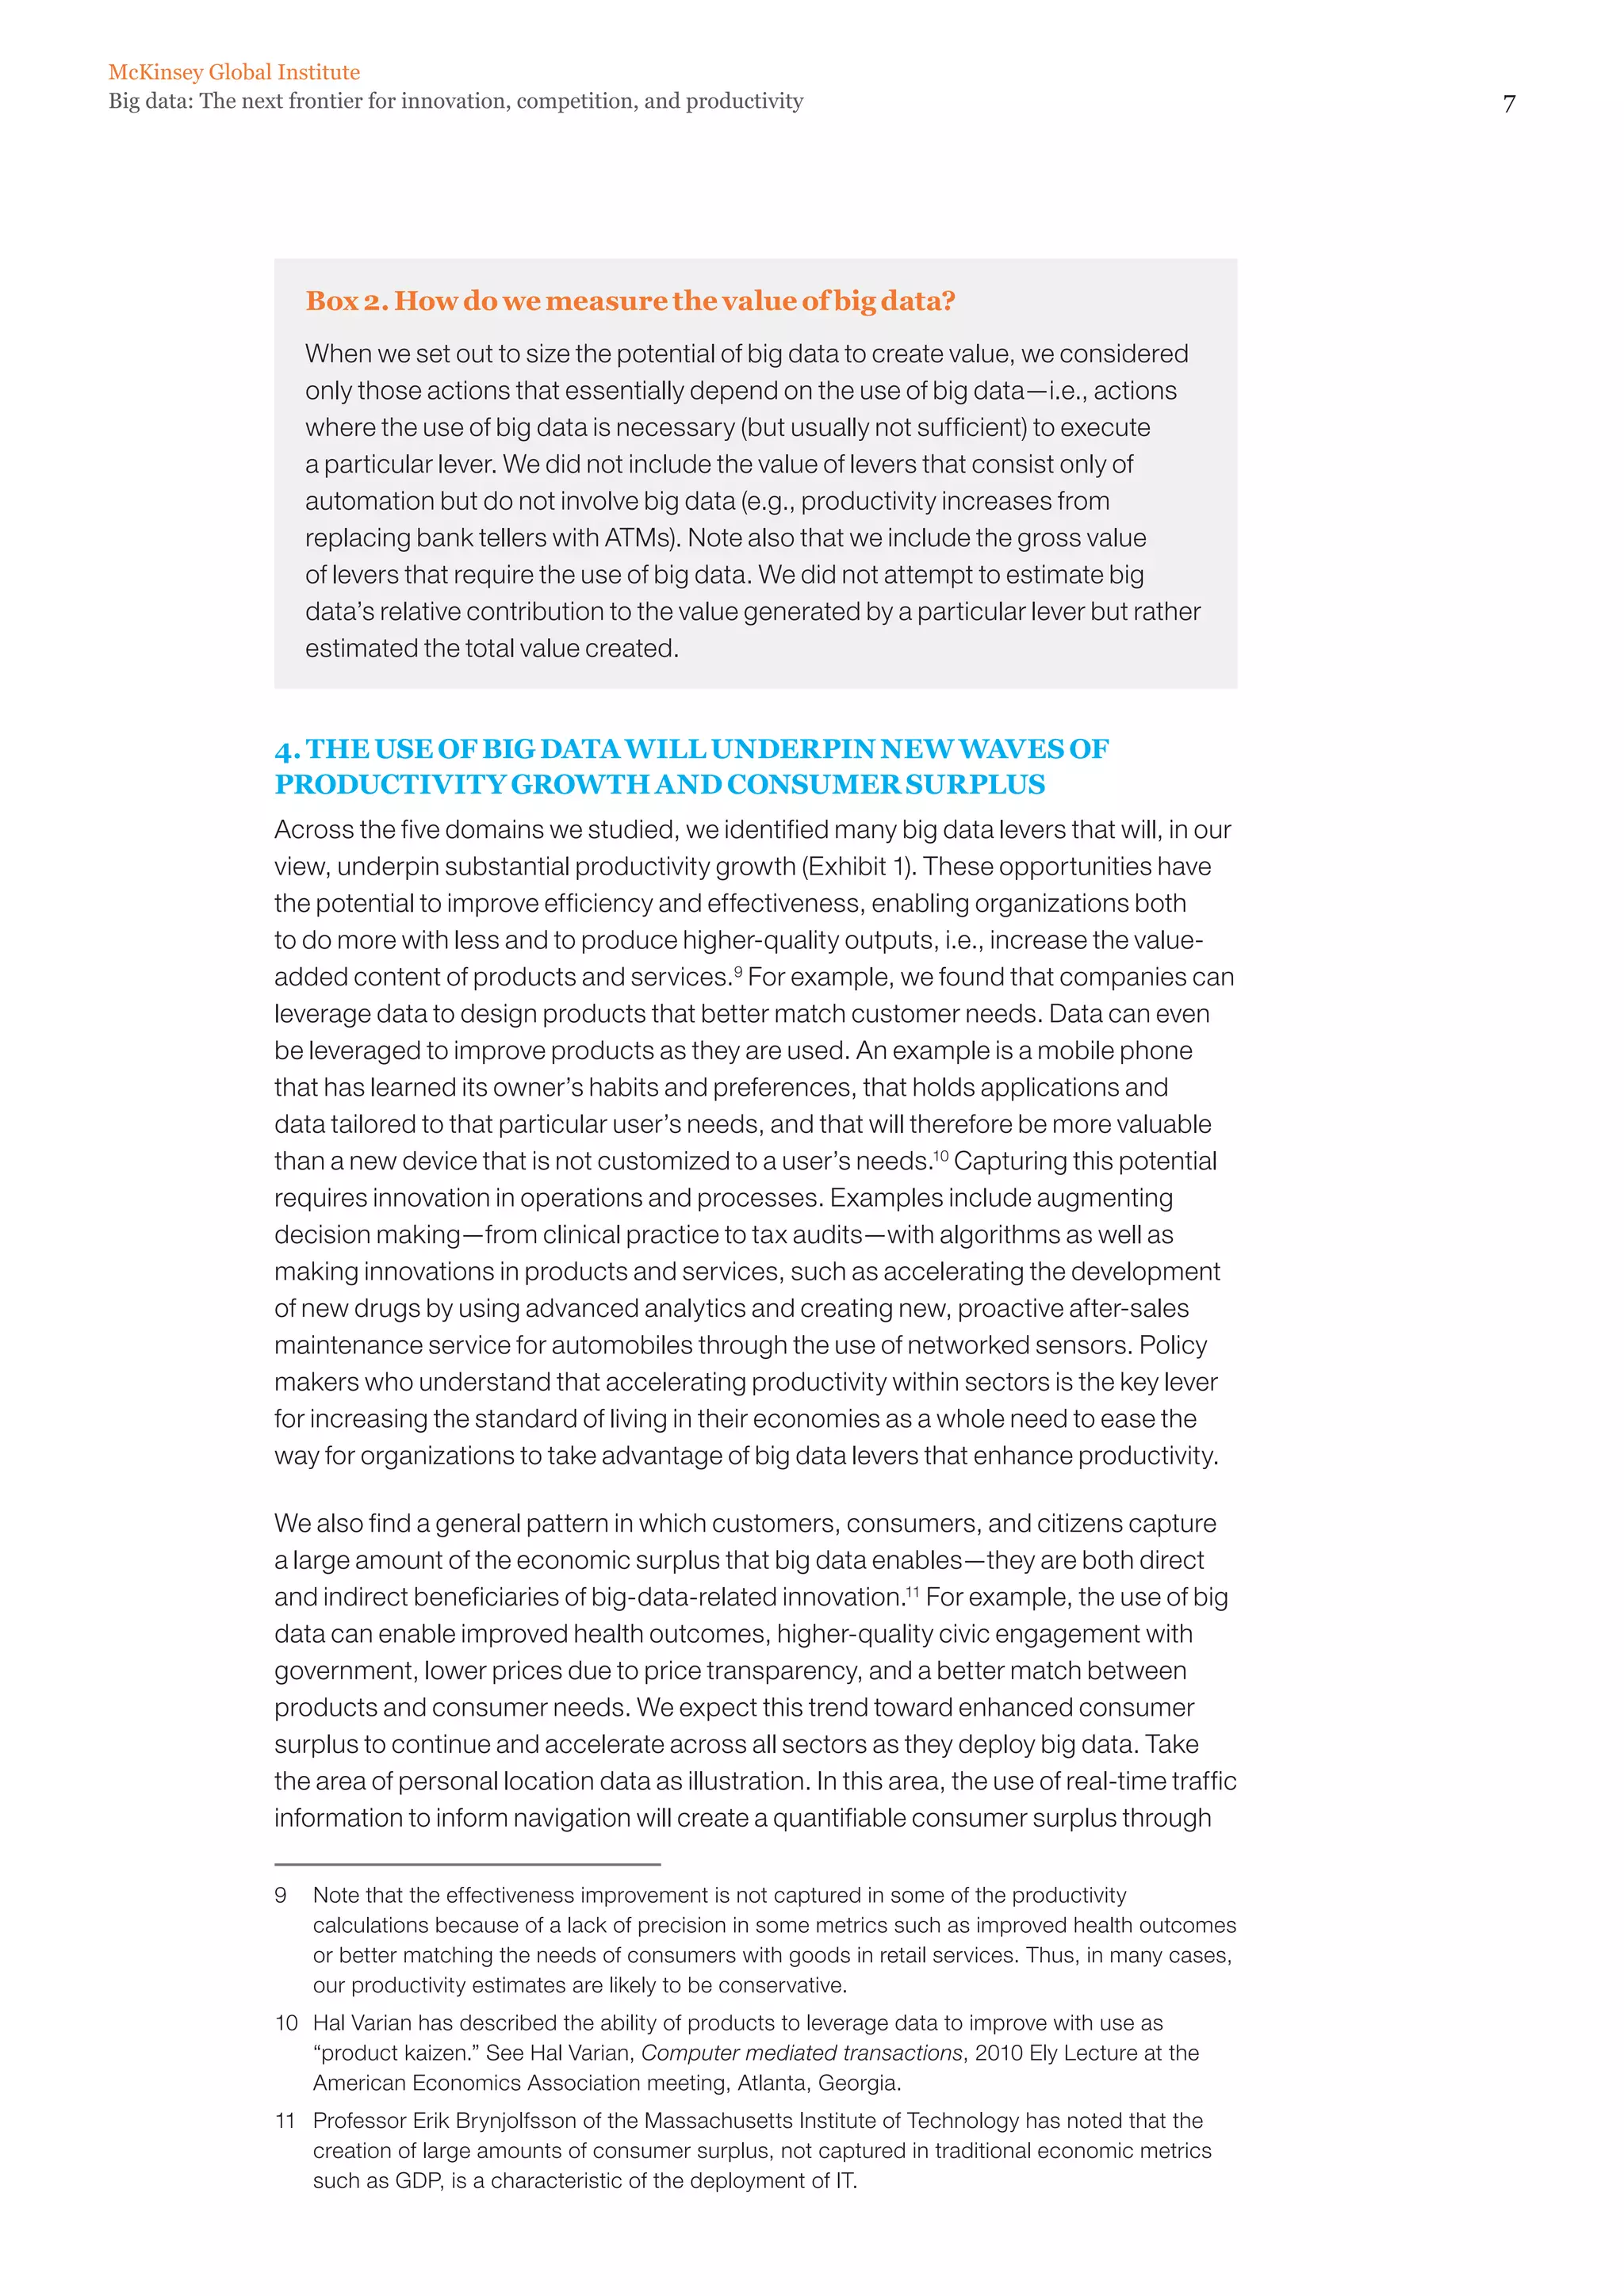
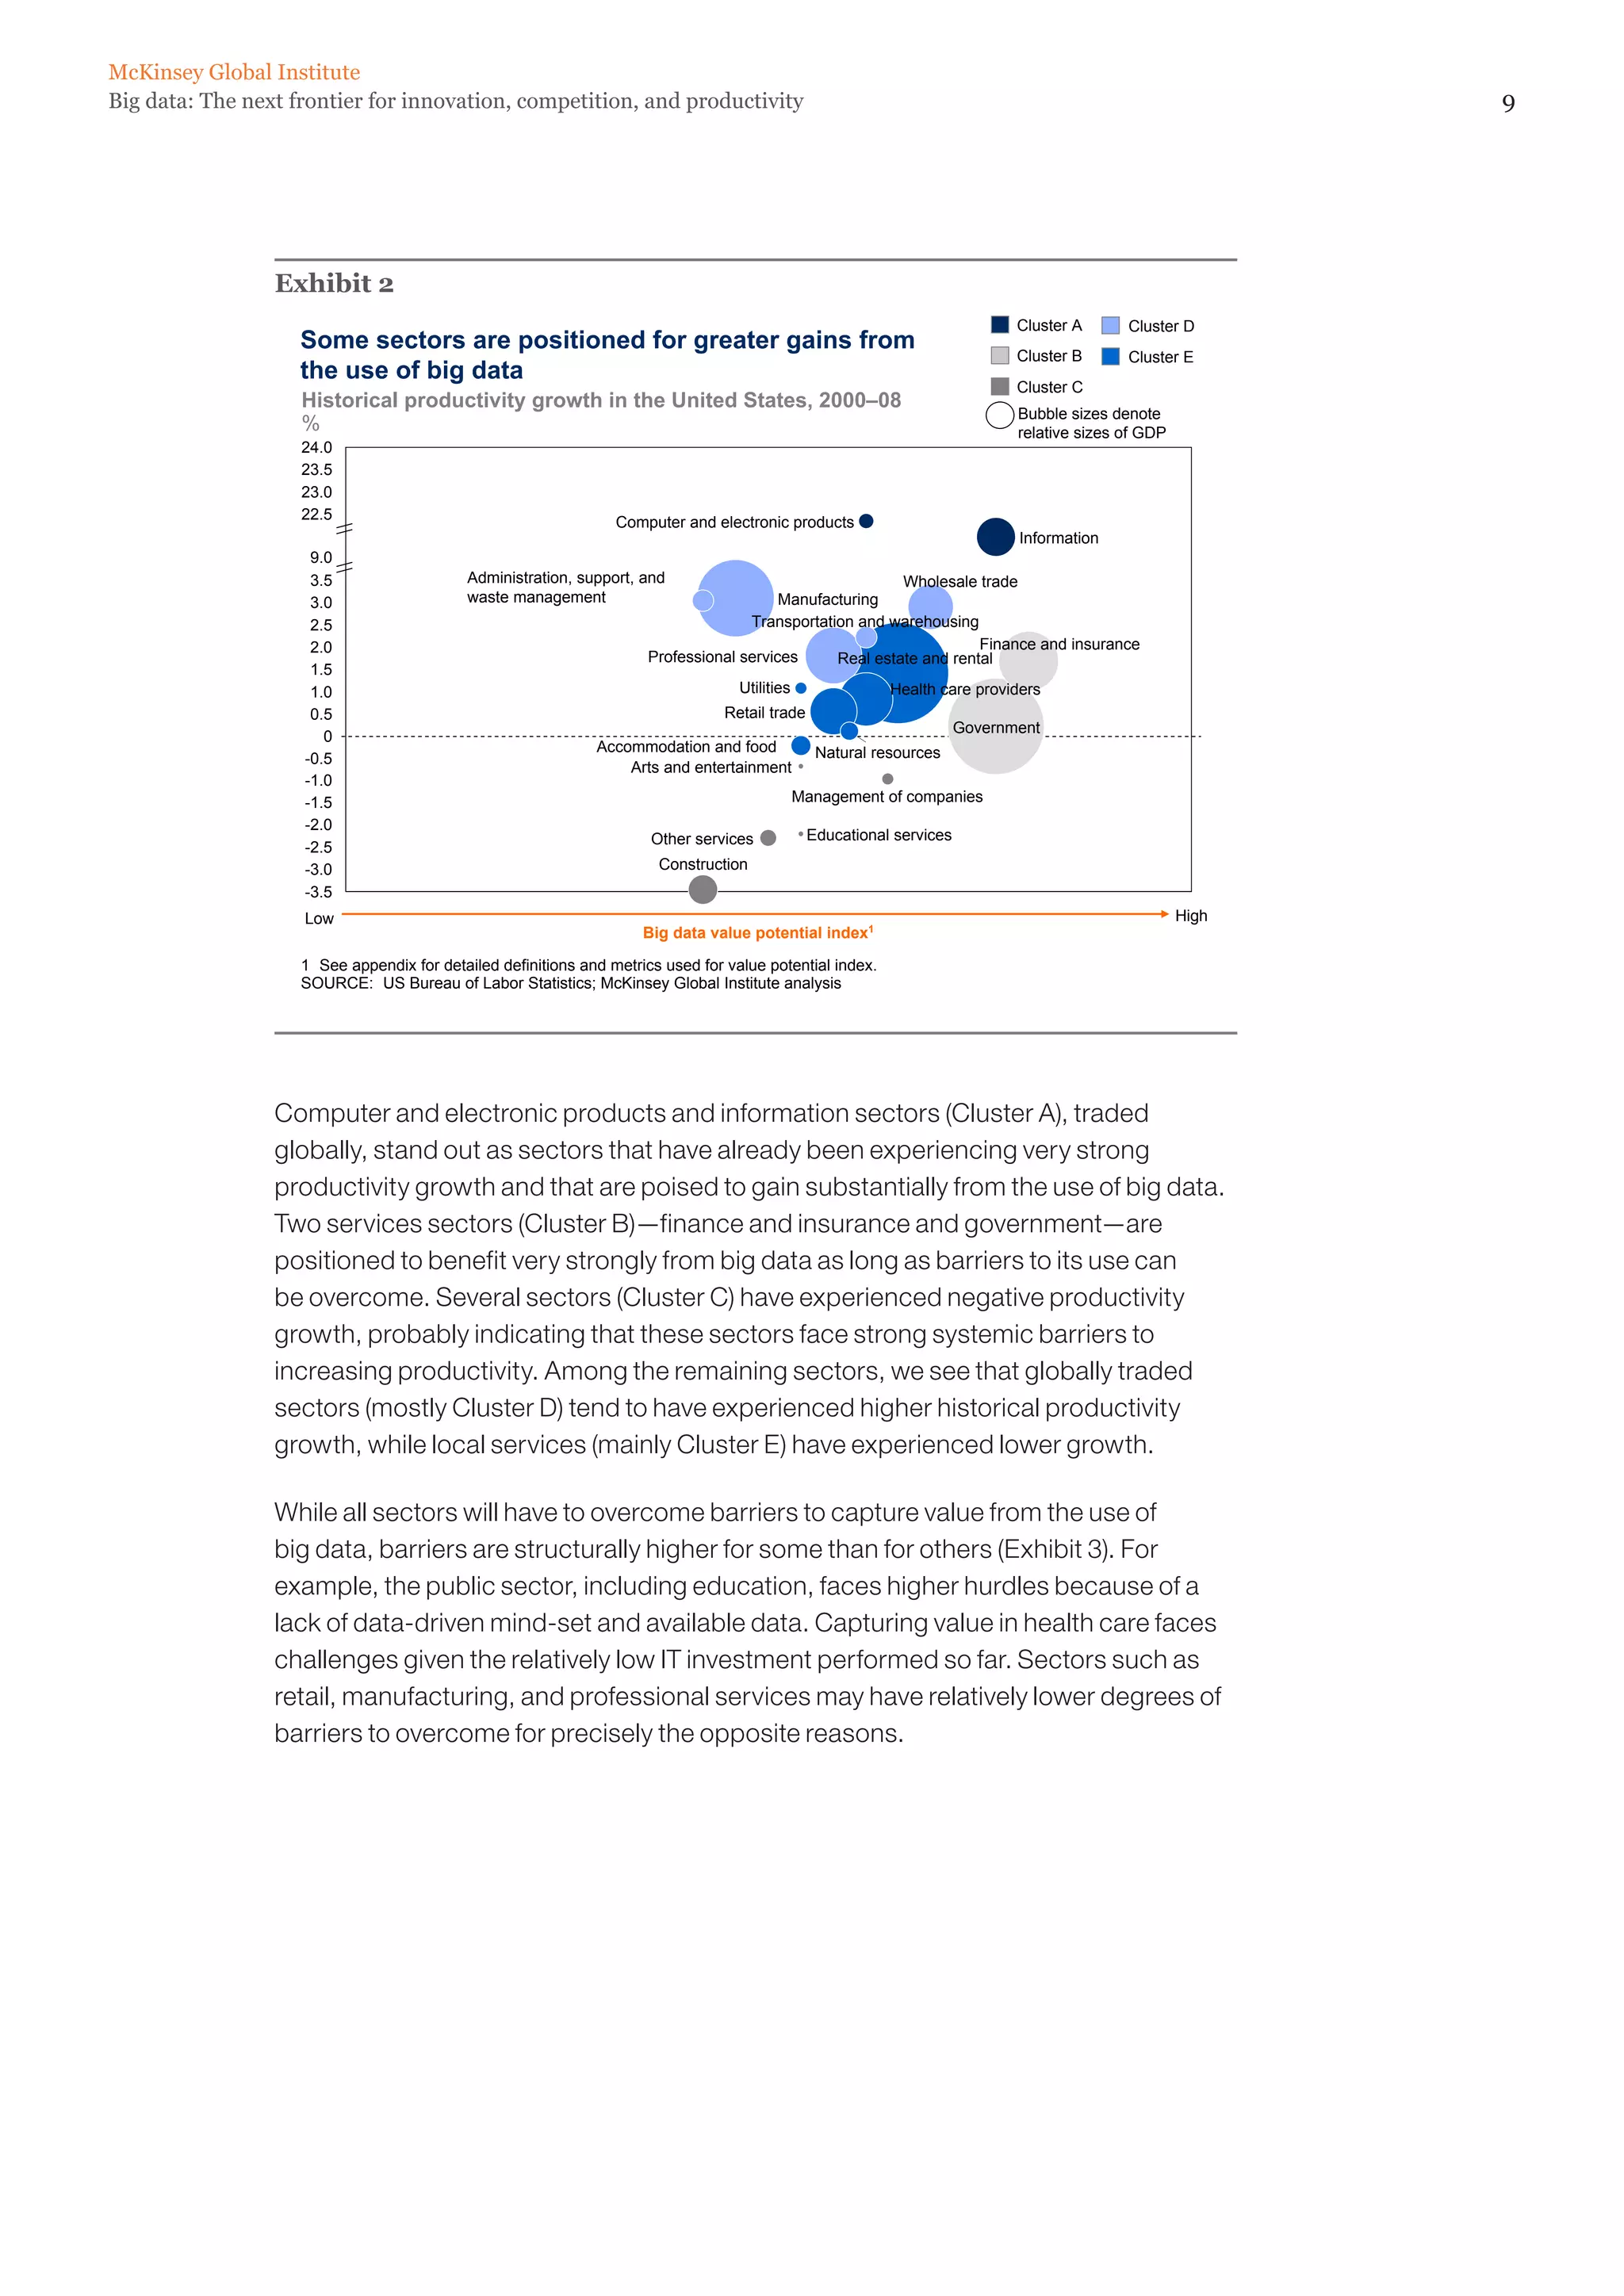
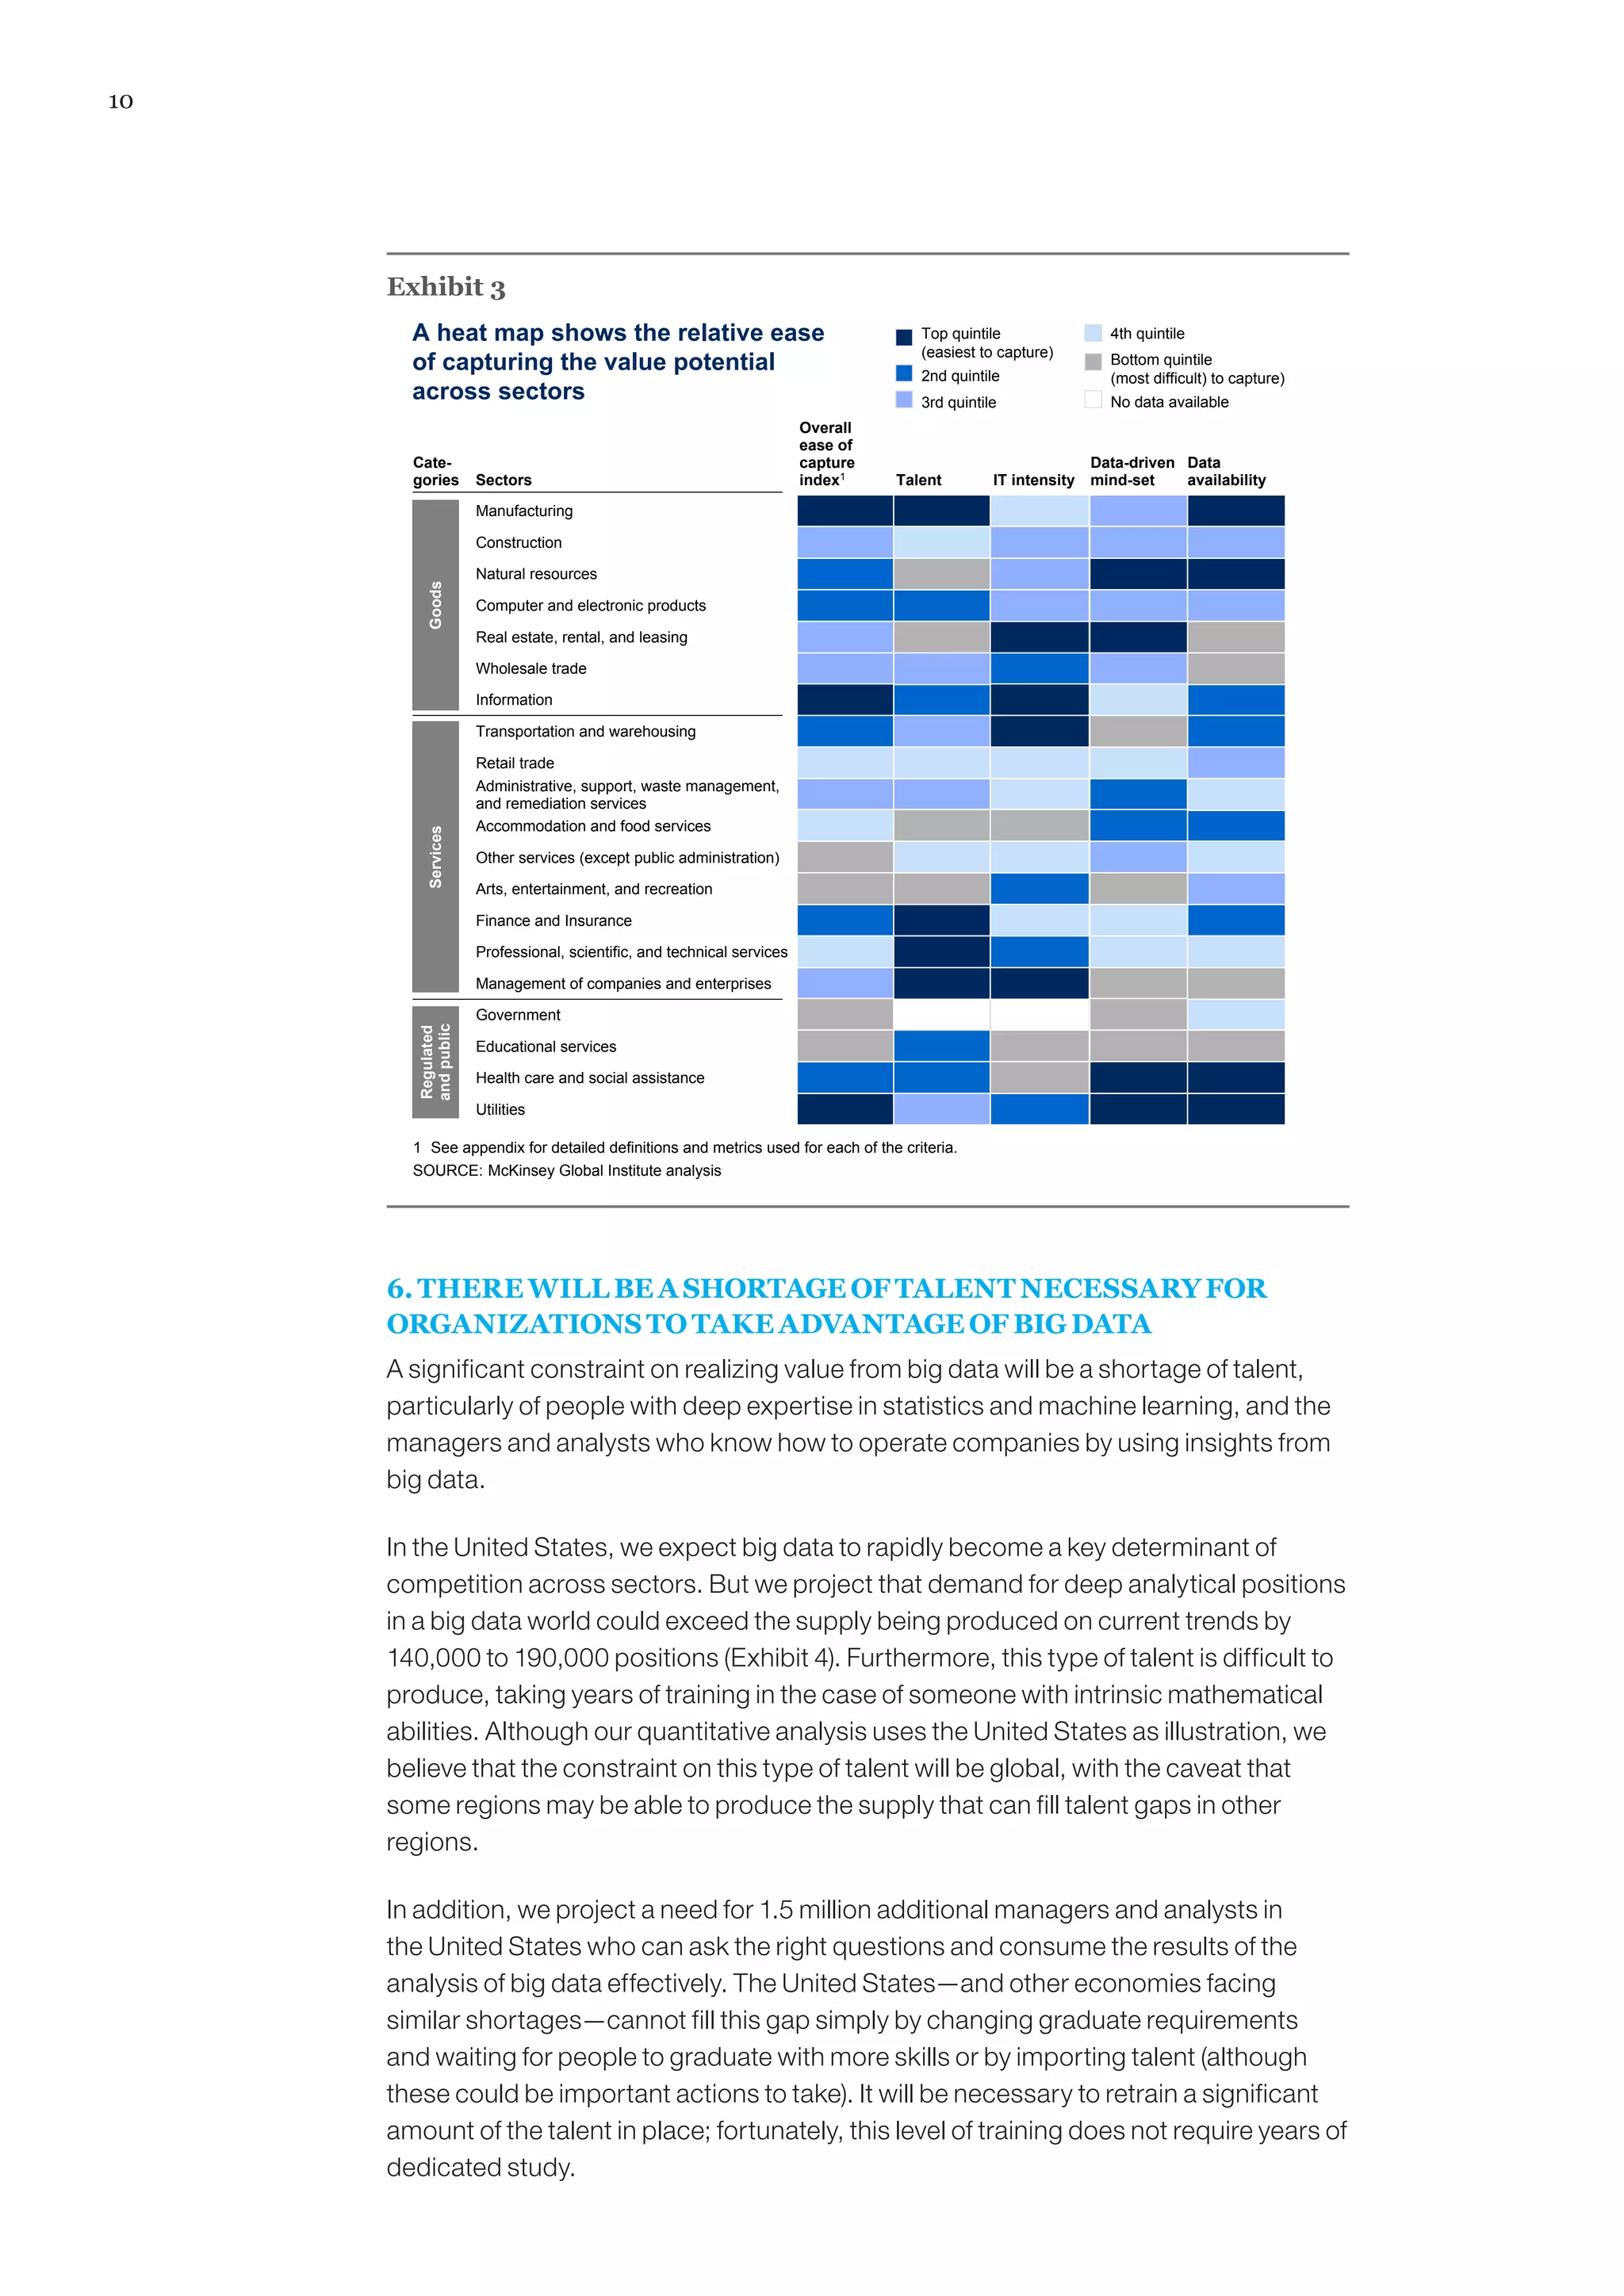
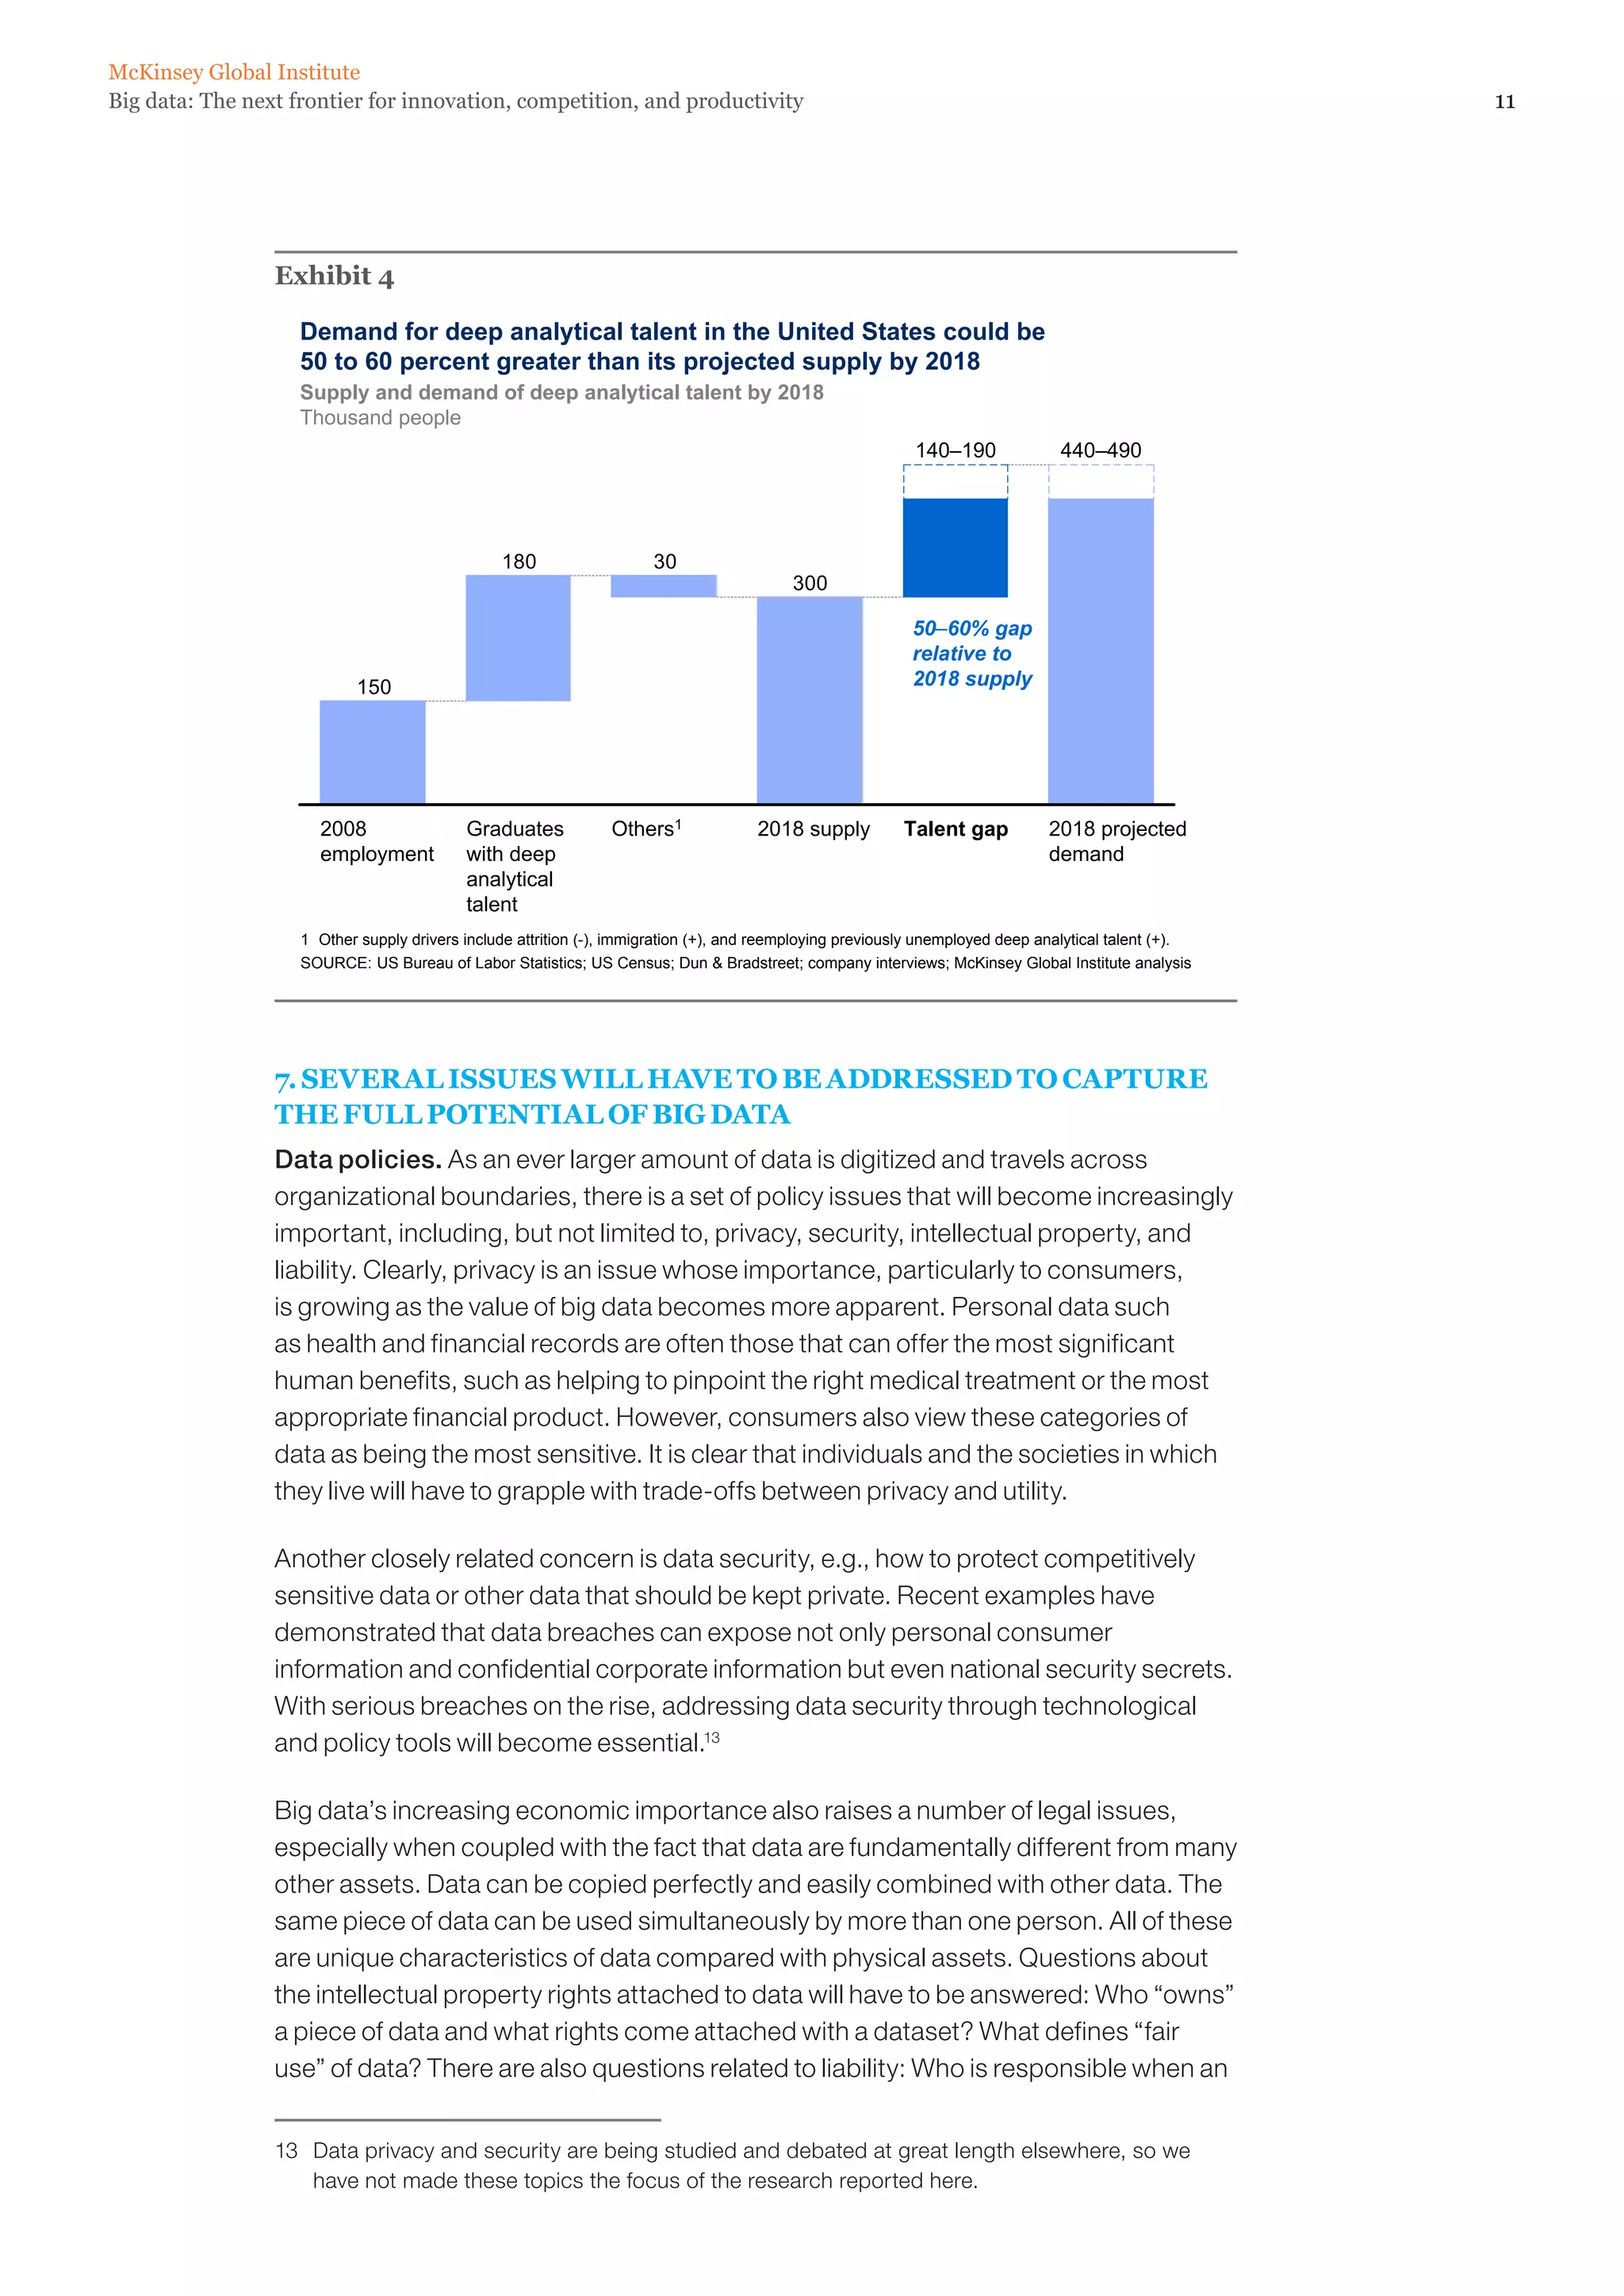
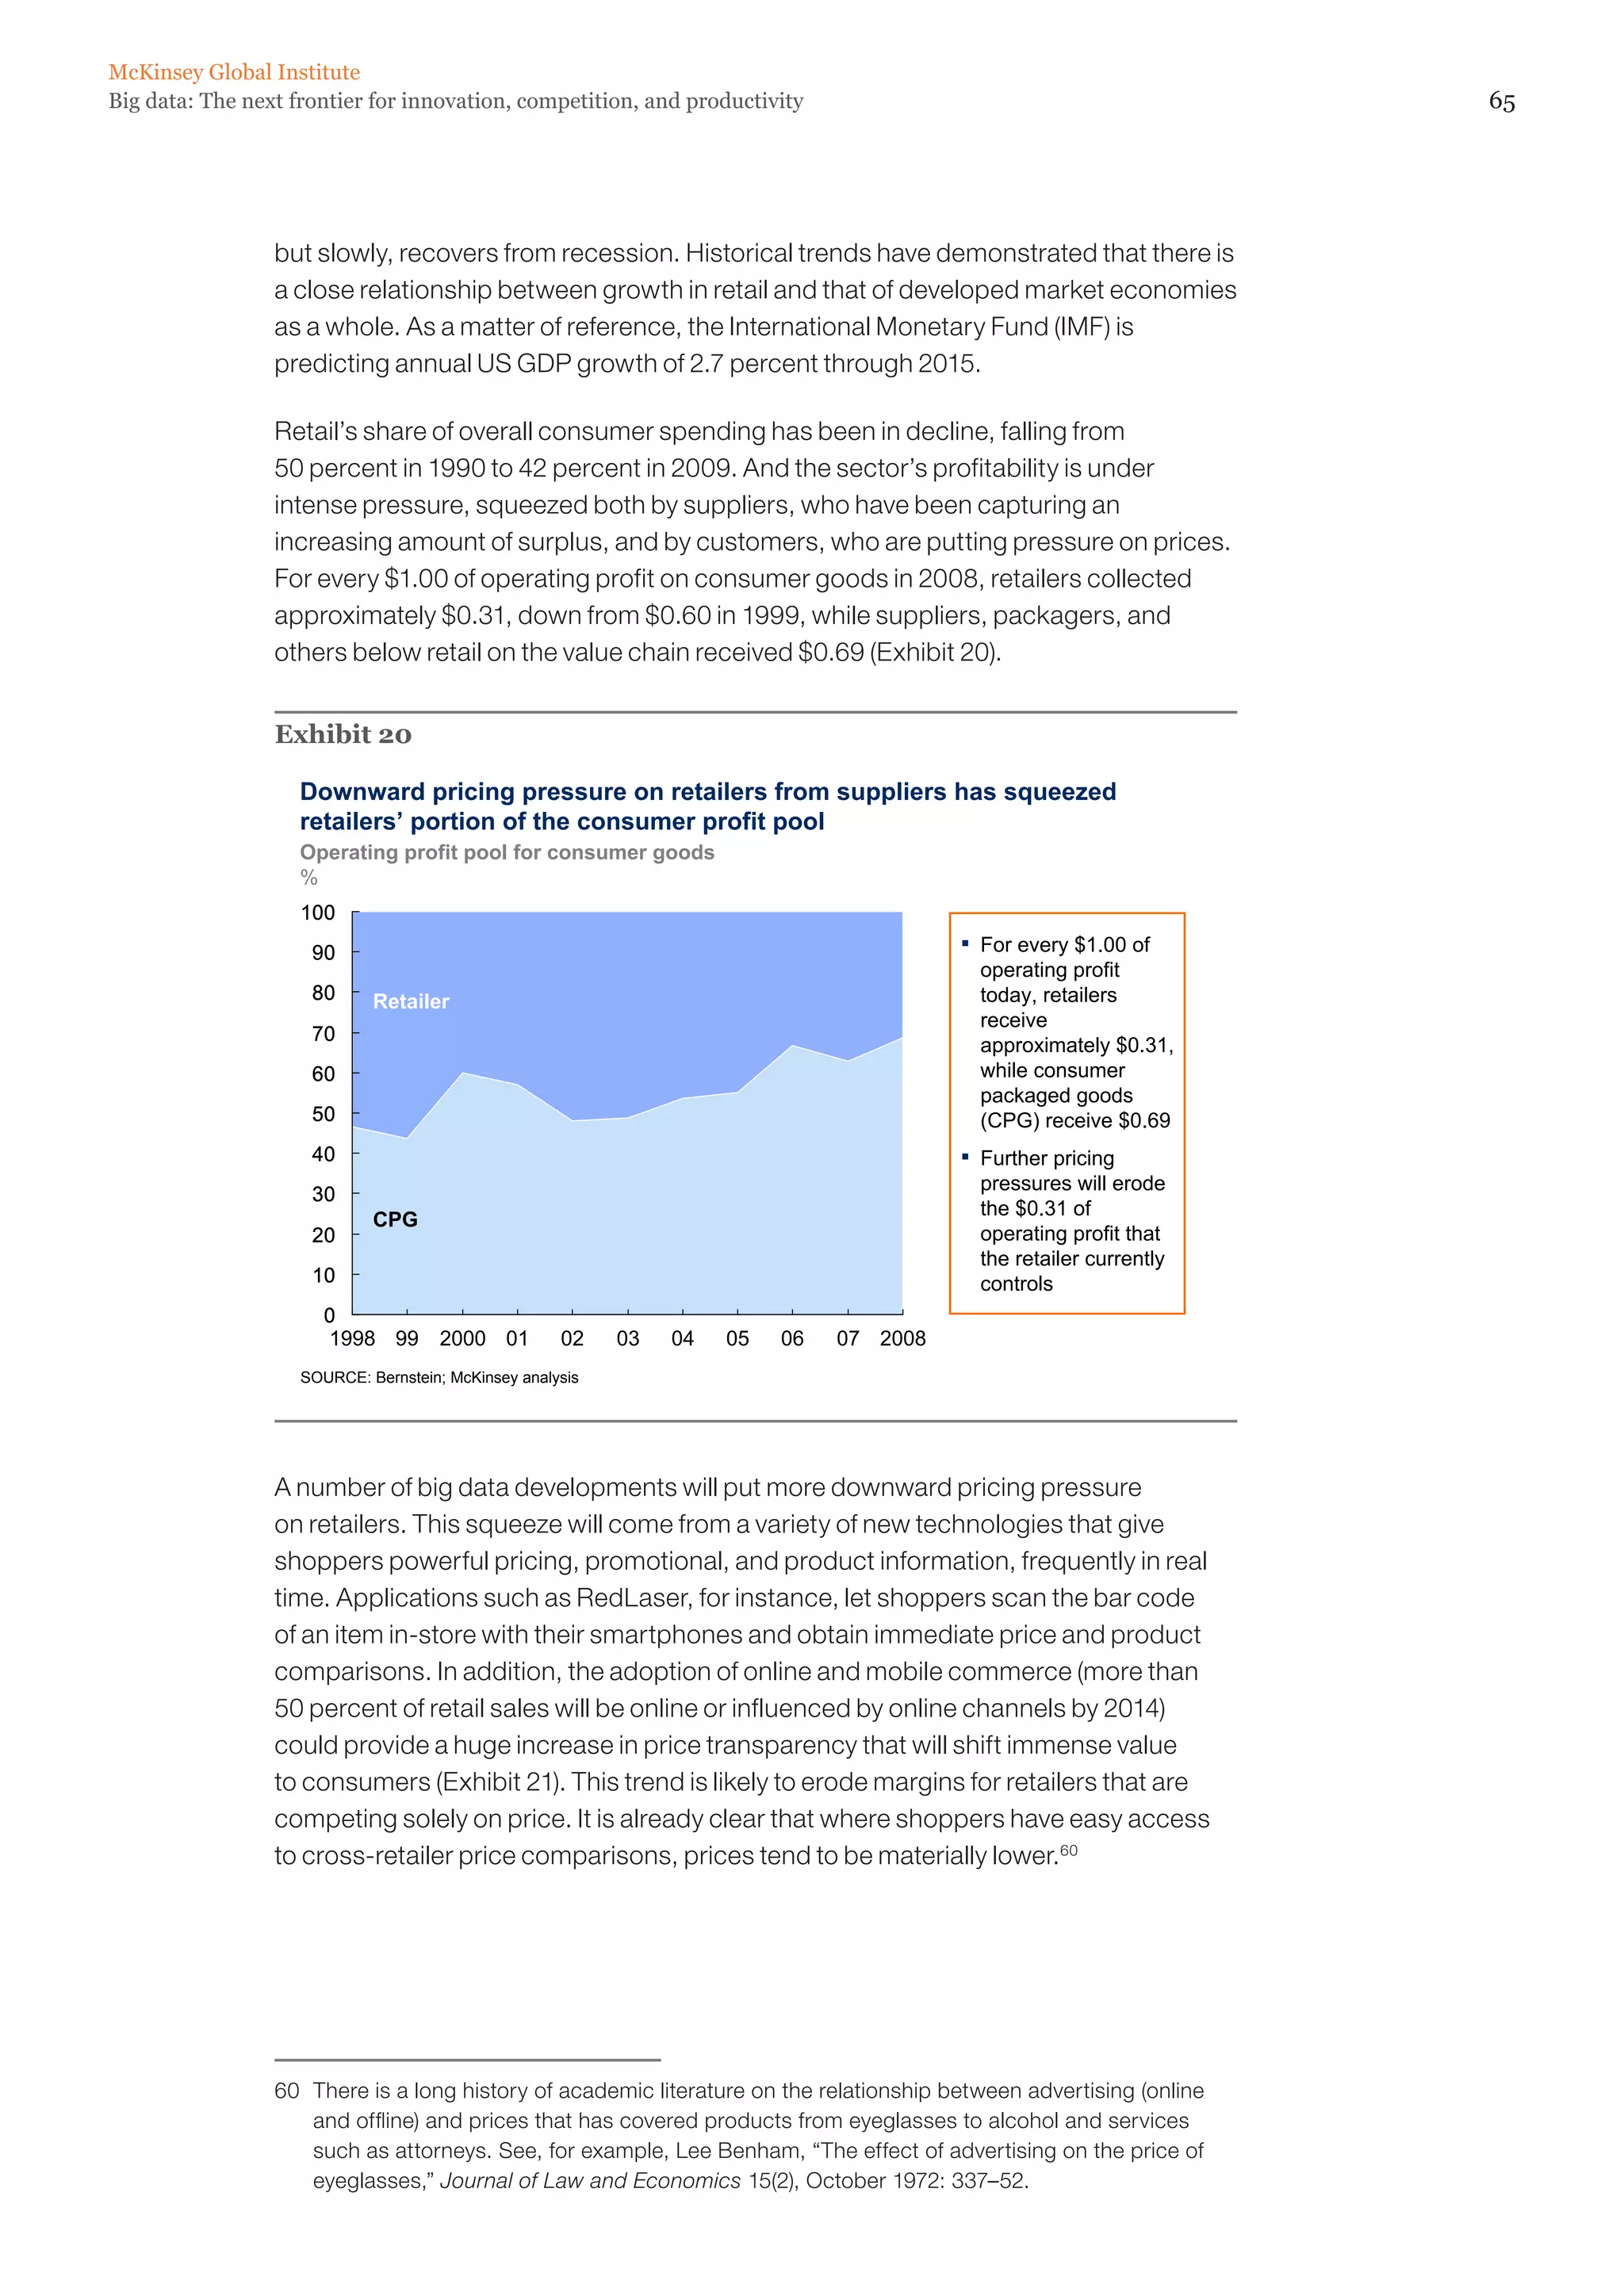
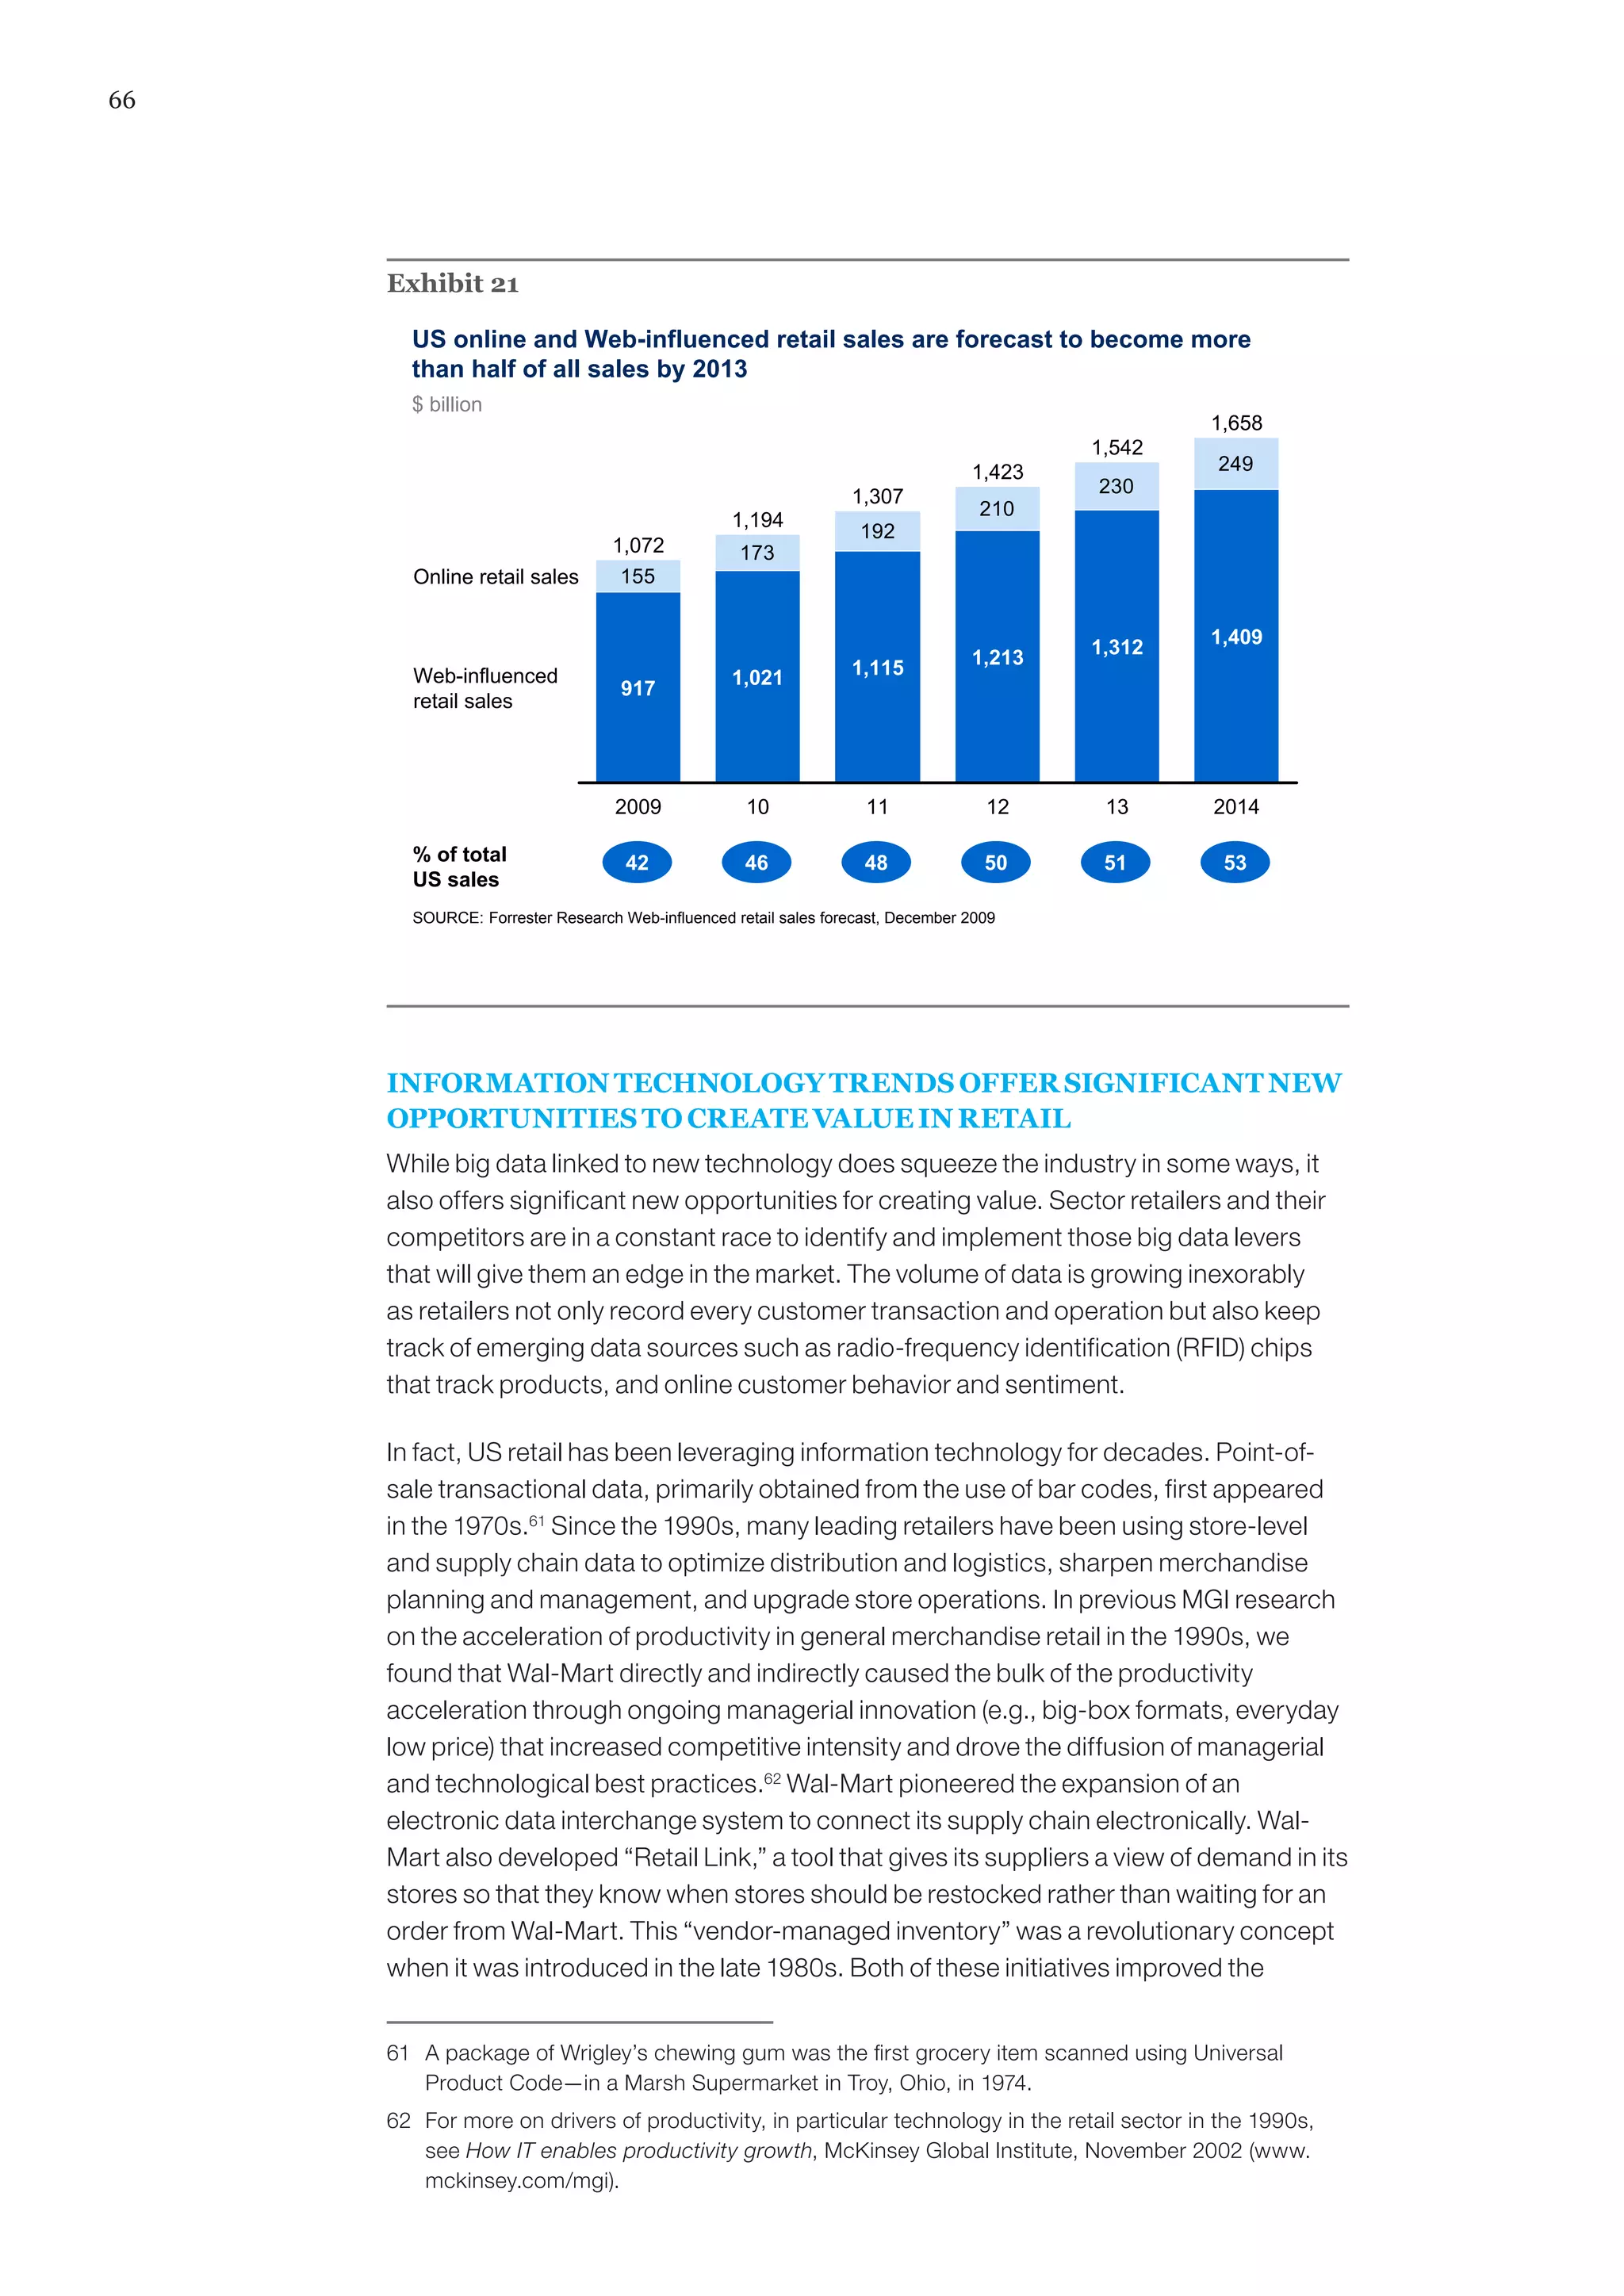
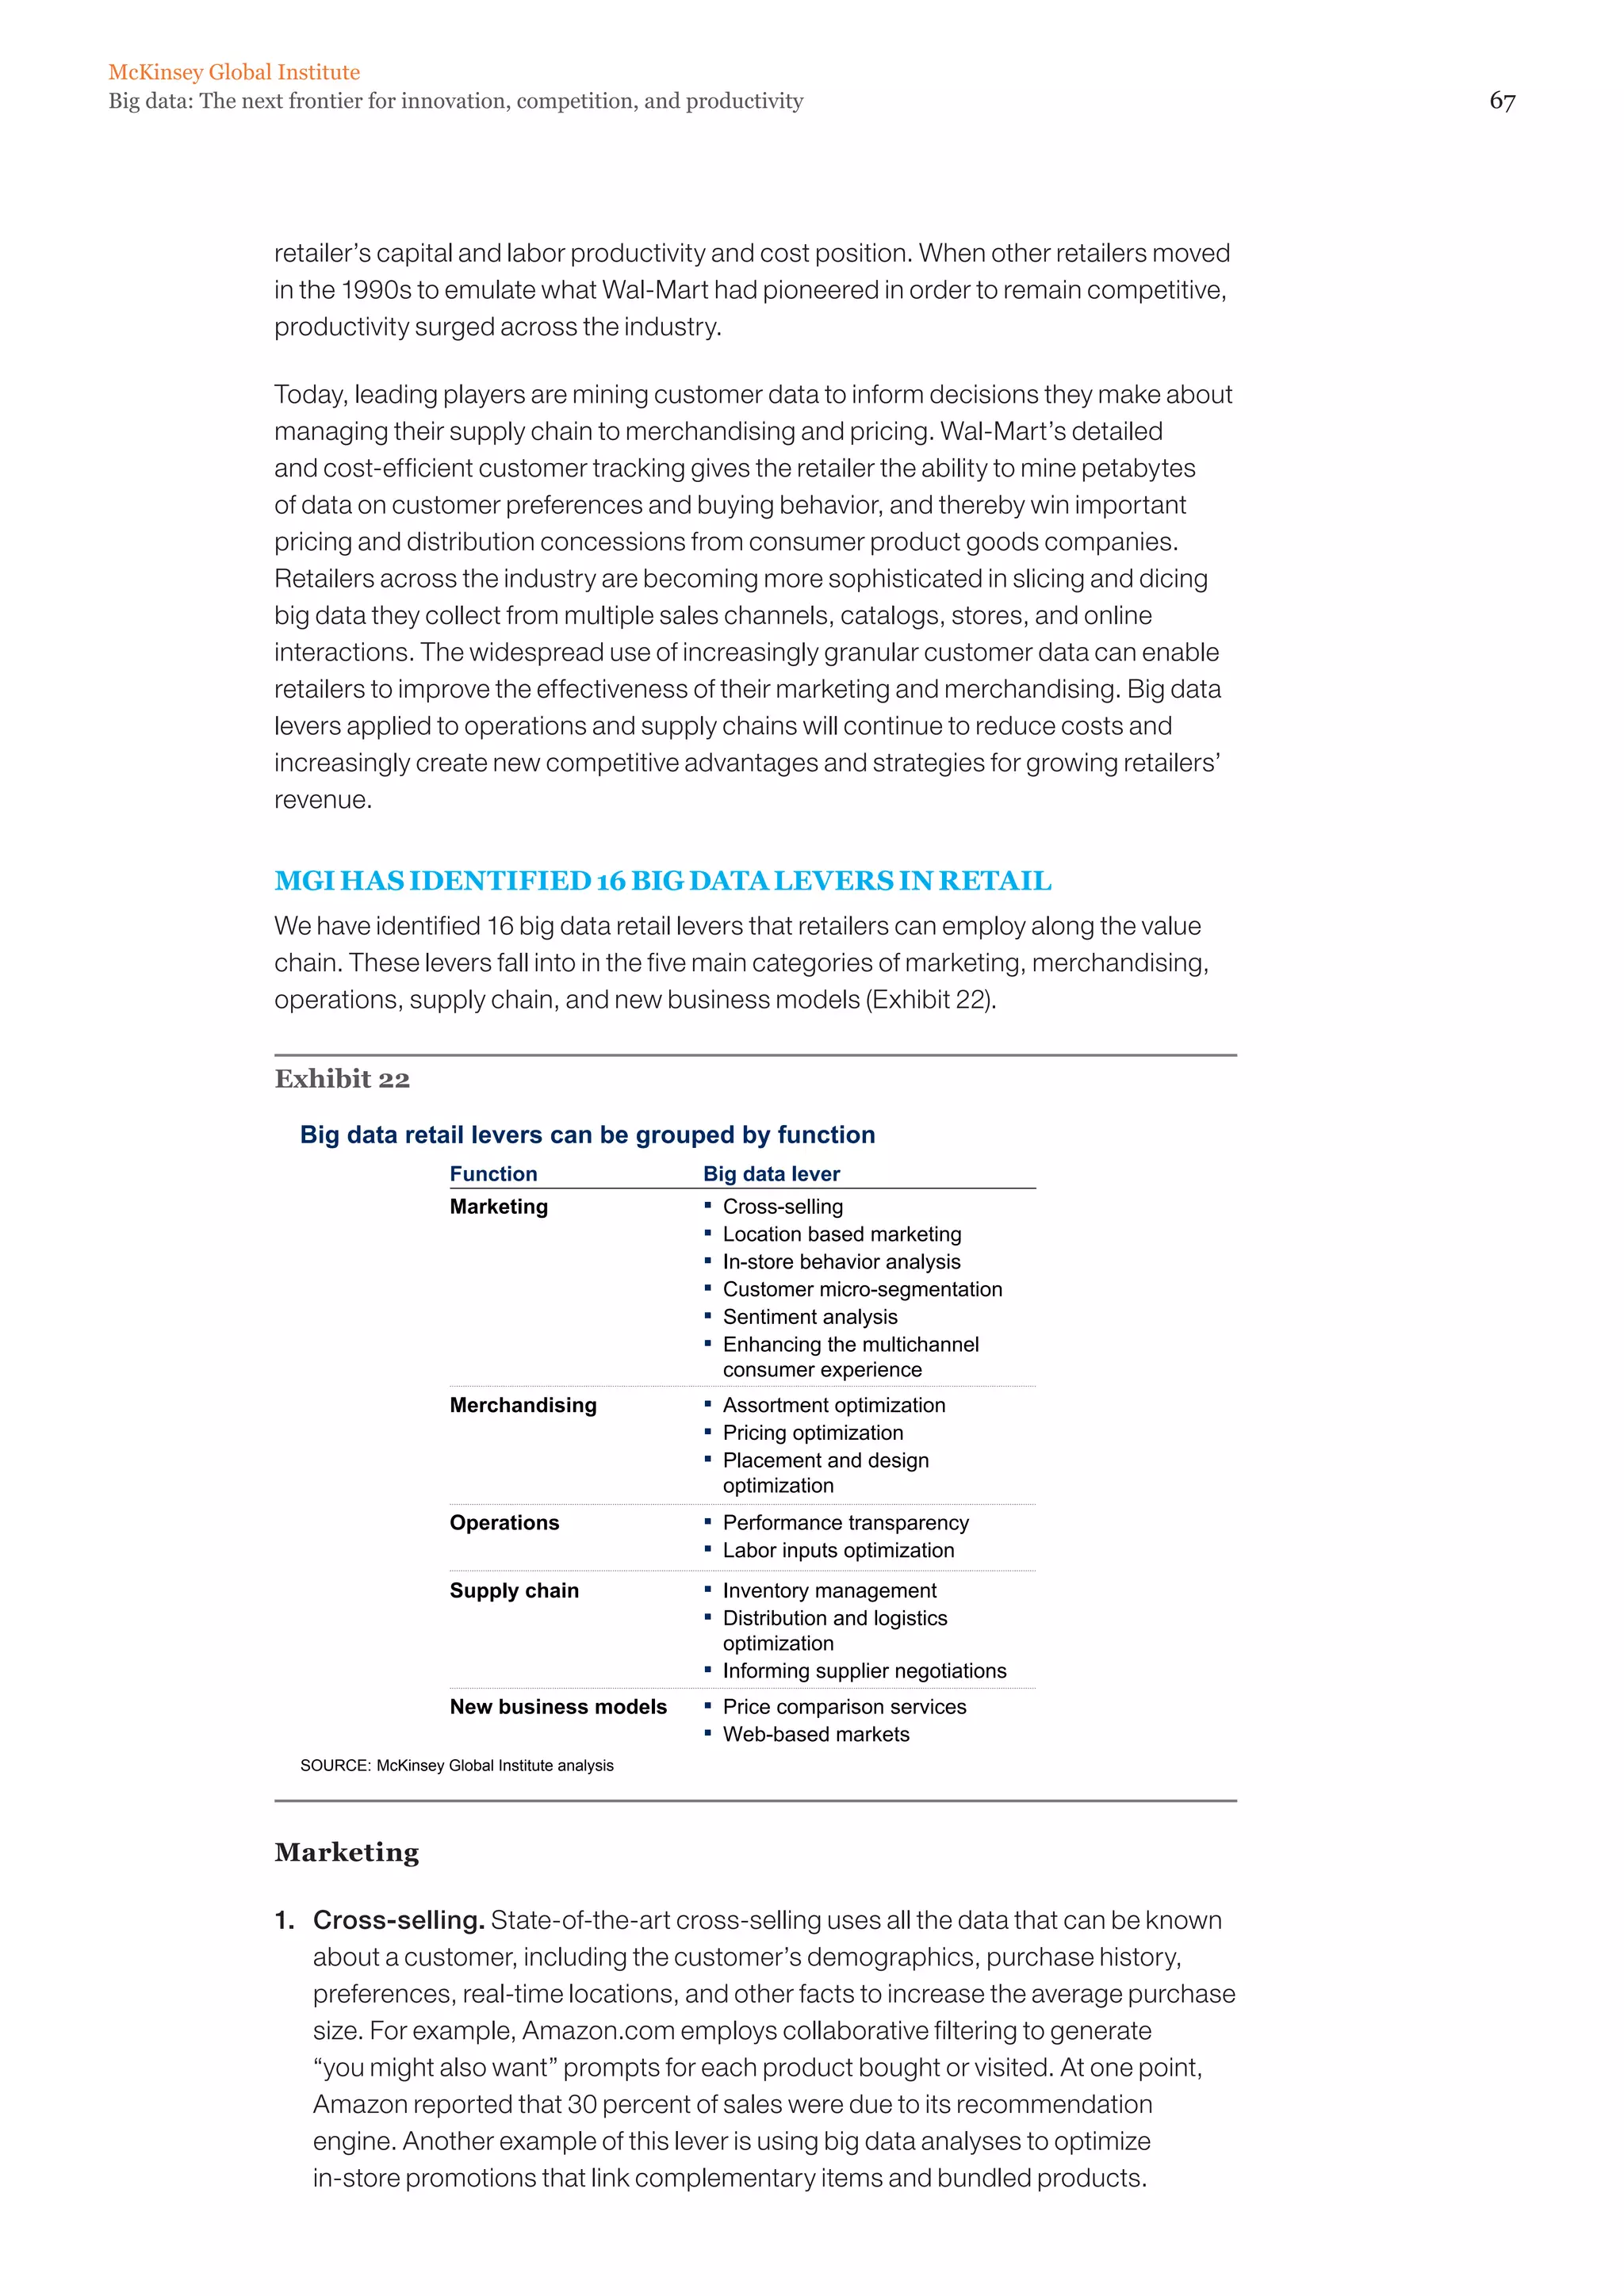
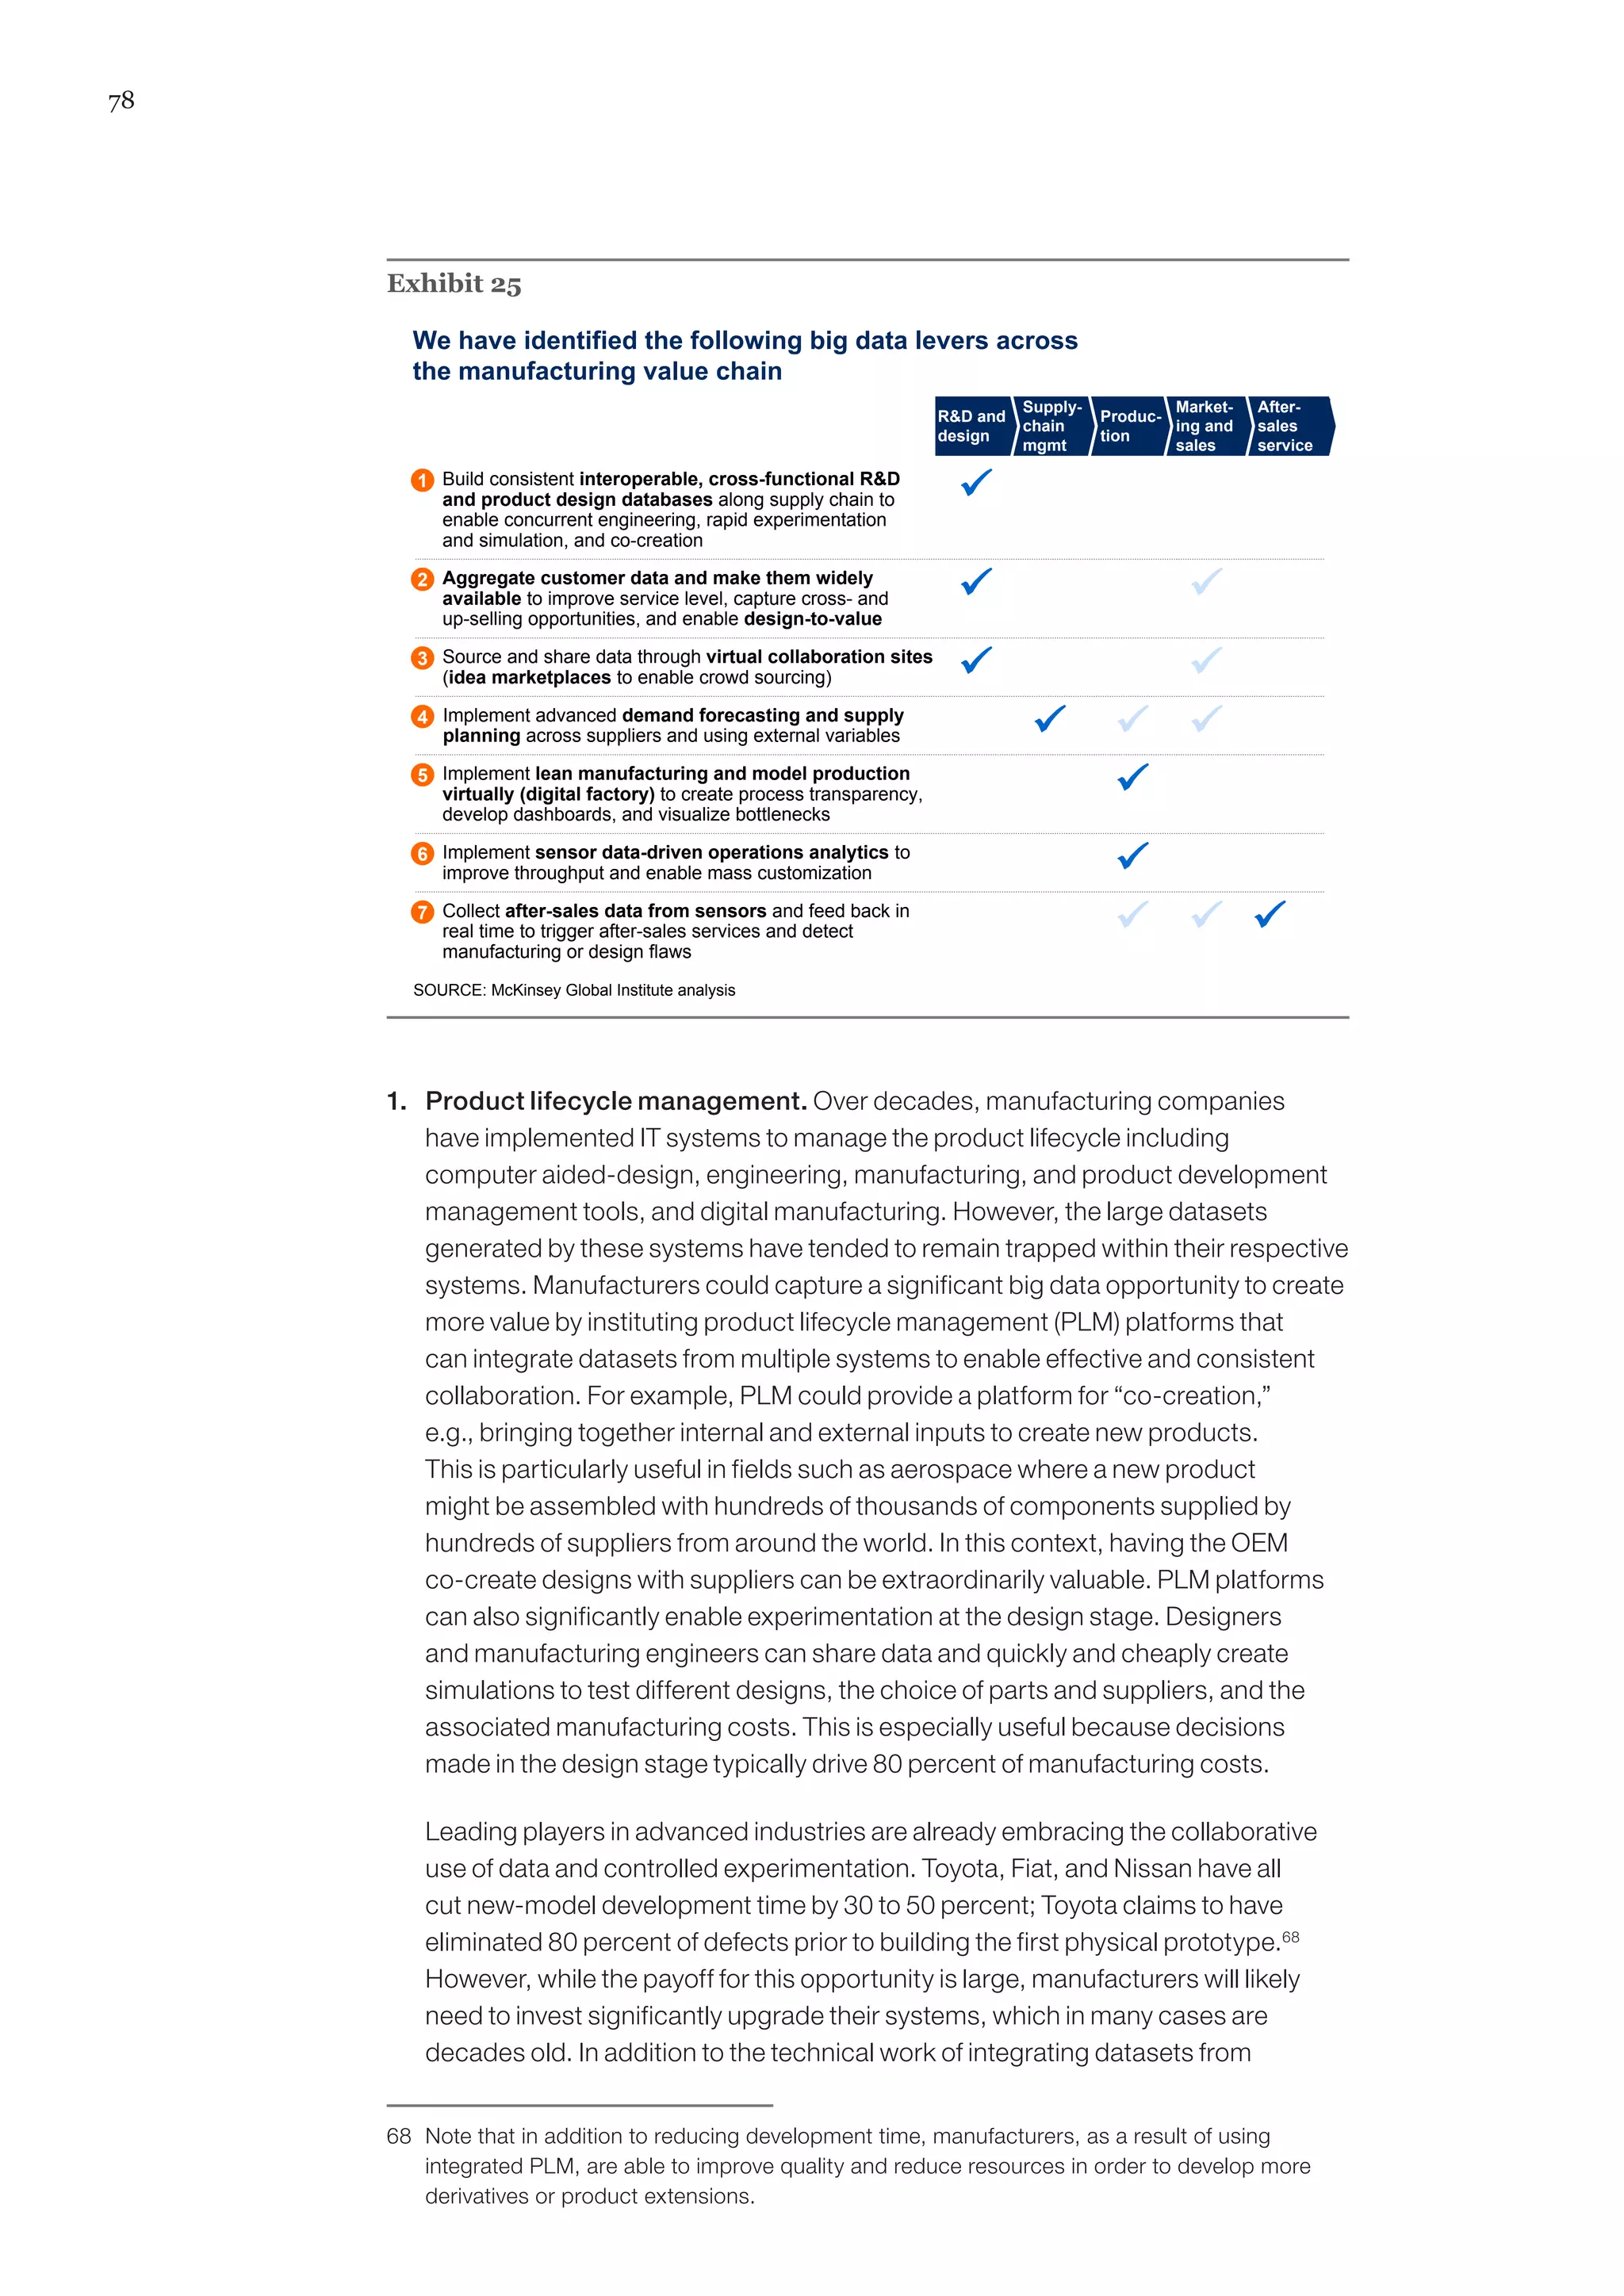
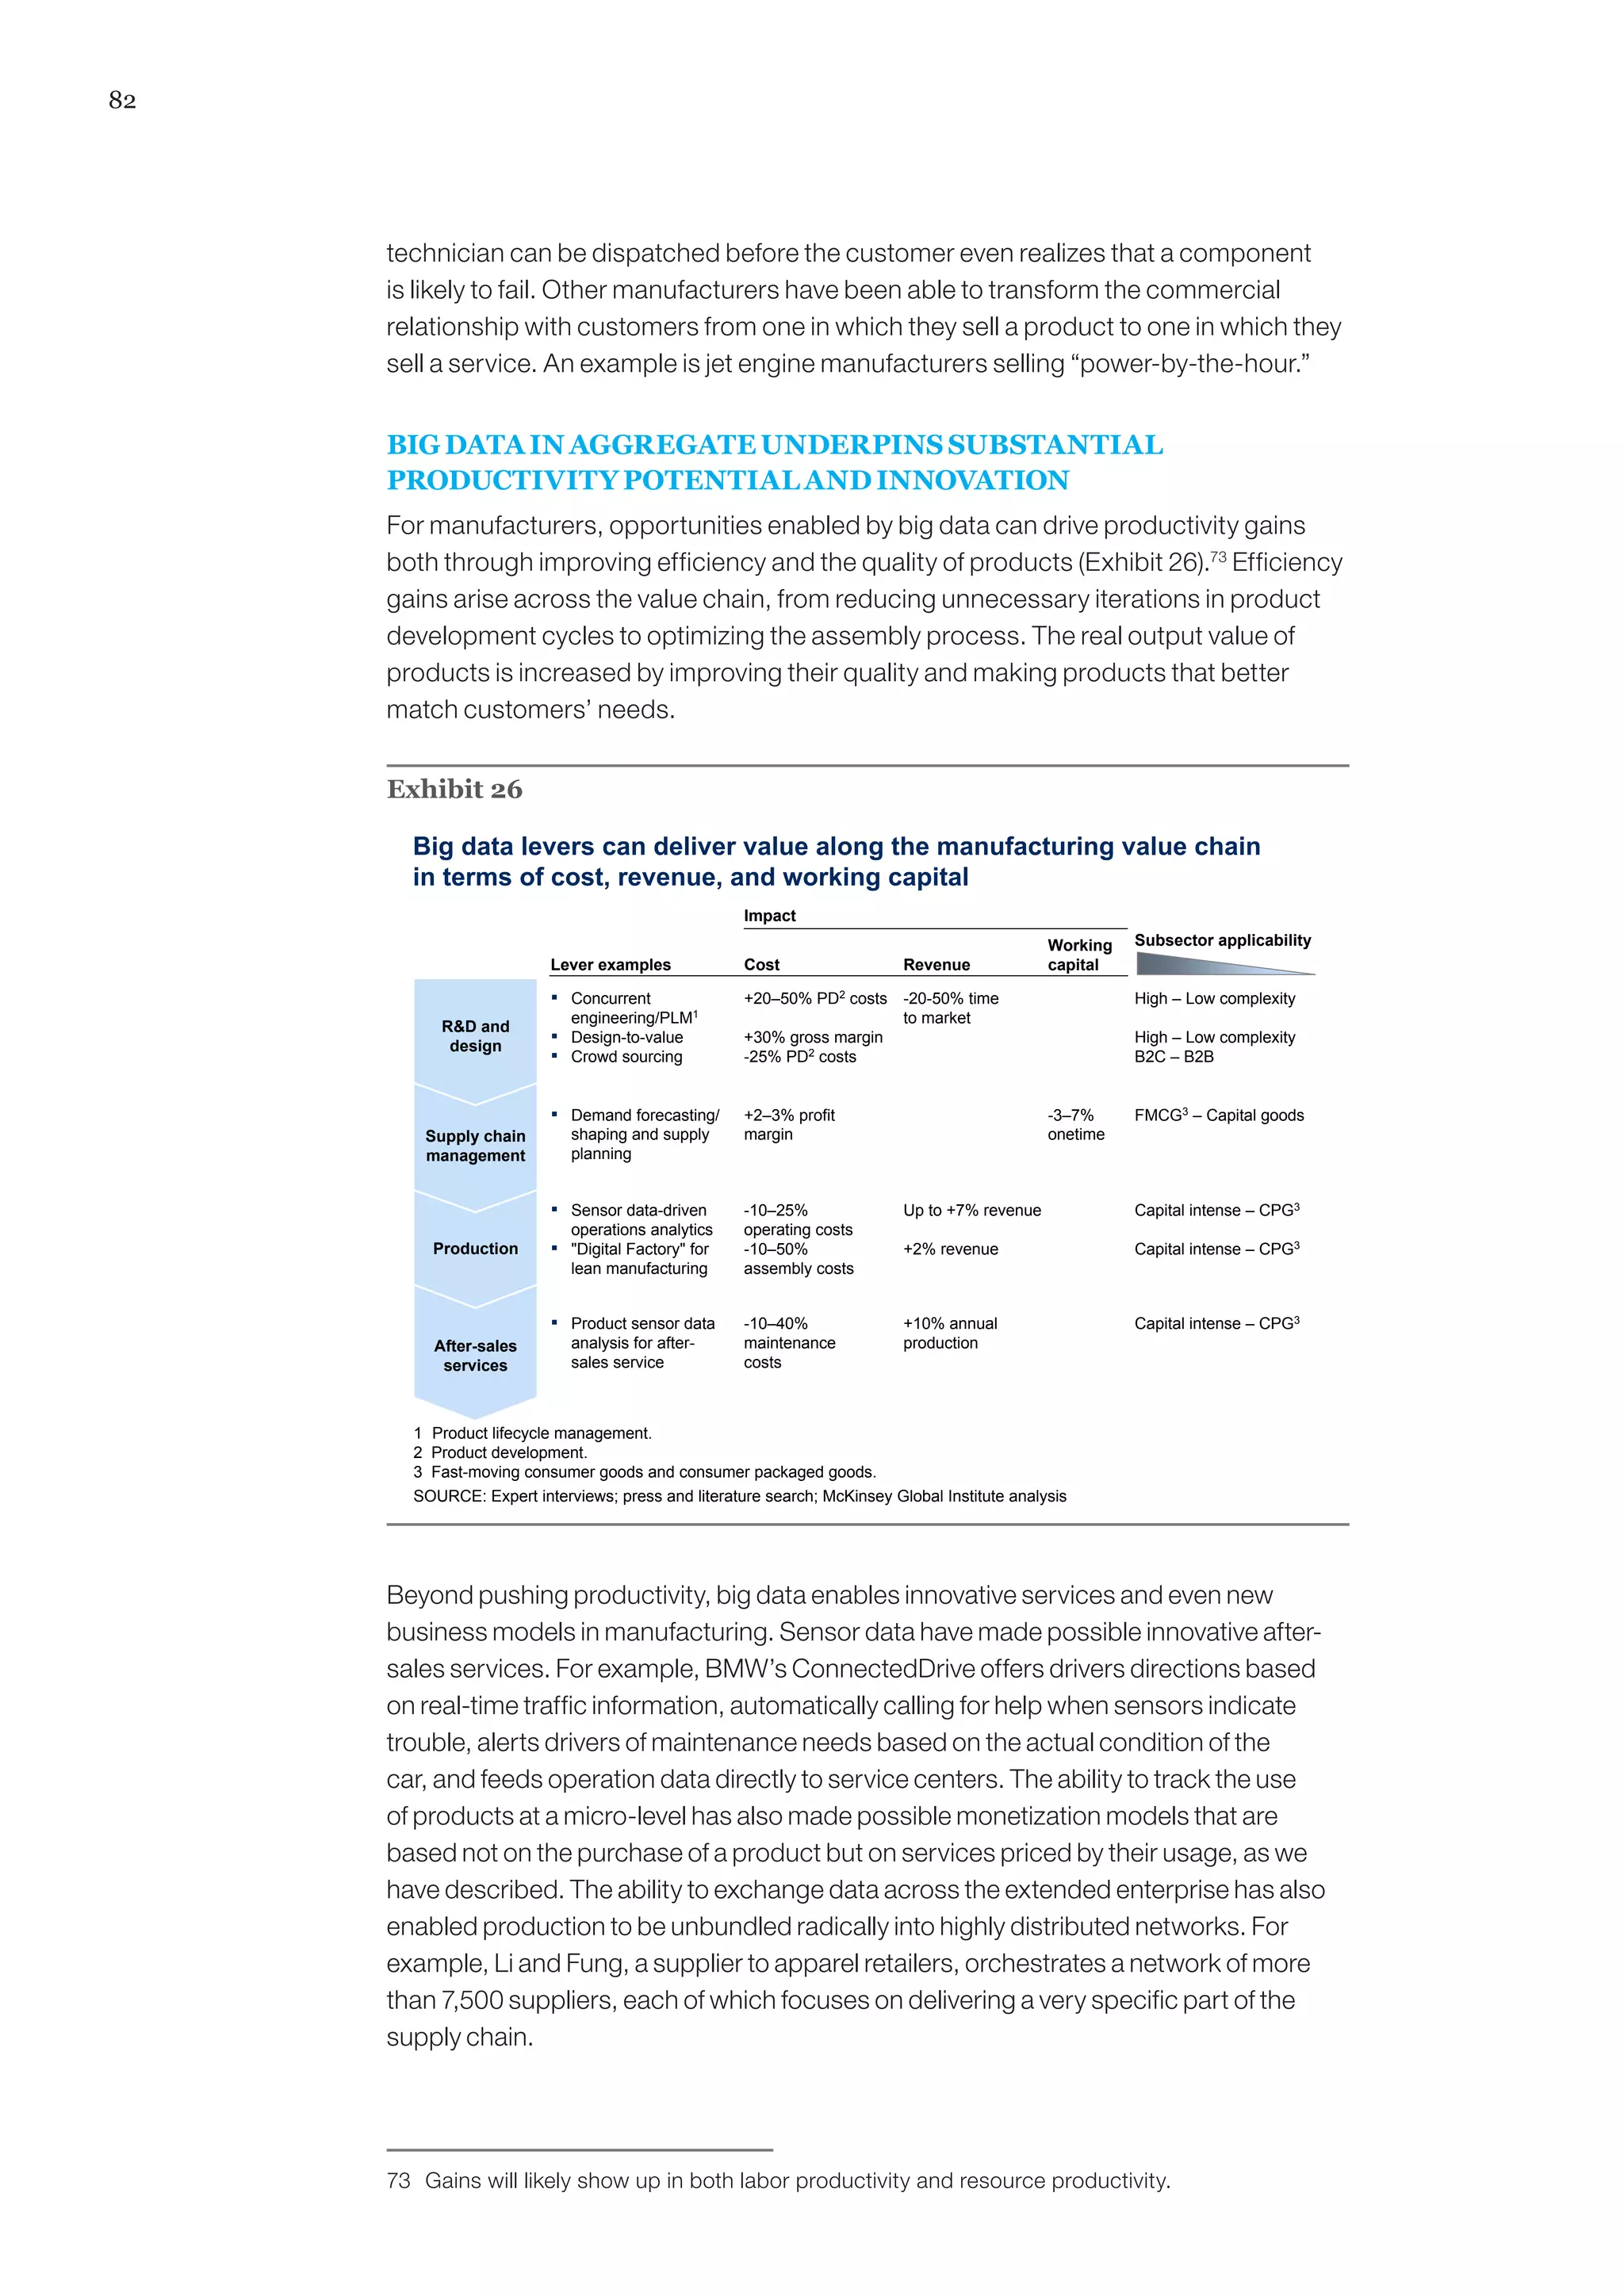
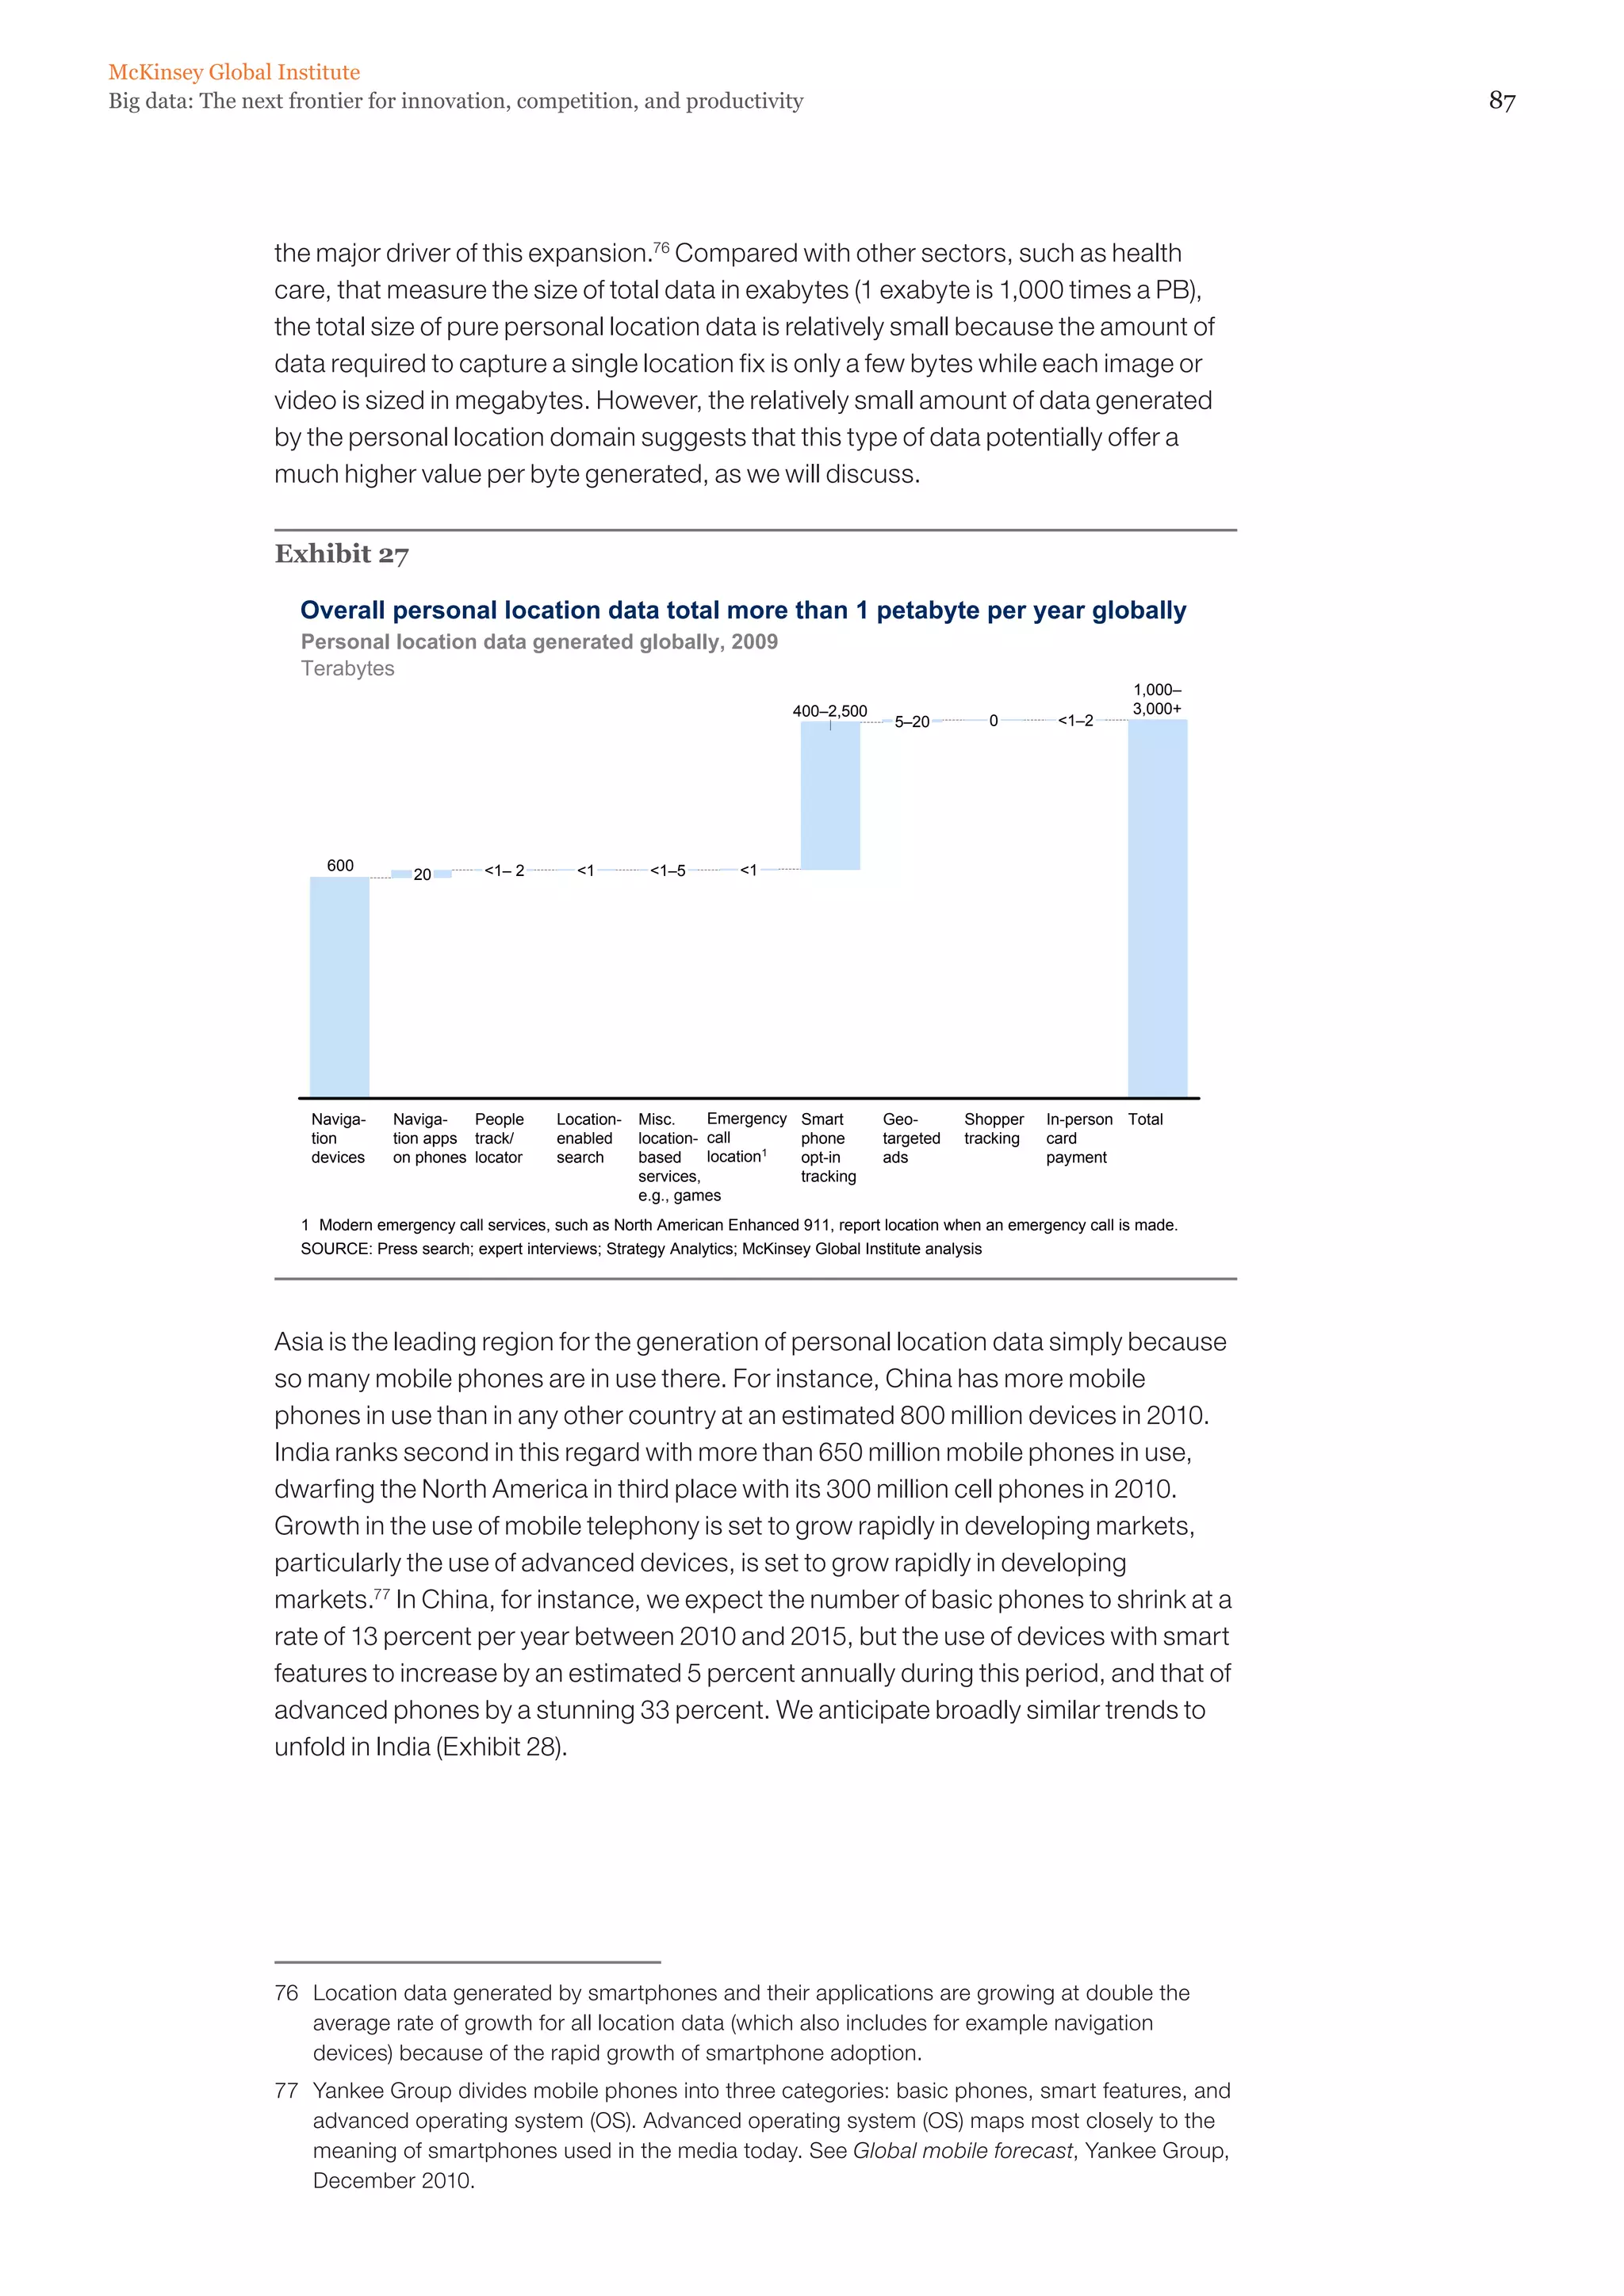
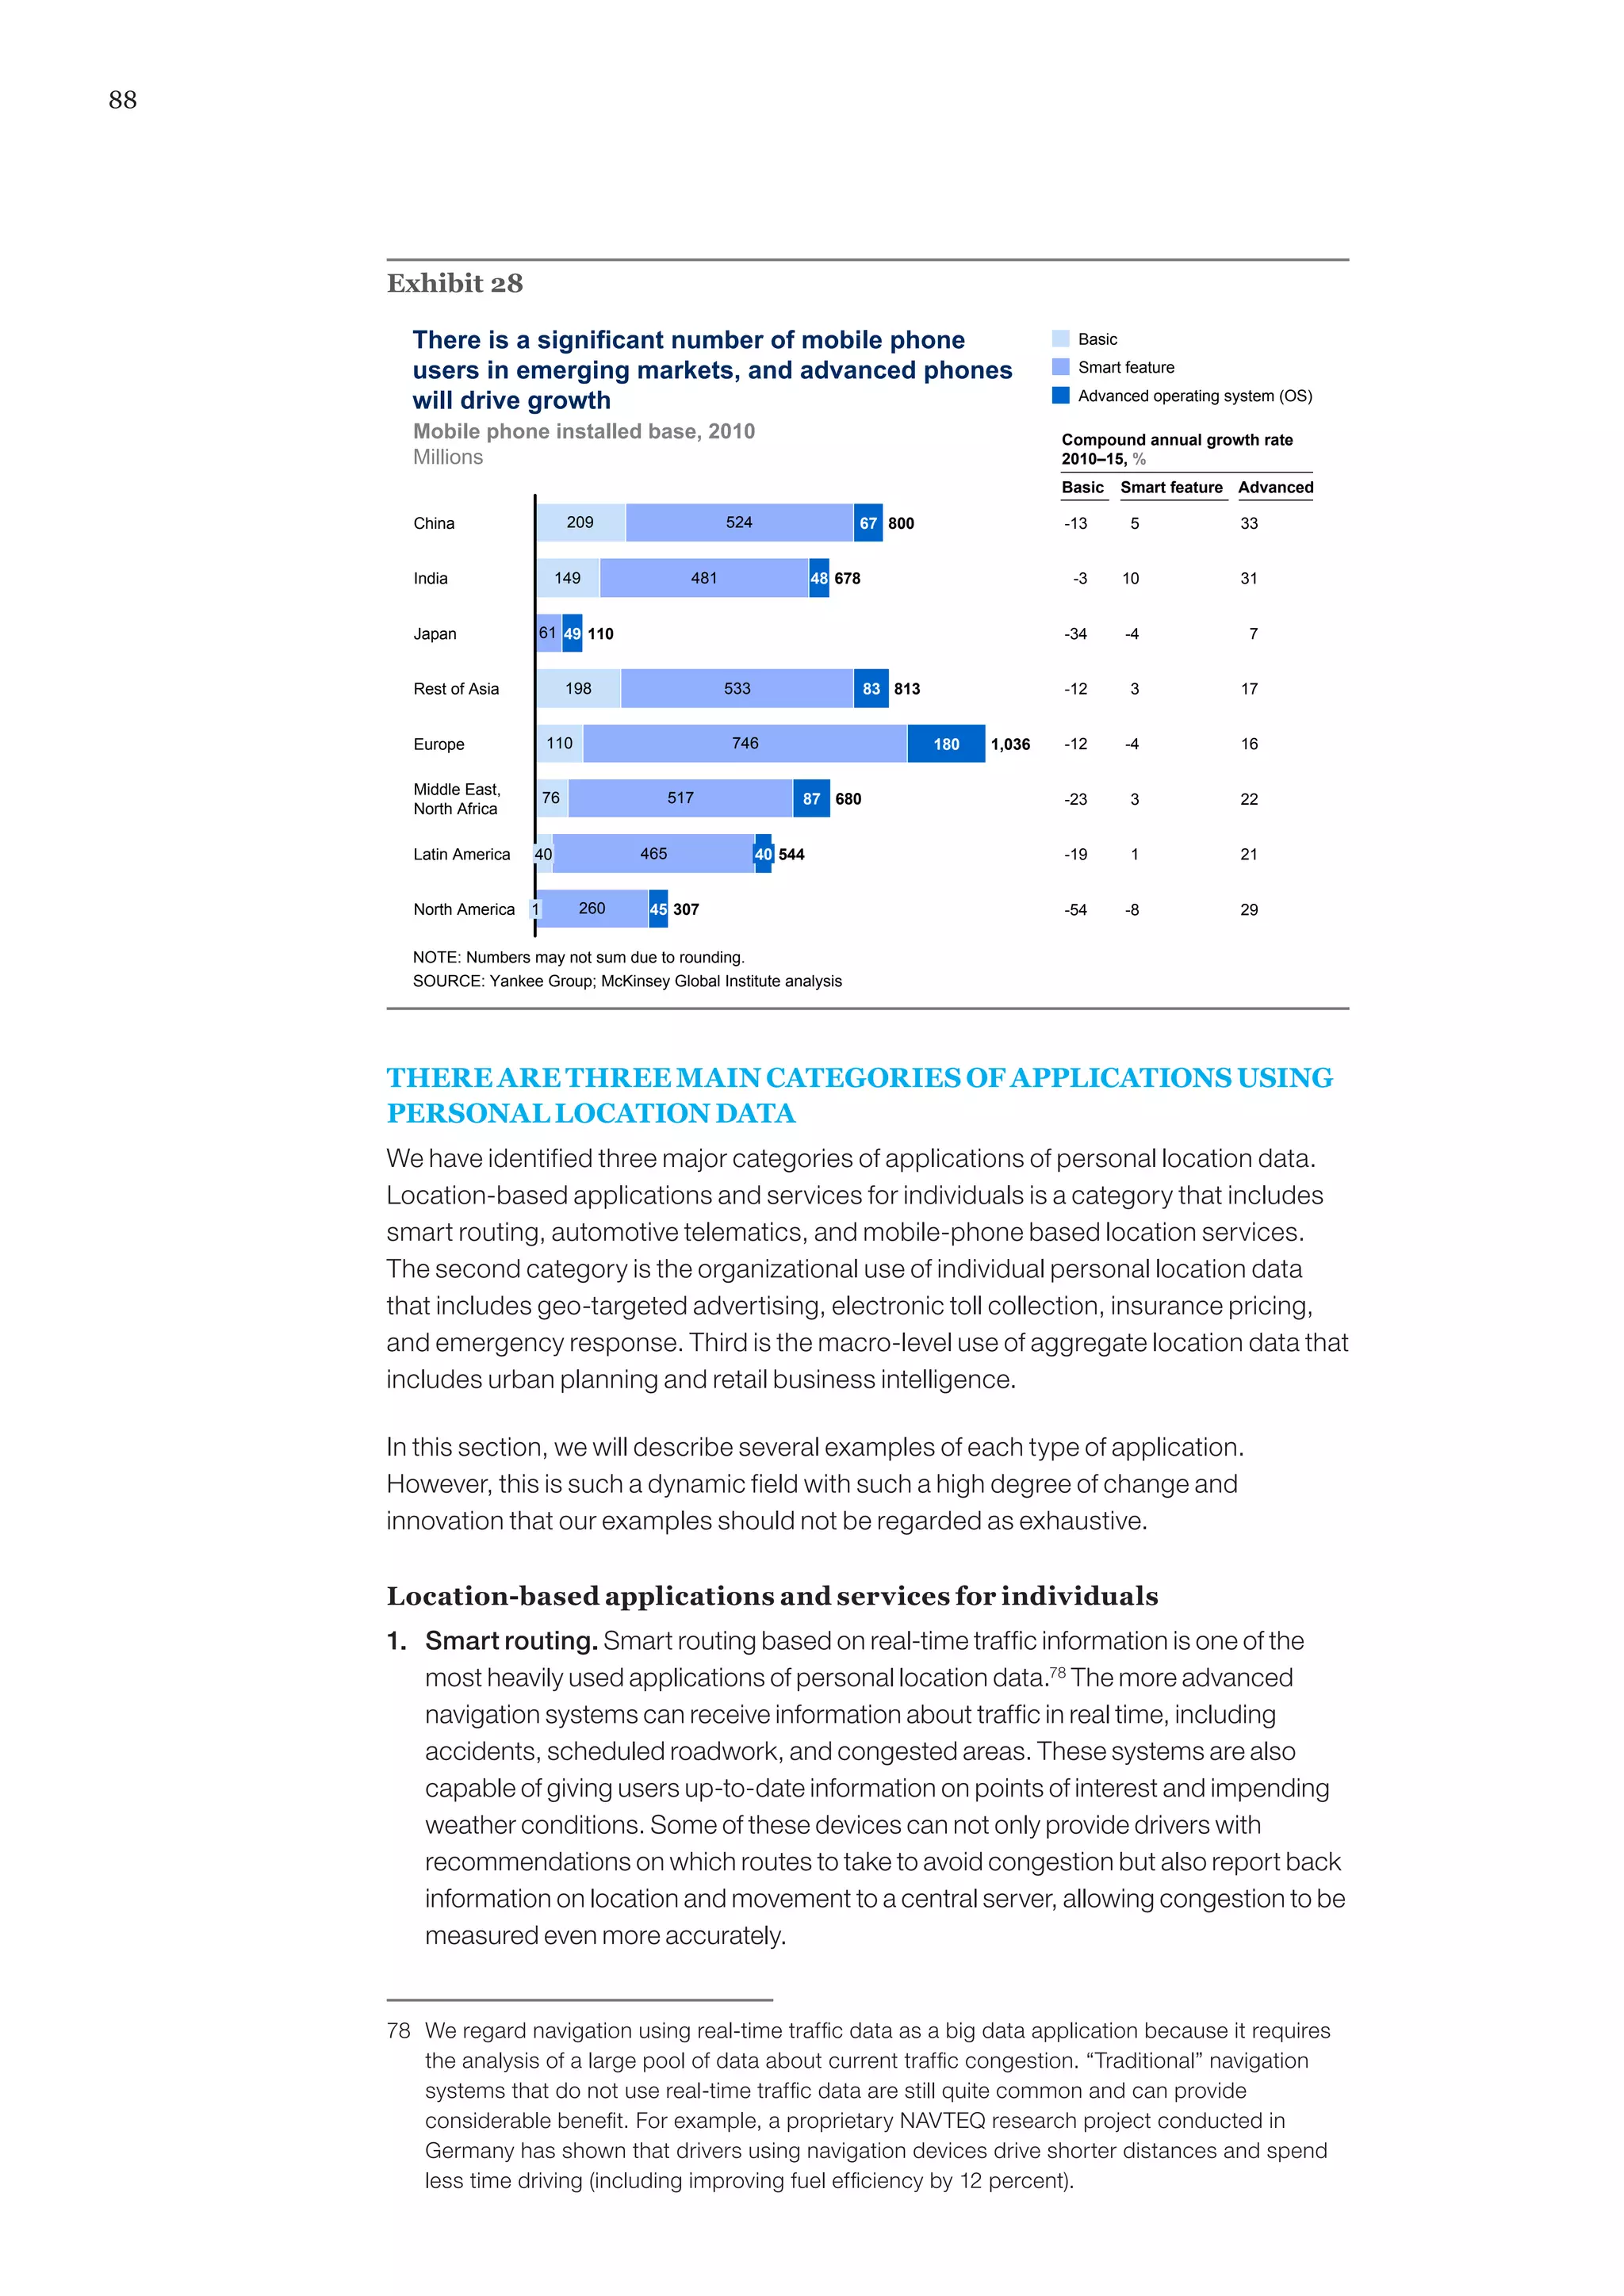
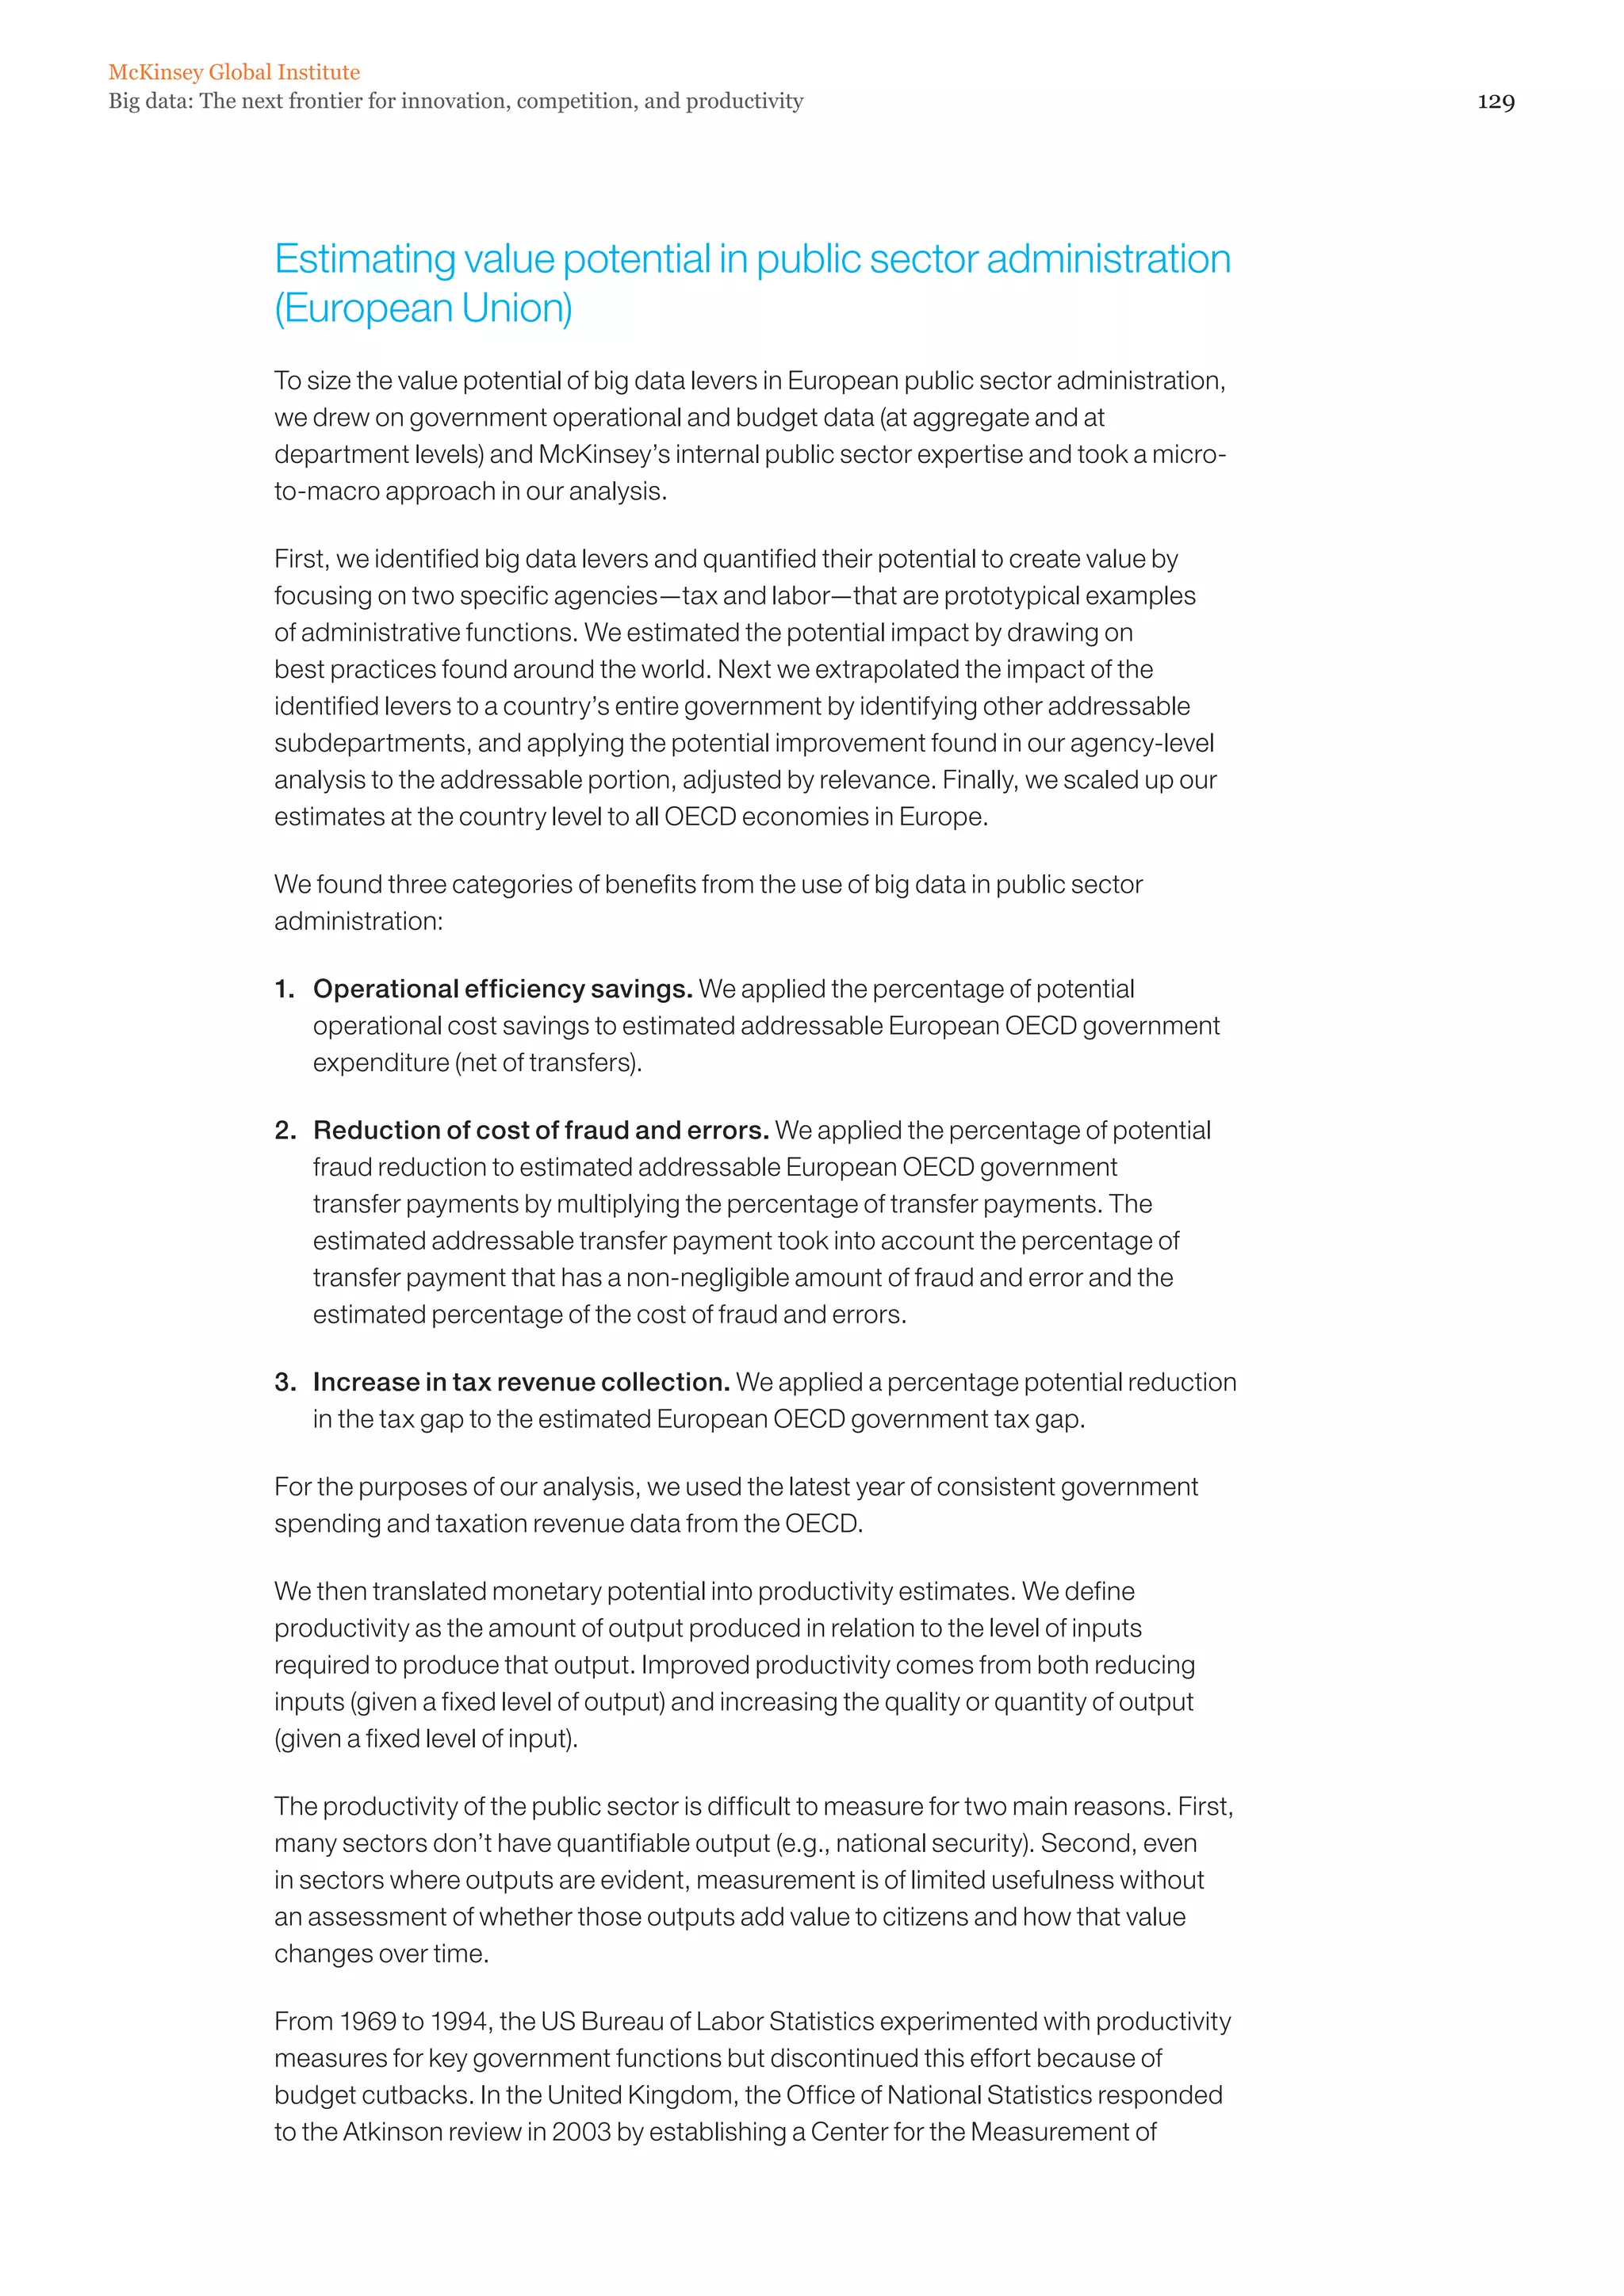
The document discusses the growth of big data and its potential economic value. It finds that big data can create significant value for businesses and the global economy by enhancing productivity and competitiveness. For example, using big data effectively in the US healthcare sector could save over $300 billion annually, while big data use in retail could increase operating margins by over 60%. Overall, big data presents opportunities for innovation and economic gains if businesses and policymakers address relevant challenges.


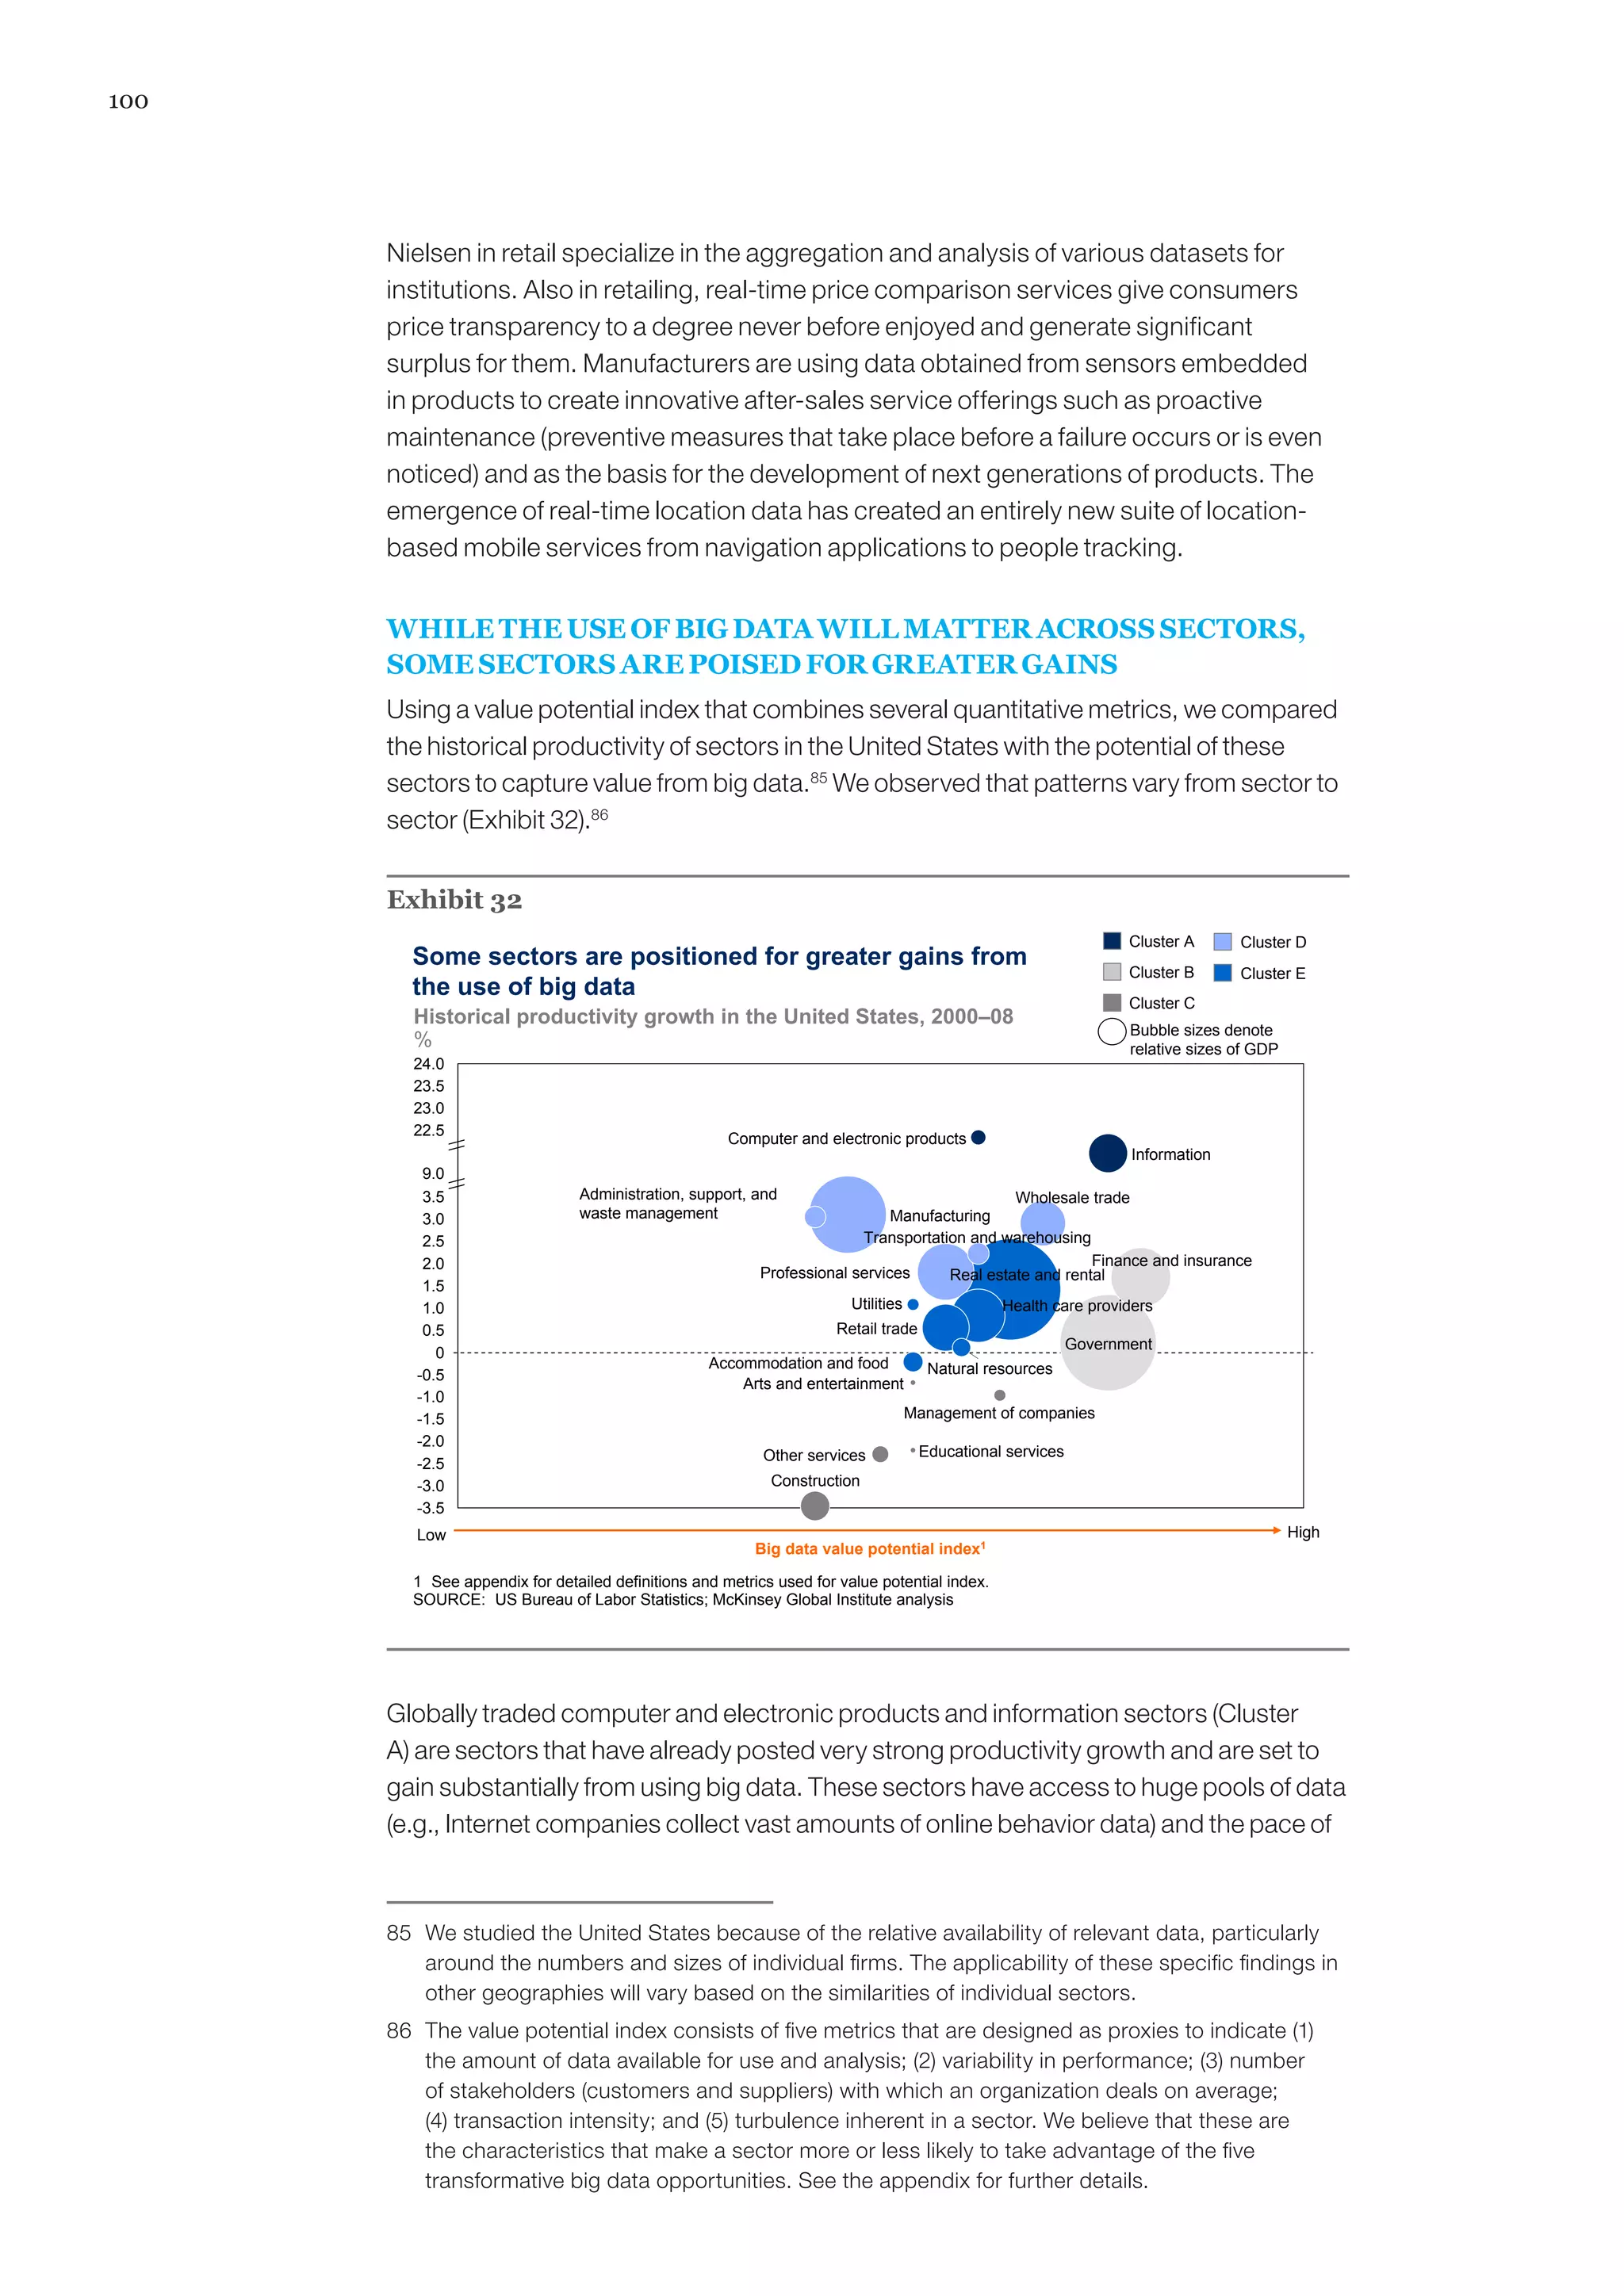


![[McKinsey] Disruptive technologies: Advances that will transform life, busine...](https://cdn.slidesharecdn.com/ss_thumbnails/mgidisruptivetechnologiesfullreportmay2013-130523153109-phpapp02-thumbnail.jpg?width=640&height=640&fit=bounds)


