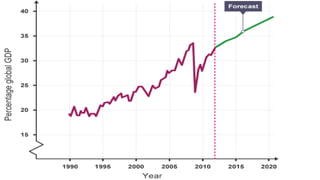
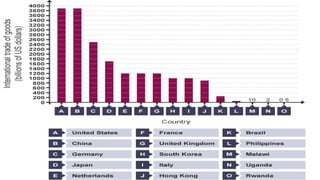
Present by: Sumiyyah Abdul Aziz
BS(Economics)
International Trade Patterns
The University Of Haripur
Table of Content
World Trade Patterns
World Exports
Percentage Global GDP
International Trade of Goods
What is World trade patterns?
Developed countries have a greater share of global trade than
developing countries. Usually they export valuable manufactured
goods, while developing countries export cheaper raw materials.
World Exports
Although global trade collapsed during the recent
financial
crisis, it has since bounced back strongly, led by trade
among emerging markets, like Brazil and the
Philippines.
The graph below shows the forecast for global
The bar chart below clearly shows the continued dominance
of developed countries in world trade. For developed
countries, and China, profits from world trade run into
thousands of billions of dollars. This is compared to Brazil
242 580 (USD Million), Philippines 51995, Malawi 11184,
Uganda, 2357 ,and Rwanda, 591.
 Experts believe that rapid growth markets will become an even
more dominant force in global trade over the coming decade,
with the Asia-Pacific region set to experience the fastest growth
in global trade to 2020.
 Trade will also be increasingly focused around Asia, the Middle
East and Africa, suggesting that the key geographical location
for companies will change.
 Europe’s exports to Africa and the Middle East by
2020 are forecast to be almost twice as large as
Europe’s exports to the US.
 China's dominance in low cost manufactured goods
will come under pressure from countries such as
Bangladesh, Vietnam and parts of Africa.
 The fastest-growing trade route will be between India and China.
 Some experts believe trade between China and India alone will
account for almost one-fifth of global trade flows by 2020.
 There is a huge amount of trade across borders. This however,
may reflect trade within a and between companies, rather than
flows to final consumers.
 Many companies export finished goods across borders within
their own organization.
International Trade Pattern ppt.pptx

International Trade Pattern ppt.pptx

  • 2.
    Present by: SumiyyahAbdul Aziz BS(Economics) International Trade Patterns The University Of Haripur
  • 3.
    Table of Content WorldTrade Patterns World Exports Percentage Global GDP International Trade of Goods
  • 4.
    What is Worldtrade patterns? Developed countries have a greater share of global trade than developing countries. Usually they export valuable manufactured goods, while developing countries export cheaper raw materials. World Exports Although global trade collapsed during the recent financial crisis, it has since bounced back strongly, led by trade among emerging markets, like Brazil and the Philippines. The graph below shows the forecast for global
  • 6.
    The bar chartbelow clearly shows the continued dominance of developed countries in world trade. For developed countries, and China, profits from world trade run into thousands of billions of dollars. This is compared to Brazil 242 580 (USD Million), Philippines 51995, Malawi 11184, Uganda, 2357 ,and Rwanda, 591.
  • 8.
     Experts believethat rapid growth markets will become an even more dominant force in global trade over the coming decade, with the Asia-Pacific region set to experience the fastest growth in global trade to 2020.  Trade will also be increasingly focused around Asia, the Middle East and Africa, suggesting that the key geographical location for companies will change.
  • 9.
     Europe’s exportsto Africa and the Middle East by 2020 are forecast to be almost twice as large as Europe’s exports to the US.  China's dominance in low cost manufactured goods will come under pressure from countries such as Bangladesh, Vietnam and parts of Africa.
  • 10.
     The fastest-growingtrade route will be between India and China.  Some experts believe trade between China and India alone will account for almost one-fifth of global trade flows by 2020.  There is a huge amount of trade across borders. This however, may reflect trade within a and between companies, rather than flows to final consumers.  Many companies export finished goods across borders within their own organization.