International Journal of Production Research
Vol. 49, No. 20, 15 October 2011, 5987–5998
A methodology for improving enterprise performance by
analysing worker capabilities via simulation
Brian Kernan*, Andrew Lynch and Con Sheahan
Department of Manufacturing Operations & Engineering, University of Limerick,
Engineering Research Building, Castletroy, Limerick, Ireland
(Received 20 May 2010; final version received 19 September 2010)
In this paper we outline a methodology for improving the overall performance of
small to medium sized enterprises (SMEs) by analysing worker capabilities
through simulation and modelling. We firstly examine key performance indica-
tors (KPIs) of the SME in its as-is state. The primary KPIs we examine are the
resource constraint metrics (RCMs) and customer misery index (CMI). The
RCMs help to identify the skill that is the biggest contributor to the overall
system constrainedness. The CMI is a measure of customer demand satisfaction.
By increasing the supply of the most heavily constrained skill we should increase
the flow of work orders through the system, which will in turn result in a reduced
CMI, or at least provide a potential for more work orders to flow through the
system. We run a set of experiments on data from a real factory, which upgrades
the skill sets of workers with the most heavily constrained skill, and then we look
at the system improvement. The overall impact of this experimental methodology
is that it can make recommendations to an organisation about which worker to
upgrade with which skill, and how the training should be implemented, to yield
the optimal improvement to the enterprise.
Keywords: worker; skill; training; SMEs; resource constraint metric;
customer misery index
1. Introduction
Managing directors of SMEs (small to medium sized enterprises) consistently find
personnel capability a limiting factor in influencing key performance measures.
Consequently worker training is viewed as an important tactical decision scenario for
an organisation. Previous research has shown that the implementation of training
programmes in companies can yield substantial productivity gains (Bartel 1994), and is
important for a company’s growth and its ability to stay competitive (Mital et al. 1999).
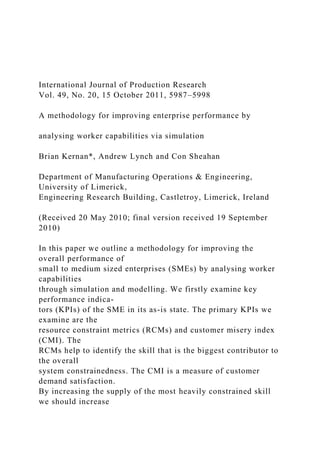
As part of our research we carried out a survey on 40 SME owner-managers on whether
or not a computer aid such as simulation would be a useful tool for making a decision
on worker training. The results are shown in Figure 1. Over 80% of participants either
agreed or strongly agreed that a computer tool that could rank candidate workers based
on the improvements they could bring to the enterprise would be useful in making a
decision on worker training.
*Corresponding author. Email: [email protected]
ISSN 0020–7543 print/ISSN 1366–588X online
� 2011 Taylor & Francis
DOI: 10.1080/00207543.2010.527387
http://www.informaworld.com
Discrete event simulation (DES) lends itself well to the training decision s.
Plant propagation: Sexual and Asexual propapagation.pptx
International Journal of Production ResearchVol. 49, No. 20,.docx
1. International Journal of Production Research
Vol. 49, No. 20, 15 October 2011, 5987–5998
A methodology for improving enterprise performance by
analysing worker capabilities via simulation
Brian Kernan*, Andrew Lynch and Con Sheahan
Department of Manufacturing Operations & Engineering,
University of Limerick,
Engineering Research Building, Castletroy, Limerick, Ireland
(Received 20 May 2010; final version received 19 September
2010)
In this paper we outline a methodology for improving the
overall performance of
small to medium sized enterprises (SMEs) by analysing worker
capabilities
through simulation and modelling. We firstly examine key
performance indica-
tors (KPIs) of the SME in its as-is state. The primary KPIs we
examine are the
resource constraint metrics (RCMs) and customer misery index
(CMI). The
RCMs help to identify the skill that is the biggest contributor to
the overall
system constrainedness. The CMI is a measure of customer
demand satisfaction.
By increasing the supply of the most heavily constrained skill
we should increase
2. the flow of work orders through the system, which will in turn
result in a reduced
CMI, or at least provide a potential for more work orders to
flow through the
system. We run a set of experiments on data from a real factory,
which upgrades
the skill sets of workers with the most heavily constrained skill,
and then we look
at the system improvement. The overall impact of this
experimental methodology
is that it can make recommendations to an organisation about
which worker to
upgrade with which skill, and how the training should be
implemented, to yield
the optimal improvement to the enterprise.
Keywords: worker; skill; training; SMEs; resource constraint
metric;
customer misery index
1. Introduction
Managing directors of SMEs (small to medium sized
enterprises) consistently find
personnel capability a limiting factor in influencing key
performance measures.
Consequently worker training is viewed as an important tactical
decision scenario for
an organisation. Previous research has shown that the
implementation of training
programmes in companies can yield substantial productivity
gains (Bartel 1994), and is
important for a company’s growth and its ability to stay
competitive (Mital et al. 1999).
As part of our research we carried out a survey on 40 SME
owner-managers on whether
3. or not a computer aid such as simulation would be a useful tool
for making a decision
on worker training. The results are shown in Figure 1. Over
80% of participants either
agreed or strongly agreed that a computer tool that could rank
candidate workers based
on the improvements they could bring to the enterprise would be
useful in making a
decision on worker training.
*Corresponding author. Email: [email protected]
ISSN 0020–7543 print/ISSN 1366–588X online
� 2011 Taylor & Francis
DOI: 10.1080/00207543.2010.527387
http://www.informaworld.com
Discrete event simulation (DES) lends itself well to the training
decision scenario.
We use DES as a prediction tool to determine which worker we
should upgrade that will
yield the best improvement to the enterprise. DES is preferable
over other simpler,
deterministic models, since it can deal with stochastic variables
such as machine processing
times, purchase order fulfilment lead-times, and worker
absenteeism; it can thus quantify
the risk of certain events on the enterprise’s performance.
Traditional simulation models however, do not generally look at
the effect of personnel
capability. In fact simulation models tend to focus on heavily
automated production lines
4. where the human element can be disregarded. For the majority
of SMEs however, workers
are a critical resource and cannot be ignored in a simulation
model. A simple decision
scenario that is dealt with in conventional DES models is
looking at the effect of adding an
extra parallel machine to a production line has on the system
throughput. The training
decision scenario expands on this by dealing with workers as a
resource and looking at
improving their skill-sets. A worker’s skill can be seen as an
abstract resource that is
requested by a machine in its different modes of operation. For
example, a machine in
its setup mode of operation may request the skill ‘Can Setup
Machine’ which would be
provided by an operator. The same machine, in a maintenance
mode of operation
may request a different skill such as ‘Can Repair Machine’ that
is provided by a
technician.
The main precedent for our research is in the paper by Bernhard
and Schilling (1997).
In this paper an assembly operation with 15 different assembly
stations is looked at where
workers are either fully or partially qualified. The authors then
examine two situations;
one where all workers are fully qualified for every process, and
then where a minimal set of
workers are partially upgraded that yields optimal
improvements that are comparable to
the first situation. In our paper we refer to the situation where
all workers are fully
qualified for every process as the magic wand scenario.
5. It should be noted that in the paper by Bernhard and Schilling
the only output
considered is throughput. For our research we developed
holistic KPIs that speak to the
entire organisation. These KPIs are covered in Section 4. We
also expand upon the work
by Bernhard and Schilling by having a methodology for worker
training that is applicable
to the general enterprise.
Figure 1. Pie chart of SME survey results.
5988 B. Kernan et al.
2. Modelling workers in simulation
We have built a database driven general simulation model that
instantiates an enterprise
from information stored in a relational database. The main
entities that we store are
information on machines (with multiple modes of operation),
workers, suppliers (vendors/
subcontractors), workflows, activities, resource calendars, and
orders. Workers can be
assigned multiple skills, and for each worker-skill combination
we have the following
information:
. Efficiency – a value between 1% and 100% and affects
processing speed. For
example if the nominal processing time for a job is 5 minutes,
and if the worker
assigned to the job has an efficiency of 50% for the requested
skill, then the actual
6. processing time will be 10 minutes (we simply divide the
nominal processing time
by the efficiency).
. Conformance rate – a value between 0% and 100%.
Conformance rates will be
connected to worker dependent quality issues for machines. For
example, if a
machine has a quality issue, and the worker’s conformance rate
for the requested
skill is 96%, then 4% of the workpieces will have a quality
issue and will either be
scrapped or reworked. Quality related needs have been
identified as being an
important impetus for training (Swamidass and Schraedar 2003).
. Grade – a single character that is either ‘A’, ‘B’, ‘C’, or ‘D’.
Skill grades will be
connected with a machine for a particular activity, which also
possess the
attribute grade. For example, a difficult machine-activity for a
job could have a
‘B’ grade indicting that only a worker with a grade ‘B’ or
higher for the requested
skill can be utilised for the job. Grades in practice will be
dependent on efficiency
and/or conformance rate, but can be defined independently in
the database, i.e., a
worker with an ‘A’ grade for a skill should have a higher
efficiency and/or
conformance rate than a worker with a ‘B’ grade for the same
skill.
For the sake of simplicity, in the case-study in Section 6 we
assume that all efficiencies
are either 0% or 100%, i.e., a worker either possesses a certain
7. skill or he does not. Also,
we do not deal with non-conformance issues and grades; these
are defaulted to values of
100% and ‘A’, respectively. It is also important to note that the
simulation model is pull-
based. Orders are generated externally by an ERP (enterprise
requirements planning)
system based on external customer demand and product BOMs
(bill of materials). All
orders in the system are tied to external demand. This means
that the simulator is more
representative of reality than the paper (Bernhard and Schilling
1997) which only looks at
increased throughput – an increase in throughput is only
beneficial if there is actual
demand for the additional product being produced.
3. Training periods
Overall, training leads to acquiring new skills and/or
improvements in existing skills
(Carnevale and Goldstein 1990) and we simulate training as
such. Actual training periods
are assumed to have granularity of days, and we associate a set
of upgrades with each
trainee for a training period. Training itself can be undertaken
in two different ways:
. Hands-off training – we assume that the trainee is unavailable
for work. This will
be applicable if the worker is receiving off-the-job training, i.e.,
on the shop-floor
International Journal of Production Research 5989
8. but unavailable for work, e.g., observing another worker
operating a machine.
Once the training period is complete, the trainee receives their
upgrades.
. Hands-on training – the trainee is available for work on the
shop-floor. This is also
known as on-the-job training (OJT) (Rothwell and Kazanas
2004). A survey by
the National Association of Manufacturers in the US revealed
that OJT was the
leading training method, with over 77% of manufacturers using
it for developing
employees (Swamidass and Schraedar 2003). We assume in our
model that
trainees are given their upgrades at the start of hands-on
training.
Since we can associate multiple training periods with a worker,
we can create a string of
training periods. For example, over the course of a working
week the trainee could receive
hands-off training Monday through Wednesday and on Thursday
and Friday the trainee
is given hands-on training. As the week progresses the trainee’s
performance rate can
9. improve. For the sake of simplicity we assume all training is
carried out by the enterprise
under examination, i.e., training is not subcontracted out, and
thus there are no associated
monetary costs.
4. Training KPIs
We will have four KPIs or benchmarks that we will base our
decision for training on:
(1) System constraint metric (SCM) – this is a measure of the
total constrainedness of
the manufacturing system. The lower it is, the faster the order
velocity through the
system. The SCM is the sum of resource constraint metrics
(RCMs) which
individually are a measure of how much of a limiting factor a
resource is. RCMs
are defined in our previous paper (Kernan et al. 2010).
(2) Customer misery index (CMI) – the customer misery index
is a metric which
weights the lateness of a satisfied sales order by its contributing
revenue. The
equations for CMI are given below. The CMI is a measure of
revenue at risk. If the
enterprise is chronically late in satisfying demands, after
10. training is implemented,
we may see a reduction in the CMI.
CMI ¼
Xb
i¼1
Revenuei �Latenessi½ �
Latenessi ¼
Completion Dateð Þi� Request Dateð Þi
Request Dateð Þi� Booking Dateð Þi
where:
CMI customer misery index;
Revenuei revenue generated from sales order line i;
Latenessi lateness for sales order line i;
(Completion Date)i completion date of sales order line i;
(Request Date)i customer request date for sales order line i;
(Booking Date)i booking date of sales order line i;
b total number of sales order lines.
5990 B. Kernan et al.
Note in the above equation for lateness, if the request date is
before or the same as the
booking date, the denominator will be for a single day and in
the same units as the
numerator, e.g., 1 day, 24 hours, or 1440 minutes.
11. (3) Cognitive assessment metrics – these are an amalgamated
set of answers to
qualitative yes/no questions with regard to each candidate
worker. Preset
parameters are outlined for each matrix, which facilitates a
yes/no answer for
each. The purpose here is to allow a qualitative filter to be
applied to the various
candidates for training programmes, based on their overall
suitability and stability
for the company going forward. There are 10 questions in total,
so each worker will
have a rating between 0 and 10. These metrics were determined
through surveys
and interviews with several owner managers of SMEs and are
listed below:
(1) Discipline issues (above/below x formal issues)
(2) Length of service (above/below x number of years)
(3) Location on shop-floor (in relevant location or not)
(4) Absenteeism (above/below x incidents per annum)
(5) Tardiness (above/below x incidents per annum)
(6) Training received to date (above/below x process
operations)
(7) Age (inside/outside age bracket)
(8) Union activity (above/below x level of activity)
(9) Marriage (Y/N)
(10) Mortgage (Y/N)
(4) Training customer misery index – when a worker is being
trained, the worker may
be unavailable for work. Therefore, there may be a significant
increase in the CMI
that must be taken into consideration. Staggered training might
12. be required in
order to reduce the CMI that is a result of the training.
4.1 Standardised RCM across shifts
Since an enterprise can have more than one shift, it may be
found that a skill has a higher
RCM value during one shift than another. For example, there
may be fewer workers
available for the night-shift than the day-shift, and this would
mean a higher RCM value
for the skill during the night shift. A consequence of this is that
if we are looking at
potential candidates for training we should focus on workers
that work the night shift, as
opposed to the day shift. To quantify this potential variation in
RCM values amongst
shifts we need to filter the values by shift. We also need to
standardise the RCM value for a
particular skill for a particular shift. This is done by dividing
the RCM value by the
number of workers who possess that skill during that shift:
RCM�ij ¼
RCMij
wij
,
where:
RCM�ij standardised RCM for skill i and shift j;
RCMij RCM for skill i and shift j;
wij total number of workers that possess skill i during shift j.
13. International Journal of Production Research 5991
The reason we divide by the number of workers who currently
possess that skill is
explained in the following example. Consider the situation for a
single shift with a skill
‘Can Operate Lathe’ with a high RCM say an arbitrary value of
100 hours. If there are
currently 10 workers who possess this skill, upgrading a single
worker will only increase
our skill capacity from 10 to 11, i.e., a 10% increase. If we have
a skill ‘Can Weld’ with
a lower RCM of 90 hours but if there are only two workers who
possess this skill,
then upgrading a skill worker with this ability will increase the
skill capacity for welding
by 50%. Hence, we can say the skill ‘Can Operate Lathe’ has a
standardised RCM value
of 10 hours, and the skill ‘Can Weld’ has a standardised RCM
value of 45 hours.
In a sense, this means we focus on not the most highly
constrained skill, but the skill that
will give us the greatest reduction in constrainedness, with
minimum worker capability
upgrades.
5. Experimental methodology
The experimental methodology is defined below. The magic
wand scenario is when we
instantly upgrade all workers with all skills:
(1) Run the baseline experiment for a fixed amount of simulated
time (e.g., 6 months).
14. (2) Run the magic wand scenario for the same amount of
simulated time.
(3) Compare the KPIs; if there is a significant improvement, go
to point (4).
(4) Identify the most heavily constrained skill and what shift it
occurs in; it will have
the highest RCM�ij value from the baseline experiment. Also,
some qualitative
ranking of the problem skill may be required at this stage. For
example, it is easier
to train a worker in a pick-and-place style operation as opposed
to a more labour
intensive skill such as welding.
(5) Determine the following attributes for all workers:
. Does the worker already possess the problem skill? If they do,
they are not a
candidate for training.
. Does the worker work the shift where the problem skill is most
heavily
constrained? If they do, they are a candidate for training.
. Cognitive assessment metrics – qualitative metrics for
candidates between 0 and
10 (inclusive); the higher the better.
. Total utilisation – it is reasonable to assume that a worker
with low utilisation
is a better candidate for training than one with high utilisation.
However, even
if the candidate worker has high utilisation and if we train that
worker the
simulated worker-pool could reorganise itself to take advantage
15. of this
additional skill, and yield high improvements in the KPIs.
(6) Filter out workers that already possess the problem skill.
Sort remaining workers
by descending cognitive assessment metrics, and by ascending
utilisation. At this
stage we can apply filters to the workers, i.e., specify cut-off
points for cognitive
assessment metrics, and/or utilisation. This implies however,
that we do not
consider any potential simulated improvements these workers
can bring to the
KPIs if they were trained.
5992 B. Kernan et al.
(7) Run experiments, each experiment will be in two parts:
. Run one experiment where candidate/s is/are upgraded
instantaneously
(Part a):
(i) Record SCM for all replications.
(ii) Record CMI for all replications.
. Run other experiments where the same candidate/s
receives/receive training
(Part b):
(i) Record CMI for all replications.
(8) Store the information in the table with the following fields
1
16. :
. Decision (primary key)–includes baseline which represents a
null decision.
. Mean SCM reduction WRT baseline–from experiment (Part a)
representing
long term steady state improvement.
. Mean CMI reduction WRT baseline–from experiment (Part a)
representing
long term steady state improvement.
. Cognitive assessment metric–not applicable in baseline
decision.
. Mean training CMI–CMI from experiment (Part b) minus CMI
from
experiment (Part a).
(9) Make a Pareto-optimal decision based on this table. The
ideal (non-dominated)
candidate to receive training would possess the following
properties:
. Field mean SCM reduction WRT baseline is the highest.
. Field mean CMI reduction WRT baseline is the highest.
. Field cognitive assessment metric is the highest.
. Field mean training CMI is the lowest.
5.1 Additional considerations
17. We need to simulate a reasonable long period of time, since the
decision on training is a
tactical one, i.e., we are interested in long-term steady state
improvements to the
enterprise. A reasonable simulated time would be six months to
a year. It is important to
note that the mean SCM and CMI reduction are representative
of the long-term benefits
from training; they ignore any transient detrimental effects
incurred during the training
period(s), which are instead captured in the mean training CMI
metric.
A reduction in mean CMI indicates real improvement to the
enterprise; less customer
demands are being satisfied late. A reduction in mean SCM
represents a potential for
increased resource loading. We could ramp up production if we
have more capacity, which
will be evidenced by the lower SCM value, but production
should only be increased if we
can create more demand which may be constrained by market
conditions. However, we do
not consider increasing demand in the experimental
methodology, and we may also have
no change in the CMI if we are already meeting our customer
demands on time.
International Journal of Production Research 5993
18. Also, training two workers concurrently may lead to better
improvements in the long
term than just training a single worker, but it could lead to a
high CMI during the training
period, since we have decreased resource capacity while both
workers are being trained.
If we are still keen on training two workers, we could try
staggered-training. We largely
ignore this level of detail in the experimental methodology, but
the end-user can define
these as experimental parameters in the simulation model.
6. Case study
In this section we go through a simulation experiment using
data from a real factory to
determine the optimal worker to train. The factory under
examination is a SchuF Fetterolf
production plant in Ireland that designs and manufactures
industrial valves that control,
isolate, divert, and sample gases, liquids, slurries, and powders.
The model instance data
was stored in the company’s ERP system and was translated and
stored in the relational
19. database for the simulation model. The main characteristics of
the plant are listed in our
previous paper (Kernan et al. 2010) which the reader is referred
to.
The worker-skill matrix is shown in Table 1. We model worker
absenteeism and
tardiness as described in Kernan et al. (2010) and we ran the
model for a simulated period
of one year for 20 replications. The top three highest skill RCM
values are shown in
Figure 2. One can see that there is significant variance, due
primarily to worker
absenteeism. Note that in this case study, the factory only
operates a single shift – so we do
not have to worry about RCM values across different shifts. In
Table 1 the skills in the
darker cells are the skills with the top three highest skill RCM
values. Worker 1 is the
worker with the lowest utilisation and Worker 11 has the
highest utilisation (see Figure 3).
We will run worker capability experiments on these two
workers with all skills.
It appears that the skill with the highest RCM value is ‘Can
Welding’, however we need
to standardise the skill RCM values by dividing by the number
20. of workers that possess
each skill as described in Section 4.2. In Figure 2 we see that
the skill with the highest mean
standardised RCM value is ‘Can Weld’. An important point here
is that it may be easier to
Table 1. Worker skill matrix for SchuF data (baseline).
Can
Assemble
Can Assemble
Hand
Actuator
Can
Deburr/
Sandblast
Can
Inspect
Can
Make/
Buy
Can Pick
Material
& Components
21. Can
Welding
Worker 1 X X
Worker 2 X X X
Worker 3 X
Worker 4 X X X
Worker 5 X
Worker 6 X
Worker 7 X X X
Worker 8 X X X
Worker 9 X X
Worker 10 X X
Worker 11 X X
5994 B. Kernan et al.
train a worker in an assembly role, compared with a more skill
focused job such as
welding.
Next we look at the worker utilisation which is shown in Figure
3. Firstly it should be
noted that the low worker utilisation is primarily due to only a
limited number (21%) of
manufacturing workflows being assigned to work orders in the
ERP database; instead just
a lead-time is specified. In addition it is believed that some of
the resource groups in the
22. Figure 3. Worker utilisation for SchuF data (baseline).
Figure 2. Resource constraint metrics for SchuF data (baseline).
International Journal of Production Research 5995
ERP database have been incompletely filled by the user; most
machines are defined to run
automatically, even in their setup mode, i.e., they require no
worker to setup the machine.
Finally, in the ERP database there were 24 workers listed, but in
Figure 3 it seems that
only 11 workers are working on the shop-floor. The reason for
this discrepancy is that not
all the workers are assigned to the shop-floor, e.g., some
workers are assigned to sales,
accounting, etc. However, even though the utilisations are low,
we can still measure
significant differences amongst workers, and amongst
experiments. In a sense the SchuF
data we are using can be regarded as a data subset of the real
world data.
Based on the worker utilisation values it appears that Worker 11
is the most
appropriate candidate since he has the lowest utilisation; also he
has two skills which have
23. relatively low skill RCM values. The actual reason this
particular worker has such
relatively low utilisation is because he is the manager of the
plant and thus spends
relatively little time on the shop-floor. In reality his role would
preclude him from being a
training candidate, but for the sake of interest, he was
considered a candidate for this
simulation experiment.
We next ran 10 more experiments, the details of which are
shown in the first two
columns of Table 2. Note that experiment number 0 corresponds
to the baseline. We look
at the upskilling of Worker 11 and Worker 1, (the workers with
the lowest and highest
utilisation, respectively) with each skill that they do not
currently possess. According to the
methodology we should find the best result with Worker 11 and
the skill ‘Can Welding’,
since Worker 11 has the lowest utilisation and the skill ‘Can
Welding’ has the highest
standardised RCM value. All experiments were run for 20
replications.
Experimental results are shown in Table 2. ANOVA was
performed on the
24. experimental results using an ODBC connection to ‘R’ the
statistics application.
We show the RCM/SCM improvement of each of the worker
capability experiments
with respect to the baseline experimental model
2
. Percentages are only shown if there is a
statistically significant difference (1% significance level)
between the means of the two
experiments. Also, all results were checked using a K-S test to
see if there was any evidence
Table 2. Reduction in mean SCM/RCM values with respect to
baseline experimental model.
SCM
reduction
Machine RCM
reduction
Skill RCM
reduction
0 Base line
1 Magic wand 22.53% 99.49%
2 Worker 11 - Welding 14.53% 65.62%
3 Worker 11 - Can Deburr/Sandblast
4 Worker 11 - Can Assemble 14.87% 64.04%
5 Worker 11 - Can Assemble Hand Actuator
6 Worker 11 - Can Pick Materials & Components 2.69% 13.15%
25. 7 Worker 1 - Can Deburr/Sandblast
8 Worker 1 - Can Inspection
9 Worker 1 - Can Make/Buy
10 Worker 1 - Can Pick Materials & Components
11 Worker 1 - Can Welding
Equal mean & equal variance
Equal mean & unequal variance
Unequal mean & equal variance %
Unequal mean & unequal variance %
5996 B. Kernan et al.
of deviation from the normal model assumption. All data sets
appear to be normally
distributed. A discussion of the results obtained is covered in
the next subsection.
6.1 Discussion
There are several points of interest from the results shown in
Table 2:
. Magic wand scenario leads to a 22% reduction in SCM
When we break this result down we see that we have a 99%
reduction in skill
RCM, and a 0% reduction in machine RCM. So giving every
worker every skill
means that machines are practically never starved for skill.
However, this scenario
does not bring about a significant change in the machine RCM.
This result was to
be expected since we have not made any changes to the
26. machines on the shop-
floor.
. Only Worker 11 brings about improvements
Only upgrading Worker 11 brings about improvements, and
these are limited to
the three skills with the highest RCM* value. These results were
expected because
Worker 11 has the lowest utilisation, and skills with low RCM*
values should
yield commensurately low improvements; in this case zero
improvements. Worker 1
has the highest utilisation and upgrading his skill set brings no
improvements to
the RCMs. It should be noted that for this experiment we only
look at
upgrading a worker with a single skill at any one time; we
cannot discount
the possibility that upgrading Worker 1 with multiple skills can
lead to
improvements. However, we deliberately limit the decision
space, since it would
be too large to explore otherwise.
. Other points
Some final points are firstly that for all the experiments there
are no significant
changes in the machine RCM values. These results are expected
since no changes
to the machine are made. Finally, in cases where there are
significant improve-
ments, the ratio of improvement of RCM skill to SCM is
approximately four.
This ratio is expected to be more or less constant in these cases,
27. since the SCM is
simply the sum of skill RCM and machine RCM, but it is an
important value for
showing the contribution of constrainedness due to skills and
machines to the
overall system.
7. Conclusion
In this paper we have looked at worker capability analysis and
worker training as an
important tactical decision making scenario. Managing directors
of SMEs consistently
find personnel capability a limiting factor in influencing KPIs.
Through the use of a
database driven simulation model we provide a methodology for
analysing an enterprise’s
as-is performance and locating where the enterprise should
focus its effort in order to
improve overall performance with regard to worker capabilities.
We essentially determine
that skill which is the largest contributor to the overall shop-
floor constrainedness. Once
we have identified the problem skill we then outline a
methodology for determining
International Journal of Production Research 5997
the quantitative long-term holistic improvement to the
enterprise that would be brought
about by upskilling a worker. We also rank and filter candidate
workers according to a set
of qualitative criteria, that would be infeasible to model in a
simulator, e.g., discipline
28. issues, number of years with the company. Finally, we describe
how the training itself may
be carried out in simulation; either as hands-on or hands-off
training.
While we have developed an application for the end-user to
determine the cognitive
assessment metrics, for potential worker candidates, further
work is required to
incorporate this into the simulation application, and to also
develop a robust user
interface for experimentation. For example, the user could be
presented with a matrix like
in Table 1 and once the first six steps of the training
methodology have been executed
automatically, recommendations for which worker to train and
in which skill could be
highlighted in the matrix. The user can then run comparative
experiments, following these
recommendations (or defining their own experiments if they so
wish), and then comparing
the SCM and CMI benchmarks to the baseline. Once they have
established which worker
they want to upgrade, experiments could be run on how best to
carry out the training.
Notes
1. Mean reductions will only be non-zero if there are
statistically significant reductions with
respect to (WRT) the baseline model at a significance level of
1%.
2. There are no statistically significant improvements to CMI
due to long order lead-times,
relatively short order fulfilment lead-times, and that only 21%
29. of orders had workflows that
utilised worker resources.
References
Bartel, A.P., 1994. Productivity gains from the implementation
of employee training programs.
Industrial Relations, 33 (1), 411–425.
Bernhard, W. and Schilling, A., 1997. Simulation of group work
processes in manufacturing. In:
Proceedings of the 29th winter simulation conference, 7–10
December Atlanta, Georgia, USA,
888–891.
Carnevale, A.P. and Goldstein, H., 1990. Schooling and training
for work in America: an overview.
In: L. Ferman, et al., eds. New developments in worker training:
a legacy for the 1990s.
Industrial Relations Research Association series. Madison, WI:
Industrial Relations Research
Association.
Kernan, B., et al., 2010. A novel metric for determining the
constraining effect of resources in
manufacturing via simulation. International Journal of
Production Research, DOI: 10.1080/
00207543.2010.481643 [In press].
Mital, A., et al., 1999. The need for worker training in advanced
manufacturing technology (AMT)
environments: a white paper. International Journal of Industrial
Ergonomics, 24 (1), 173–184.
Rothwell, W.J. and Kazanas, H.C., 2004. Improving on-the-job
30. training. 2nd ed. San Francisco, CA:
Pfeiffer, [1st edition July 1994].
Swamidass, P. and Schraedar, M., 2003. New directions for on-
the-job training in manufacturing.
Development and Learning in Organizations, 17 (1), 10–12.
5998 B. Kernan et al.
Copyright of International Journal of Production Research is the
property of Taylor & Francis Ltd and its
content may not be copied or emailed to multiple sites or posted
to a listserv without the copyright holder's
express written permission. However, users may print,
download, or email articles for individual use.