The document describes a diagram with 10 stages of a gear process. It encourages downloading the diagram from a website to bring presentations to life and capture audiences' attention. All images in the diagram are editable in PowerPoint by changing colors, sizes, orientations, grouping and ungrouping objects, and editing colors using Format Shape options.
Software Delivery At the Speed of AI: Inflectra Invests In AI-Powered QualityInflectra
In this insightful webinar, Inflectra explores how artificial intelligence (AI) is transforming software development and testing. Discover how AI-powered tools are revolutionizing every stage of the software development lifecycle (SDLC), from design and prototyping to testing, deployment, and monitoring.
Learn about:
• The Future of Testing: How AI is shifting testing towards verification, analysis, and higher-level skills, while reducing repetitive tasks.
• Test Automation: How AI-powered test case generation, optimization, and self-healing tests are making testing more efficient and effective.
• Visual Testing: Explore the emerging capabilities of AI in visual testing and how it's set to revolutionize UI verification.
• Inflectra's AI Solutions: See demonstrations of Inflectra's cutting-edge AI tools like the ChatGPT plugin and Azure Open AI platform, designed to streamline your testing process.
Whether you're a developer, tester, or QA professional, this webinar will give you valuable insights into how AI is shaping the future of software delivery.
UiPath Test Automation using UiPath Test Suite series, part 3DianaGray10
Welcome to UiPath Test Automation using UiPath Test Suite series part 3. In this session, we will cover desktop automation along with UI automation.
Topics covered:
UI automation Introduction,
UI automation Sample
Desktop automation flow
Pradeep Chinnala, Senior Consultant Automation Developer @WonderBotz and UiPath MVP
Deepak Rai, Automation Practice Lead, Boundaryless Group and UiPath MVP
Neuro-symbolic is not enough, we need neuro-*semantic*Frank van Harmelen
Neuro-symbolic (NeSy) AI is on the rise. However, simply machine learning on just any symbolic structure is not sufficient to really harvest the gains of NeSy. These will only be gained when the symbolic structures have an actual semantics. I give an operational definition of semantics as “predictable inference”.
All of this illustrated with link prediction over knowledge graphs, but the argument is general.
Smart TV Buyer Insights Survey 2024 by 91mobiles.pdf91mobiles
91mobiles recently conducted a Smart TV Buyer Insights Survey in which we asked over 3,000 respondents about the TV they own, aspects they look at on a new TV, and their TV buying preferences.
Search and Society: Reimagining Information Access for Radical FuturesBhaskar Mitra
The field of Information retrieval (IR) is currently undergoing a transformative shift, at least partly due to the emerging applications of generative AI to information access. In this talk, we will deliberate on the sociotechnical implications of generative AI for information access. We will argue that there is both a critical necessity and an exciting opportunity for the IR community to re-center our research agendas on societal needs while dismantling the artificial separation between the work on fairness, accountability, transparency, and ethics in IR and the rest of IR research. Instead of adopting a reactionary strategy of trying to mitigate potential social harms from emerging technologies, the community should aim to proactively set the research agenda for the kinds of systems we should build inspired by diverse explicitly stated sociotechnical imaginaries. The sociotechnical imaginaries that underpin the design and development of information access technologies needs to be explicitly articulated, and we need to develop theories of change in context of these diverse perspectives. Our guiding future imaginaries must be informed by other academic fields, such as democratic theory and critical theory, and should be co-developed with social science scholars, legal scholars, civil rights and social justice activists, and artists, among others.
LF Energy Webinar: Electrical Grid Modelling and Simulation Through PowSyBl -...DanBrown980551
Do you want to learn how to model and simulate an electrical network from scratch in under an hour?
Then welcome to this PowSyBl workshop, hosted by Rte, the French Transmission System Operator (TSO)!
During the webinar, you will discover the PowSyBl ecosystem as well as handle and study an electrical network through an interactive Python notebook.
PowSyBl is an open source project hosted by LF Energy, which offers a comprehensive set of features for electrical grid modelling and simulation. Among other advanced features, PowSyBl provides:
- A fully editable and extendable library for grid component modelling;
- Visualization tools to display your network;
- Grid simulation tools, such as power flows, security analyses (with or without remedial actions) and sensitivity analyses;
The framework is mostly written in Java, with a Python binding so that Python developers can access PowSyBl functionalities as well.
What you will learn during the webinar:
- For beginners: discover PowSyBl's functionalities through a quick general presentation and the notebook, without needing any expert coding skills;
- For advanced developers: master the skills to efficiently apply PowSyBl functionalities to your real-world scenarios.
State of ICS and IoT Cyber Threat Landscape Report 2024 previewPrayukth K V
The IoT and OT threat landscape report has been prepared by the Threat Research Team at Sectrio using data from Sectrio, cyber threat intelligence farming facilities spread across over 85 cities around the world. In addition, Sectrio also runs AI-based advanced threat and payload engagement facilities that serve as sinks to attract and engage sophisticated threat actors, and newer malware including new variants and latent threats that are at an earlier stage of development.
The latest edition of the OT/ICS and IoT security Threat Landscape Report 2024 also covers:
State of global ICS asset and network exposure
Sectoral targets and attacks as well as the cost of ransom
Global APT activity, AI usage, actor and tactic profiles, and implications
Rise in volumes of AI-powered cyberattacks
Major cyber events in 2024
Malware and malicious payload trends
Cyberattack types and targets
Vulnerability exploit attempts on CVEs
Attacks on counties – USA
Expansion of bot farms – how, where, and why
In-depth analysis of the cyber threat landscape across North America, South America, Europe, APAC, and the Middle East
Why are attacks on smart factories rising?
Cyber risk predictions
Axis of attacks – Europe
Systemic attacks in the Middle East
Download the full report from here:
https://sectrio.com/resources/ot-threat-landscape-reports/sectrio-releases-ot-ics-and-iot-security-threat-landscape-report-2024/
Let's dive deeper into the world of ODC! Ricardo Alves (OutSystems) will join us to tell all about the new Data Fabric. After that, Sezen de Bruijn (OutSystems) will get into the details on how to best design a sturdy architecture within ODC.
JMeter webinar - integration with InfluxDB and GrafanaRTTS
Watch this recorded webinar about real-time monitoring of application performance. See how to integrate Apache JMeter, the open-source leader in performance testing, with InfluxDB, the open-source time-series database, and Grafana, the open-source analytics and visualization application.
In this webinar, we will review the benefits of leveraging InfluxDB and Grafana when executing load tests and demonstrate how these tools are used to visualize performance metrics.
Length: 30 minutes
Session Overview
-------------------------------------------
During this webinar, we will cover the following topics while demonstrating the integrations of JMeter, InfluxDB and Grafana:
- What out-of-the-box solutions are available for real-time monitoring JMeter tests?
- What are the benefits of integrating InfluxDB and Grafana into the load testing stack?
- Which features are provided by Grafana?
- Demonstration of InfluxDB and Grafana using a practice web application
To view the webinar recording, go to:
https://www.rttsweb.com/jmeter-integration-webinar
GenAISummit 2024 May 28 Sri Ambati Keynote: AGI Belongs to The Community in O...
Interconnected gear pieces smart arts process 10 stages style 2 powerpoint diagrams and powerpoint templates
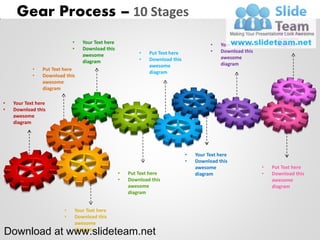
1. Gear Process – 10 Stages
• Put Text here
• Download this
awesome
• Your Text here • Your Text here diagram
• Download this • Download this
awesome • Put Text here
• Download this awesome
diagram diagram
awesome
• Put Text here
diagram
• Download this
awesome
diagram
• Your Text here
• Download this
awesome
diagram
• Your Text here
• Download this
awesome • Put Text here
• Put Text here diagram • Download this
• Download this awesome
awesome diagram
diagram
• Your Text here
• Download this
awesome
Download at www.slideteam.net diagram
2. Gear Process – 10 Stages
Put Text Here
Your Text Goes here. Download this awesome diagram. Bring your presentation to life.
Capture your audience’s attention. All images are 100% editable in powerpoint . Your
Text Goes here. Download this awesome diagram. Bring your presentation to life.
Download at www.slideteam.net Your Log
3. Gear Process – 10 Stages
Your Text Here
Your Text Goes here. Download this awesome diagram. Bring your presentation to life.
Capture your audience’s attention. All images are 100% editable in powerpoint . Your
Text Goes here. Download this awesome diagram. Bring your presentation to life.
Download at www.slideteam.net Your Log
4. Gear Process – 10 Stages
Put Text Here
Your Text Goes here. Download this awesome diagram. Bring your presentation to life.
Capture your audience’s attention. All images are 100% editable in powerpoint . Your
Text Goes here. Download this awesome diagram. Bring your presentation to life.
Download at www.slideteam.net Your Log
5. Gear Process – 10 Stages
Your Text Here
Your Text Goes here. Download this awesome diagram. Bring your presentation to life.
Capture your audience’s attention. All images are 100% editable in powerpoint . Your
Text Goes here. Download this awesome diagram. Bring your presentation to life.
Download at www.slideteam.net Your Log
6. Gear Process – 10 Stages
Put Text Here
Your Text Goes here. Download this awesome diagram. Bring your presentation to life.
Capture your audience’s attention. All images are 100% editable in powerpoint . Your
Text Goes here. Download this awesome diagram. Bring your presentation to life.
Download at www.slideteam.net Your Log
7. Gear Process – 10 Stages
Your Text Here
Your Text Goes here. Download this awesome diagram. Bring your presentation to life.
Capture your audience’s attention. All images are 100% editable in powerpoint . Your
Text Goes here. Download this awesome diagram. Bring your presentation to life.
Download at www.slideteam.net Your Log
8. Gear Process – 10 Stages
Put Text Here
Your Text Goes here. Download this awesome diagram. Bring your presentation to life.
Capture your audience’s attention. All images are 100% editable in powerpoint . Your
Text Goes here. Download this awesome diagram. Bring your presentation to life.
Download at www.slideteam.net Your Log
9. Gear Process – 10 Stages
Your Text Here
Your Text Goes here. Download this awesome diagram. Bring your presentation to life.
Capture your audience’s attention. All images are 100% editable in powerpoint . Your
Text Goes here. Download this awesome diagram. Bring your presentation to life.
Download at www.slideteam.net Your Log
10. Gear Process – 10 Stages
Put Text Here
Your Text Goes here. Download this awesome diagram. Bring your presentation to life.
Capture your audience’s attention. All images are 100% editable in powerpoint . Your
Text Goes here. Download this awesome diagram. Bring your presentation to life.
Download at www.slideteam.net Your Log
11. Gear Process – 10 Stages
Your Text Here
Your Text Goes here. Download this awesome diagram. Bring your presentation to life.
Capture your audience’s attention. All images are 100% editable in powerpoint . Your
Text Goes here. Download this awesome diagram. Bring your presentation to life.
Download at www.slideteam.net Your Log
12. All images are 100% editable in Powerpoint
“Change color, size and orientation of any icon to your liking”
Download at www.slideteam.net
13. Ungrouping the object
1
3
1. Right click the object.
2. Choose Group and then Ungroup.
3. Click beside the object and drag the arrow over it.
Download at www.slideteam.net
14. Edit Color
2 3
1
1. Select the shape to change the color and Right click the object( click any object which you
want to change color)
2. Choose Format Shape in the dialog box.
3. Choose “Fill” in the Format Shape box then “Solid” or “Gradient” depending on the
appearance of the object. Change colour as shown in the picture.
Download at www.slideteam.net