Download as PDF, PPTX


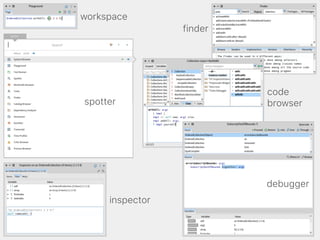


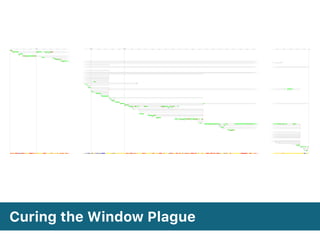
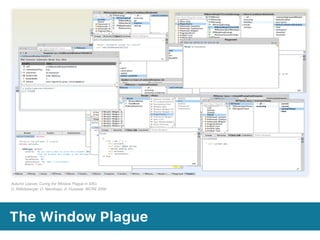
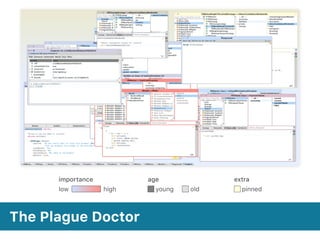
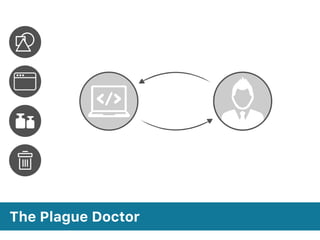
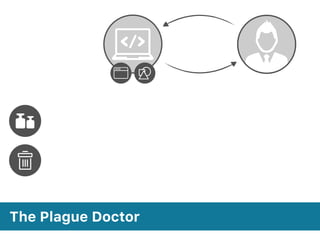
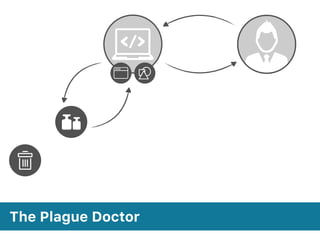
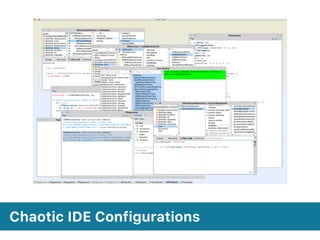
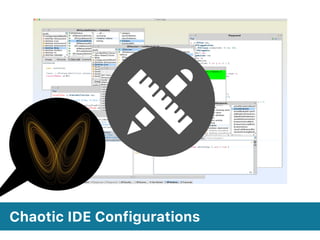
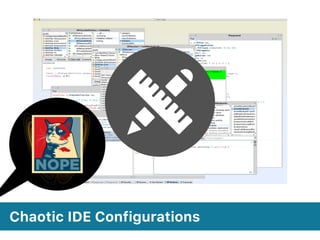
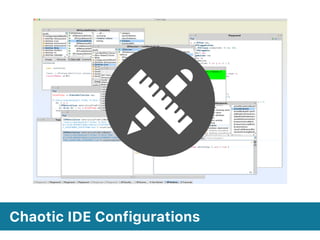
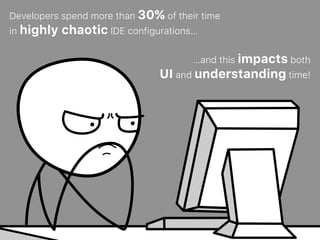
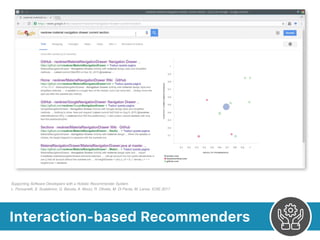
![“[…] developers using a modern IDE are forced to
open views on numerous source artifacts to reveal
[these] hidden relationships, leading to a crowded
workspace with many opened windows or tabs.”
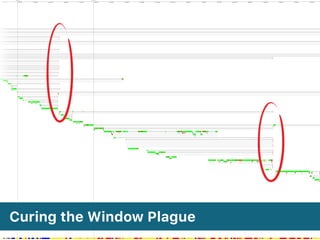
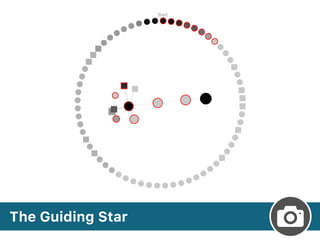
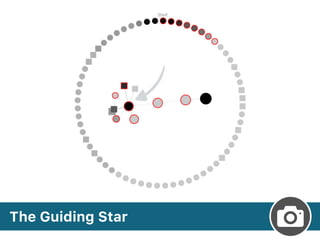
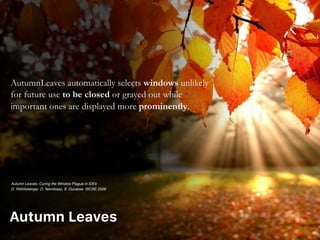
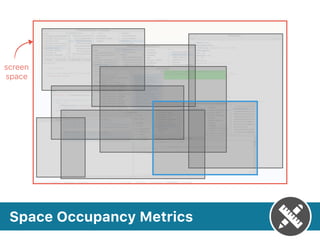
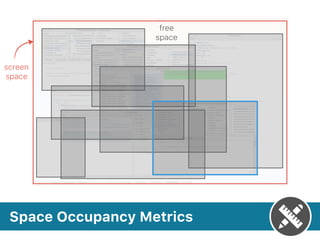
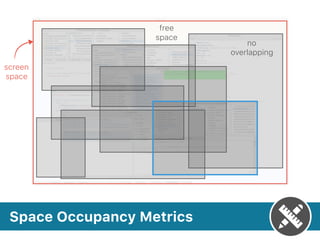
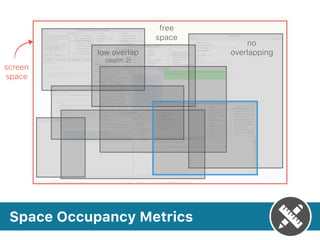
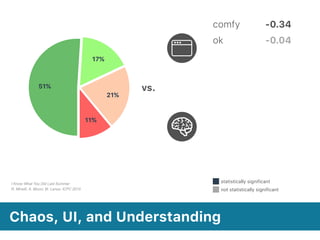
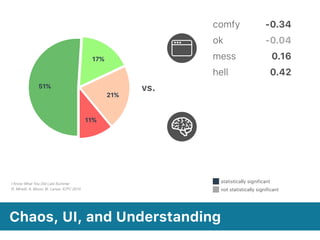
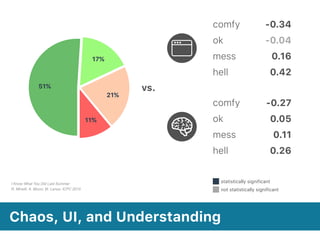
Curing the Window Plague
Autumn Leaves: Curing the Window Plague in IDEs
D. Röthlisberger, O. Nierstrasz, S. Ducasse. WCRE 2009](https://image.slidesharecdn.com/robertominelli-doctoraldissertation-171115095150/85/Interaction-Aware-Development-Environments-115-320.jpg)


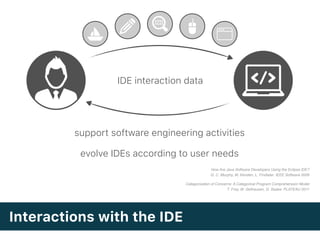
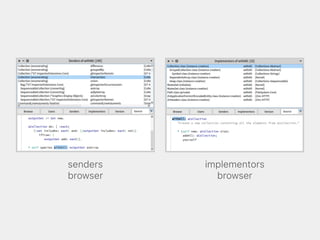
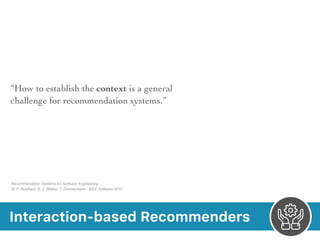
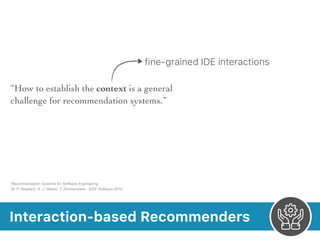
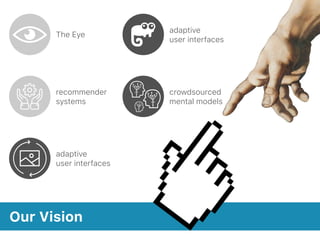
![Interaction-based Recommenders
“[…] tools that provide information items that are
estimated to be valuable for a software engineering
task in a given context.”
Recommendation Systems for Software Engineering
M. P. Robillard, R. J. Walker, T. Zimmermann.. IEEE Software 2010](https://image.slidesharecdn.com/robertominelli-doctoraldissertation-171115095150/85/Interaction-Aware-Development-Environments-221-320.jpg)
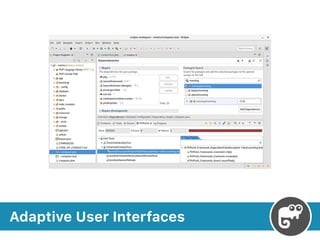
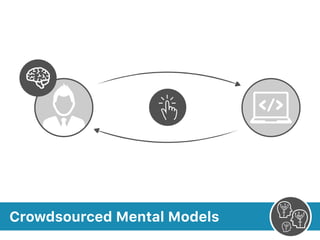


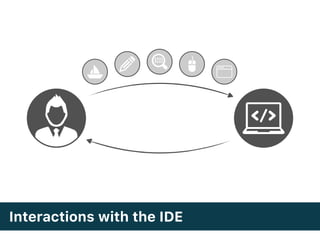
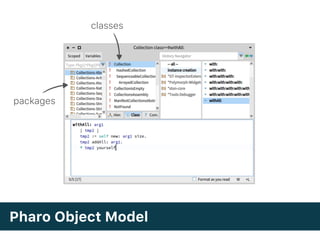
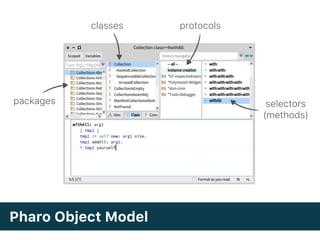
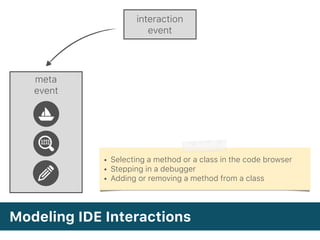
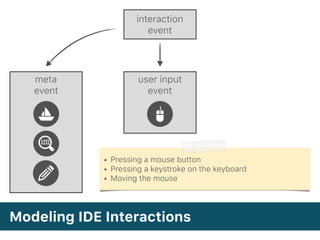
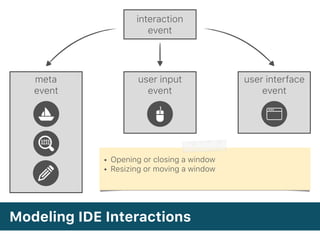
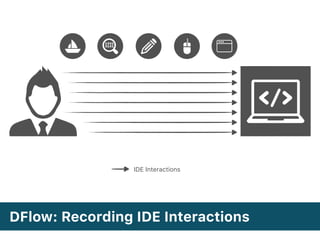
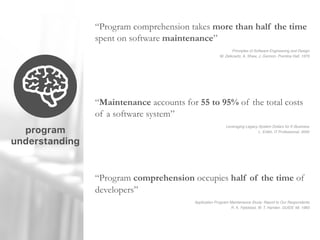
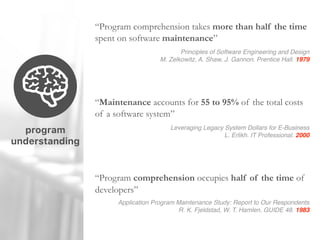
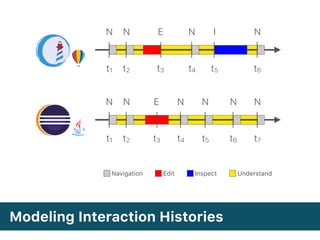
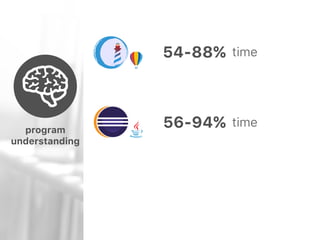
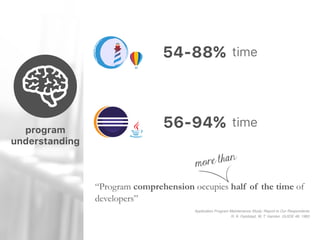
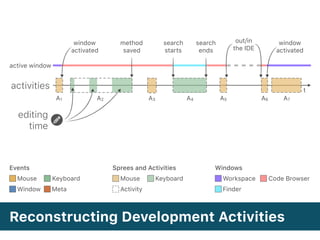
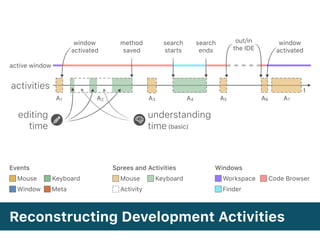
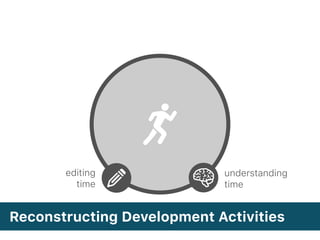
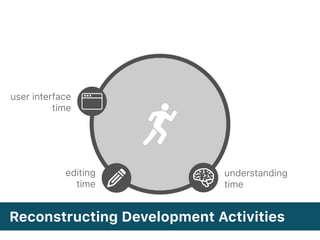
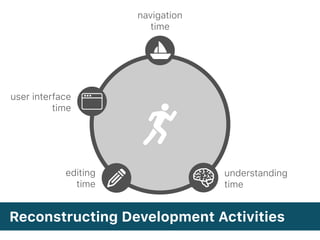
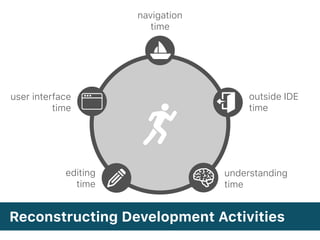
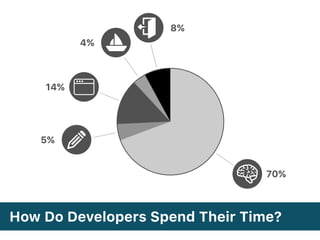
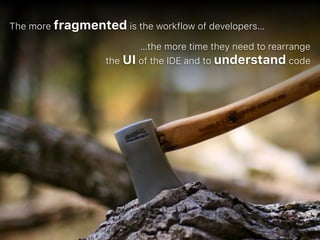
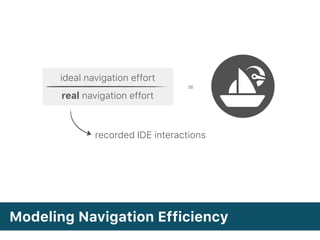
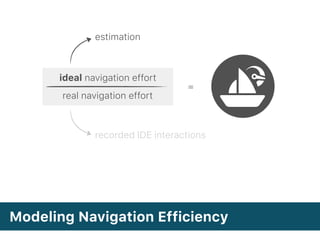
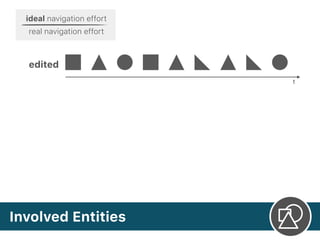
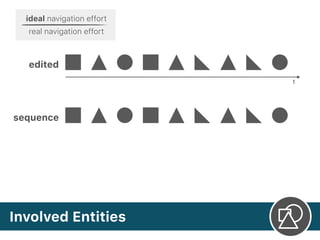
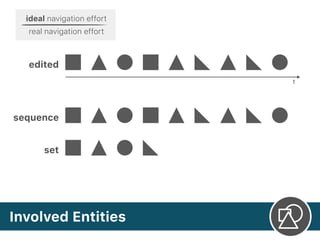
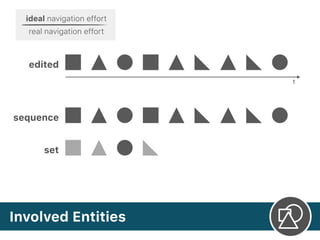
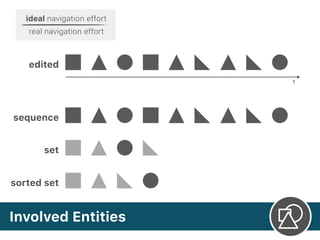
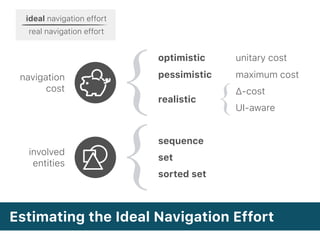
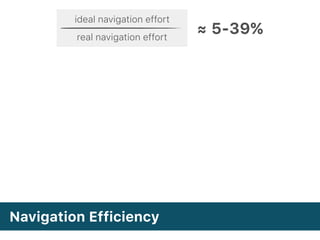
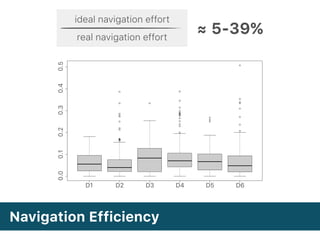
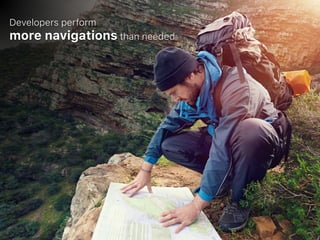
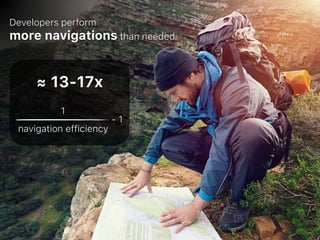
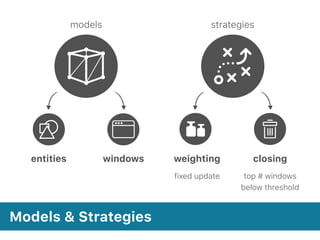
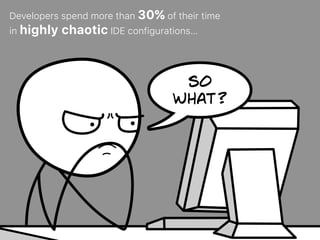
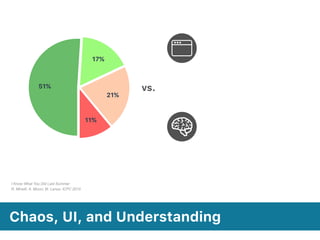
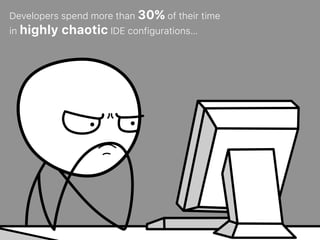
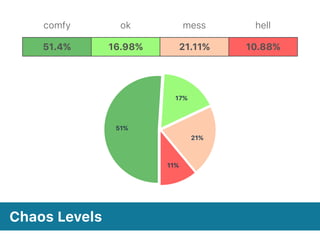
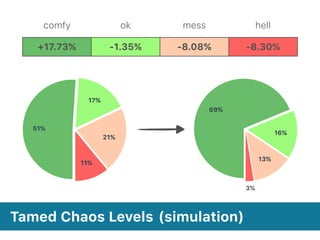
The document discusses the research on interaction-aware development environments, particularly focusing on analyzing and interpreting interactions within Integrated Development Environments (IDEs) to support software engineers. It highlights how developers' navigation efficiencies and behaviors can be enhanced through understanding recorded interaction data, which ultimately aims to improve software maintenance practices. The findings emphasize the significant amount of time developers spend on program comprehension and the inefficiencies caused by fragmented workflows within chaotic IDE configurations.


![Visual Storytelling of Development Sessions [ICSME2014]](https://cdn.slidesharecdn.com/ss_thumbnails/roby-icsme2014-era-150420105021-conversion-gate01-thumbnail.jpg?width=640&height=640&fit=bounds)

![I Know What You Did Last Summer [ICPC 2025 MIP Award]](https://cdn.slidesharecdn.com/ss_thumbnails/icpc2015-mip-talk-250516095029-b79a4ccf-thumbnail.jpg?width=640&height=640&fit=bounds)
![Towards Self-Adaptive IDEs [ICSME2014]](https://cdn.slidesharecdn.com/ss_thumbnails/roby-icsme2014-doctoral-150420104711-conversion-gate01-thumbnail.jpg?width=640&height=640&fit=bounds)
![Visualizing the Workflow of Developers [VISSOFT2013]](https://cdn.slidesharecdn.com/ss_thumbnails/dflow-vissoft-2013-130928052045-phpapp02-thumbnail.jpg?width=640&height=640&fit=bounds)


![SYN: Ultra-Scale
Software Evolution Comprehension [ICPC 2023]](https://cdn.slidesharecdn.com/ss_thumbnails/gianlo-icpc2023-td-230601075503-1be84b82-thumbnail.jpg?width=640&height=640&fit=bounds)


![Free Hugs — Praising developers for their actions [ICSE2015]](https://cdn.slidesharecdn.com/ss_thumbnails/roby-icse2015-nier-150520114654-lva1-app6891-thumbnail.jpg?width=640&height=640&fit=bounds)
![Quantifying Program Comprehension with Interaction Data [QSIC2014]](https://cdn.slidesharecdn.com/ss_thumbnails/roby-qsic2014-150420105439-conversion-gate02-thumbnail.jpg?width=640&height=640&fit=bounds)
![Visualizing Developer Interactions [VISSOFT2014]](https://cdn.slidesharecdn.com/ss_thumbnails/roby-vissoft2014-150420105259-conversion-gate01-thumbnail.jpg?width=640&height=640&fit=bounds)
![SAMOA – A Visual Software Analytics Platform for Mobile Applications [ICSM2013]](https://cdn.slidesharecdn.com/ss_thumbnails/minelli-samoa-icsm-td-130928051707-phpapp01-thumbnail.jpg?width=640&height=640&fit=bounds)


