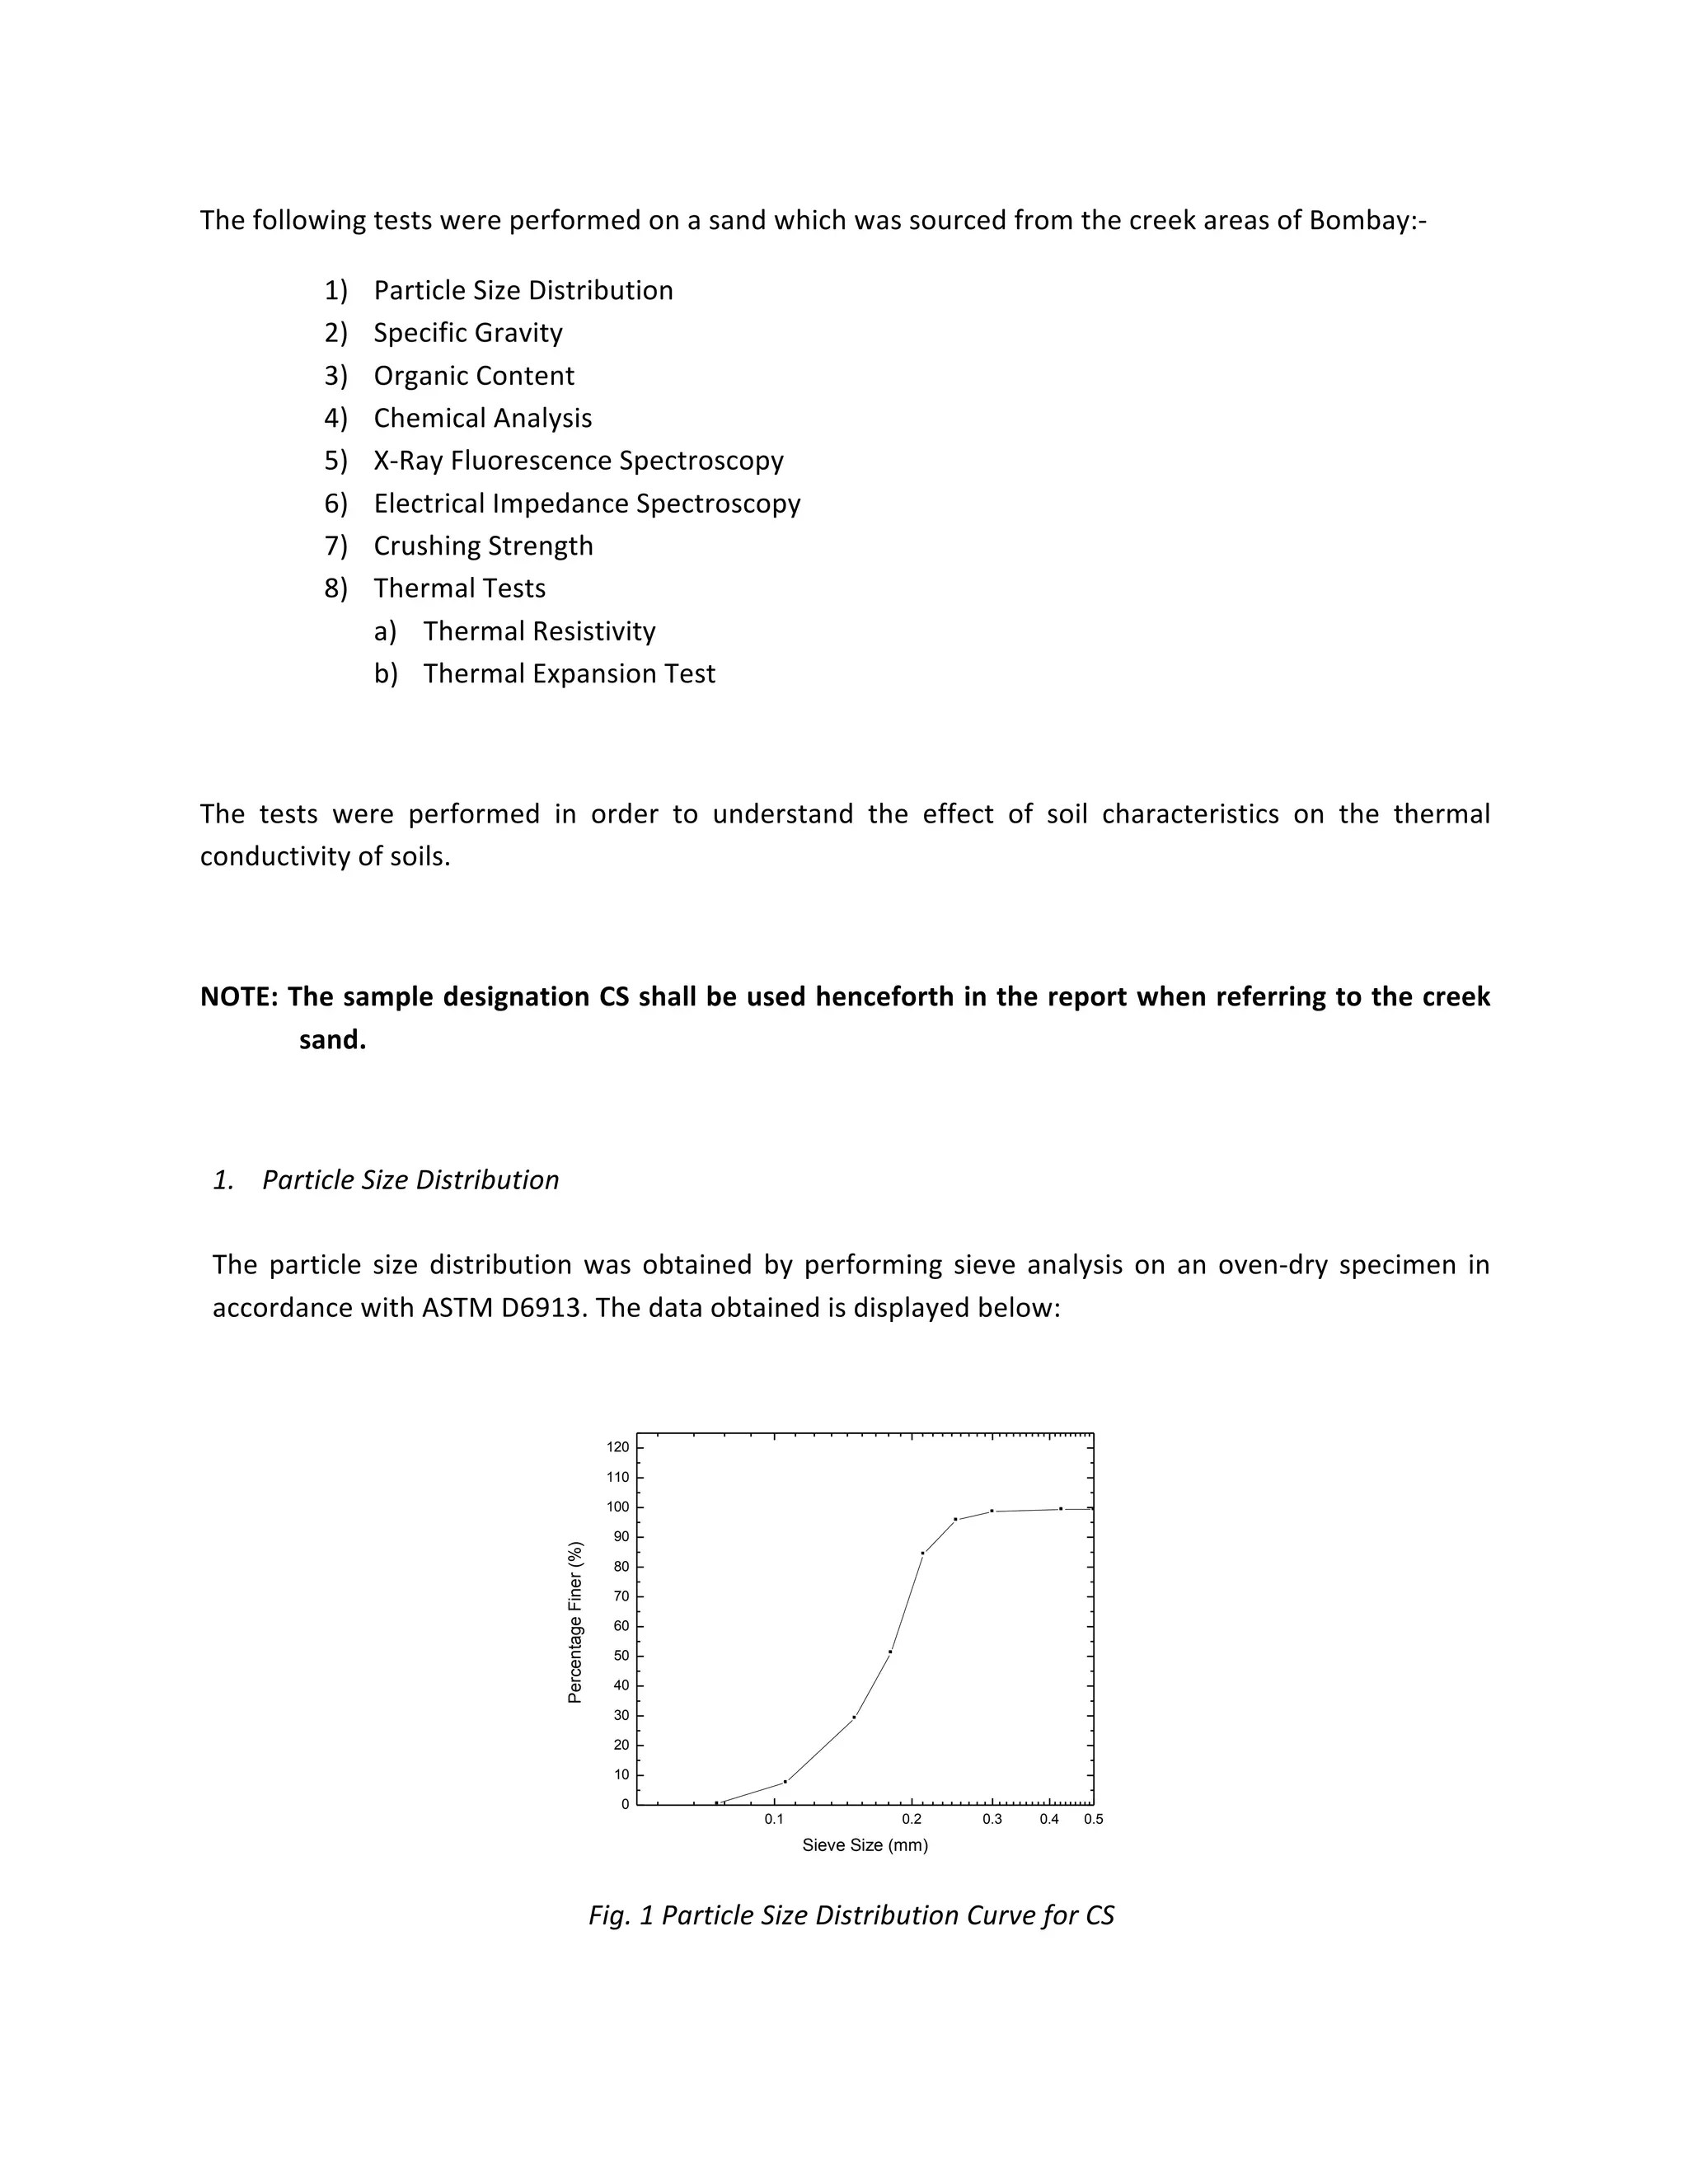
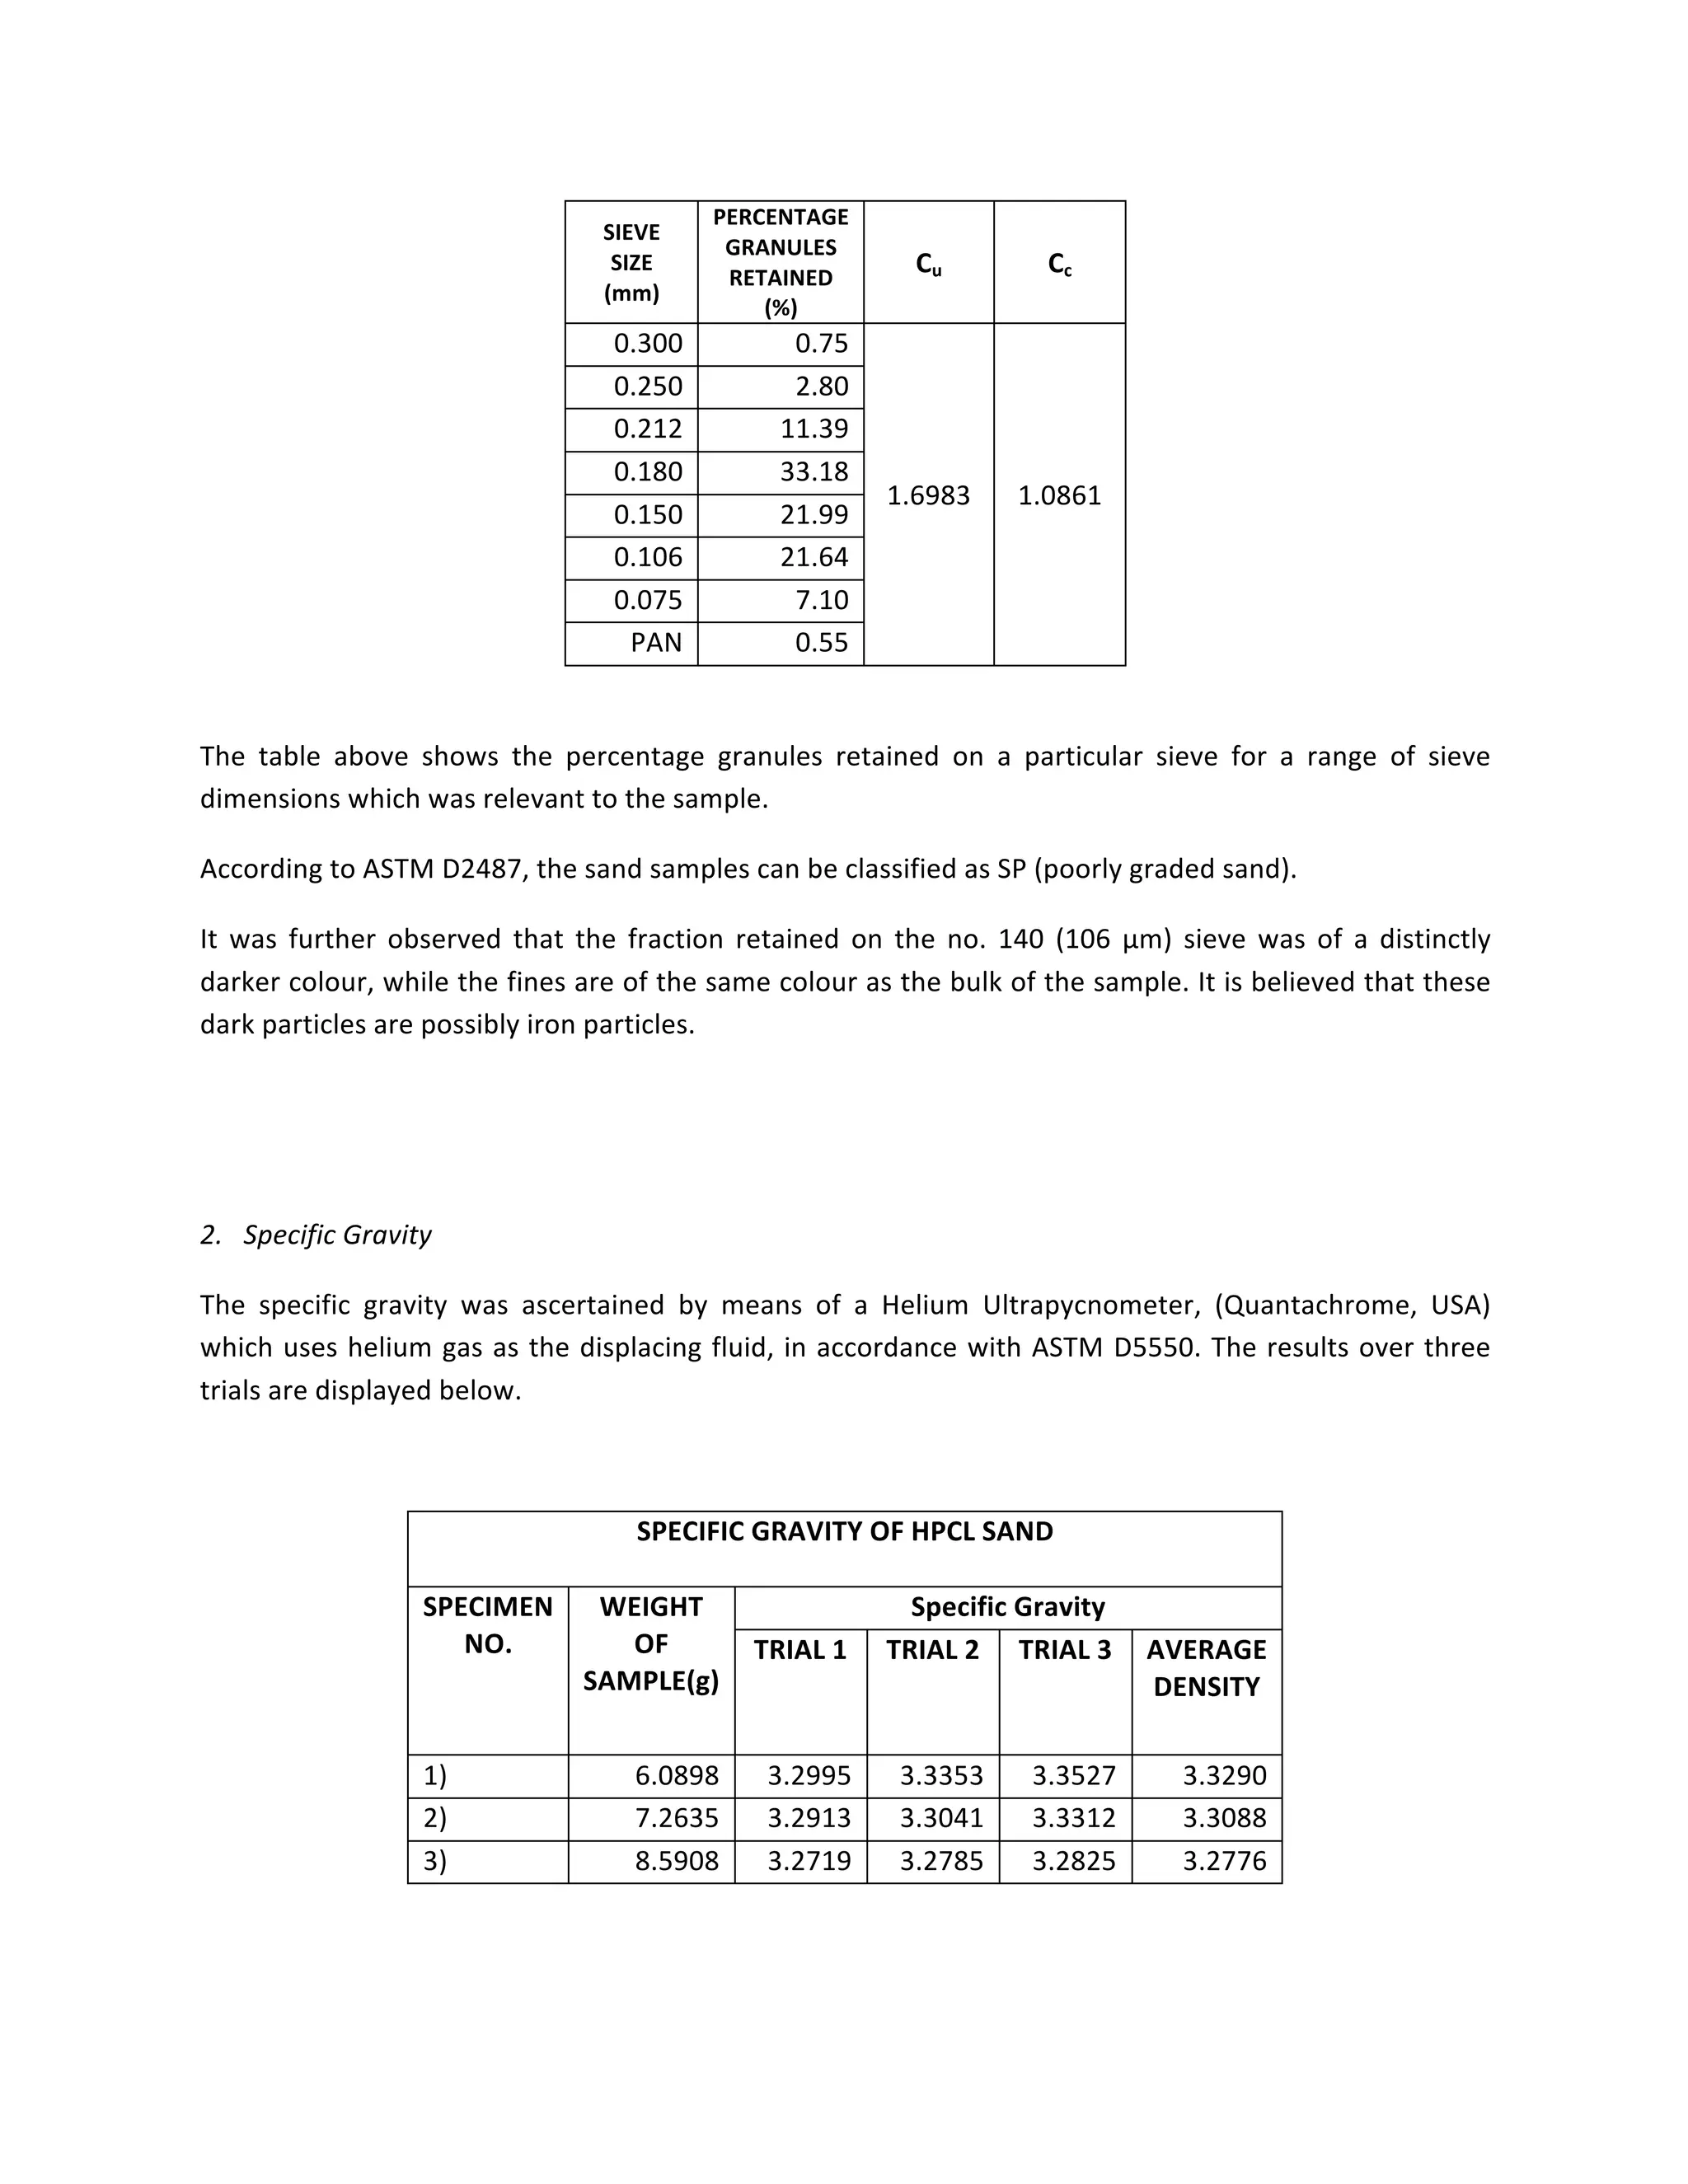
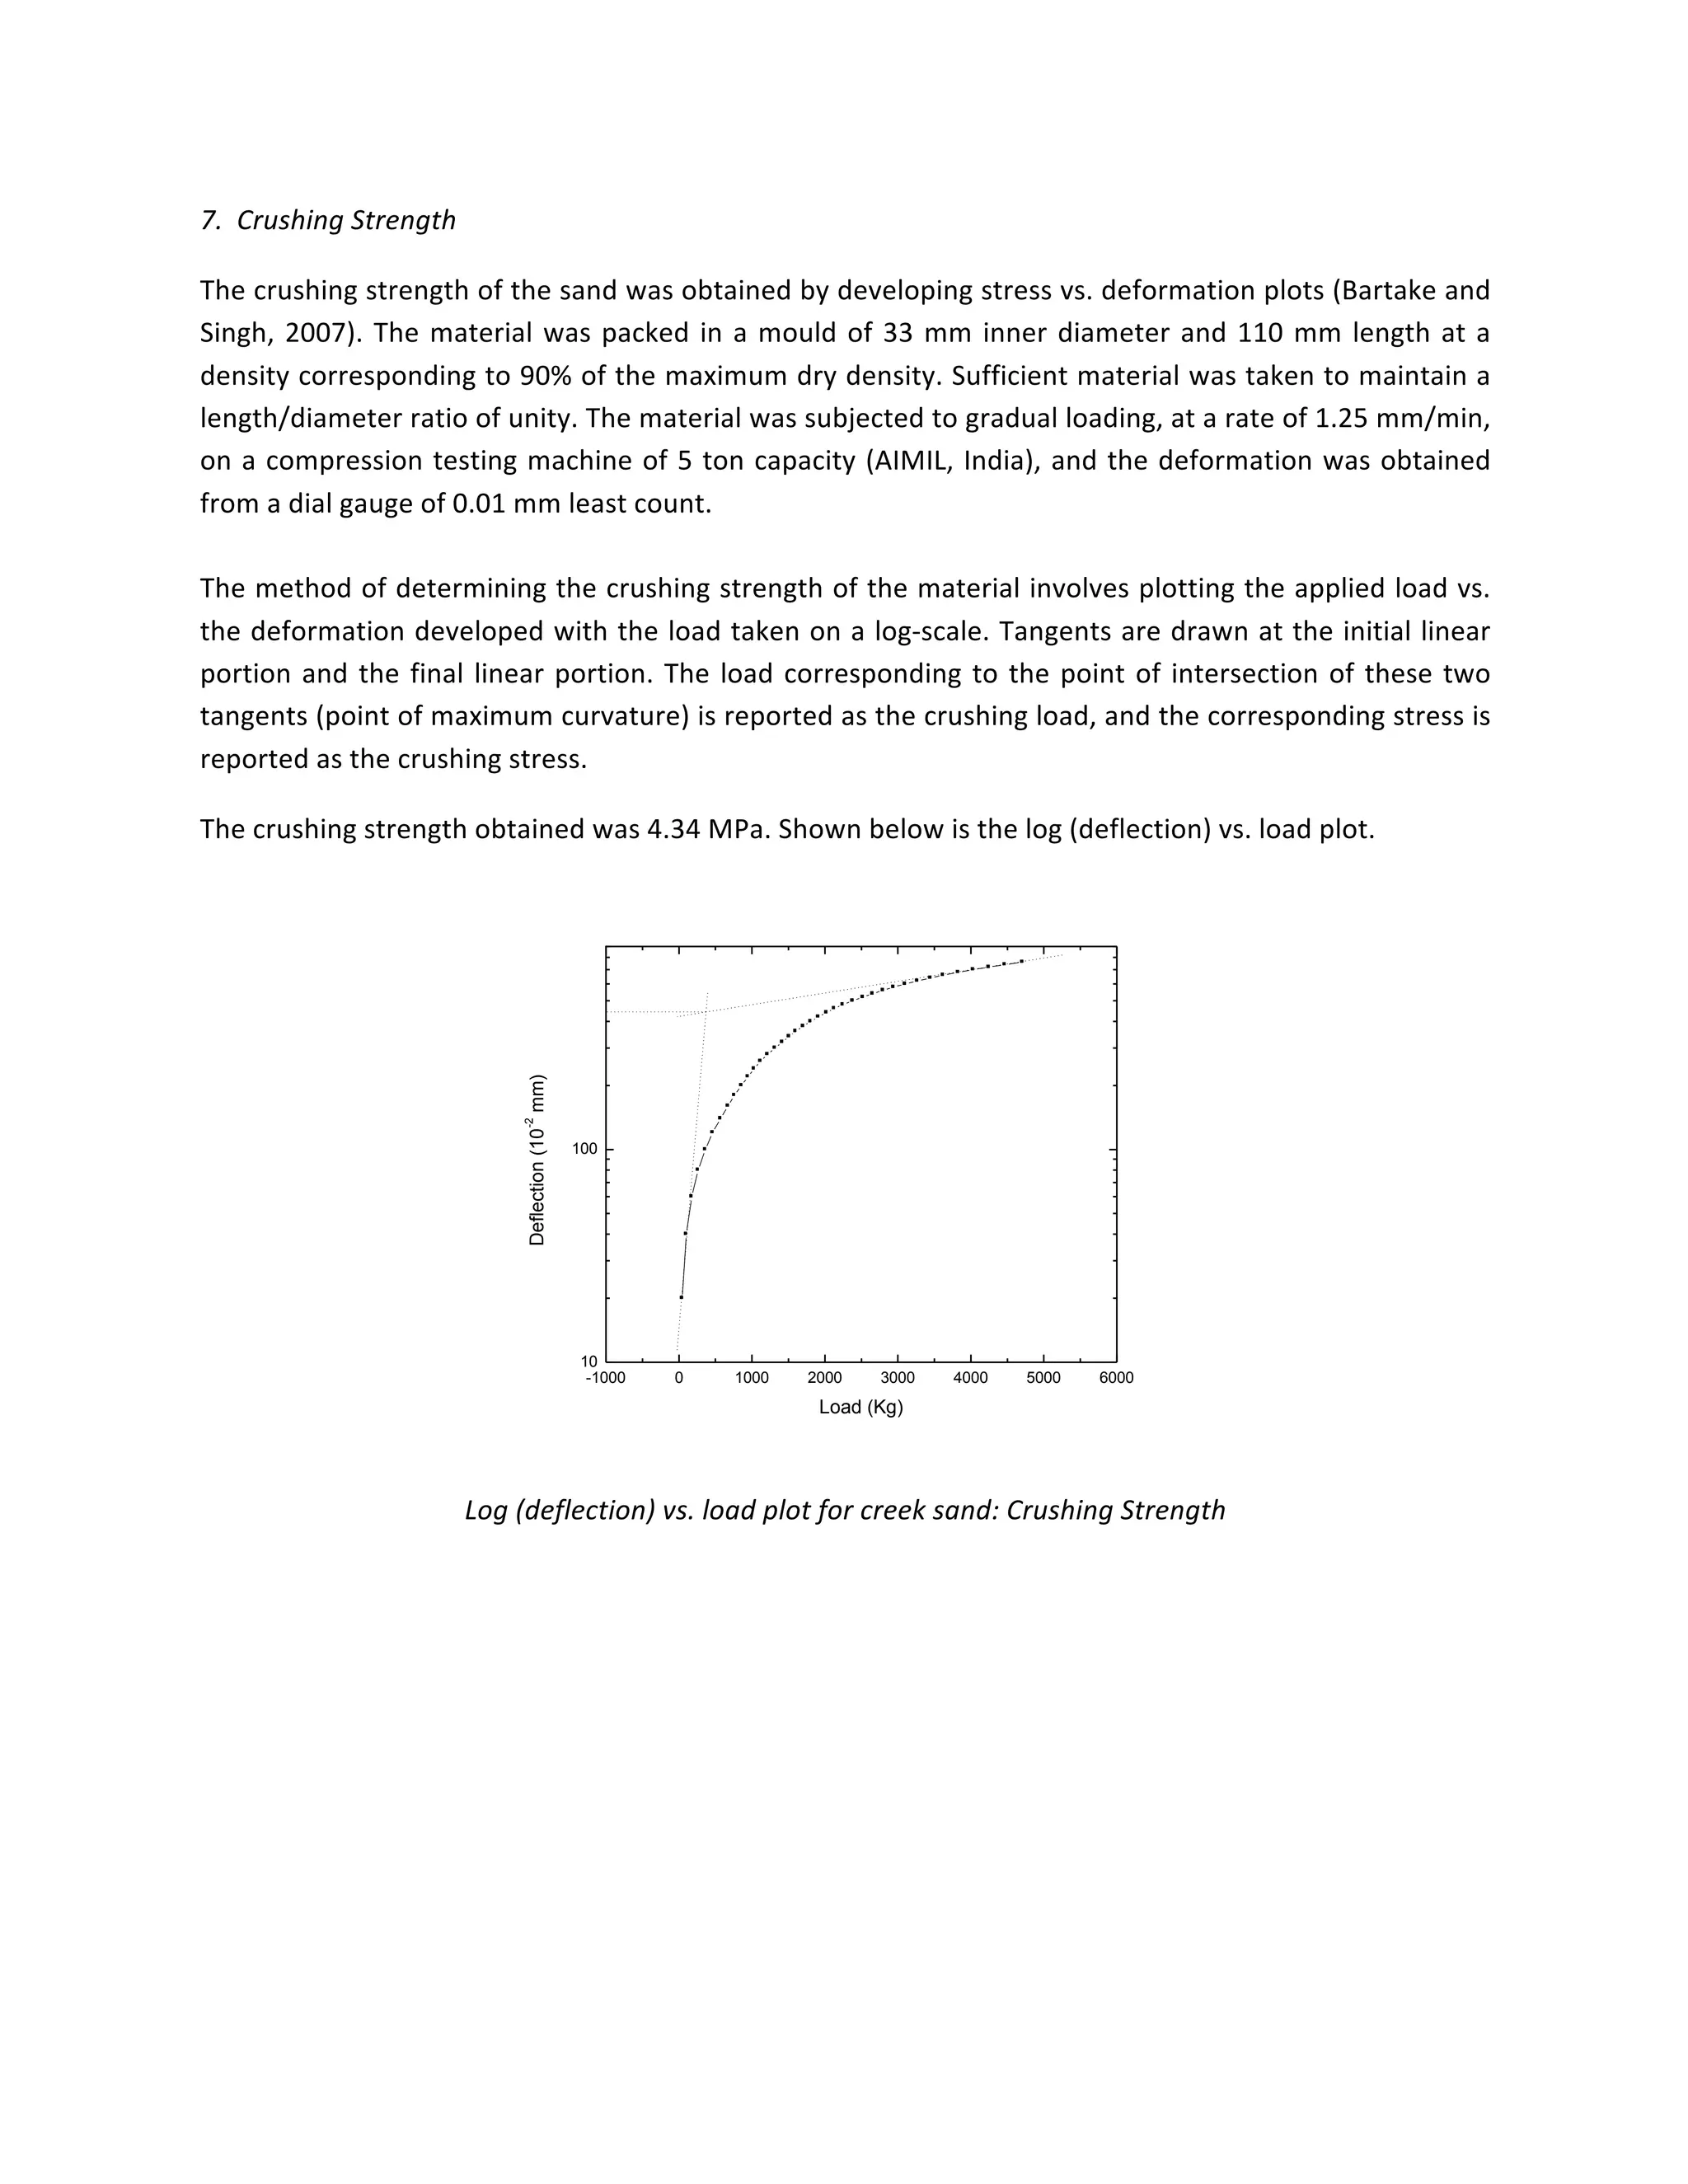
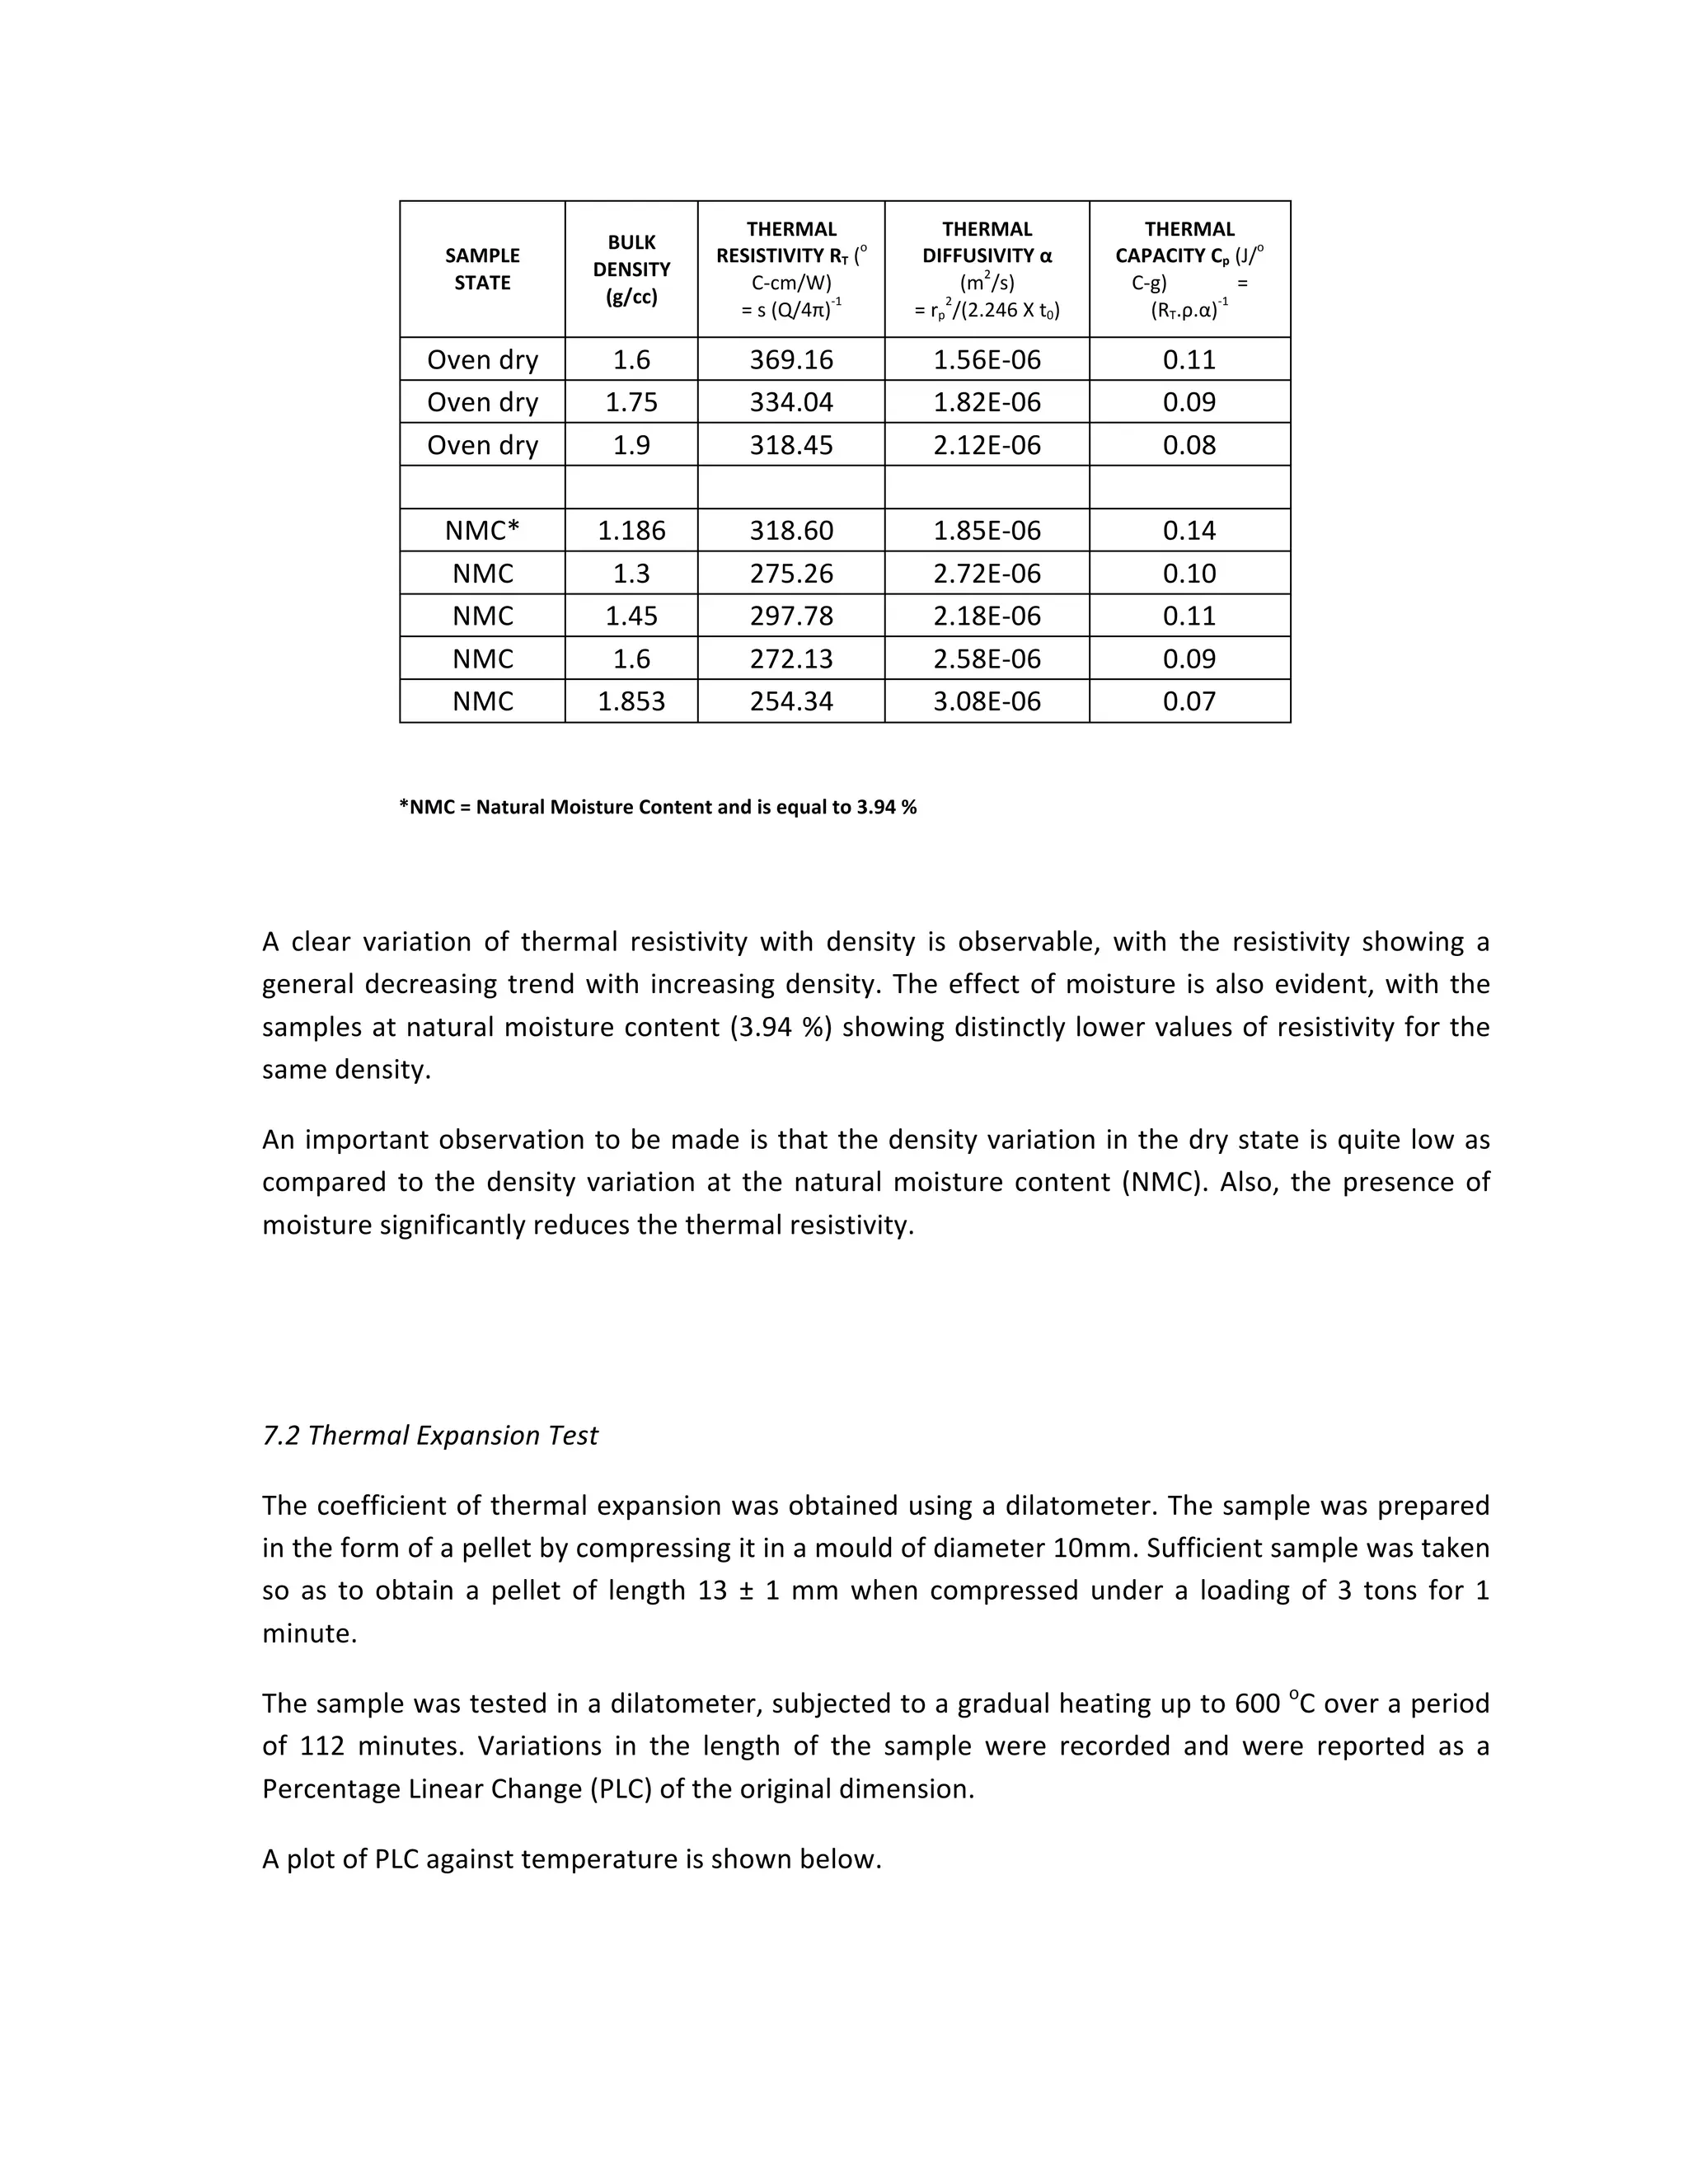
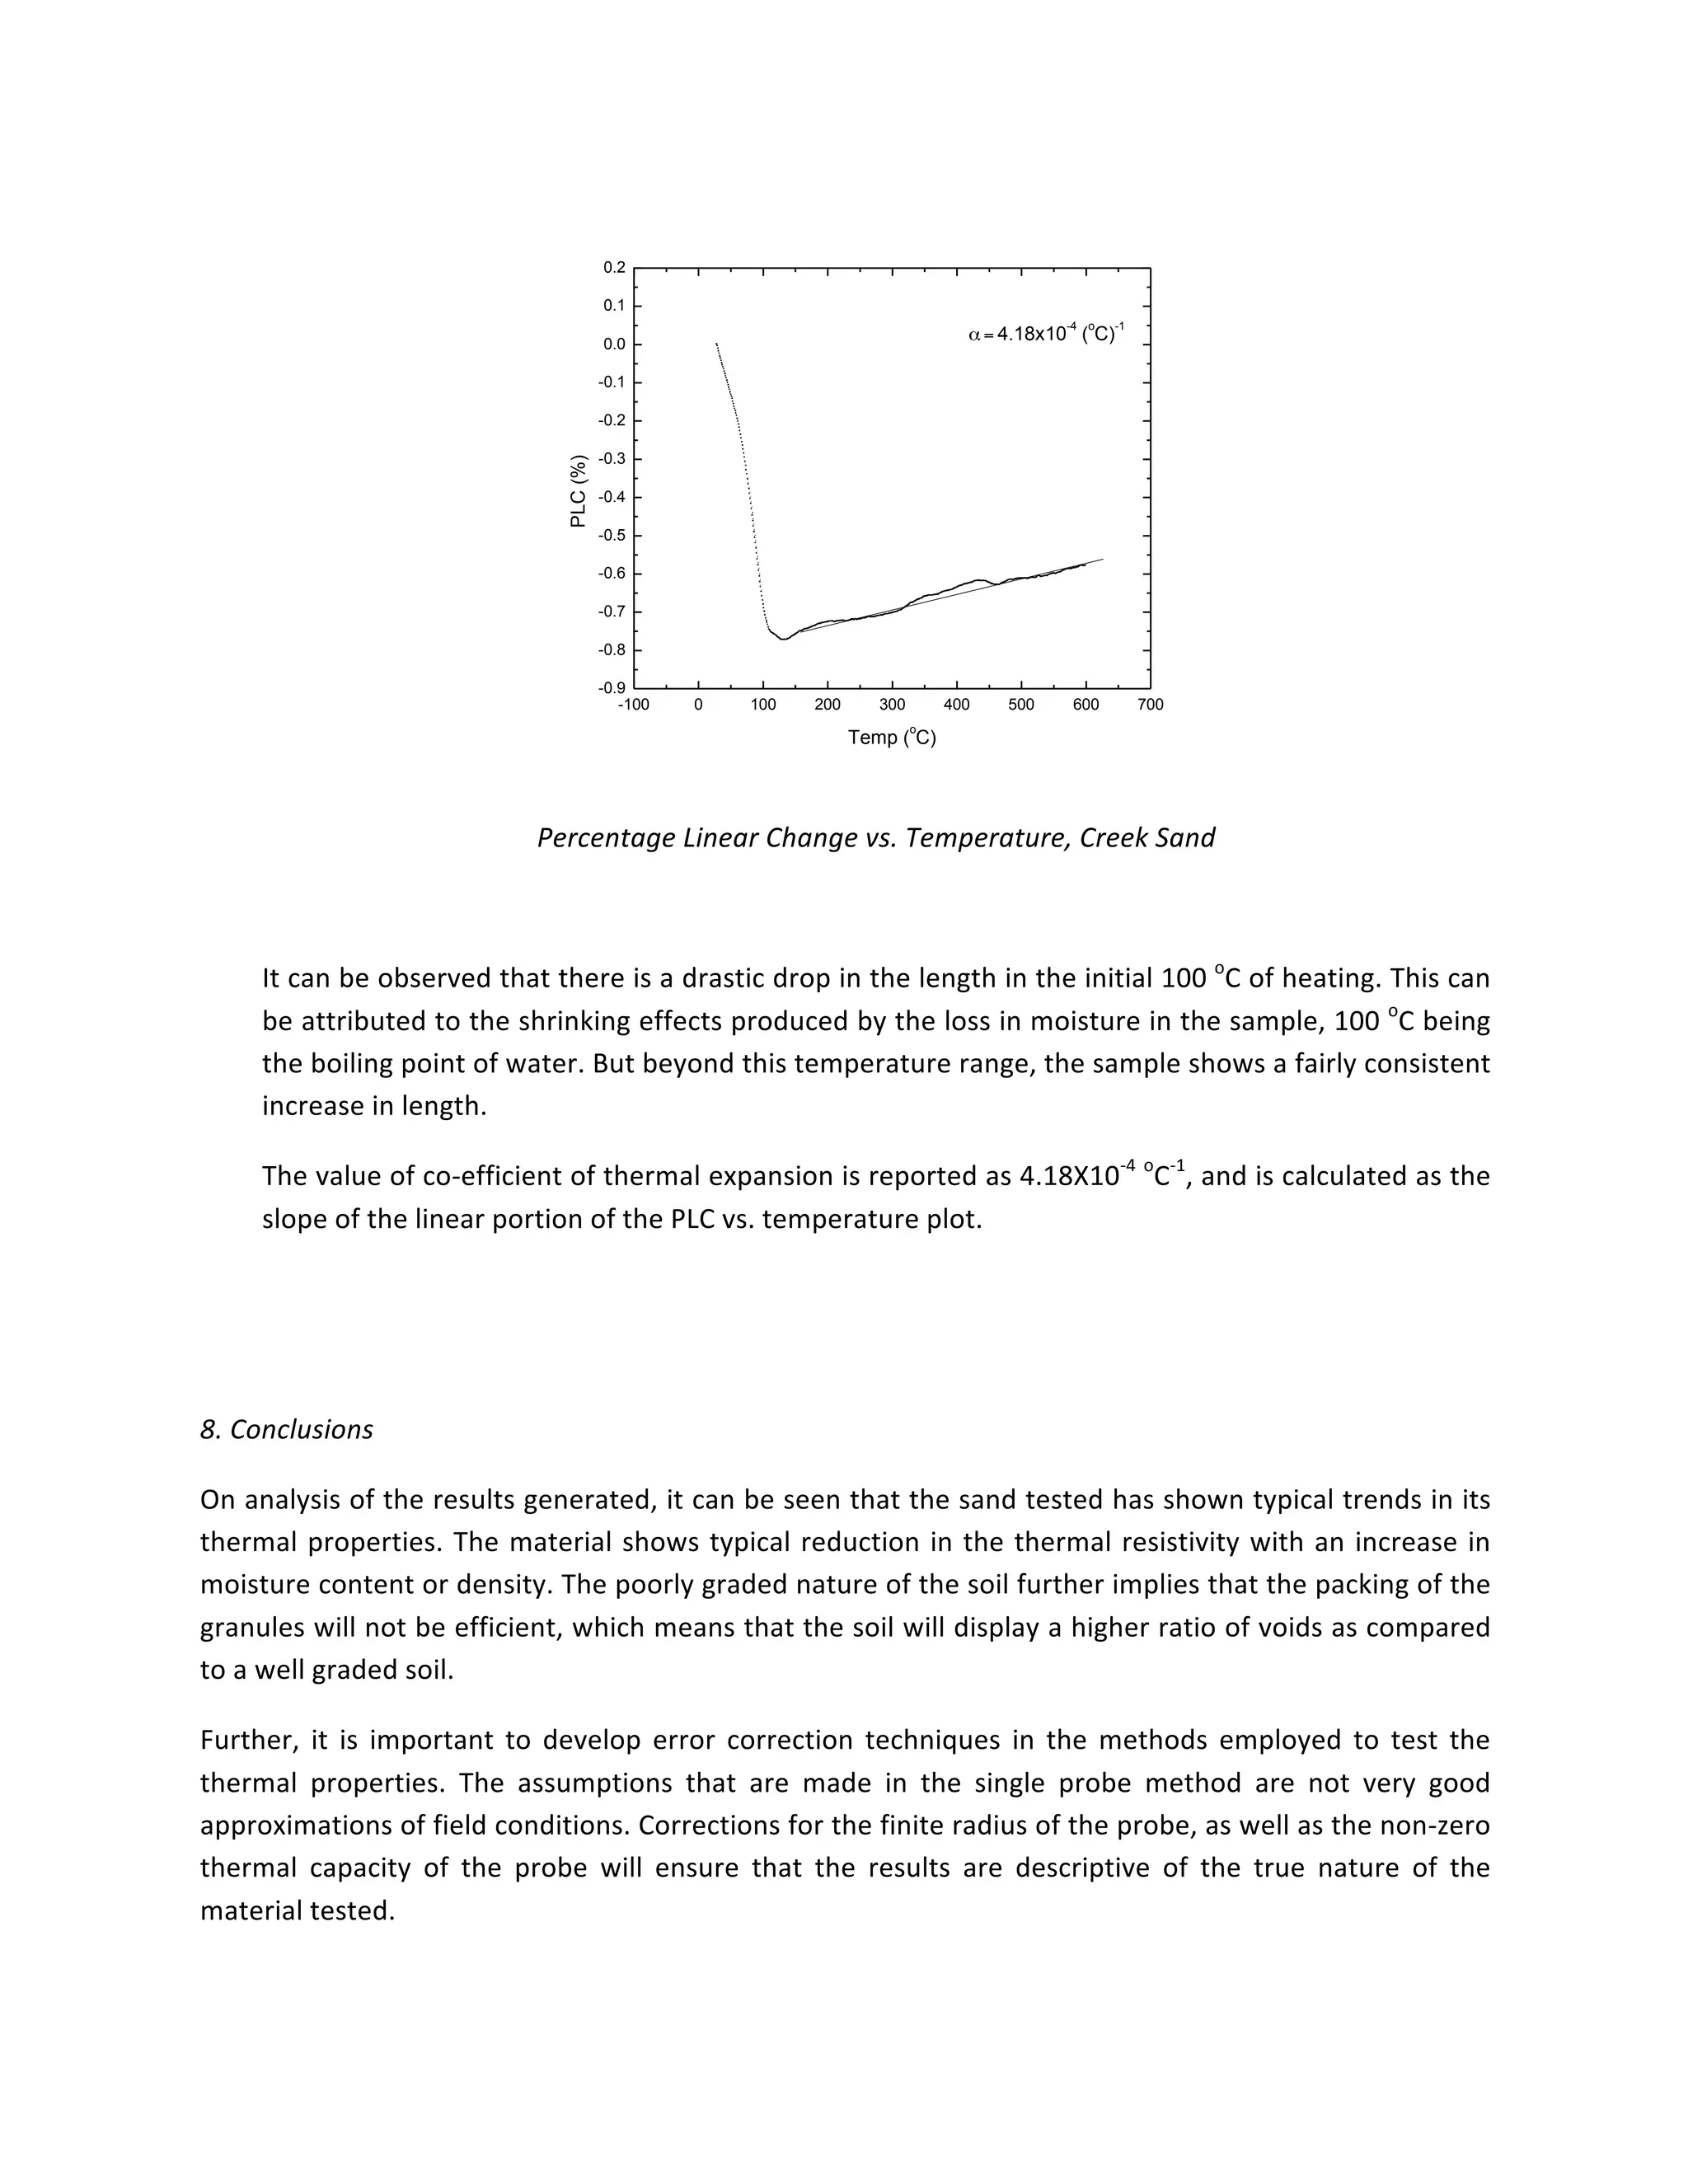
SlideShare a Scribd company logo
INDIAN	ACADEMY	OF	SCIENCES	
SUMMER	FELLOWSHIP	
	
	
FINAL	REPORT	


Project	completed	under	the	guidance	of	
Professor	DN	Singh	
Department	of	Civil	Engineering,	
Indian	Institute	of	Technology,	Bombay	


Submitted	by,	
Arjun	Narayanan	
IAS	Application	No:	ENGS	266
1.		Introduction	
Thermal	properties	of	soil	are	an	important	set	of	parameters	that	are	to	be	obtained	in	order	to	be	able	
to	estimate	the	heat	flow	through	soil	under	the	influence	of	a	temperature	gradient.	This	is	particularly	
important	for	underground	power	cables,	foundation	design	of	chemical	plants	or	power	plants,	and	
nuclear	waste	repositories.	
The	important	thermal	properties	of	a	material	are:-	
a) Thermal	Resistivity:	The	ease	with	which	heat	can	flow	through	a	material	of	given	dimension	
under	a	given	temperature	gradient.	
b) Thermal	Heat	Capacity:	The	heat	required	to	raise	a	unit	mass	of	a	substance	by	a	unit	Kelvin.	
c) Thermal	 Diffusivity:	 It	 is	 a	 measure	 of	 the	 lag	 in	 heat	 transfer	 through	 a	 material,	 often	
described	as	‘thermal	inertia’.	It	is	obtained	by	dividing	the	thermal	conductivity	of	a	material	by	
its	density	and	thermal	capacity.	
The	thermal	properties	are	strong	functions	of	numerous	soil	parameters	like:-	
1) Particle	Size		
Soils	composed	smaller	granules	show	a	lower	thermal	resistivity	than	soils	composed	of	larger	
granules	 (Singh	 and	 Devid,	 2000).	 Also,	 well	 graded	 soils	 show	 lower	 thermal	 resistivity	 as	
compared	to	poorly	graded	or	uniformly	graded	soils	(Campbell	and	Bristow,	2009).	The	main	
factor	at	play	here	is	the	presence	of	air	voids,	which	have	a	thermal	resistivity	of	4000	o
C-cm/W	
as	compared	to	soil	solids	which	show	a	resistivity	of	4	o
C-cm/W	(Erzin,	Rao	and	Singh,	2007).	
	
2) Moisture	Content	
Soils	 with	 higher	 moisture	 content	 show	 a	 lower	 thermal	 resistivity	 than	 dry	 soils	 (Rao	 and	
Singh,	 1999;	 Mason	 and	 Kurtz,	 1952).	 This	 is	 because	 water	 tends	 to	 occupy	 the	 voids	 by	
removing	air,	and	the	thermal	resistivity	of	water	is	around	170	o
C-cm/W	which	is	lower	than	
that	of	air.	
	
3) Density	
Thermal	conductivity	is	dependent	on	the	state	of	compaction	of	a	material	(Singh	and	Devid,	
2000;	 Becker,	 Misra	 and	 Fricke,	 1992).	 The	 more	 closely	 packed	 a	 material,	 the	 lesser	 is	 the	
presence	of	air	voids.	This	facilitates	easy	transport	of	heat	through	a	material.	
	
There	exist	other	factors	as	well,	such	as	the	mineralogy	and	the	organic	content	of	the	soil,	but	such	
parameters	 are	 difficult	 to	 control,	 and	 hence	 are	 not	 considered	 as	 important	 as	 the	 three	 factors	
mentioned	above.
The	following	tests	were	performed	on	a	sand	which	was	sourced	from	the	creek	areas	of	Bombay:-	
1) Particle	Size	Distribution	
2) Specific	Gravity	
3) Organic	Content	
4) Chemical	Analysis	
5) X-Ray	Fluorescence	Spectroscopy	
6) Electrical	Impedance	Spectroscopy	
7) Crushing	Strength	
8) Thermal	Tests	
a) Thermal	Resistivity	
b) Thermal	Expansion	Test	
	
The	 tests	 were	 performed	 in	 order	 to	 understand	 the	 effect	 of	 soil	 characteristics	 on	 the	 thermal	
conductivity	of	soils.	
	
NOTE:	The	sample	designation	CS	shall	be	used	henceforth	in	the	report	when	referring	to	the	creek	
sand.	
	
1. Particle	Size	Distribution	
	
The	particle	size	distribution	was	obtained	by	performing	sieve	analysis	on	an	oven-dry	specimen	in	
accordance	with	ASTM	D6913.	The	data	obtained	is	displayed	below:	
	
0.1 0.2 0.3 0.4 0.5
0
10
20
30
40
50
60
70
80
90
100
110
120
PercentageFiner(%)
Sieve Size (mm)
	
Fig.	1	Particle	Size	Distribution	Curve	for	CS
SIEVE	
SIZE	
(mm)	
PERCENTAGE	
GRANULES	
RETAINED	
(%)	
Cu	 Cc	
0.300	 0.75	
1.6983	 1.0861	
0.250	 2.80	
0.212	 11.39	
0.180	 33.18	
0.150	 21.99	
0.106	 21.64	
0.075	 7.10	
PAN	 0.55	
	
The	 table	 above	 shows	 the	 percentage	 granules	 retained	 on	 a	 particular	 sieve	 for	 a	 range	 of	 sieve	
dimensions	which	was	relevant	to	the	sample.	
According	to	ASTM	D2487,	the	sand	samples	can	be	classified	as	SP	(poorly	graded	sand).	
It	 was	 further	 observed	 that	 the	 fraction	 retained	 on	 the	 no.	 140	 (106	 μm)	 sieve	 was	 of	 a	 distinctly	
darker	colour,	while	the	fines	are	of	the	same	colour	as	the	bulk	of	the	sample.	It	is	believed	that	these	
dark	particles	are	possibly	iron	particles.	
	
	
2.			Specific	Gravity	
The	 specific	 gravity	 was	 ascertained	 by	 means	 of	 a	 Helium	 Ultrapycnometer,	 (Quantachrome,	 USA)	
which	uses	helium	gas	as	the	displacing	fluid,	in	accordance	with	ASTM	D5550.	The	results	over	three	
trials	are	displayed	below.	
	
SPECIFIC	GRAVITY	OF	HPCL	SAND																																																																																				
SPECIMEN	
NO.	
WEIGHT	
OF	
SAMPLE(g)	
Specific	Gravity	
TRIAL	1	 TRIAL	2	 TRIAL	3	 AVERAGE	
DENSITY	
1)	 6.0898	 3.2995	 3.3353	 3.3527	 3.3290	
2)	 7.2635	 3.2913	 3.3041	 3.3312	 3.3088	
3)	 8.5908	 3.2719	 3.2785	 3.2825	 3.2776
The	 average	 specific	 gravity	 is	 3.3,	 which	 is	 abnormally	 high	 for	 sand,	 and	 may	 be	 attributed	 to	 the	
presence	of	heavy	minerals	like	oxides	of	iron.	
	
3.		Organic	Content	
The	organic	content	of	the	soil	was	determined	by	CHN	(carbon,	hydrogen,	nitrogen)	analysis	as	well	as	
by	furnace	heating	in	accordance	with	ASTM	D2974-07a.	
In	the	furnace	method,	an	oven	dry	specimen	of	the	sand	was	gradually	heated	up	to	440	o
C.	The	sample	
was	weighed	at	frequent	intervals	until	the	weight	of	the	sample	remained	constant	with	the	progress	
of	time.	This	weight	loss,	reported	as	a	percentage,	was	deemed	the	organic	content	of	the	sample.	
The	organic	content	by	furnace	method	was	3.08%.	
The	results	of	CHN	analysis	are	tabulated	below.	
COMPONENT	 PERCENTAGE	(%)	
Nitrogen	 0.044	
Carbon	 0.067	
Hydrogen	 0.015	
TOTAL	 0.126	
	
The	total	organic	content	by	CHN	analysis	is	significantly	lesser	than	the	organic	content	as	reported	by	
furnace	method.	This	can	be	attributed	to	any	latent	moisture	or	other	volatile	chemicals	that	may	be	
present	in	the	sand.	
	
4.	Chemical	Analysis	
Chemical	analysis	was	performed	using	standard	chemical	kits	and	by	maintaining	a	liquid/solid	ratio	of	
10	and	20	using	distilled	water	as	the	dispersant.	The	chart	below	contains	the	results	of	the	tests.	
	
CHEMICAL	ANALYSIS	OF	CREEK	SOIL	(HPCL)	
SAMPLE	
(liquid/solid	
ratio)	
CHLORIDE	
CONTENT	
(ppm)	
ALKALINITY	
(ppm)	
CALCIUM	
HARDNESS	
(ppm)	
TOTAL	
HARDNESS	
(ppm)	
pH	
ELECTRICAL	
CONDUCTIVITY	
(μS)	
TOTAL	
DISSOLVED	
SOLIDS	(ppm)	
CS	(10)	 90	 50	 6	 10	 8.1000	 689.2	 310.5	
CS	(20)	 40	 20	 4	 8	 8.0780	 334.0	 152.7	
	
The	abnormally	high	value	of	electrical	conductivity	and	pH	is	to	be	noted.
5.	X-Ray	Fluorescence	Spectroscopy	
In	 order	 to	 obtain	 a	 better	 picture	 of	 the	 elemental	 composition	 of	 the	 material,	 the	 samples	 were	
subjected	to	X-Ray	fluorescence	spectroscopy.	The	sample	was	prepared	in	the	form	of	pellets	by	mixing	
1	 gram	 finely	 ground	 sample	 with	 4	 grams	 of	 cellulose	 (cellulose	 is	 used	 because	 of	 its	 binding	
properties).	 Isopropyl	 alcohol	 was	 added	 and	 the	 three	 components	 were	 thoroughly	 mixed.	 The	
mixture	was	placed	under	an	infrared	lamp	for	drying.	An	aluminium	dish	was	filled	with	2/3rd
	cellulose	
and	 1/3rd
	 cellulose-sample	 mixture,	 and	 the	 set-up	 was	 compressed	 under	 a	 loading	 of	 15	 tons	 for	
approximately	1	minute	to	produce	a	pellet.		
The	results	shown	below	describe	the	elemental	composition	of	the	sand.	
X-Ray	Fluorescence	
Spectroscopy	Results	
ELEMENT	
PERCENTAGE	
(%)	
Al	 15.57	
Si	 46.73	
Ca	 6.39	
Ti	 5.85	
Fe	 24.30	
	
An	interesting	observation	is	the	high	percentage	of	iron	and	titanium.	It	was	observed	that	a	magnet,	
when	brought	near	the	sample,	is	able	to	attract	a	large	number	of	black	particles	from	the	sand.	These	
particles	are	most	probably	iron	or	the	magnetic	oxide	of	iron.	
	
6.	Electrical	Impedance	Spectroscopy	
Electrical	Impedance	Spectroscopy	is	a	study	of	the	electrical	response	of	a	system	when	subjected	to	a	
time-varying	voltage	signal.	
It	has	been	mentioned	in	the	literature	(K	Arulanandan,	2002)	that	the	dielectric	dispersion	of	the	soil	
can	 be	 used	 to	 study	 the	 composition	 of	 the	 soil.	 Keeping	 this	 in	 view,	 Electrical	 Impedance	
Spectroscopy	was	performed	on	the	supernatant	of	the	samples	(liquid/solid	ratio	20)	and	Nyquist	and	
Bode	plots	were	developed	for	the	data,	the	results	of	which	are	displayed	below.	
It	can	be	seen	from	the	Bode	phase	plot	that	the	material	shows	high	capacitive	tendencies	at	very	low	
and	very	high	frequencies.
0.1 1 10 100 1000 10000 100000 1000000 1E7
-60
-30
0
Phase(degrees)
Frequency (Hz)
	
Bode	phase	plot	for	creek	sand	at	l/s	ratio	of	20	
	
	
0.1 1 10 100 1000 10000 100000 1000000 1E7
0
5000
10000
Impedance(Ω)
Frequency (Hz)
	
Bode	magnitude	(impedance)	plot	at	l/s	ratio	of	20	
The	 Bode	 magnitude	 plot	 of	 impedance	 vs.	 frequency	 displays	 a	 near	 constant	 value	 for	 the	 middle	
frequency	range.	This	frequency	range	corresponds	to	the	region	with	least	capacitive	effect	(as	per	the
phase	plot).	The	real	part	of	the	impedance	in	this	range,	then,	will	correspond	to	the	resistance	of	the	
solution	and	is	approximately	equal	to	775	Ω.	
	
0 200 400 600 800 1000 1200 1400
0
200
400
600
800
1000
1200
1400-Zs"(Ω)
Zs' (Ω)
	
Nyquist	plot	at	l/s	ratio	of	20	
	
The	nyquist	plot	is	developed	by	plotting	the	negative	of	the	imaginary	component	of	impedance	(-Zs”)	
vs.	the	real	part	of	the	impedance	(Zs’),	both	impedances	taken	as	series	components.	
The	point	at	which	the	nyquist	plot	meets	the	x-axis	is	the	frequency	at	which	the	imaginary	component	
of	 impedance	 vanishes	 to	 zero.	 Therefore,	 this	 value	 of	 the	 real	 part	 of	 the	 impedance	 is	 truly	 the	
resistance	of	the	material.	This	value	is	also	obtained	as	775	Ω.	


Direction	of	increasing	frequency
7.		Crushing	Strength	
The	crushing	strength	of	the	sand	was	obtained	by	developing	stress	vs.	deformation	plots	(Bartake	and	
Singh,	2007).	The	material	was	packed	in	a	mould	of	33	mm	inner	diameter	and	110	mm	length	at	a	
density	corresponding	to	90%	of	the	maximum	dry	density.	Sufficient	material	was	taken	to	maintain	a	
length/diameter	ratio	of	unity.	The	material	was	subjected	to	gradual	loading,	at	a	rate	of	1.25	mm/min,	
on	a	compression	testing	machine	of	5	ton	capacity	(AIMIL,	India),	and	the	deformation	was	obtained	
from	a	dial	gauge	of	0.01	mm	least	count.	
	
The	method	of	determining	the	crushing	strength	of	the	material	involves	plotting	the	applied	load	vs.	
the	deformation	developed	with	the	load	taken	on	a	log-scale.	Tangents	are	drawn	at	the	initial	linear	
portion	and	the	final	linear	portion.	The	load	corresponding	to	the	point	of	intersection	of	these	two	
tangents	(point	of	maximum	curvature)	is	reported	as	the	crushing	load,	and	the	corresponding	stress	is	
reported	as	the	crushing	stress.	
The	crushing	strength	obtained	was	4.34	MPa.	Shown	below	is	the	log	(deflection)	vs.	load	plot.	
-1000 0 1000 2000 3000 4000 5000 6000
10
100
Deflection(10
-2
mm)
Load (Kg)
	
Log	(deflection)	vs.	load	plot	for	creek	sand:	Crushing	Strength
8.	Thermal	Tests	
Apart	from	physical	characterization	of	the	sand,	it	is	also	imperative	that	the	thermal	properties	such	as	
thermal	resistivity,	thermal	diffusivity,	and	specific	heat	capacity	and	co-efficient	of	thermal	expansion,	
are	studied.	
	
A	heat	probe	modeled	along	the	principle	of	an	infinitely	long	heat	source	(ASTM	D5334-08)	was	used	to	
determine	 the	 thermal	 resistivity,	 thermal	 diffusivity,	 and	 specific	 heat	 capacity	 of	 the	 materials.	 A	
dilatometer	was	utilized	to	obtain	the	co-efficient	of	thermal	expansion.	


8.1	Thermal	Probe	
	
The	concept	of	the	infinitely	long	heat	source	has	been	used	in	the	past	(Blackwell,	1954;	De	Vries	
and	Peck,	1958;	Rao	and	Singh,	1999;	Singh	and	Devid,	2000).	A	heat	probe	of	length	6	cm	and	
radius	of	3.5	mm	was	used	to	model	an	infinitely	long	heat	source.	The	probe	possesses	a	nichrome	
wire	 of	 known	 resistance	 which	 is	 used	 for	 heating,	 and	 a	 T-type	 (copper-constantan)	
thermocouple	 which	 is	 used	 to	 measure	 changes	 in	 temperature.	 The	 probe	 is	 connected	 to	 a	
regulated	DC	power	supply	source	and	the	temperature	of	the	thermocouple	is	data	logged	on	a	
personal	computer	as	a	function	of	time.	
	
The	fundamental	differential	heat	flow	equation	for	this	model	is	given	below	and	was	solved	by	
Carslaw	and	Jaeger,	1958.	
	
𝜕𝑇
𝜕𝑡
= 𝛼
𝜕! 𝑇
𝜕𝑟!
+
1
𝑟
𝜕𝑇
𝜕𝑟
	
	
Here	T	is	the	temperature	of	the	probe,	t	is	the	time	at	which	measurement	was	made,	α	is	the	
thermal	 diffusivity	 of	 the	 medium	 and	 r	 is	 the	 radius	 from	 the	 axis	 of	 the	 probe	 at	 which	 the	
temperature	is	measured.	
	
The	complete	derivation	is	available	in	numerous	papers	including	the	documents	cited	and,	for	the	
sake	of	brevity,	has	not	been	included	in	this	report.	
	
The	working	equation	of	the	probe	method	of	determining	thermal	properties	is:-	
	
𝑅! = 𝑠
4𝜋
𝑄
	
	
Here	RT	is	the	thermal	resistivity	of	the	medium,	Q	is	the	heat	generated	by	the	probe	per	unit	
length,	and	s	is	the	slope	of	the	temperature	vs.	loge(time)	curve	for	the	probe.
The	probe	was	calibrated	with	glycerol	which	has	a	known	thermal	resistivity	of	342.46	o
C-cm/W	
(ASTM	D5334),	and	was	found	to	generate	acceptable	results	when	operated	at	0.3V	and	1.81A.	
	
Hence,	the	factor	Q	can	be	calculated	as		
	
𝑄 =
𝐼! 𝑅
𝐿
	
	
Where	I	is	the	current	flowing	in	the	nichrome	wire,	R	is	the	electrical	resistance	of	the	nichrome	
wire	and	L	is	the	length	of	the	probe	(6	cm).	
	
It	 is	 also	 possible	 to	 obtain	 the	 thermal	 diffusivity	 (α)	 of	 the	 materials.	 The	 derivation	 of	 this	
formula	is	not	included	and	is	available	in	the	referred	texts.	
	
𝛼 =
𝑟!
!
2.246 X 𝑡!
	
	
Here,	rp	is	the	radius	of	the	probe	(3.5	mm)	and	t0	is	the	intercept	of	the	tangent	drawn	to	the	
temperature	vs.	loge(time)	curve,	the	intercept	is	taken	at	the	initial	temperature	of	the	material.	
	
	
Once	RT	and	α	are	known,	the	thermal	capacity	Cp	may	be	calculated	as		
	
𝐶! =
1
𝜌 𝑅! 𝛼


Here	ρ	is	the	density	of	the	material.	


Shown	below	is	a	chart	which	contains	the	thermal	properties	of	the	sand:
SAMPLE	
STATE	
BULK	
DENSITY	
(g/cc)	
THERMAL	
RESISTIVITY	RT	(
o
	
C-cm/W)															
=	s	(Q/4π)
-1
	
THERMAL	
DIFFUSIVITY	α	
(m
2
/s)																								
=	rp
2
/(2.246	X	t0)	
THERMAL	
CAPACITY	Cp	(J/
o
	
C-g)														=	
(RT.ρ.α)
-1
	
Oven	dry	 1.6	 369.16	 1.56E-06	 0.11	
Oven	dry	 1.75	 334.04	 1.82E-06	 0.09	
Oven	dry	 1.9	 318.45	 2.12E-06	 0.08	
	 	 	 	 	
NMC*	 1.186	 318.60	 1.85E-06	 0.14	
NMC	 1.3	 275.26	 2.72E-06	 0.10	
NMC	 1.45	 297.78	 2.18E-06	 0.11	
NMC	 1.6	 272.13	 2.58E-06	 0.09	
NMC	 1.853	 254.34	 3.08E-06	 0.07	
	
*NMC	=	Natural	Moisture	Content	and	is	equal	to	3.94	%	
	
A	 clear	 variation	 of	 thermal	 resistivity	 with	 density	 is	 observable,	 with	 the	 resistivity	 showing	 a	
general	decreasing	trend	with	increasing	density.	The	effect	of	moisture	is	also	evident,	with	the	
samples	at	natural	moisture	content	(3.94	%)	showing	distinctly	lower	values	of	resistivity	for	the	
same	density.	
An	important	observation	to	be	made	is	that	the	density	variation	in	the	dry	state	is	quite	low	as	
compared	to	the	density	variation	at	the	natural	moisture	content	(NMC).	Also,	the	presence	of	
moisture	significantly	reduces	the	thermal	resistivity.		
	
	
7.2	Thermal	Expansion	Test	
The	coefficient	of	thermal	expansion	was	obtained	using	a	dilatometer.	The	sample	was	prepared	
in	the	form	of	a	pellet	by	compressing	it	in	a	mould	of	diameter	10mm.	Sufficient	sample	was	taken	
so	as	to	obtain	a	pellet	of	length	13	±	1	mm	when	compressed	under	a	loading	of	3	tons	for	1	
minute.	
The	sample	was	tested	in	a	dilatometer,	subjected	to	a	gradual	heating	up	to	600	o
C	over	a	period	
of	 112	 minutes.	 Variations	 in	 the	 length	 of	 the	 sample	 were	 recorded	 and	 were	 reported	 as	 a	
Percentage	Linear	Change	(PLC)	of	the	original	dimension.	
A	plot	of	PLC	against	temperature	is	shown	below.
-100 0 100 200 300 400 500 600 700
-0.9
-0.8
-0.7
-0.6
-0.5
-0.4
-0.3
-0.2
-0.1
0.0
0.1
0.2
PLC(%)
Temp (
o
C)
α = 4.18x10
-4
(
o
C)
-1
	
Percentage	Linear	Change	vs.	Temperature,	Creek	Sand	
	
It	can	be	observed	that	there	is	a	drastic	drop	in	the	length	in	the	initial	100	o
C	of	heating.	This	can	
be	attributed	to	the	shrinking	effects	produced	by	the	loss	in	moisture	in	the	sample,	100	o
C	being	
the	boiling	point	of	water.	But	beyond	this	temperature	range,	the	sample	shows	a	fairly	consistent	
increase	in	length.	
The	value	of	co-efficient	of	thermal	expansion	is	reported	as	4.18X10⁻⁴
	o
C-1
,	and	is	calculated	as	the	
slope	of	the	linear	portion	of	the	PLC	vs.	temperature	plot.	
	
	
8.	Conclusions	
On	analysis	of	the	results	generated,	it	can	be	seen	that	the	sand	tested	has	shown	typical	trends	in	its	
thermal	properties.	The	material	shows	typical	reduction	in	the	thermal	resistivity	with	an	increase	in	
moisture	content	or	density.	The	poorly	graded	nature	of	the	soil	further	implies	that	the	packing	of	the	
granules	will	not	be	efficient,	which	means	that	the	soil	will	display	a	higher	ratio	of	voids	as	compared	
to	a	well	graded	soil.		
Further,	 it	 is	 important	 to	 develop	 error	 correction	 techniques	 in	 the	 methods	 employed	 to	 test	 the	
thermal	 properties.	 The	 assumptions	 that	 are	 made	 in	 the	 single	 probe	 method	 are	 not	 very	 good	
approximations	of	field	conditions.	Corrections	for	the	finite	radius	of	the	probe,	as	well	as	the	non-zero	
thermal	 capacity	 of	 the	 probe	 will	 ensure	 that	 the	 results	 are	 descriptive	 of	 the	 true	 nature	 of	 the	
material	tested.
ACKNOWLEDGEMENTS	
	
I	would	like	to	place	on	record	my	sincere	thanks	and	immense	gratitude	to	Prof.	DN	Singh	for	opening	
the	 doors	 of	 his	 laboratory	 to	 me.	 The	 sheer	 amount	 of	 knowledge	 that	 I	 have	 gained	 in	 my	 short	
association	with	this	laboratory	is	invaluable.	I	would	further	like	to	thank	the	research	scholars	of	the	
Environmental	Geotechnology	Laboratory,	IIT-Bombay,	for	taking	time	off	in	order	to	explain	the	most	
trivial	of	doubts.	I	would	like	to	thank	Mrs.	Ritu	Singh	and	Ms.	Yashi	Singh	for	their	warm	hospitality.	
	
I	would	like	to	thank	Prof.	CP	Rao,	Prof.	Murugavel	and	Prof.	Anindya	Datta,	IIT-Bombay	for	handling	the	
accommodation	with	panache	despite	the	many	problems	that	they	inevitably	faced.	
	
And	 lastly,	 I	 would	 like	 to	 thank	 the	 Indian	 Academy	 of	 Sciences	 for	 providing	 me	 this	 unique	
opportunity.	I	believe	that	this	program	has	gone	a	long	way	in	opening	eyes	to	the	world	of	research.	I	
hope	that	the	program	continues	successfully	in	the	years	to	come,	as	it	will	be	of	great	benefit	to	the	
student	community	at	large.		


REFERENCES	
1) DN	Singh,	K	Devid	
Generalized	relationships	for	estimating	soil	thermal	resistivity,	
Experimental	Thermal	and	Fluid	Science	(pg.	133-143),	2000	
	
2) GS	Campbell,	KL	Bristow	
The	effect	of	soil	thermal	resistivity	on	underground	power	cable	installations,	
Application	Note,	Decagon	Devices,	2009		
	
3) Yusuf	Erzin,	BH	Rao,	DN	Singh	
Artificial	neural	network	models	for	predicting	soil	thermal	resistivity,
International	Journal	of	Thermal	Sciences,	2007	
	
4) VV	Mason,	M	Kurtz	
Rapid	measurement	of	the	thermal	resistivity	of	soil,	
Power	Apparatus	and	Systems,	IEEE,	1952	
	
5) MVBB	Gangadhara	Rao,	DN	Singh	
A	generalized	relationship	to	estimate	thermal	resistivity	of	soils,	
Canadian	Geotechnical	Journal,	1999	
	
6) Bryan	R	Becker,	Anil	Misra,	Brian	A	Fricke	
Development	of	correlations	for	soil	thermal	conductivity,	
International	Communications	in	Heat	and	Mass	Transfer	(pg.	59	-	68),	1992	
	
7) ASTM	D6913-04	(2009)	
Standard	test	methods	for	particle-size	distribution	(gradation)	of	soils	using	sieve	analysis	
	
8) ASTM	D2487-11	
Standard	practice	for	classification	of	soils	for	engineering	purposes	(Unified	Soil	Classification	System	
	
9) ASTM	D5550-06	
Standard	test	method	for	specific	gravity	of	soil	solids	by	gas	pycnometer	
	
10) ASTM	D2974-07a	
Standard	test	methods	for	moisture,	ash	and	organic	matter	of	peat	and	other	organic	soils	
	
11) K	Arulanandan	
Soil	Structure:	In-situ	Properties	and	Behaviour	
	
12) Prasad	P	Bartake,	DN	Singh	
A	generalized	methodology	for	determination	of	crushing	strength	of	granular	materials,	
Geotechnical	and	Geological	Engineering,	2007	
	
13) ASTM	D5334-08	
Standard	test	method	for	determination	of	thermal	conductivity	of	soil	and	soft	rock	by	thermal	needle	
probe	procedure	
	
14) JH	Blackwell	
A	transient	flow	method	for	determination	of	thermal	constants	of	insulating	materials	in	bulk	
Part	I	and	II,	
Journal	of	Applied	Physics,	1954	
	
15) DA	De	Vries,	AJ	Peck	
On	the	cylindrical	probe	method	of	measuring	thermal	conductivity	with	special	reference	to	soils,	
Australian	Journal	of	Physics,	1958

More Related Content

What's hot

Numerical investigation on heat sink by computational fluid dynamics (cfd)
Numerical investigation on heat sink by computational fluid dynamics (cfd)Numerical investigation on heat sink by computational fluid dynamics (cfd)
Numerical investigation on heat sink by computational fluid dynamics (cfd)
eSAT Publishing House
 
Air Conditioning System with Ground Source Heat Exchanger
Air Conditioning System with Ground Source Heat ExchangerAir Conditioning System with Ground Source Heat Exchanger
Air Conditioning System with Ground Source Heat Exchanger
IOSR Journals
 
IJIRSTV2I11104
IJIRSTV2I11104IJIRSTV2I11104
IJIRSTV2I11104
Vibu Mammen Jacob
 
International Journal of Computational Engineering Research(IJCER)
International Journal of Computational Engineering Research(IJCER)International Journal of Computational Engineering Research(IJCER)
International Journal of Computational Engineering Research(IJCER)
ijceronline
 
The Low-Temperature Radiant Floor Heating System Design and Experimental Stud...
The Low-Temperature Radiant Floor Heating System Design and Experimental Stud...The Low-Temperature Radiant Floor Heating System Design and Experimental Stud...
The Low-Temperature Radiant Floor Heating System Design and Experimental Stud...
IJRES Journal
 
Experimental Studies on Pool Boiling Heat Transfer Using Alumina and Graphene...
Experimental Studies on Pool Boiling Heat Transfer Using Alumina and Graphene...Experimental Studies on Pool Boiling Heat Transfer Using Alumina and Graphene...
Experimental Studies on Pool Boiling Heat Transfer Using Alumina and Graphene...
IRJET Journal
 
Expanded graphite as thermal conductivity enhancer for paraffin wax being us...
 Expanded graphite as thermal conductivity enhancer for paraffin wax being us... Expanded graphite as thermal conductivity enhancer for paraffin wax being us...
Expanded graphite as thermal conductivity enhancer for paraffin wax being us...
Gulfam Raza
 
Energy Audit and Heat Recovery on the Rotary Kiln of the Cement Plant in Ethi...
Energy Audit and Heat Recovery on the Rotary Kiln of the Cement Plant in Ethi...Energy Audit and Heat Recovery on the Rotary Kiln of the Cement Plant in Ethi...
Energy Audit and Heat Recovery on the Rotary Kiln of the Cement Plant in Ethi...
IJAEMSJORNAL
 
Analysis of calorimetric measurement bismuth and tin system
Analysis of calorimetric measurement bismuth and tin system Analysis of calorimetric measurement bismuth and tin system
Analysis of calorimetric measurement bismuth and tin system
editorijrei
 
Theoretical study of heat transfer through a sun space filled with a porous m...
Theoretical study of heat transfer through a sun space filled with a porous m...Theoretical study of heat transfer through a sun space filled with a porous m...
Theoretical study of heat transfer through a sun space filled with a porous m...
Ahmed Al-Sammarraie
 
IRJET- Literature Review on Energy Storage Materials
IRJET-  	  Literature Review on Energy Storage MaterialsIRJET-  	  Literature Review on Energy Storage Materials
IRJET- Literature Review on Energy Storage Materials
IRJET Journal
 
Graphene Nanocomposite Conference Poster
Graphene Nanocomposite Conference PosterGraphene Nanocomposite Conference Poster
Graphene Nanocomposite Conference Poster
Kolby Koeck
 
Hot Disk Transient Plane Source Technique - Thermal Conductivity
Hot Disk Transient Plane Source Technique - Thermal ConductivityHot Disk Transient Plane Source Technique - Thermal Conductivity
Hot Disk Transient Plane Source Technique - Thermal Conductivity
Michael Thomas
 
Energy Recovery of Biomass: Study Comparative Experimental of Fixed Bed Combu...
Energy Recovery of Biomass: Study Comparative Experimental of Fixed Bed Combu...Energy Recovery of Biomass: Study Comparative Experimental of Fixed Bed Combu...
Energy Recovery of Biomass: Study Comparative Experimental of Fixed Bed Combu...
AJSERJournal
 
Comparison of Calorific Values of Various Fuels from Different Fuel Stations
Comparison of Calorific Values of Various Fuels from Different Fuel StationsComparison of Calorific Values of Various Fuels from Different Fuel Stations
Comparison of Calorific Values of Various Fuels from Different Fuel Stations
researchinventy
 
HEAT TRANSFERCHARACTERISTICS OF A SELF ASPIRATING POROUS RADIANT BURNER FUELE...
HEAT TRANSFERCHARACTERISTICS OF A SELF ASPIRATING POROUS RADIANT BURNER FUELE...HEAT TRANSFERCHARACTERISTICS OF A SELF ASPIRATING POROUS RADIANT BURNER FUELE...
HEAT TRANSFERCHARACTERISTICS OF A SELF ASPIRATING POROUS RADIANT BURNER FUELE...
BIBHUTI BHUSAN SAMANTARAY
 
Simulation Studies Of Premixed N-Pentane/Air Liquid Micro Combustion
Simulation Studies Of Premixed N-Pentane/Air Liquid Micro CombustionSimulation Studies Of Premixed N-Pentane/Air Liquid Micro Combustion
Simulation Studies Of Premixed N-Pentane/Air Liquid Micro Combustion
IJERA Editor
 
computational investigation for life cycle of alumina based induction furnace...
computational investigation for life cycle of alumina based induction furnace...computational investigation for life cycle of alumina based induction furnace...
computational investigation for life cycle of alumina based induction furnace...
IJCMESJOURNAL
 

What's hot (18)

Numerical investigation on heat sink by computational fluid dynamics (cfd)
Numerical investigation on heat sink by computational fluid dynamics (cfd)Numerical investigation on heat sink by computational fluid dynamics (cfd)
Numerical investigation on heat sink by computational fluid dynamics (cfd)
 
Air Conditioning System with Ground Source Heat Exchanger
Air Conditioning System with Ground Source Heat ExchangerAir Conditioning System with Ground Source Heat Exchanger
Air Conditioning System with Ground Source Heat Exchanger
 
IJIRSTV2I11104
IJIRSTV2I11104IJIRSTV2I11104
IJIRSTV2I11104
 
International Journal of Computational Engineering Research(IJCER)
International Journal of Computational Engineering Research(IJCER)International Journal of Computational Engineering Research(IJCER)
International Journal of Computational Engineering Research(IJCER)
 
The Low-Temperature Radiant Floor Heating System Design and Experimental Stud...
The Low-Temperature Radiant Floor Heating System Design and Experimental Stud...The Low-Temperature Radiant Floor Heating System Design and Experimental Stud...
The Low-Temperature Radiant Floor Heating System Design and Experimental Stud...
 
Experimental Studies on Pool Boiling Heat Transfer Using Alumina and Graphene...
Experimental Studies on Pool Boiling Heat Transfer Using Alumina and Graphene...Experimental Studies on Pool Boiling Heat Transfer Using Alumina and Graphene...
Experimental Studies on Pool Boiling Heat Transfer Using Alumina and Graphene...
 
Expanded graphite as thermal conductivity enhancer for paraffin wax being us...
 Expanded graphite as thermal conductivity enhancer for paraffin wax being us... Expanded graphite as thermal conductivity enhancer for paraffin wax being us...
Expanded graphite as thermal conductivity enhancer for paraffin wax being us...
 
Energy Audit and Heat Recovery on the Rotary Kiln of the Cement Plant in Ethi...
Energy Audit and Heat Recovery on the Rotary Kiln of the Cement Plant in Ethi...Energy Audit and Heat Recovery on the Rotary Kiln of the Cement Plant in Ethi...
Energy Audit and Heat Recovery on the Rotary Kiln of the Cement Plant in Ethi...
 
Analysis of calorimetric measurement bismuth and tin system
Analysis of calorimetric measurement bismuth and tin system Analysis of calorimetric measurement bismuth and tin system
Analysis of calorimetric measurement bismuth and tin system
 
Theoretical study of heat transfer through a sun space filled with a porous m...
Theoretical study of heat transfer through a sun space filled with a porous m...Theoretical study of heat transfer through a sun space filled with a porous m...
Theoretical study of heat transfer through a sun space filled with a porous m...
 
IRJET- Literature Review on Energy Storage Materials
IRJET-  	  Literature Review on Energy Storage MaterialsIRJET-  	  Literature Review on Energy Storage Materials
IRJET- Literature Review on Energy Storage Materials
 
Graphene Nanocomposite Conference Poster
Graphene Nanocomposite Conference PosterGraphene Nanocomposite Conference Poster
Graphene Nanocomposite Conference Poster
 
Hot Disk Transient Plane Source Technique - Thermal Conductivity
Hot Disk Transient Plane Source Technique - Thermal ConductivityHot Disk Transient Plane Source Technique - Thermal Conductivity
Hot Disk Transient Plane Source Technique - Thermal Conductivity
 
Energy Recovery of Biomass: Study Comparative Experimental of Fixed Bed Combu...
Energy Recovery of Biomass: Study Comparative Experimental of Fixed Bed Combu...Energy Recovery of Biomass: Study Comparative Experimental of Fixed Bed Combu...
Energy Recovery of Biomass: Study Comparative Experimental of Fixed Bed Combu...
 
Comparison of Calorific Values of Various Fuels from Different Fuel Stations
Comparison of Calorific Values of Various Fuels from Different Fuel StationsComparison of Calorific Values of Various Fuels from Different Fuel Stations
Comparison of Calorific Values of Various Fuels from Different Fuel Stations
 
HEAT TRANSFERCHARACTERISTICS OF A SELF ASPIRATING POROUS RADIANT BURNER FUELE...
HEAT TRANSFERCHARACTERISTICS OF A SELF ASPIRATING POROUS RADIANT BURNER FUELE...HEAT TRANSFERCHARACTERISTICS OF A SELF ASPIRATING POROUS RADIANT BURNER FUELE...
HEAT TRANSFERCHARACTERISTICS OF A SELF ASPIRATING POROUS RADIANT BURNER FUELE...
 
Simulation Studies Of Premixed N-Pentane/Air Liquid Micro Combustion
Simulation Studies Of Premixed N-Pentane/Air Liquid Micro CombustionSimulation Studies Of Premixed N-Pentane/Air Liquid Micro Combustion
Simulation Studies Of Premixed N-Pentane/Air Liquid Micro Combustion
 
computational investigation for life cycle of alumina based induction furnace...
computational investigation for life cycle of alumina based induction furnace...computational investigation for life cycle of alumina based induction furnace...
computational investigation for life cycle of alumina based induction furnace...
 

Similar to Instrumentation techniques in environmental geotechnology

Investigation of Different Types of Cement Material on Thermal Properties of ...
Investigation of Different Types of Cement Material on Thermal Properties of ...Investigation of Different Types of Cement Material on Thermal Properties of ...
Investigation of Different Types of Cement Material on Thermal Properties of ...
IJERA Editor
 
F0332035043
F0332035043F0332035043
F0332035043
inventionjournals
 
Geothermal
GeothermalGeothermal
Geothermal
Zaidoon Taha
 
H48076265
H48076265H48076265
H48076265
IJERA Editor
 
Heat Transfer Analysis to Optimize The Water Cooling Scheme For Combustion De...
Heat Transfer Analysis to Optimize The Water Cooling Scheme For Combustion De...Heat Transfer Analysis to Optimize The Water Cooling Scheme For Combustion De...
Heat Transfer Analysis to Optimize The Water Cooling Scheme For Combustion De...
IJERA Editor
 
Thermal analysis
Thermal analysisThermal analysis
Thermal analysis
YasharthAgrahari1
 
An analysis of raw materials for concretes as metal sheets for solar radiatio...
An analysis of raw materials for concretes as metal sheets for solar radiatio...An analysis of raw materials for concretes as metal sheets for solar radiatio...
An analysis of raw materials for concretes as metal sheets for solar radiatio...
eSAT Journals
 
An analysis of raw materials for concretes as metal sheets for solar radiatio...
An analysis of raw materials for concretes as metal sheets for solar radiatio...An analysis of raw materials for concretes as metal sheets for solar radiatio...
An analysis of raw materials for concretes as metal sheets for solar radiatio...
eSAT Publishing House
 
30520140201001
3052014020100130520140201001
30520140201001
IAEME Publication
 
30520140201001
3052014020100130520140201001
30520140201001
IAEME Publication
 
Ruchi b usiness plan_122_production & rnd
Ruchi b usiness plan_122_production & rndRuchi b usiness plan_122_production & rnd
Ruchi b usiness plan_122_production & rnd
Chanda Bhatt
 
451782
451782451782
451782 (1)
451782 (1)451782 (1)
451782 (1)
Al Baha University
 
Electro-Thermal and Semiconductivity Behaviour of Natural Sintered Complex Ca...
Electro-Thermal and Semiconductivity Behaviour of Natural Sintered Complex Ca...Electro-Thermal and Semiconductivity Behaviour of Natural Sintered Complex Ca...
Electro-Thermal and Semiconductivity Behaviour of Natural Sintered Complex Ca...
Al Baha University
 
451782
451782451782
451782
451782451782
451782 (1)
451782 (1)451782 (1)
451782 (1)
Al Baha University
 
Thermal Simulation of Biogas Plants Using Mat Lab
Thermal Simulation of Biogas Plants Using Mat LabThermal Simulation of Biogas Plants Using Mat Lab
Thermal Simulation of Biogas Plants Using Mat Lab
IJERA Editor
 
Roof Radiation PowerPoint
Roof Radiation PowerPointRoof Radiation PowerPoint
Roof Radiation PowerPoint
Ashleigh Hough
 
TGA
TGA TGA

Similar to Instrumentation techniques in environmental geotechnology (20)

Investigation of Different Types of Cement Material on Thermal Properties of ...
Investigation of Different Types of Cement Material on Thermal Properties of ...Investigation of Different Types of Cement Material on Thermal Properties of ...
Investigation of Different Types of Cement Material on Thermal Properties of ...
 
F0332035043
F0332035043F0332035043
F0332035043
 
Geothermal
GeothermalGeothermal
Geothermal
 
H48076265
H48076265H48076265
H48076265
 
Heat Transfer Analysis to Optimize The Water Cooling Scheme For Combustion De...
Heat Transfer Analysis to Optimize The Water Cooling Scheme For Combustion De...Heat Transfer Analysis to Optimize The Water Cooling Scheme For Combustion De...
Heat Transfer Analysis to Optimize The Water Cooling Scheme For Combustion De...
 
Thermal analysis
Thermal analysisThermal analysis
Thermal analysis
 
An analysis of raw materials for concretes as metal sheets for solar radiatio...
An analysis of raw materials for concretes as metal sheets for solar radiatio...An analysis of raw materials for concretes as metal sheets for solar radiatio...
An analysis of raw materials for concretes as metal sheets for solar radiatio...
 
An analysis of raw materials for concretes as metal sheets for solar radiatio...
An analysis of raw materials for concretes as metal sheets for solar radiatio...An analysis of raw materials for concretes as metal sheets for solar radiatio...
An analysis of raw materials for concretes as metal sheets for solar radiatio...
 
30520140201001
3052014020100130520140201001
30520140201001
 
30520140201001
3052014020100130520140201001
30520140201001
 
Ruchi b usiness plan_122_production & rnd
Ruchi b usiness plan_122_production & rndRuchi b usiness plan_122_production & rnd
Ruchi b usiness plan_122_production & rnd
 
451782
451782451782
451782
 
451782 (1)
451782 (1)451782 (1)
451782 (1)
 
Electro-Thermal and Semiconductivity Behaviour of Natural Sintered Complex Ca...
Electro-Thermal and Semiconductivity Behaviour of Natural Sintered Complex Ca...Electro-Thermal and Semiconductivity Behaviour of Natural Sintered Complex Ca...
Electro-Thermal and Semiconductivity Behaviour of Natural Sintered Complex Ca...
 
451782
451782451782
451782
 
451782
451782451782
451782
 
451782 (1)
451782 (1)451782 (1)
451782 (1)
 
Thermal Simulation of Biogas Plants Using Mat Lab
Thermal Simulation of Biogas Plants Using Mat LabThermal Simulation of Biogas Plants Using Mat Lab
Thermal Simulation of Biogas Plants Using Mat Lab
 
Roof Radiation PowerPoint
Roof Radiation PowerPointRoof Radiation PowerPoint
Roof Radiation PowerPoint
 
TGA
TGA TGA
TGA
 

Instrumentation techniques in environmental geotechnology

  • 2. 1. Introduction Thermal properties of soil are an important set of parameters that are to be obtained in order to be able to estimate the heat flow through soil under the influence of a temperature gradient. This is particularly important for underground power cables, foundation design of chemical plants or power plants, and nuclear waste repositories. The important thermal properties of a material are:- a) Thermal Resistivity: The ease with which heat can flow through a material of given dimension under a given temperature gradient. b) Thermal Heat Capacity: The heat required to raise a unit mass of a substance by a unit Kelvin. c) Thermal Diffusivity: It is a measure of the lag in heat transfer through a material, often described as ‘thermal inertia’. It is obtained by dividing the thermal conductivity of a material by its density and thermal capacity. The thermal properties are strong functions of numerous soil parameters like:- 1) Particle Size Soils composed smaller granules show a lower thermal resistivity than soils composed of larger granules (Singh and Devid, 2000). Also, well graded soils show lower thermal resistivity as compared to poorly graded or uniformly graded soils (Campbell and Bristow, 2009). The main factor at play here is the presence of air voids, which have a thermal resistivity of 4000 o C-cm/W as compared to soil solids which show a resistivity of 4 o C-cm/W (Erzin, Rao and Singh, 2007). 2) Moisture Content Soils with higher moisture content show a lower thermal resistivity than dry soils (Rao and Singh, 1999; Mason and Kurtz, 1952). This is because water tends to occupy the voids by removing air, and the thermal resistivity of water is around 170 o C-cm/W which is lower than that of air. 3) Density Thermal conductivity is dependent on the state of compaction of a material (Singh and Devid, 2000; Becker, Misra and Fricke, 1992). The more closely packed a material, the lesser is the presence of air voids. This facilitates easy transport of heat through a material. There exist other factors as well, such as the mineralogy and the organic content of the soil, but such parameters are difficult to control, and hence are not considered as important as the three factors mentioned above.
  • 3. The following tests were performed on a sand which was sourced from the creek areas of Bombay:- 1) Particle Size Distribution 2) Specific Gravity 3) Organic Content 4) Chemical Analysis 5) X-Ray Fluorescence Spectroscopy 6) Electrical Impedance Spectroscopy 7) Crushing Strength 8) Thermal Tests a) Thermal Resistivity b) Thermal Expansion Test The tests were performed in order to understand the effect of soil characteristics on the thermal conductivity of soils. NOTE: The sample designation CS shall be used henceforth in the report when referring to the creek sand. 1. Particle Size Distribution The particle size distribution was obtained by performing sieve analysis on an oven-dry specimen in accordance with ASTM D6913. The data obtained is displayed below: 0.1 0.2 0.3 0.4 0.5 0 10 20 30 40 50 60 70 80 90 100 110 120 PercentageFiner(%) Sieve Size (mm) Fig. 1 Particle Size Distribution Curve for CS
  • 4. SIEVE SIZE (mm) PERCENTAGE GRANULES RETAINED (%) Cu Cc 0.300 0.75 1.6983 1.0861 0.250 2.80 0.212 11.39 0.180 33.18 0.150 21.99 0.106 21.64 0.075 7.10 PAN 0.55 The table above shows the percentage granules retained on a particular sieve for a range of sieve dimensions which was relevant to the sample. According to ASTM D2487, the sand samples can be classified as SP (poorly graded sand). It was further observed that the fraction retained on the no. 140 (106 μm) sieve was of a distinctly darker colour, while the fines are of the same colour as the bulk of the sample. It is believed that these dark particles are possibly iron particles. 2. Specific Gravity The specific gravity was ascertained by means of a Helium Ultrapycnometer, (Quantachrome, USA) which uses helium gas as the displacing fluid, in accordance with ASTM D5550. The results over three trials are displayed below. SPECIFIC GRAVITY OF HPCL SAND SPECIMEN NO. WEIGHT OF SAMPLE(g) Specific Gravity TRIAL 1 TRIAL 2 TRIAL 3 AVERAGE DENSITY 1) 6.0898 3.2995 3.3353 3.3527 3.3290 2) 7.2635 3.2913 3.3041 3.3312 3.3088 3) 8.5908 3.2719 3.2785 3.2825 3.2776
  • 5. The average specific gravity is 3.3, which is abnormally high for sand, and may be attributed to the presence of heavy minerals like oxides of iron. 3. Organic Content The organic content of the soil was determined by CHN (carbon, hydrogen, nitrogen) analysis as well as by furnace heating in accordance with ASTM D2974-07a. In the furnace method, an oven dry specimen of the sand was gradually heated up to 440 o C. The sample was weighed at frequent intervals until the weight of the sample remained constant with the progress of time. This weight loss, reported as a percentage, was deemed the organic content of the sample. The organic content by furnace method was 3.08%. The results of CHN analysis are tabulated below. COMPONENT PERCENTAGE (%) Nitrogen 0.044 Carbon 0.067 Hydrogen 0.015 TOTAL 0.126 The total organic content by CHN analysis is significantly lesser than the organic content as reported by furnace method. This can be attributed to any latent moisture or other volatile chemicals that may be present in the sand. 4. Chemical Analysis Chemical analysis was performed using standard chemical kits and by maintaining a liquid/solid ratio of 10 and 20 using distilled water as the dispersant. The chart below contains the results of the tests. CHEMICAL ANALYSIS OF CREEK SOIL (HPCL) SAMPLE (liquid/solid ratio) CHLORIDE CONTENT (ppm) ALKALINITY (ppm) CALCIUM HARDNESS (ppm) TOTAL HARDNESS (ppm) pH ELECTRICAL CONDUCTIVITY (μS) TOTAL DISSOLVED SOLIDS (ppm) CS (10) 90 50 6 10 8.1000 689.2 310.5 CS (20) 40 20 4 8 8.0780 334.0 152.7 The abnormally high value of electrical conductivity and pH is to be noted.
  • 6. 5. X-Ray Fluorescence Spectroscopy In order to obtain a better picture of the elemental composition of the material, the samples were subjected to X-Ray fluorescence spectroscopy. The sample was prepared in the form of pellets by mixing 1 gram finely ground sample with 4 grams of cellulose (cellulose is used because of its binding properties). Isopropyl alcohol was added and the three components were thoroughly mixed. The mixture was placed under an infrared lamp for drying. An aluminium dish was filled with 2/3rd cellulose and 1/3rd cellulose-sample mixture, and the set-up was compressed under a loading of 15 tons for approximately 1 minute to produce a pellet. The results shown below describe the elemental composition of the sand. X-Ray Fluorescence Spectroscopy Results ELEMENT PERCENTAGE (%) Al 15.57 Si 46.73 Ca 6.39 Ti 5.85 Fe 24.30 An interesting observation is the high percentage of iron and titanium. It was observed that a magnet, when brought near the sample, is able to attract a large number of black particles from the sand. These particles are most probably iron or the magnetic oxide of iron. 6. Electrical Impedance Spectroscopy Electrical Impedance Spectroscopy is a study of the electrical response of a system when subjected to a time-varying voltage signal. It has been mentioned in the literature (K Arulanandan, 2002) that the dielectric dispersion of the soil can be used to study the composition of the soil. Keeping this in view, Electrical Impedance Spectroscopy was performed on the supernatant of the samples (liquid/solid ratio 20) and Nyquist and Bode plots were developed for the data, the results of which are displayed below. It can be seen from the Bode phase plot that the material shows high capacitive tendencies at very low and very high frequencies.
  • 7. 0.1 1 10 100 1000 10000 100000 1000000 1E7 -60 -30 0 Phase(degrees) Frequency (Hz) Bode phase plot for creek sand at l/s ratio of 20 0.1 1 10 100 1000 10000 100000 1000000 1E7 0 5000 10000 Impedance(Ω) Frequency (Hz) Bode magnitude (impedance) plot at l/s ratio of 20 The Bode magnitude plot of impedance vs. frequency displays a near constant value for the middle frequency range. This frequency range corresponds to the region with least capacitive effect (as per the
  • 8. phase plot). The real part of the impedance in this range, then, will correspond to the resistance of the solution and is approximately equal to 775 Ω. 0 200 400 600 800 1000 1200 1400 0 200 400 600 800 1000 1200 1400-Zs"(Ω) Zs' (Ω) Nyquist plot at l/s ratio of 20 The nyquist plot is developed by plotting the negative of the imaginary component of impedance (-Zs”) vs. the real part of the impedance (Zs’), both impedances taken as series components. The point at which the nyquist plot meets the x-axis is the frequency at which the imaginary component of impedance vanishes to zero. Therefore, this value of the real part of the impedance is truly the resistance of the material. This value is also obtained as 775 Ω. Direction of increasing frequency
  • 9. 7. Crushing Strength The crushing strength of the sand was obtained by developing stress vs. deformation plots (Bartake and Singh, 2007). The material was packed in a mould of 33 mm inner diameter and 110 mm length at a density corresponding to 90% of the maximum dry density. Sufficient material was taken to maintain a length/diameter ratio of unity. The material was subjected to gradual loading, at a rate of 1.25 mm/min, on a compression testing machine of 5 ton capacity (AIMIL, India), and the deformation was obtained from a dial gauge of 0.01 mm least count. The method of determining the crushing strength of the material involves plotting the applied load vs. the deformation developed with the load taken on a log-scale. Tangents are drawn at the initial linear portion and the final linear portion. The load corresponding to the point of intersection of these two tangents (point of maximum curvature) is reported as the crushing load, and the corresponding stress is reported as the crushing stress. The crushing strength obtained was 4.34 MPa. Shown below is the log (deflection) vs. load plot. -1000 0 1000 2000 3000 4000 5000 6000 10 100 Deflection(10 -2 mm) Load (Kg) Log (deflection) vs. load plot for creek sand: Crushing Strength
  • 10. 8. Thermal Tests Apart from physical characterization of the sand, it is also imperative that the thermal properties such as thermal resistivity, thermal diffusivity, and specific heat capacity and co-efficient of thermal expansion, are studied. A heat probe modeled along the principle of an infinitely long heat source (ASTM D5334-08) was used to determine the thermal resistivity, thermal diffusivity, and specific heat capacity of the materials. A dilatometer was utilized to obtain the co-efficient of thermal expansion. 8.1 Thermal Probe The concept of the infinitely long heat source has been used in the past (Blackwell, 1954; De Vries and Peck, 1958; Rao and Singh, 1999; Singh and Devid, 2000). A heat probe of length 6 cm and radius of 3.5 mm was used to model an infinitely long heat source. The probe possesses a nichrome wire of known resistance which is used for heating, and a T-type (copper-constantan) thermocouple which is used to measure changes in temperature. The probe is connected to a regulated DC power supply source and the temperature of the thermocouple is data logged on a personal computer as a function of time. The fundamental differential heat flow equation for this model is given below and was solved by Carslaw and Jaeger, 1958. 𝜕𝑇 𝜕𝑡 = 𝛼 𝜕! 𝑇 𝜕𝑟! + 1 𝑟 𝜕𝑇 𝜕𝑟 Here T is the temperature of the probe, t is the time at which measurement was made, α is the thermal diffusivity of the medium and r is the radius from the axis of the probe at which the temperature is measured. The complete derivation is available in numerous papers including the documents cited and, for the sake of brevity, has not been included in this report. The working equation of the probe method of determining thermal properties is:- 𝑅! = 𝑠 4𝜋 𝑄 Here RT is the thermal resistivity of the medium, Q is the heat generated by the probe per unit length, and s is the slope of the temperature vs. loge(time) curve for the probe.
  • 11. The probe was calibrated with glycerol which has a known thermal resistivity of 342.46 o C-cm/W (ASTM D5334), and was found to generate acceptable results when operated at 0.3V and 1.81A. Hence, the factor Q can be calculated as 𝑄 = 𝐼! 𝑅 𝐿 Where I is the current flowing in the nichrome wire, R is the electrical resistance of the nichrome wire and L is the length of the probe (6 cm). It is also possible to obtain the thermal diffusivity (α) of the materials. The derivation of this formula is not included and is available in the referred texts. 𝛼 = 𝑟! ! 2.246 X 𝑡! Here, rp is the radius of the probe (3.5 mm) and t0 is the intercept of the tangent drawn to the temperature vs. loge(time) curve, the intercept is taken at the initial temperature of the material. Once RT and α are known, the thermal capacity Cp may be calculated as 𝐶! = 1 𝜌 𝑅! 𝛼 Here ρ is the density of the material. Shown below is a chart which contains the thermal properties of the sand:
  • 12. SAMPLE STATE BULK DENSITY (g/cc) THERMAL RESISTIVITY RT ( o C-cm/W) = s (Q/4π) -1 THERMAL DIFFUSIVITY α (m 2 /s) = rp 2 /(2.246 X t0) THERMAL CAPACITY Cp (J/ o C-g) = (RT.ρ.α) -1 Oven dry 1.6 369.16 1.56E-06 0.11 Oven dry 1.75 334.04 1.82E-06 0.09 Oven dry 1.9 318.45 2.12E-06 0.08 NMC* 1.186 318.60 1.85E-06 0.14 NMC 1.3 275.26 2.72E-06 0.10 NMC 1.45 297.78 2.18E-06 0.11 NMC 1.6 272.13 2.58E-06 0.09 NMC 1.853 254.34 3.08E-06 0.07 *NMC = Natural Moisture Content and is equal to 3.94 % A clear variation of thermal resistivity with density is observable, with the resistivity showing a general decreasing trend with increasing density. The effect of moisture is also evident, with the samples at natural moisture content (3.94 %) showing distinctly lower values of resistivity for the same density. An important observation to be made is that the density variation in the dry state is quite low as compared to the density variation at the natural moisture content (NMC). Also, the presence of moisture significantly reduces the thermal resistivity. 7.2 Thermal Expansion Test The coefficient of thermal expansion was obtained using a dilatometer. The sample was prepared in the form of a pellet by compressing it in a mould of diameter 10mm. Sufficient sample was taken so as to obtain a pellet of length 13 ± 1 mm when compressed under a loading of 3 tons for 1 minute. The sample was tested in a dilatometer, subjected to a gradual heating up to 600 o C over a period of 112 minutes. Variations in the length of the sample were recorded and were reported as a Percentage Linear Change (PLC) of the original dimension. A plot of PLC against temperature is shown below.
  • 13. -100 0 100 200 300 400 500 600 700 -0.9 -0.8 -0.7 -0.6 -0.5 -0.4 -0.3 -0.2 -0.1 0.0 0.1 0.2 PLC(%) Temp ( o C) α = 4.18x10 -4 ( o C) -1 Percentage Linear Change vs. Temperature, Creek Sand It can be observed that there is a drastic drop in the length in the initial 100 o C of heating. This can be attributed to the shrinking effects produced by the loss in moisture in the sample, 100 o C being the boiling point of water. But beyond this temperature range, the sample shows a fairly consistent increase in length. The value of co-efficient of thermal expansion is reported as 4.18X10⁻⁴ o C-1 , and is calculated as the slope of the linear portion of the PLC vs. temperature plot. 8. Conclusions On analysis of the results generated, it can be seen that the sand tested has shown typical trends in its thermal properties. The material shows typical reduction in the thermal resistivity with an increase in moisture content or density. The poorly graded nature of the soil further implies that the packing of the granules will not be efficient, which means that the soil will display a higher ratio of voids as compared to a well graded soil. Further, it is important to develop error correction techniques in the methods employed to test the thermal properties. The assumptions that are made in the single probe method are not very good approximations of field conditions. Corrections for the finite radius of the probe, as well as the non-zero thermal capacity of the probe will ensure that the results are descriptive of the true nature of the material tested.
  • 14. ACKNOWLEDGEMENTS I would like to place on record my sincere thanks and immense gratitude to Prof. DN Singh for opening the doors of his laboratory to me. The sheer amount of knowledge that I have gained in my short association with this laboratory is invaluable. I would further like to thank the research scholars of the Environmental Geotechnology Laboratory, IIT-Bombay, for taking time off in order to explain the most trivial of doubts. I would like to thank Mrs. Ritu Singh and Ms. Yashi Singh for their warm hospitality. I would like to thank Prof. CP Rao, Prof. Murugavel and Prof. Anindya Datta, IIT-Bombay for handling the accommodation with panache despite the many problems that they inevitably faced. And lastly, I would like to thank the Indian Academy of Sciences for providing me this unique opportunity. I believe that this program has gone a long way in opening eyes to the world of research. I hope that the program continues successfully in the years to come, as it will be of great benefit to the student community at large. REFERENCES 1) DN Singh, K Devid Generalized relationships for estimating soil thermal resistivity, Experimental Thermal and Fluid Science (pg. 133-143), 2000 2) GS Campbell, KL Bristow The effect of soil thermal resistivity on underground power cable installations, Application Note, Decagon Devices, 2009 3) Yusuf Erzin, BH Rao, DN Singh Artificial neural network models for predicting soil thermal resistivity,
  • 15. International Journal of Thermal Sciences, 2007 4) VV Mason, M Kurtz Rapid measurement of the thermal resistivity of soil, Power Apparatus and Systems, IEEE, 1952 5) MVBB Gangadhara Rao, DN Singh A generalized relationship to estimate thermal resistivity of soils, Canadian Geotechnical Journal, 1999 6) Bryan R Becker, Anil Misra, Brian A Fricke Development of correlations for soil thermal conductivity, International Communications in Heat and Mass Transfer (pg. 59 - 68), 1992 7) ASTM D6913-04 (2009) Standard test methods for particle-size distribution (gradation) of soils using sieve analysis 8) ASTM D2487-11 Standard practice for classification of soils for engineering purposes (Unified Soil Classification System 9) ASTM D5550-06 Standard test method for specific gravity of soil solids by gas pycnometer 10) ASTM D2974-07a Standard test methods for moisture, ash and organic matter of peat and other organic soils 11) K Arulanandan Soil Structure: In-situ Properties and Behaviour 12) Prasad P Bartake, DN Singh A generalized methodology for determination of crushing strength of granular materials, Geotechnical and Geological Engineering, 2007 13) ASTM D5334-08 Standard test method for determination of thermal conductivity of soil and soft rock by thermal needle probe procedure 14) JH Blackwell A transient flow method for determination of thermal constants of insulating materials in bulk Part I and II, Journal of Applied Physics, 1954 15) DA De Vries, AJ Peck On the cylindrical probe method of measuring thermal conductivity with special reference to soils, Australian Journal of Physics, 1958