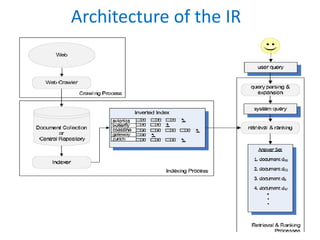
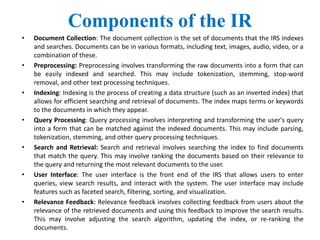
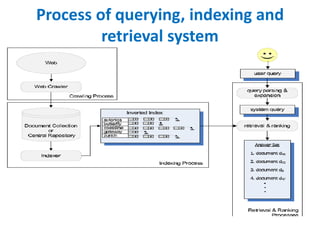
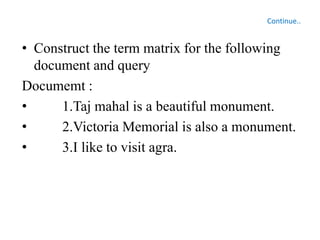
V.3 poster current citations and a future with linked dataIliadis Dimitrios
1) Converting citation data to linked data has several advantages such as allowing other applications to use the citation data, describing the reasons publications were cited, and connecting citation information like authors and papers.
2) Linked data assigns unique identifiers (URIs) to citations and related information and describes relationships between cited and citing publications using RDF triples. This allows connecting citation data to other linked open data.
3) Projects that convert citation data to linked data use URIs, RDF triples, and ontologies like CiTO to describe citation intent. This enables advanced searches, citation network visualizations, and linking to other semantic data.
The document provides an overview of key concepts in data science and big data including:
1) It defines data science, data scientists, and their roles in extracting insights from structured, semi-structured, and unstructured data.
2) It explains different data types like structured, semi-structured, unstructured and their characteristics from a data analytics perspective.
3) It describes the data value chain involving data acquisition, analysis, curation, storage, and usage to generate value from data.
4) It introduces concepts in big data like the 3V's of volume, velocity and variety, and technologies like Hadoop and its ecosystem that are used for distributed processing of large datasets.
This document discusses data exploration techniques for understanding data characteristics. It describes exploratory data analysis which focuses on visualization, clustering, and anomaly detection. Common techniques in data exploration include summary statistics, visualization using histograms, scatter plots, box plots, and parallel coordinates, as well as online analytical processing to create multidimensional data arrays. These techniques are demonstrated using the Iris data set to identify patterns and relationships between attributes.
Visual tools for databade queries and analysismoochm
The document describes visualization tools developed for a cancer research database at the Kentucky Cancer Registry (KCR). The tools include a query builder that allows intuitive definition of data queries without programming. Queries can be saved, modified and combined. Visualization tools include scaled Venn diagrams, histograms, survival trends and statistical analysis to explore relationships in the data. The tools have become integrated into the KCR's online system and have supported cancer research through analysis of over 30,000 patient records.
UNIT - 5: Data Warehousing and Data MiningNandakumar P
UNIT-V
Mining Object, Spatial, Multimedia, Text, and Web Data: Multidimensional Analysis and Descriptive Mining of Complex Data Objects – Spatial Data Mining – Multimedia Data Mining – Text Mining – Mining the World Wide Web.
- Data mining is the process of discovering interesting patterns and knowledge from large amounts of data. It involves steps like data cleaning, integration, selection, transformation, mining, pattern evaluation and knowledge presentation.
- There are various types of data that can be mined, including database data, data warehouses, transactional data, text data, web data, time-series data, images, audio, video and others. Common data mining techniques include characterization, discrimination, clustering, classification, regression, and outlier detection. The goal is to extract useful patterns from data for tasks like prediction and description.
This document provides an introduction to text mining and information retrieval. It discusses how text mining is used to extract knowledge and patterns from unstructured text sources. The key steps of text mining include preprocessing text, applying techniques like summarization and classification, and analyzing the results. Text databases and information retrieval systems are described. Various models and techniques for text retrieval are outlined, including Boolean, vector space, and probabilistic models. Evaluation measures like precision and recall are also introduced.
This document provides an overview of key concepts in data science and big data, including:
- Data science involves extracting knowledge and insights from structured, semi-structured, and unstructured data.
- The data value chain describes the process of acquiring data, analyzing it, curating it for storage, and using it.
- Big data is characterized by its volume, velocity, variety, and veracity. Hadoop is an open-source framework that allows distributed processing of large datasets across computer clusters.
This document discusses the process of data processing. It defines data processing as the intermediary stage between data collection and data interpretation. The key steps in data processing include identifying the data structure, editing the data, coding and classifying the data, transcribing the data, and tabulating the data. These steps prepare the raw data for meaningful analysis and interpretation to test research hypotheses. Proper data processing requires advance planning and defines the variables and relationships between them.
This document provides an introduction to Microsoft Access databases. It defines what a database is and describes the key components of an Access database, including tables, queries, forms and reports. It also outlines common database terminology like records, fields, primary keys and relationships. Database objects in Access are described as well as different data types. The document concludes by covering how to create a new blank Access database.
Leveraging Electronic Resources for Academic Research (Prof. Adebayo Felix A...miracleAtianashie1
This document discusses leveraging electronic resources for academic research. It begins by explaining how electronic resources have transformed academic research by providing access to vast amounts of information online. It then defines electronic resources and provides examples of different types, such as online databases, e-books, e-journals, and open access repositories. The document also outlines several benefits of electronic resources, such as accessibility, cost-efficiency, and up-to-date content. Finally, it provides tips for effective search strategies when using electronic resources, including the use of Boolean operators and advanced search techniques like phrase searching and filters.
The talk titled "Realizing Semantic Web - Light Weight semantics and beyond" given by prof. T.K. Prasad at the ICMSE-MGI Digital Data Workshop held at Kno.e.sis Center from November 13-14 2013. The talk emphasized on annotation and search framework.
workshop page: http://wiki.knoesis.org/index.php/ICMSE-MGI_Digital_Data_Workshop
Despite being controversial, research metrics are becoming a key component of research evaluation processes globally. Nevertheless, accessing research metrics to support these processes in a timely manner is not a straightforward task, as it requires either having access to expensive commercial solutions such as Elsevier SciVal or Clarivate Analytics' InCites, or having substantial knowledge of existing APIs and data sources as well as the ability and skills needed to analyse large amounts of raw scholarly data in-house. This is especially the case on a department or institutional level where large amounts of data have to be aggregated prior to analysis. To alleviate this problem we have designed and prototyped CORE Analytics Dashboard – a tool for analytical evaluation of research outputs of universities. The aim of the CORE Analytics Dashboard is to help universities analyse their performance using a variety of metrics captured from openly available data sources, including citation counts and social media metrics, and to help them compare their performance with other institutions. This paper presents the motivation behind developing this dashboard and its main features.
1) The document discusses classifying digital arts and humanities projects using a shared taxonomy and methods database hosted on the website arts-humanities.net.
2) It proposes moving to a semantic web/linked data approach to allow for shared editing, improved discovery of related information, and overcoming issues of different terminology across fields.
3) By developing the taxonomy as a shared service, it could bring together the digital humanities and arts community around a resource they jointly own and benefit from.
This document describes the basic architecture of a search engine, including its two main processes: indexing and query. The indexing process involves acquiring text from sources, transforming it by parsing, stemming, etc., and creating indexes for fast searching. The query process allows users to input queries, transform queries, rank and retrieve relevant documents from the indexes, and output search results. Key components described are crawlers, parsers, stemmers, inverted indexes, ranking algorithms, and query logs for evaluation.
This document provides an overview of a database management systems course. The course objectives are to understand the purpose and concepts of DBMS, apply database design and languages to manage data, learn about normalization, SQL implementation, transaction control, recovery strategies, storage, and indexing. The outcomes are knowledge of various data models, database design process, transaction management, users and administration. Key topics covered include the relational and entity-relationship data models, database design, transactions, and database users and administration.
Data is unprocessed facts and figures that can be represented using characters. Information is processed data used to make decisions. Data science uses scientific methods to extract knowledge from structured, semi-structured, and unstructured data. The data processing cycle involves inputting data, processing it, and outputting the results. There are different types of data from both computer programming and data analytics perspectives including structured, semi-structured, and unstructured data. Metadata provides additional context about data.
A database is an organized collection of structured data stored electronically in a computer system and controlled by a database management system. Data is typically modeled in rows and columns across tables to make processing and querying efficient. Relational databases use SQL for writing and querying data. Data modeling is the process of creating a conceptual representation of data objects and their relationships to enforce business rules and ensure data quality and consistency. The main types of data models are conceptual, logical, and physical models. Conceptual models establish entities, attributes, and relationships at a high level without database structure details.
Data mining functionalities can be used to specify the kind of patterns to be found and can be classified into descriptive and predictive tasks. Descriptive tasks characterize general data properties while predictive tasks perform inference to make predictions. Key tasks include data characterization, discrimination, classification, prediction, clustering, outlier analysis and evolution analysis. Patterns must be interesting to be useful, which means they are understandable, valid, potentially useful and novel. Not all possible patterns are interesting or efficient to generate, so data mining aims to generate only interesting patterns.
Brief description of the 3 mining techniques and we give a brief description of the differences between them and the similarities. Finally we talked about the shared techniques.
This document discusses the key primitives, languages, and architectures for data mining systems. It describes five primitives for specifying a data mining task: task-relevant data, kind of knowledge to be mined, background knowledge, interestingness measures, and knowledge presentation. It also discusses data mining query languages like DMQL and system architectures ranging from no coupling to tight coupling with database/data warehouse systems.
Data mining concept and methods for basicNivaTripathy2
This document provides an overview of data mining concepts and techniques. It discusses why data mining is useful given the massive amount of data being collected. Data mining involves extracting patterns from large datasets and can be used for applications like market analysis, risk analysis, and fraud detection. The document outlines the key steps in the knowledge discovery process including data preprocessing, data mining, and pattern evaluation. It also describes different types of patterns that can be mined, such as associations, classifications, and clusters. Factors that determine whether patterns are interesting to users are discussed. Finally, the document introduces the concept of a data mining query language to allow interactive exploration of patterns.
This document discusses different methods for organizing data, including non-computerized and computerized databases. It describes flat file databases which organize data into tables with records and fields. Relational databases organize data into linked tables with entities, attributes, and relationships. The document also discusses data modeling, schemas, entity relationship diagrams, and hypermedia including hyperlinks and storyboards.
The document discusses procedures for digitizing content and managing digital libraries. It addresses the importance of documenting digitization processes and having standard operating procedures. It also discusses the differences between evaluating digital libraries through offline paper/pencil surveys versus online surveys. A study is described that found no significant differences in usability scores between offline and online surveys of a digital library when using the System Usability Scale, but the online survey had more incomplete responses and less engagement with open-ended questions. Both online and offline approaches have advantages and drawbacks for evaluating digital libraries.
Data visualization is a technique used to communicate data through visual representations such as charts, graphs, and maps. It allows patterns, trends, and correlations in data to be recognized more easily than text-based representations. The history of data visualization dates back to 1160 BC with the Turin Papyrus Map, though it has evolved significantly with modern tools going beyond standard charts. Data visualization has advantages like faster comprehension and understanding connections, but also disadvantages like different interpretations among users and a false sense of understanding without explanations. It has applications in business, science, and many other domains.
TIME DIVISION MULTIPLEXING TECHNIQUE FOR COMMUNICATION SYSTEMHODECEDSIET
Time Division Multiplexing (TDM) is a method of transmitting multiple signals over a single communication channel by dividing the signal into many segments, each having a very short duration of time. These time slots are then allocated to different data streams, allowing multiple signals to share the same transmission medium efficiently. TDM is widely used in telecommunications and data communication systems.
### How TDM Works
1. **Time Slots Allocation**: The core principle of TDM is to assign distinct time slots to each signal. During each time slot, the respective signal is transmitted, and then the process repeats cyclically. For example, if there are four signals to be transmitted, the TDM cycle will divide time into four slots, each assigned to one signal.
2. **Synchronization**: Synchronization is crucial in TDM systems to ensure that the signals are correctly aligned with their respective time slots. Both the transmitter and receiver must be synchronized to avoid any overlap or loss of data. This synchronization is typically maintained by a clock signal that ensures time slots are accurately aligned.
3. **Frame Structure**: TDM data is organized into frames, where each frame consists of a set of time slots. Each frame is repeated at regular intervals, ensuring continuous transmission of data streams. The frame structure helps in managing the data streams and maintaining the synchronization between the transmitter and receiver.
4. **Multiplexer and Demultiplexer**: At the transmitting end, a multiplexer combines multiple input signals into a single composite signal by assigning each signal to a specific time slot. At the receiving end, a demultiplexer separates the composite signal back into individual signals based on their respective time slots.
### Types of TDM
1. **Synchronous TDM**: In synchronous TDM, time slots are pre-assigned to each signal, regardless of whether the signal has data to transmit or not. This can lead to inefficiencies if some time slots remain empty due to the absence of data.
2. **Asynchronous TDM (or Statistical TDM)**: Asynchronous TDM addresses the inefficiencies of synchronous TDM by allocating time slots dynamically based on the presence of data. Time slots are assigned only when there is data to transmit, which optimizes the use of the communication channel.
### Applications of TDM
- **Telecommunications**: TDM is extensively used in telecommunication systems, such as in T1 and E1 lines, where multiple telephone calls are transmitted over a single line by assigning each call to a specific time slot.
- **Digital Audio and Video Broadcasting**: TDM is used in broadcasting systems to transmit multiple audio or video streams over a single channel, ensuring efficient use of bandwidth.
- **Computer Networks**: TDM is used in network protocols and systems to manage the transmission of data from multiple sources over a single network medium.
### Advantages of TDM
- **Efficient Use of Bandwidth**: TDM all
More Related Content
Similar to Information Retrieval basic presentation
This document discusses the process of data processing. It defines data processing as the intermediary stage between data collection and data interpretation. The key steps in data processing include identifying the data structure, editing the data, coding and classifying the data, transcribing the data, and tabulating the data. These steps prepare the raw data for meaningful analysis and interpretation to test research hypotheses. Proper data processing requires advance planning and defines the variables and relationships between them.
This document provides an introduction to Microsoft Access databases. It defines what a database is and describes the key components of an Access database, including tables, queries, forms and reports. It also outlines common database terminology like records, fields, primary keys and relationships. Database objects in Access are described as well as different data types. The document concludes by covering how to create a new blank Access database.
Leveraging Electronic Resources for Academic Research (Prof. Adebayo Felix A...miracleAtianashie1
This document discusses leveraging electronic resources for academic research. It begins by explaining how electronic resources have transformed academic research by providing access to vast amounts of information online. It then defines electronic resources and provides examples of different types, such as online databases, e-books, e-journals, and open access repositories. The document also outlines several benefits of electronic resources, such as accessibility, cost-efficiency, and up-to-date content. Finally, it provides tips for effective search strategies when using electronic resources, including the use of Boolean operators and advanced search techniques like phrase searching and filters.
The talk titled "Realizing Semantic Web - Light Weight semantics and beyond" given by prof. T.K. Prasad at the ICMSE-MGI Digital Data Workshop held at Kno.e.sis Center from November 13-14 2013. The talk emphasized on annotation and search framework.
workshop page: http://wiki.knoesis.org/index.php/ICMSE-MGI_Digital_Data_Workshop
Despite being controversial, research metrics are becoming a key component of research evaluation processes globally. Nevertheless, accessing research metrics to support these processes in a timely manner is not a straightforward task, as it requires either having access to expensive commercial solutions such as Elsevier SciVal or Clarivate Analytics' InCites, or having substantial knowledge of existing APIs and data sources as well as the ability and skills needed to analyse large amounts of raw scholarly data in-house. This is especially the case on a department or institutional level where large amounts of data have to be aggregated prior to analysis. To alleviate this problem we have designed and prototyped CORE Analytics Dashboard – a tool for analytical evaluation of research outputs of universities. The aim of the CORE Analytics Dashboard is to help universities analyse their performance using a variety of metrics captured from openly available data sources, including citation counts and social media metrics, and to help them compare their performance with other institutions. This paper presents the motivation behind developing this dashboard and its main features.
1) The document discusses classifying digital arts and humanities projects using a shared taxonomy and methods database hosted on the website arts-humanities.net.
2) It proposes moving to a semantic web/linked data approach to allow for shared editing, improved discovery of related information, and overcoming issues of different terminology across fields.
3) By developing the taxonomy as a shared service, it could bring together the digital humanities and arts community around a resource they jointly own and benefit from.
This document describes the basic architecture of a search engine, including its two main processes: indexing and query. The indexing process involves acquiring text from sources, transforming it by parsing, stemming, etc., and creating indexes for fast searching. The query process allows users to input queries, transform queries, rank and retrieve relevant documents from the indexes, and output search results. Key components described are crawlers, parsers, stemmers, inverted indexes, ranking algorithms, and query logs for evaluation.
This document provides an overview of a database management systems course. The course objectives are to understand the purpose and concepts of DBMS, apply database design and languages to manage data, learn about normalization, SQL implementation, transaction control, recovery strategies, storage, and indexing. The outcomes are knowledge of various data models, database design process, transaction management, users and administration. Key topics covered include the relational and entity-relationship data models, database design, transactions, and database users and administration.
Data is unprocessed facts and figures that can be represented using characters. Information is processed data used to make decisions. Data science uses scientific methods to extract knowledge from structured, semi-structured, and unstructured data. The data processing cycle involves inputting data, processing it, and outputting the results. There are different types of data from both computer programming and data analytics perspectives including structured, semi-structured, and unstructured data. Metadata provides additional context about data.
A database is an organized collection of structured data stored electronically in a computer system and controlled by a database management system. Data is typically modeled in rows and columns across tables to make processing and querying efficient. Relational databases use SQL for writing and querying data. Data modeling is the process of creating a conceptual representation of data objects and their relationships to enforce business rules and ensure data quality and consistency. The main types of data models are conceptual, logical, and physical models. Conceptual models establish entities, attributes, and relationships at a high level without database structure details.
Data mining functionalities can be used to specify the kind of patterns to be found and can be classified into descriptive and predictive tasks. Descriptive tasks characterize general data properties while predictive tasks perform inference to make predictions. Key tasks include data characterization, discrimination, classification, prediction, clustering, outlier analysis and evolution analysis. Patterns must be interesting to be useful, which means they are understandable, valid, potentially useful and novel. Not all possible patterns are interesting or efficient to generate, so data mining aims to generate only interesting patterns.
Brief description of the 3 mining techniques and we give a brief description of the differences between them and the similarities. Finally we talked about the shared techniques.
This document discusses the key primitives, languages, and architectures for data mining systems. It describes five primitives for specifying a data mining task: task-relevant data, kind of knowledge to be mined, background knowledge, interestingness measures, and knowledge presentation. It also discusses data mining query languages like DMQL and system architectures ranging from no coupling to tight coupling with database/data warehouse systems.
Data mining concept and methods for basicNivaTripathy2
This document provides an overview of data mining concepts and techniques. It discusses why data mining is useful given the massive amount of data being collected. Data mining involves extracting patterns from large datasets and can be used for applications like market analysis, risk analysis, and fraud detection. The document outlines the key steps in the knowledge discovery process including data preprocessing, data mining, and pattern evaluation. It also describes different types of patterns that can be mined, such as associations, classifications, and clusters. Factors that determine whether patterns are interesting to users are discussed. Finally, the document introduces the concept of a data mining query language to allow interactive exploration of patterns.
This document discusses different methods for organizing data, including non-computerized and computerized databases. It describes flat file databases which organize data into tables with records and fields. Relational databases organize data into linked tables with entities, attributes, and relationships. The document also discusses data modeling, schemas, entity relationship diagrams, and hypermedia including hyperlinks and storyboards.
The document discusses procedures for digitizing content and managing digital libraries. It addresses the importance of documenting digitization processes and having standard operating procedures. It also discusses the differences between evaluating digital libraries through offline paper/pencil surveys versus online surveys. A study is described that found no significant differences in usability scores between offline and online surveys of a digital library when using the System Usability Scale, but the online survey had more incomplete responses and less engagement with open-ended questions. Both online and offline approaches have advantages and drawbacks for evaluating digital libraries.
Data visualization is a technique used to communicate data through visual representations such as charts, graphs, and maps. It allows patterns, trends, and correlations in data to be recognized more easily than text-based representations. The history of data visualization dates back to 1160 BC with the Turin Papyrus Map, though it has evolved significantly with modern tools going beyond standard charts. Data visualization has advantages like faster comprehension and understanding connections, but also disadvantages like different interpretations among users and a false sense of understanding without explanations. It has applications in business, science, and many other domains.
Similar to Information Retrieval basic presentation (20)
TIME DIVISION MULTIPLEXING TECHNIQUE FOR COMMUNICATION SYSTEMHODECEDSIET
Time Division Multiplexing (TDM) is a method of transmitting multiple signals over a single communication channel by dividing the signal into many segments, each having a very short duration of time. These time slots are then allocated to different data streams, allowing multiple signals to share the same transmission medium efficiently. TDM is widely used in telecommunications and data communication systems.
### How TDM Works
1. **Time Slots Allocation**: The core principle of TDM is to assign distinct time slots to each signal. During each time slot, the respective signal is transmitted, and then the process repeats cyclically. For example, if there are four signals to be transmitted, the TDM cycle will divide time into four slots, each assigned to one signal.
2. **Synchronization**: Synchronization is crucial in TDM systems to ensure that the signals are correctly aligned with their respective time slots. Both the transmitter and receiver must be synchronized to avoid any overlap or loss of data. This synchronization is typically maintained by a clock signal that ensures time slots are accurately aligned.
3. **Frame Structure**: TDM data is organized into frames, where each frame consists of a set of time slots. Each frame is repeated at regular intervals, ensuring continuous transmission of data streams. The frame structure helps in managing the data streams and maintaining the synchronization between the transmitter and receiver.
4. **Multiplexer and Demultiplexer**: At the transmitting end, a multiplexer combines multiple input signals into a single composite signal by assigning each signal to a specific time slot. At the receiving end, a demultiplexer separates the composite signal back into individual signals based on their respective time slots.
### Types of TDM
1. **Synchronous TDM**: In synchronous TDM, time slots are pre-assigned to each signal, regardless of whether the signal has data to transmit or not. This can lead to inefficiencies if some time slots remain empty due to the absence of data.
2. **Asynchronous TDM (or Statistical TDM)**: Asynchronous TDM addresses the inefficiencies of synchronous TDM by allocating time slots dynamically based on the presence of data. Time slots are assigned only when there is data to transmit, which optimizes the use of the communication channel.
### Applications of TDM
- **Telecommunications**: TDM is extensively used in telecommunication systems, such as in T1 and E1 lines, where multiple telephone calls are transmitted over a single line by assigning each call to a specific time slot.
- **Digital Audio and Video Broadcasting**: TDM is used in broadcasting systems to transmit multiple audio or video streams over a single channel, ensuring efficient use of bandwidth.
- **Computer Networks**: TDM is used in network protocols and systems to manage the transmission of data from multiple sources over a single network medium.
### Advantages of TDM
- **Efficient Use of Bandwidth**: TDM all
Introduction- e - waste – definition - sources of e-waste– hazardous substances in e-waste - effects of e-waste on environment and human health- need for e-waste management– e-waste handling rules - waste minimization techniques for managing e-waste – recycling of e-waste - disposal treatment methods of e- waste – mechanism of extraction of precious metal from leaching solution-global Scenario of E-waste – E-waste in India- case studies.
Optimizing Gradle Builds - Gradle DPE Tour Berlin 2024Sinan KOZAK
Sinan from the Delivery Hero mobile infrastructure engineering team shares a deep dive into performance acceleration with Gradle build cache optimizations. Sinan shares their journey into solving complex build-cache problems that affect Gradle builds. By understanding the challenges and solutions found in our journey, we aim to demonstrate the possibilities for faster builds. The case study reveals how overlapping outputs and cache misconfigurations led to significant increases in build times, especially as the project scaled up with numerous modules using Paparazzi tests. The journey from diagnosing to defeating cache issues offers invaluable lessons on maintaining cache integrity without sacrificing functionality.
KuberTENes Birthday Bash Guadalajara - K8sGPT first impressionsVictor Morales
K8sGPT is a tool that analyzes and diagnoses Kubernetes clusters. This presentation was used to share the requirements and dependencies to deploy K8sGPT in a local environment.
Comparative analysis between traditional aquaponics and reconstructed aquapon...bijceesjournal
The aquaponic system of planting is a method that does not require soil usage. It is a method that only needs water, fish, lava rocks (a substitute for soil), and plants. Aquaponic systems are sustainable and environmentally friendly. Its use not only helps to plant in small spaces but also helps reduce artificial chemical use and minimizes excess water use, as aquaponics consumes 90% less water than soil-based gardening. The study applied a descriptive and experimental design to assess and compare conventional and reconstructed aquaponic methods for reproducing tomatoes. The researchers created an observation checklist to determine the significant factors of the study. The study aims to determine the significant difference between traditional aquaponics and reconstructed aquaponics systems propagating tomatoes in terms of height, weight, girth, and number of fruits. The reconstructed aquaponics system’s higher growth yield results in a much more nourished crop than the traditional aquaponics system. It is superior in its number of fruits, height, weight, and girth measurement. Moreover, the reconstructed aquaponics system is proven to eliminate all the hindrances present in the traditional aquaponics system, which are overcrowding of fish, algae growth, pest problems, contaminated water, and dead fish.
Batteries -Introduction – Types of Batteries – discharging and charging of battery - characteristics of battery –battery rating- various tests on battery- – Primary battery: silver button cell- Secondary battery :Ni-Cd battery-modern battery: lithium ion battery-maintenance of batteries-choices of batteries for electric vehicle applications.
Fuel Cells: Introduction- importance and classification of fuel cells - description, principle, components, applications of fuel cells: H2-O2 fuel cell, alkaline fuel cell, molten carbonate fuel cell and direct methanol fuel cells.
Literature Review Basics and Understanding Reference Management.pptxDr Ramhari Poudyal
Three-day training on academic research focuses on analytical tools at United Technical College, supported by the University Grant Commission, Nepal. 24-26 May 2024
3. Components of the IR
• Document Collection: The document collection is the set of documents that the IRS indexes
and searches. Documents can be in various formats, including text, images, audio, video, or a
combination of these.
• Preprocessing: Preprocessing involves transforming the raw documents into a form that can
be easily indexed and searched. This may include tokenization, stemming, stop-word
removal, and other text processing techniques.
• Indexing: Indexing is the process of creating a data structure (such as an inverted index) that
allows for efficient searching and retrieval of documents. The index maps terms or keywords
to the documents in which they appear.
• Query Processing: Query processing involves interpreting and transforming the user's query
into a form that can be matched against the indexed documents. This may include parsing,
tokenization, stemming, and other query processing techniques.
• Search and Retrieval: Search and retrieval involves searching the index to find documents
that match the query. This may involve ranking the documents based on their relevance to
the query and returning the most relevant documents to the user.
• User Interface: The user interface is the front end of the IRS that allows users to enter
queries, view search results, and interact with the system. The user interface may include
features such as faceted search, filtering, sorting, and visualization.
• Relevance Feedback: Relevance feedback involves collecting feedback from users about the
relevance of the retrieved documents and using this feedback to improve the search results.
This may involve adjusting the search algorithm, updating the index, or re-ranking the
documents.
5. Information Retrieval Model
• basic information retrieval model.
• Classical IR Model
• Boolean Model
• Vector Space Model
• Probability Distribution Model
6. Continue..
• Boolean Model: This model is based on Boolean logic,
where a query is formulated using logical operators such as
AND, OR, and NOT. The model returns documents that
satisfy the Boolean expression specified in the query.
• Vector Space Model (VSM): This model represents
documents and queries as vectors in a high-dimensional
space, where each dimension corresponds to a term. The
similarity between a document and a query is measured
using a similarity metric, such as the cosine similarity.
• Probabilistic Model: This model estimates the probability
of a document being relevant to a query based on the
probability of the query terms appearing in the document.
One of the most well-known probabilistic models is the
Binary Independence Model (BIM).
7. Visualization Interface
• Scatter Plots: Scatter plots are used to display the relationship between two variables, and
they can be used to show the distribution of search results based on two different dimensions,
such as relevance and publication date.
• Bar Charts: Bar charts are used to display the frequency or count of items in different
categories, and they can be used to show the distribution of search results based on different
facets, such as document type, author, or topic.
• Line Charts: Line charts are used to display trends over time, and they can be used to show
the distribution of search results based on a temporal dimension, such as publication date or
time of access.
• Heat Maps: Heat maps are used to display data in a matrix format, where the values are
represented by colors. They can be used to show the distribution of search results based on
two dimensions, such as relevance and publication date.
• Word Clouds: Word clouds are used to display the frequency of terms in a text, with more
frequent terms displayed in larger font sizes. They can be used to show the distribution of
terms in the search results or to highlight the most relevant terms in a document.
• Network Graphs: Network graphs are used to display relationships between entities, such as
documents, authors, or topics. They can be used to show the connections between documents
based on citations, references, or other relationships.
• Map Visualizations: Map visualizations are used to display geographical data, and they can be
used to show the distribution of search results based on geographical dimensions, such as
location or region.
8. Continue..
• Construct the term matrix for the following
document and query
Documemt :
• 1.Taj mahal is a beautiful monument.
• 2.Victoria Memorial is also a monument.
• 3.I like to visit agra.
9. • Construct the term matrix for the following
document and query
• Documemt :
• 1.Taj mahal is a beautiful monument.
• 2.Victoria Memorial is also a monument.
• 3.I like to visit agra.
Continue..
10. Term Document Matrix
D1 D2 D3
• Taj 1 0 0
• mahal 1 0 0
• is 1 1 0
• a 1 1 1
• beautiful 1 0 0
• monument 1 1 0
• Victoria 0 1 0
• Memorial 0 1 0
• also 0 1 0
• I 0 0 1
• like 0 0 1
• to 0 0 1
• visit 0 0 1
• agra 0 0 1
In this matrix, the rows represent
the terms, and the columns
represent the documents (D1, D2,
and D3). The entries in the matrix
represent the term frequency in
each document. For example, the
term "Taj" appears once in
document D1 and not in documents
D2 and D3, so its entry in the
matrix is (1, 0, 0).