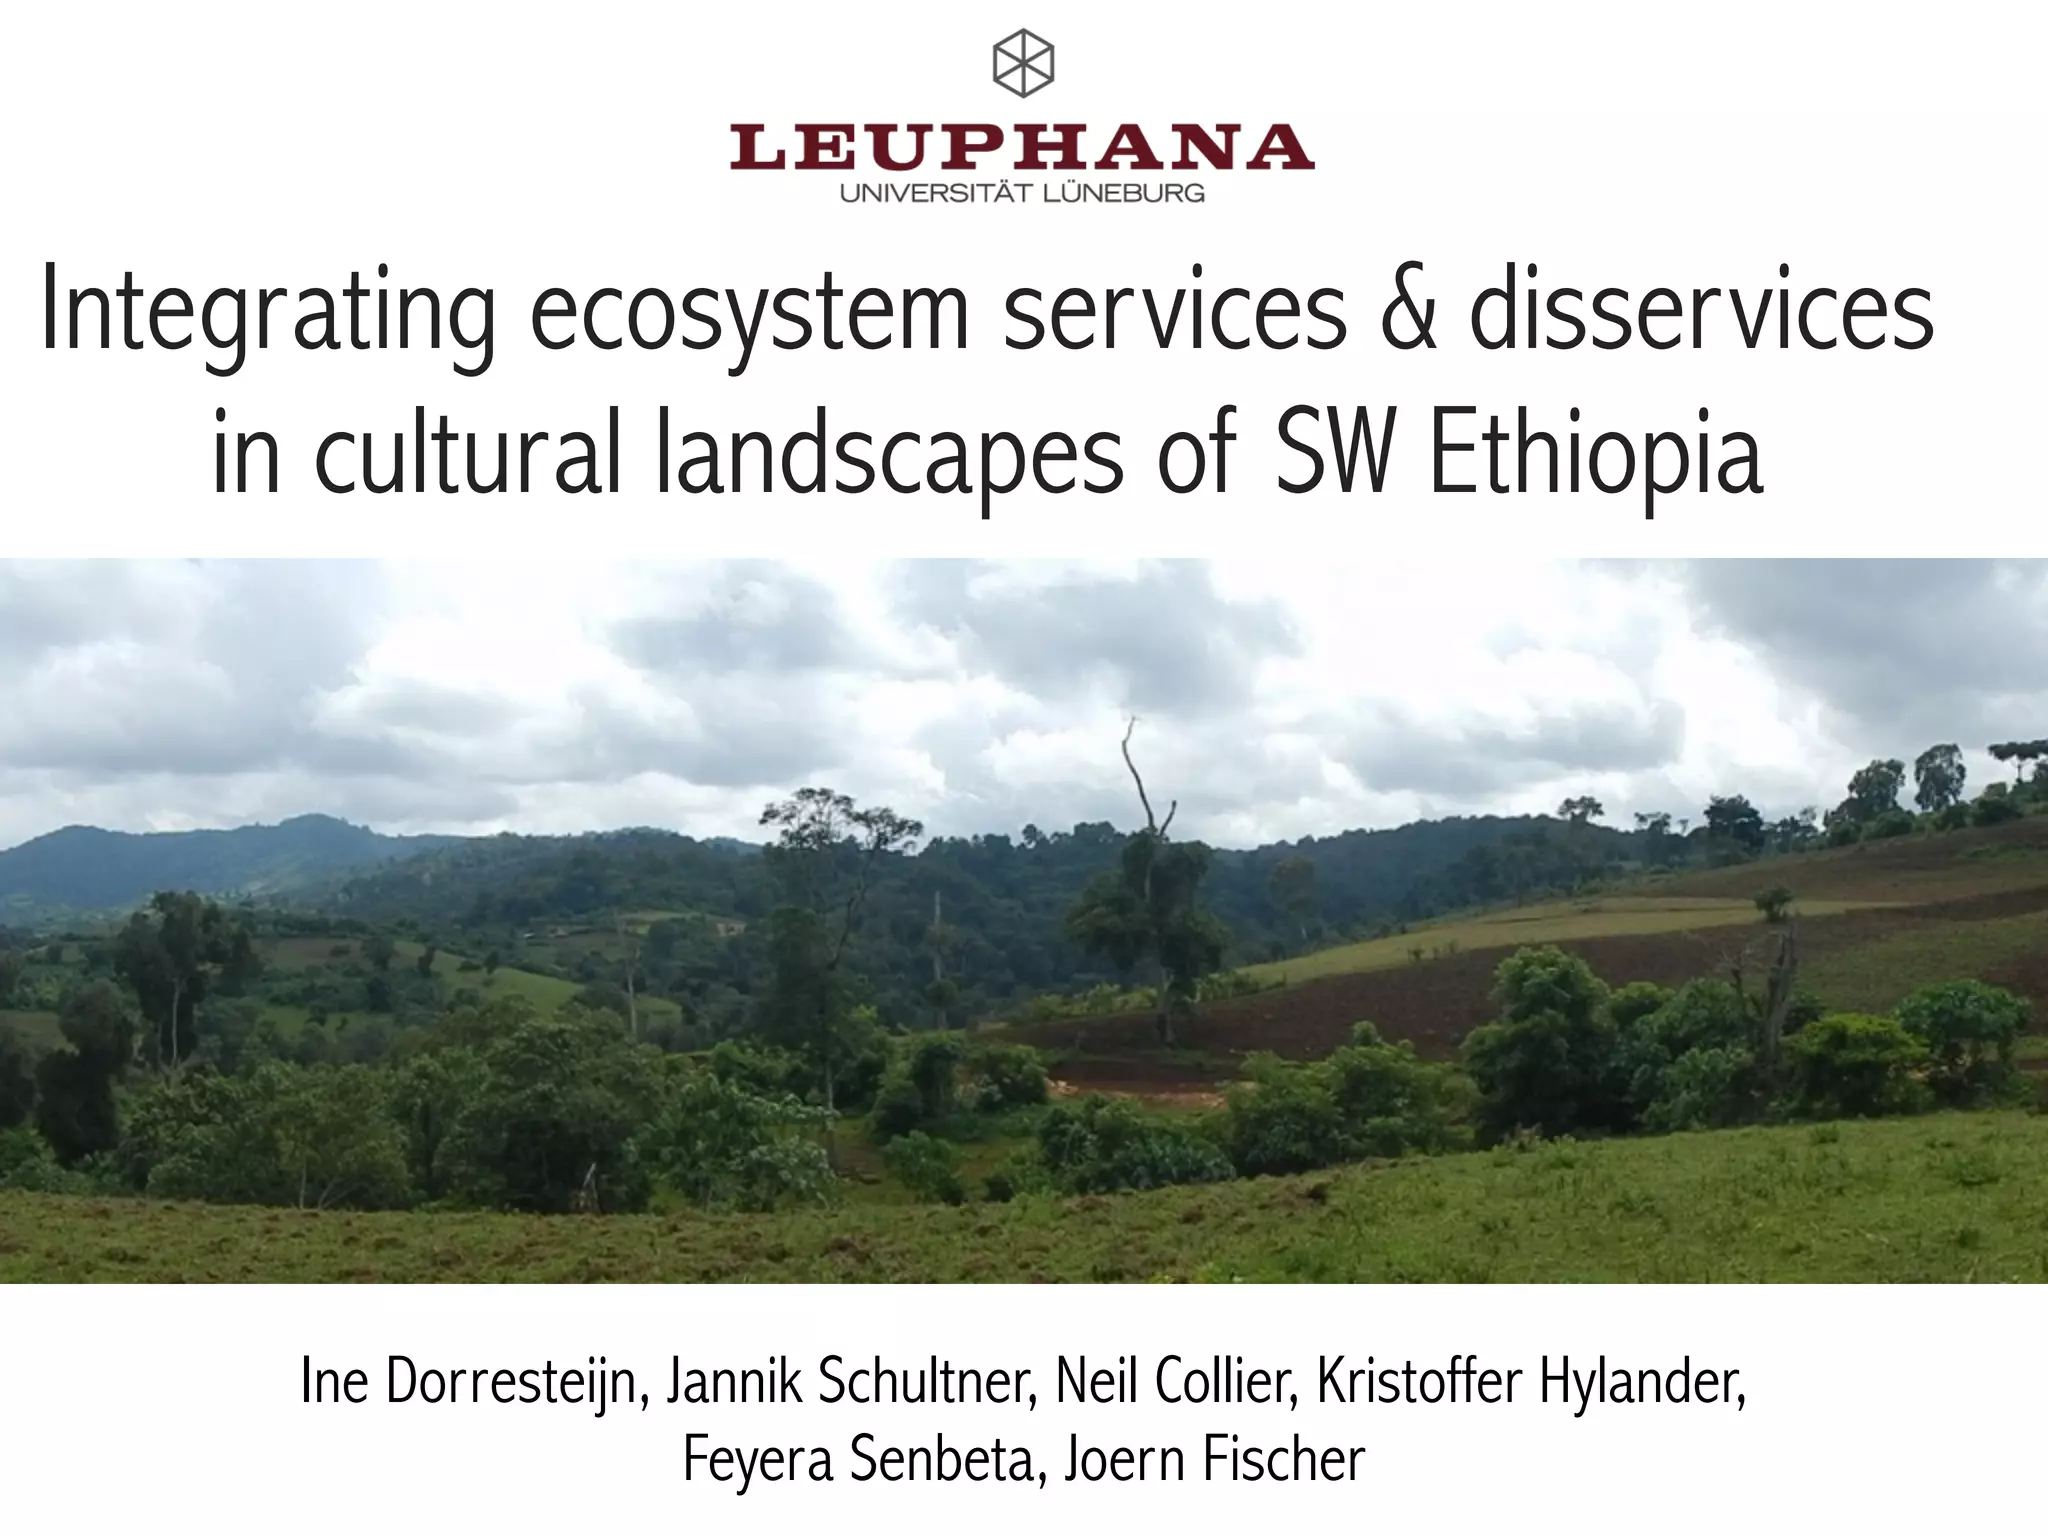
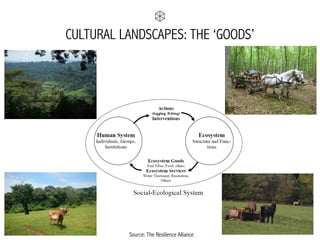
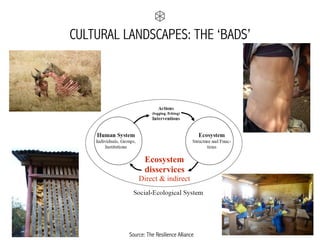
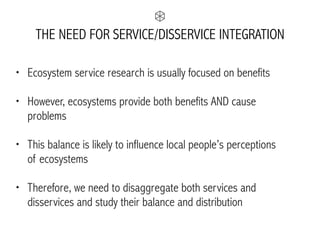
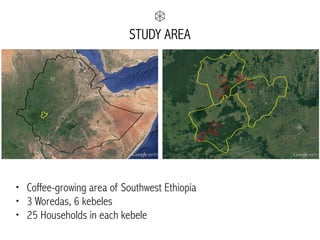
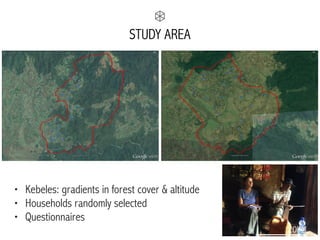
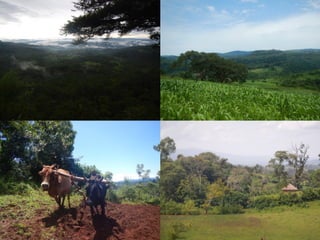
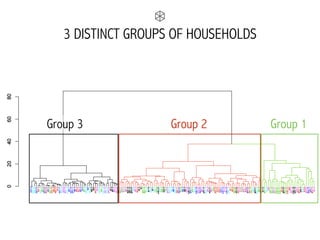
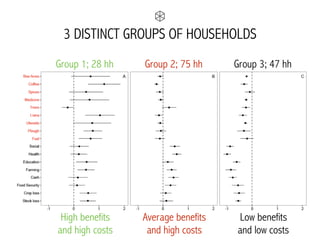
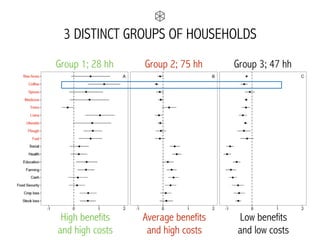
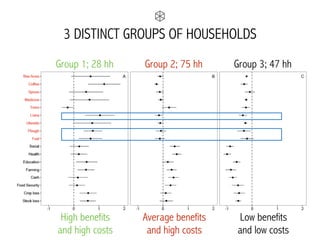
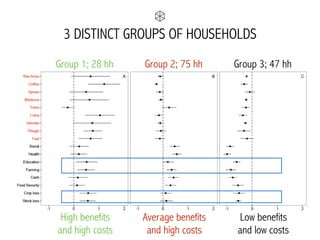
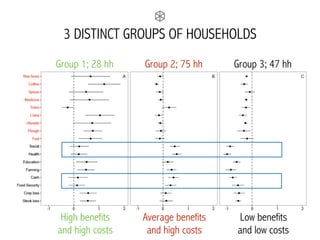
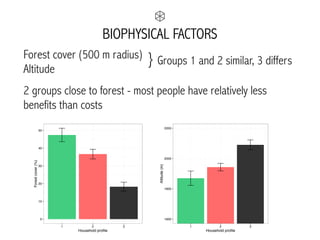
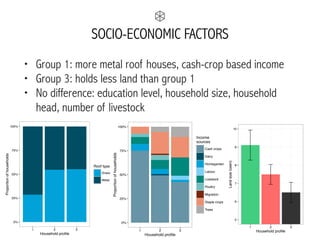
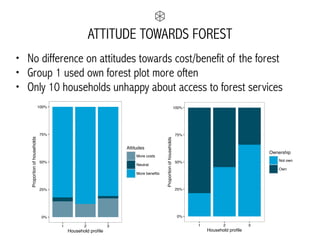
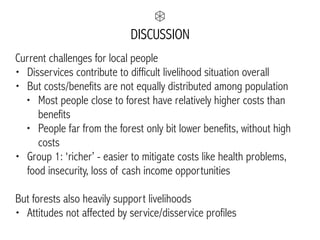
Integrating ecosystem services & disservices
in cultural landscapes of SW Ethiopia
Ine Dorresteijn, Jannik Schultner, Neil Collier, Kristoffer Hylander,

Feyera Senbeta, Joern Fischer
CULTURAL LANDSCAPES: SOCIAL-ECOLOGICAL SYSTEMS
Source: The Resilience Alliance
CULTURAL LANDSCAPES: THE ‘GOODS’
Source: The Resilience Alliance
CULTURAL LANDSCAPES: THE ‘BADS’
Source: The Resilience Alliance
Ecosystem
disservices
Direct & indirect
THE NEED FOR SERVICE/DISSERVICE INTEGRATION
• Ecosystem service research is usually focused on benefits
• However, ecosystems provide both benefits AND cause
problems
• This balance is likely to influence local people’s perceptions 

of ecosystems
• Therefore, we need to disaggregate both services and
disservices and study their balance and distribution
AIMS
To integrate ecosystem services and disservices with a case-study
from southwest Ethiopia
1. Disaggregate forest ecosystem services and disservices
through grouping of households (profiles)

2. Link these profiles to biophysical, socio-economic, and
attitudes of people to the forest
METHODS
20KMSOURCE: GOOGLE MAPS
• Coffee-growing area of Southwest Ethiopia
• 3 Woredas, 6 kebeles
• 25 Households in each kebele
STUDY AREA
20KM
STUDY AREA
• Kebeles: gradients in forest cover & altitude
• Households randomly selected
• Questionnaires
Provisioning forest ecosystem services
• Bee hives
• Coffee
• Spices
• Medicinal plants
• Trees for house construction
• Lianas
• Trees for utensils
• Ploughs
• Firewood
ECOSYSTEM SERVICES
ECOSYSTEM DISSERVICES
Direct Disservices
• Crop loss
• Livestock predation
Indirect Disservices
• Social relationships
• Health
• Education
• Farming opportunities
• Cash income opportunities
• Food security
RESULTS
CULPRITS AND VICTIMS
Field crops (maize, teff, sorghum) often destroyed by baboons,
bush pigs, warthogs; other crops/animals less important
Larger livestock (cattle, horses) predated by hyena, leopard, lion
Smaller livestock (goats, sheep) and chickens predated by
baboons, civet cats
Group 1Group 2Group 3
3 DISTINCT GROUPS OF HOUSEHOLDS
High benefits 

and high costs
Average benefits 

and high costs
Low benefits 

and low costs
Group 1; 28 hh Group 2; 75 hh Group 3; 47 hh
3 DISTINCT GROUPS OF HOUSEHOLDS
High benefits 

and high costs
Average benefits 

and high costs
Low benefits 

and low costs
Group 1; 28 hh Group 2; 75 hh Group 3; 47 hh
3 DISTINCT GROUPS OF HOUSEHOLDS
High benefits 

and high costs
Average benefits 

and high costs
Low benefits 

and low costs
Group 1; 28 hh Group 2; 75 hh Group 3; 47 hh
3 DISTINCT GROUPS OF HOUSEHOLDS
High benefits 

and high costs
Average benefits 

and high costs
Low benefits 

and low costs
Group 1; 28 hh Group 2; 75 hh Group 3; 47 hh
3 DISTINCT GROUPS OF HOUSEHOLDS
High benefits 

and high costs
Average benefits 

and high costs
Low benefits 

and low costs
Group 1; 28 hh Group 2; 75 hh Group 3; 47 hh
BIOPHYSICAL FACTORS
Forest cover (500 m radius)
Altitude
2 groups close to forest - most people have relatively less
benefits than costs
} Groups 1 and 2 similar, 3 differs
1600
1800
2000
2200
1 2 3
Household profile
Altitude(m)
0
10
20
30
40
50
1 2 3
Household profile
Forestcover(%)
SOCIO-ECONOMIC FACTORS
• Group 1: more metal roof houses, cash-crop based income
• Group 3: holds less land than group 1
• No difference: education level, household size, household
head, number of livestock
0%
25%
50%
75%
100%
1 2 3
Household profile
Proportionofhouseholds
Roof type
Grass
Metal
0%
25%
50%
75%
100%
1 2 3
Household profile
Proportionofhouseholds
Income
sources
Cash crops
Dairy
Homegarden
Labour
Livestock
Poultry
Migration
Staple crops
Trees
5
6
7
8
9
10
1 2 3
Household profileLandsize(oxen)
ATTITUDE TOWARDS FOREST
• No difference on attitudes towards cost/benefit of the forest
• Group 1 used own forest plot more often
• Only 10 households unhappy about access to forest services
0%
25%
50%
75%
100%
1 2 3
Household profile
Proportionofhouseholds
Attitudes
More costs
Neutral
More benefits
0%
25%
50%
75%
100%
1 2 3
Household profile
Proportionofhouseholds
Ownership
Not own
Own
DISCUSSION
DISCUSSION
Current challenges for local people
• Disservices contribute to difficult livelihood situation overall
• But costs/benefits are not equally distributed among population
• Most people close to forest have relatively higher costs than
benefits
• People far from the forest only bit lower benefits, without high
costs
• Group 1: ‘richer’ - easier to mitigate costs like health problems,
food insecurity, loss of cash income opportunities
But forests also heavily support livelihoods
• Attitudes not affected by service/disservice profiles
DISCUSSION
Knowledge of service/disservice balance can help to facilitate
successful ecosystem management
• Strategies to alleviate the differences between households
Future challenges
• Increasing coffee focus promises economic gains but may also
worsen disservices
• Increasing coffee focus may worsen the balance between
services/disservices between people close to the forest
`THANKS TO:
Dadi Feyisa, Tolani Asirat, Shiferaw Diriba
All the participants for their cooperation
ERC-council for funding the project
THANKS FOR YOUR ATTENTION

Ine Dorresteijn Ecosystem Services and Disservices

  • 1.
    Integrating ecosystem services& disservices in cultural landscapes of SW Ethiopia Ine Dorresteijn, Jannik Schultner, Neil Collier, Kristoffer Hylander,
 Feyera Senbeta, Joern Fischer
  • 2.
    CULTURAL LANDSCAPES: SOCIAL-ECOLOGICALSYSTEMS Source: The Resilience Alliance
  • 3.
    CULTURAL LANDSCAPES: THE‘GOODS’ Source: The Resilience Alliance
  • 4.
    CULTURAL LANDSCAPES: THE‘BADS’ Source: The Resilience Alliance Ecosystem disservices Direct & indirect
  • 5.
    THE NEED FORSERVICE/DISSERVICE INTEGRATION • Ecosystem service research is usually focused on benefits • However, ecosystems provide both benefits AND cause problems • This balance is likely to influence local people’s perceptions 
 of ecosystems • Therefore, we need to disaggregate both services and disservices and study their balance and distribution
  • 6.
    AIMS To integrate ecosystemservices and disservices with a case-study from southwest Ethiopia 1. Disaggregate forest ecosystem services and disservices through grouping of households (profiles)
 2. Link these profiles to biophysical, socio-economic, and attitudes of people to the forest
  • 7.
  • 8.
    20KMSOURCE: GOOGLE MAPS •Coffee-growing area of Southwest Ethiopia • 3 Woredas, 6 kebeles • 25 Households in each kebele STUDY AREA
  • 9.
    20KM STUDY AREA • Kebeles:gradients in forest cover & altitude • Households randomly selected • Questionnaires
  • 11.
    Provisioning forest ecosystemservices • Bee hives • Coffee • Spices • Medicinal plants • Trees for house construction • Lianas • Trees for utensils • Ploughs • Firewood ECOSYSTEM SERVICES
  • 12.
    ECOSYSTEM DISSERVICES Direct Disservices •Crop loss • Livestock predation Indirect Disservices • Social relationships • Health • Education • Farming opportunities • Cash income opportunities • Food security
  • 13.
  • 14.
    CULPRITS AND VICTIMS Fieldcrops (maize, teff, sorghum) often destroyed by baboons, bush pigs, warthogs; other crops/animals less important Larger livestock (cattle, horses) predated by hyena, leopard, lion Smaller livestock (goats, sheep) and chickens predated by baboons, civet cats
  • 15.
    Group 1Group 2Group3 3 DISTINCT GROUPS OF HOUSEHOLDS
  • 16.
    3 DISTINCT GROUPSOF HOUSEHOLDS High benefits 
 and high costs Average benefits 
 and high costs Low benefits 
 and low costs Group 1; 28 hh Group 2; 75 hh Group 3; 47 hh
  • 17.
    3 DISTINCT GROUPSOF HOUSEHOLDS High benefits 
 and high costs Average benefits 
 and high costs Low benefits 
 and low costs Group 1; 28 hh Group 2; 75 hh Group 3; 47 hh
  • 18.
    3 DISTINCT GROUPSOF HOUSEHOLDS High benefits 
 and high costs Average benefits 
 and high costs Low benefits 
 and low costs Group 1; 28 hh Group 2; 75 hh Group 3; 47 hh
  • 19.
    3 DISTINCT GROUPSOF HOUSEHOLDS High benefits 
 and high costs Average benefits 
 and high costs Low benefits 
 and low costs Group 1; 28 hh Group 2; 75 hh Group 3; 47 hh
  • 20.
    3 DISTINCT GROUPSOF HOUSEHOLDS High benefits 
 and high costs Average benefits 
 and high costs Low benefits 
 and low costs Group 1; 28 hh Group 2; 75 hh Group 3; 47 hh
  • 21.
    BIOPHYSICAL FACTORS Forest cover(500 m radius) Altitude 2 groups close to forest - most people have relatively less benefits than costs } Groups 1 and 2 similar, 3 differs 1600 1800 2000 2200 1 2 3 Household profile Altitude(m) 0 10 20 30 40 50 1 2 3 Household profile Forestcover(%)
  • 22.
    SOCIO-ECONOMIC FACTORS • Group1: more metal roof houses, cash-crop based income • Group 3: holds less land than group 1 • No difference: education level, household size, household head, number of livestock 0% 25% 50% 75% 100% 1 2 3 Household profile Proportionofhouseholds Roof type Grass Metal 0% 25% 50% 75% 100% 1 2 3 Household profile Proportionofhouseholds Income sources Cash crops Dairy Homegarden Labour Livestock Poultry Migration Staple crops Trees 5 6 7 8 9 10 1 2 3 Household profileLandsize(oxen)
  • 23.
    ATTITUDE TOWARDS FOREST •No difference on attitudes towards cost/benefit of the forest • Group 1 used own forest plot more often • Only 10 households unhappy about access to forest services 0% 25% 50% 75% 100% 1 2 3 Household profile Proportionofhouseholds Attitudes More costs Neutral More benefits 0% 25% 50% 75% 100% 1 2 3 Household profile Proportionofhouseholds Ownership Not own Own
  • 24.
  • 25.
    DISCUSSION Current challenges forlocal people • Disservices contribute to difficult livelihood situation overall • But costs/benefits are not equally distributed among population • Most people close to forest have relatively higher costs than benefits • People far from the forest only bit lower benefits, without high costs • Group 1: ‘richer’ - easier to mitigate costs like health problems, food insecurity, loss of cash income opportunities But forests also heavily support livelihoods • Attitudes not affected by service/disservice profiles
  • 26.
    DISCUSSION Knowledge of service/disservicebalance can help to facilitate successful ecosystem management • Strategies to alleviate the differences between households Future challenges • Increasing coffee focus promises economic gains but may also worsen disservices • Increasing coffee focus may worsen the balance between services/disservices between people close to the forest
  • 27.
    `THANKS TO: Dadi Feyisa,Tolani Asirat, Shiferaw Diriba All the participants for their cooperation ERC-council for funding the project THANKS FOR YOUR ATTENTION