SlideShare a Scribd company logo
1 of 12
Use of IT to Strengthen Care and                                                                  Agenda
  Reimbursement in Challenging Times
                                                                                                    • Challenges & Why Important (Why First)
      Stepping up to the Quality Imperative – Polish your
      Stars with Six Sigma and "Shine"
                                                                                                      › We spend too much on health care
                                                                                                        Therefore we will have change to spend less?
                                                                                                        Our health care system is not right – therefore we will change it to
      Illinois Health Care Assoc. Spring IT Conference
                                                                                                        be more right?
      Spring 2009
                                                                                                    • Quality and Revenue Improvement


                                                                                                                                                                                                              utions
      P
      Presenter: John Sheridan – P id t – eHDS
             t J h Sh id         President HDS                                                        › Immediate & Continuous Culture Change


                                                                                                                                                                               | 4/6/2009 | © eHealth Data Solu
      Jsheridan@ehds.biz                                                                              › Risk Management – Shine your Stars!
                                                                                                    • Lessons / Compliance
                                                                                                    • Summary - Discussion
                                                                                                                                                                                                2


Disclosures                                                                                         The challenges we face!


                                                                                                                                                                                                                                                              ons 
                                                                                                                                                                                                                                            ealth Data  Solutio
• John Sheridan is president of a company that
  assists managers using data to improve care and                                                                                          We have met the
  organization performance.                                                                                                               enemy and he is us.
• This presentation does not mention any specific
  product or software application which is


                                                                                                                                                                                                                             /2009  |   © eHe
  represented by Mr. Sheridan.
                                                                                           utions


                                                                                                                                                                                                              utions
                                                            | 4/6/2009 | © eHealth Data Solu


                                                                                                                                                                               | 4/6/2009 | © eHealth Data Solu


                                                                                                                                                                                                                       |  4/1/
                                                                                                                                                                                                                       Page 11
                                                                             3                                                                                                                  4
Step by step – 1. Target Declines – 2. Call in
Do the right thing!                                                                                                                              Therapy – 3. Manage the Schedule for MDS
                                                                                                                                           Facility: Iowa Place
                                                                                                                                           Time: Q4‐08
                                                                                                                                           QI/QM: 9.1 ADL decline

• Reimbursement                                                                                                                            9 residents decline in ADL
                                                                                                                                           9 residents decline in ADL
                                                                                                                                                    Resident              Case Mix Opportunity on Residents who have declined in their ADL Score on the assessment (and addressed with 

  › Evidence for more care directs care and service                                                                                        BLACK, JESSICA
                                                                                                                                           BRAXTON, JORDAN
                                                                                                                                                                                                   Assessme
                                                                                                                                                                                                                           Therapy
                                                                                                                                                                                                                              Potential              Payment             Payment


    to residents and improves Case Mix                                                                                                     CRIMENI, JANINE
                                                                                                                                           DAVIDSON, JANINE
                                                                                                                                                                                                       nt
                                                                                                                                                                                                             ADL RUG Case RUG Case Payment             Days                Days
                                                                                                                                                                                                                                                                                    Case 
                                                                                                                                           DINNOCENZO, JANE                                        Referenc Scor                                     Opportun Case Mix  Opportun
        Using RUGs to improve Quality Measures                                                                                             DUNN, JANE
                                                                                                                                                                      Resident Name         SSN
                                                                                                                                                                                                        e      e
                                                                                                                                                                                                                 Code Mix Code Mix          Source
                                                                                                                                                                                                                                                         ity    Points      ity
                                                                                                                                                                                                                                                                                    Mix 
                                                                                                                                                                                                                                                                                   Points
         – Evaluate residents who decline in ADL and Mobility Scores                                                                       ENGLE, JANINE
                                                                                                                                           EVANKO, JANE
                                                                                                                                                                                                      Date
                                                                                                                                                                                                                       Inde
                                                                                                                                                                                                                         x
                                                                                                                                                                                                                                   Index              Q4‐2008 Added Q1‐2008

         – ADL decline, mobility worsening – are the 5-Star key measures                                                                   FLEISSNER, JESSICA
                                                                                                                                                                      BLACK, JESSICA
                                                                                                                                                                                          349‐11‐ 10/23/20
                                                                                                                                                                                           9999        08     15 RAC 1.28                  Medicare


                                                                                                                                  utions


                                                                                                                                                                                                                                                                                                                            utions
         – Evaluate potential for restorative care
                    p                                                                                                                                                                     349‐45‐ 11/14/20


                                                                                                   | 4/6/2009 | © eHealth Data Solu


                                                                                                                                                                                                                                                                                             | 4/6/2009 | © eHealth Data Solu
                                                                                                                                                                      BRAXTON, JORDAN
                                                                                                                                                                      BRAXTON JORDAN       9999        08     4 CA1 0 92 RAA 1 040 M di id
                                                                                                                                                                                                                       0.92        1.040 Medicaid        47      5.64
                                                                                                                                                                                                                                                                 5 64           45    5.40
                                                                                                                                                                                                                                                                                      5 40

• Quality and Integrity                                                                                                                                               CRIMENI, JANINE
                                                                                                                                                                                          349‐70‐ 11/11/20
                                                                                                                                                                                           9999        08     17 CC2 1.49 RAD 1.62 Medicaid              50       6.5           42    5.46


  › Get Ready for Medicare and Medicaid Audit
                                                                                                                                                                                          349‐90‐ 12/14/20
                                                                                                                                                                      DAVIDSON, JANINE     9999        08     10 IB2 0.85 RAB 1.2 Medicaid               17      5.95           75 26.25
                                                                                                                                                                                          350‐18‐ 10/8/200
                                                                                                                                                                      DINNOCENZO, JANE 9999            8      12 PD1 0.84 RAB 1.2 Medicaid               84     30.24            8    2.88


                                                                                                                                             All data are real examples that have been de-identified.
                                                                                                                    5                                                                                                                                                                                         6


Case Study on IT Evaluation for Optimum                                                                                                       Why Use IT?


                                                                                                                                                                                                                                                                                                                                                                            ons 
Therapy and Restorative Care Opportunity                                                                                                      F-287 Automated Data Processing Requirement


                                                                                                                                                                                                                                                                                                                                                          ealth Data  Solutio
                        CMI 34 Interval Comparison ‐ Minnesota Place 
               RUG
                                (1) All Payer Q3‐ (2) All P
                                (1) All P     Q3 (2) All Payer Q4‐
                                                               Q4    Q3 ‐
                                                                     Q3         Q4 ‐
                                                                                Q4                                                             • Intent F 287
                                                                                                                                                         F-287
               Group
                                        08                08
                            CMI Days CMI Points Days CMI Points
                                                                   Potential 
                                                                        1.022
                                                                              Potential 
                                                                                   1.046                                                         › …to enable a facility to better monitor a
         All                    6,920   6,873.48 5,954   6,050.50
                                                                    7,071.06      6,230.11 
                                                                                                                                                   resident’s decline and progress over time.
                                            0.99            1.02           0.0286        0.0302                                                    Computer-aided data analysis facilitates a more
         Restorative Care                                                 148.90        107.77 
                                                                                                                                                   efficient, comprehensive and sophisticated


                                                                                                                                                                                                                                                                                                                                           /2009  |   © eHe
         Therapy                                                           48.68        71.84 
                                                                                                                                                   review of health data.
                                                                                                                                  utions


                                                                                                                                                                                                                                                                                                                            utions
         Total
                                                                                                                                                 › Th primary purpose of maintaining th
                                                                                                                                                   The i                   f    i t i i the
                                                                                                   | 4/6/2009 | © eHealth Data Solu


                                                                                                                                                                                                                                                                                             | 4/6/2009 | © eHealth Data Solu
         Opportunity                                                     197.58        179.61 

                                                                                                                                                   assessment data is so a facility can monitor
Evaluate Residents and apply restorative care to maintain status and to assist improvement.                                                        resident progress over time. The information
Where declines have occurred, evaluate and apply therapy (Parts A or B) where appropriate.
                                                                                                                                                   should be readily available at all times.


                                                                                                                                                                                                                                                                                                                                     |  4/1/
                                                                                                                                                                                                                                                                                                                                     Page 22
                                                                                                                    7                                                                                                                                                                                         8
CMS has 8 initiatives for Healthcare
  Recovery Audit Contract Expansion
                                                                                                                      financial integrity -
                                                                                                                      • CMS p g
                                                                                                                              programs related to health care financial integrity:  g y
                                                                                                                        › The Medicare Accountability Contractor (MAC) conversion for payers
                                                                                                                        › The Zone Program Integrity Contractor (ZPIC)
                                                                                                                        › The NCCI (National Correct Coding Initiative)
                                                                                                                        › The Medicaid Integrity Contractor (MIC) - Medicaid Payment Integrity
                                                                                                                        › PROBES - After data analysis, Contractors must verify if billing
                                                                                                                          problems exist through probe reviews.


                                                                                                             utions


                                                                                                                                                                                                                                                                                  utions
                                                                                                                       › PERM – Payment Error Rate Measurement – states participate every


                                                                                                                                                                                                                                                   | 4/6/2009 | © eHealth Data Solu
                                                                              | 4/6/2009 | © eHealth Data Solu
                                                                                                                          three years
                                                                                                                       › CERTs – Comprehensive Error Rate Testing
Inpatient Hospital – 85 percent ($823.3 million)           RAC - Fees                                                  › The RAC – Medicare Payments from 10/1/2007 forward – Automatic
Inpatient Rehab – 6 percent ($59.7 million)        Region A –12.45 Percent                                                and Complex reviews for appropriate care and correct coding
Outpatient Hospital – 4 percent ($44 million)      Region B – 12.50 Percent
Physicians – 2 percent ($19.9 million)             Region C – 9 Percent
SNFs – 2 percent ($16.3 million)                   Region D – 9.49 Percent
DME – 1 percent ($6.3 million)
                                                                                               9                                                                                                                                                          10
Ambulance/Lab/Other – < 1 percent ($5.4 million)


                       Prevent/Reduce Recoupment


                                                                                                                                                                                                                                                                                                                                  ons 
                     of Medicare and Medicaid Dollars                                                                     UB-04 / MDS Exceptions [RAC Recovery Audit Contract]


                                                                                                                                                                                                                                                                                                                ealth Data  Solutio
                                                                                                                         Coun
   • CMS estimates 10.4 billion in Medicare errors and
                                                                                                                                                                         UB‐04 ‐ MDS Exception Report
                                                                                                                           t
                                                                                                                          51    Principal Diagnosis does not have a matching ICD9 code or explicit diagnosis field not set on corresponding MDSs
     a federal 18.0 billion in Medicaid errors.                                                                           43
                                                                                                                          33
                                                                                                                                Excluded service
                                                                                                                                No admission MDS corresponding to admission date
                                                                                                                          21    RUG in claim does not match RUG in corresponding MDS
                                                                                                                          19    Therapy level for patient exceeds therapy cap
   • Check your electronic records of bills (UB-04) with                                                                  16
                                                                                                                          16
                                                                                                                                Rehab therapy RUG but no therapy charges
                                                                                                                                Non‐rehab RUGs but with therapy charges
     those of clinical assessments (MDS).                                                                                 14
                                                                                                                          13
                                                                                                                                Claim type and dates inconsistent with corresponding MDSs
                                                                                                                                Unjustified automatic exception modifier


                                                                                                                                                                                                                                                                                                 /2009  |   © eHe
                                                                                                                          13    No qualifying hospital stay before admission
                                                                                                                          12    Speech therapy but no dysphagia or other allowed diagnosis
                                                                                                             utions


                                                                                                                                                                                                                                                                                  utions
   • Checks whether Principal and Admitting                                                                               11    Therapies on same day may indicate a need for a procedure code modifier
                                                                              | 4/6/2009 | © eHealth Data Solu


                                                                                                                                                                                                                                                   | 4/6/2009 | © eHealth Data Solu
                                                                                                                          10    No corresponding MDSs for claim
     Diagnoses are supported by the care documented                                                                        5
                                                                                                                           4
                                                                                                                                Admission date is greater than 30 days from qualifying hospital stay
                                                                                                                                Missing occurrence entries for speech therapy
     and present in the record.                                                                                            3
                                                                                                                           3
                                                                                                                                Therapy cap modifier missing after therapy cap reached
                                                                                                                                Missing occurrence entries for physical therapy
      ›   Prevent/reduce RAC recoupment of Medicare                                                                        2
                                                                                                                           2
                                                                                                                                Missing value code for physical therapy
                                                                                                                                Missing value code for speech therapy
          and Medicaid $.                                                                                                  1
                                                                                                                           1
                                                                                                                                Missing occurrence entries for occupational therapy
                                                                                                                                Outpatient claim dates overlap with part A claim dates without required condition code


                                                                                                                                                                                                                                                                                           |  4/1/
                                                                                                                           1    Invalid ICD9 code(s) 


                                                                                                                                                                                                                                                                                           Page 33
                                                                                     11                                                                                                                                                                   12
Challenges and Obstacles                                                                            The Steps for Buy-In


• Too much Data – What can we do?                                                                    • Recognition of a need
  • It’s just the data!
• Too little time                                                                                    • Discussion about the need
• We need to do what is in front of us now
  • I only know what I know                                                                          • Find a solution to the need
• Excellence demands growth


                                                                                          utions


                                                                                                                                                                                                                                 utions
                                                           | 4/6/2009 | © eHealth Data Solu


                                                                                                                                                                                                  | 4/6/2009 | © eHealth Data Solu
  › use of new technology and new methods is challenging
  › growing pains may cause us to seek relief                                                        • Support implementation of the solutions
      no pain, no gain                                                                                 to resolve the need
• Can-do spirit!

                                                                  13                                                                                                                                     14


Information, Technology and Management                                                              National Quality Forum – A National Consensus


                                                                                                                                                                                                                                                                                 ons 
                                                                                                    www.qualityforum.org


                                                                                                                                                                                                                                                               ealth Data  Solutio
                                                                                                   • Serious Reportable Events - Transparency & accountability are critical in
• Source of Data                                                                                     reducing medical errors (data in the IT systems)
• Management of a Discipline                                                                        ›   “Tens of thousands of lives are forever changed each year as a result of
                                                                                                        healthcare errors. There is a critical need to enhance health system capacity,
  › Concentrated area of knowledge about                                                                so that all patients will receive care that is safe and effective.”
                                                                                                            - NQF President and CEO Janet Corrigan
    tools and tool sets
  › Backup and redundancy                                                                          • There are 28 Events – CMS plans to recoup $ for "Never Events"


                                                                                                                                                                                                                                                /2009  |   © eHe
                                                                                          utions


                                                                                                                                                                                                                                 utions
                                                                                                    ›
  › Access                                                                                              The SRE list includes:
                                                           | 4/6/2009 | © eHealth Data Solu


                                                                                                                                                                                                  | 4/6/2009 | © eHealth Data Solu
                                                                                                          Injuries caused by care management rather than the underlying disease
  › Timeliness                                                                                             – “Fall & Fracture” or “High Risk Pressure Ulcer”
                                                                                                          Errors that occur from failure to follow standard care or institutional practices and
• Evaluation and Analysis                                                                                 policies

  › A discipline of all management                                                                  ›
                                                                                                    ›
                                                                                                        The events are largely preventable, but also very serious.
                                                                                                        The errors are of concern to the public and healthcare providers and warrant
                                                                                                        careful investigation that should be targeted for mandatory public reporting.


                                                                                                                                                                                                                                          |  4/1/
                                                                                                                                                                                                                                          Page 44
                                                                  15                                                                                                                                     16
2008/9 Hospitals are Not Paid for Some SREs /
                                                                                                                      NQF is the Basis for the QMs and QI/QMs
Never Events (Pay for Performance) – When will Iowa emerge?
• 2003: Minnesota is the first state to require reporting entire NQF list.
  ›   Now required b CA CT IL IN MA NJ OR VT WA and WY
      N         i d by CA, CT, IL, IN, MA, NJ, OR, VT, WA, d WY.
  ›   Other states are considering implementation of the SREs.
• October 1, 2008: CMS reduced payment to treat a list of
  complications CMS deems preventable with good care.
  ›   Many of these complications are included on NQF’s SREs list.
  ›   The Medicare payment provision encourages the adoption of
      evidence-based patient safety practices aimed at preventing hospital


                                                                                                            utions


                                                                                                                                                                                                                                                                            utions
      acquired conditions.
               conditions


                                                                             | 4/6/2009 | © eHealth Data Solu


                                                                                                                                                                                                                                             | 4/6/2009 | © eHealth Data Solu
• The CMS plan
  ›   Respond to unintended negative consequences with appropriate
      corrections and interventions.
  ›   Extend the SRE Medicare and Medicaid payment reduction to SNFs.
  ›   OIG’s work plan for 2009 is laying the foundation.                                                                                              This process produced the QMs
                                                                                    17                                                                                                                                                               18


Summary of Why                                                                                                        SNF Health Care – One Framework


                                                                                                                                                                                                                                                                                                                            ons 
                                                                                                                                                                                                                                                                                                          ealth Data  Solutio
                                                                                                                     Admin./ED’s Should Work to Improve Quality & Assure Reimbursement
• Use of Information Technology
                                                                                                                     1. The Quality Committee recommends approval of written policy on quality and quality
                                                                                                                        improvement that is approved by the organization’s team and then effectively
                                                                                                                        communicated to all staff and all associated providers.
  › A logical management system – feedback loop                                                                      2. The Quality Committee sets the agenda for the facility’s discussion on quality.
      of analytics                                                                                                   3. Each Admin/ED has the responsibility to assure that quality receives appropriate time for
                                                                                                                        discussion not only at QA Meetings, but in all activities regarding care.
                                                                                                                     4. The Admin/ED oversight at her/his facility Quality Committee includes measures for


                                                                                                                                                                                                                                                                                           /2009  |   © eHe
  › Source of data for the analytics                                                                                    quality and resident/patient safety as part of the performance evaluation of the ED, RVP
                                                                                                            utions


                                                                                                                                                                                                                                                                            utions
                                                                                                                        and Division VP.
                                                                             | 4/6/2009 | © eHealth Data Solu


                                                                                                                                                                                                                                             | 4/6/2009 | © eHealth Data Solu
                                                                                                                     5. The Admin/ED must act with the Quality Committee to improve the quality literacy of the
                                                                                                                        facility staff and volunteers (IT is the source of data)
  › Tools and tool sets to express the analysis                                                                      6. The Quality Committee aligns the mandate for quality improvement in the organization
                                                                                                                        and recommends how this mandate is measured and enforced.

                                                                                                                          Board Engagement in Quality: Findings of a Survey of Hospital and System Leaders - H. Joanna Jiang, PhD,; Carlin
                                                                                                                          Lockee,; Karma Bass, FAHE; and Irene Fraser,PhD; Journal of Healthcare Management 53:2 March/April l 2008


                                                                                                                                                                                                                                                                                     |  4/1/
                                                                                                                                                                                                                                                                                     Page 55
                                                                                    19                                                                                                                                                              20
Suggested QA Process Overview - (IT Dashboard)
1.        Each Department Presents Their Own QA Information                                                                                                                                  Outcomes Measurement
2.        HSKP – Upkeep of Cleaning Schedules, etc. (automated) (K-Tags)
     a.     Laundry – temperature and maintenance logs for laundry equipment
     b.     Maintenance – review of performance for water temperatures, fire & safety systems, call lights,
                                                                                                                                                                                             Outcomes need to be reviewed in the context of a
            preventative maintenance on specialized equipment
                  t ti     i t              i li d     i     t                                                                                                                               continuous monitoring and improvement process.
                                                                                                                                                                                                ti          it i      di              t
     c.     Dietary – audits of food temperatures, dish-machine temperatures, & sanitation levels
     d.     Activities – review of participation (F-249)
3.        Customer Service Review                                                                                                                                                            This approach requires an organization to follow
     a.     Review results of satisfaction surveys – online presentation – look at history through IT                                                                                        five essential steps:
     b.     Discussion of plan for focused resolution of any issues
                                                                                                                                                                                             1)   identify important aspects of care,
4.        Grievance/Concern Form Review
                                                                                                                                                                                             2)   implement indicators of performance,
     a.     Review summary of concern forms received in last month – trend analysis, etc.


                                                                                                                                                                                    utions


                                                                                                                                                                                                                                                                                                                                             utions
     b.     Discussion of plan…                                                                                                                                                              3)   collect and analyze data,


                                                                                                                                                     | 4/6/2009 | © eHealth Data Solu


                                                                                                                                                                                                                                                                                                              | 4/6/2009 | © eHealth Data Solu
5.        Loss Control Review – examine recent losses – plan review and development                                                                                                          4)   isolate common and special causes, and
           –(IT reports to insurer)                                                                                                                                                          5)   develop and implement solutions that improve either a process
6.        Infection Control – review of data from last month(s). Analyze distribution map. (IT)                                                                                                     or an outcome.
7.        Incident Report – online review of IT data Fall analysis – use projector
8.        QI/QM Review – IT data – use projector and review control charts – Coordinate Care Plans
                                                                                                                                                                                                   Donabedian A. Explorations in quality assessment and monitoring. Volume I: the definition of quality and
9.        Survey/Complaint – review issues occurring in last month.                                                                                                                                approaches to its assessment. Ann Arbor, Mich.: Health Administration Press.
10.       Medical Records – review select audits completed in last month (IT based)
                                                                                                                                                            21                                                                                                                                                       22


                 Identify QIs-73.5% of Measures Improved                                                                                                                                          Identify - QI/QMs


                                                                                                                                                                                                                                                                                                                                                                                             ons 
                                                                                 Long Term Care Aggregate Quality of Care Performance
                                                                                 QI/QM                  Residents      Population 2007      2006
                                                                 Accidents
                                                                 1.1 Fractures                                     44       1,109 4.00%      4.90%
                                                                                                                                                                                                  that are…


                                                                                                                                                                                                                                                                                                                                                                           ealth Data  Solutio
                                                                 1.2 Falls                                        327       1,155 28.30%    26.30%
                                                                 Behavior/Emotional Patterns
                                                                 2.1 Depression                                   516       1,170 44.10%    47.10%
                                                                 2.2 Affect on others                             330       1,150 28.70%    31.60%
                                                                 2.2‐Hi Affect on others high risk                308          968 31.80%   35.70%
                                                                 2.2‐Lo Affect on others low risk                  25          215 11.60%    9.20%
                                                                 2.3 Depression w/o therapy
                                                                 23D          i     / h                           129       1,155 11.20%
                                                                                                                            1 155 11 20%    13.80%
                                                                                                                                            13 80%


                                                                                                                                                                                             Directly Related to the Survey F-Tags
                                                                 Clinical Management
                                                                 3.1 Medications                                  896       1,155 77.60%    79.30%
                                                                 Cognitive Patterns
                                                                 4.1 Cognitive impairment                          66          270 24.40%   27.70%
                                                                 Elimination/Incontinence


                                                                                                                                                                                                  F-Tag                  Standard                                       QI/QM
                                                                 5.1 Incontinence low risk                        462          864 53.50%   51.70%
                                                                 5.2 Catheter                                     112       1,155 9.70%     13.20%
                                                                 5.3 Incontinence w/o plan                        224          613 36.50%   42.60%
                                                                 5.4 Impaction                                      0       1,155 0.00%      0.10%


                                                                                                                                                                                                   248                 Activities                               Little or No Activity
                                                                 Infection Control
                                                                 6.1 Urinary tract infection                      198       1,155 17.10%    19.90%
                                                                 Nutrition/Eating


                                                                                                                                                                                                   314
                                                                 7.1 Weight loss                                  198       1,089 18.20%    19.20%
                                                                 7.2 Tube feeding
                                                                 7.3 Dehydration
                                                                                                                   83
                                                                                                                    1
                                                                                                                            1,155 7.20%
                                                                                                                            1,155 0.10%
                                                                                                                                             7.10%
                                                                                                                                             0.00%                                                                     Pressure Ulcers                          High Risk Pressure Ulcers


                                                                                                                                                                                                                                                                                                                                                            /2009  |   © eHe
                                                                 Pain Management
                                                                 8.1 Pain                                          92       1,155 8.00%     11.90%

                                                                                                                                                                                                   324


                                                                                                                                                                                                                                                                                                                                             utions
                                                                                                                                                                                    utions


                                                                                                                                                                                                                       Prevent Accidents                        Falls (Last 30 Days)
                                                                 Physical Functioning
                                                                 9.1 ADL decline                                  299       1,066 28.00%    31.50%
                                                                 9.2 Bed or chair                                  69       1,150 6.00%
                                                                                                                              ,              6.00%


                                                                                                                                                                                                                                                                                                              | 4/6/2009 | © eHealth Data Solu
                                                                                                                                                     | 4/6/2009 | © eHealth Data Solu


                                                                                                                                                                                                   325
                                                                 9.3 Mobility worse                               259          848 30.50%   32.80%
                                                                 9.4 ROM decline
                                                                 Psychotropic Drug Use
                                                                 10.1 Psychotropic drug use
                                                                                                                  163

                                                                                                                  183
                                                                                                                            1,146 14.20%

                                                                                                                            1,050 17.40%
                                                                                                                                            17.50%

                                                                                                                                            18.40%
                                                                                                                                                                                                                       Nutrition                                Weight Loss (5% - 30 Days)
                                                                 10.1‐Hi Psychotropic drug use high 


                                                                                                                                                                                                   329
                                                                 risk                                              67          252 26.60%   33.10%
                                                                 10.1‐Lo Psychotropic drug use low 
                                                                 risk                                             140          920 15.20%   14.50%
                                                                                                                                                                                                                       Unnecessary Drugs                        9+ Medications
                                                                 10.2 Antianxiety/hypnotic use                    275       1,050 26.20%    27.30%
                                                                 10.3 Frequent hypnotic                            83       1,155 7.20%      8.40%
                                                                 Quality of Life
                                                                 11.1 Physical restraints                          15       1,155 1.30%      3.00%
                                                                 11.2 Little or no activity                       110       1,150 9.60%     10.20%
                                                                 Skin Care
                                                                 12.1 Pressure ulcers high risk                   160          847 18.90%   21.10%
                                                                 12.2 Pressure ulcers low risk                       9         429 2.10%     5.30%


                                                                                                                                                                                                                                                                                                                                                      |  4/1/
                                                                                                                                                                                                                                                                                                                                                      Page 66
                                                                 Post‐Acute Care
                                                                 13.1 Short‐stay delirium                          29          887 3.30%     3.30%
                                                                 13.2 Short‐stay pain                             130          895 14.50%   16.90%
                                                                 13.3 Short‐stay pressure ulcers                  153          808 18.90%   18.70%
                                                                                                                                                            23                                                                                                                                                       24
QI/QMs and F-Tag 323 / F-324                                                                                                             QI/QMs and F-Tag 314

                                 Level of Harm            Residents Affected                                                                                                          Level of Harm                        Residents Affected
Inspectors Determined:           (Least>Most)             (Few>Some>Many)                                                                Inspectors Determined:                      (Least>Most)                          (Few>Some>Many)
                                 3=Actual Harm                  Few                                                                      Give residents proper                       2=Minimal harm                                     Few
Make sure each resident is
                                                                                                                                         treatment to prevent                        or potential for
being watched and has Facility          1.8%
                                                                                                                                         new bed (pressure)                          actual harm
assistance devices when Fx                                                                                                               sores or heal existing
needed: prevent accidents. USA           1.9%                                                                                            sores.
                                                                                                                                                                                                                                   6%


 Adequate supervision                                                                                                                     Prevent and/or heal


                                                                                                                                utions


                                                                                                                                                                                                                                                                                               utions
                                                                                                                                                                                                                                                       13.60%
                                                                                                                                         pressure ulcers


                                                                                                 | 4/6/2009 | © eHealth Data Solu
  Assistance devices to


                                                                                                                                                                                                                                                                | 4/6/2009 | © eHealth Data Solu
                           Facility                              11.8%
                                                                 11 8%
                            Falls
prevent accidents
                                                                                                                                           NC State Coach Valvano
                              USA                                   12.9%                                                                                                                                                                           12.90%
                                                                                                                                           was cognizant of the fact
                                                                                                                                           that today's success is
                                      0.0%      3.5%    7.0%     10.5%      14.0%        17.5%                                             tomorrow's failure.
                                                                                                                                                                                                         0.00% 2.00% 4.00% 6.00% 8.00% 10.00%12.00%14.00%
                                                Q4 – 2007 Fractures & Falls
                                                                                                                                                                                                          Q4-07 High Risk Pressure Ulcers
                                                                                                        25                                                                                                                                                              26


Using and Interpreting SPC Charts* – A First Step
                                                                                                                                         Statistical Process Control Charts Key Terms


                                                                                                                                                                                                                                                                                                                                               ons 
to Cost Effective Continuous Improvement


                                                                                                                                                                                                                                                                                                                             ealth Data  Solutio
• Using Statistical Process Control to facilitate                                                                                         Variation: amount, rate, extent, or degree of change*
                                                                                                                                                           ,     ,       ,      g           g
  quality improvement
                                                                                                                                          Standard Deviation: the typical distance from
• Correctly identify quality deficiencies                                                                                                 the mean (average)
    Benchmark against state norm, other facilities,                                                                                           In a “normal distribution,” 68% of scores will fall within 1
                                                                                                                                              standard deviation of the mean.
    and your historical data.


                                                                                                                                                                                                                                                                                                              /2009  |   © eHe
                                                                                                                                              95% will fall within 2 standard deviations
                                                                                                                                utions


                                                                                                                                                                                                                                                                                               utions
    Create trend and SPC charts to measure change                                                                                             99 73% will fall within 3 standard deviations
                                                                                                                                              99.73%
                                                                                                 | 4/6/2009 | © eHealth Data Solu


                                                                                                                                                                                                                                                                | 4/6/2009 | © eHealth Data Solu
    over time.                                                                                                                                99.9999998% will fall within 6σ (standard deviations)
                                                                                                                                                  Inclusive of the Upper and Lower “control” limits
    Use these tools to empower and validate your
    quality committee.
                                                                                                                                          * "variation." Dictionary.com Unabridged (v 1.1). Random House, Inc. 23 Mar. 2007. <Dictionary.com
                                                                                                                                          http://dictionary.reference.com/browse/variation>.


                                                                                                                                                                                                                                                                                                        |  4/1/
                                                                                                                                                                                                                                                                                                        Page 77
                          *Using statistics to identify and target quality improvement
                                                                                                        27                                                                                                                                                              28
Hypothetical Example of “Your” Data
                                                  • Incontinence w/o Plan                                                        Evaluating Quality Step by Step Using SPC
                                                    › Strategy: Red – Needs
                                                           Improvement
                                                       ›   7.9% gap (UPB-LPB)
                                                       ›   14 periods above national
                                                           norm                                                                  1.
                                                                                                                                 1    Review QI/QMs monthly
                                                       ›   0 periods equal to or below

                                                       ›
                                                           national norm
                                                           8 occasions special cause
                                                                                                                                 2.   Group and categorize the QI/QMs
                                                       ›   Note: Graph starts at 40%
                                                                                                                                 3.   Calculate from the previous month
                                                  • Pressure Ulcers High                                                         4.   Review trends vs. month-to-month QI/QMs
                                                    Risk
                                                    › Strategy: Yellow                                                           5.   Review the SPC chart to determine:


                                                                                                                        utions


                                                                                                                                                                                                                                           utions
                                                    › 3.5% gap
                                                            g p
                                                                                                                                         Is any change normal variation, or
                                                                                                                                            an                  ariation


                                                                                                                                                                                                            | 4/6/2009 | © eHealth Data Solu
                                                                                         | 4/6/2009 | © eHealth Data Solu
                                                    › 0 periods above national norm
                                                    › 14 periods equal to or below
                                                           national norm                                                                 Is there a process problem?
                                                       › 2 occasions special cause
                                                       › Note: Graph starts at 8%                                                        Is quality improving?
                                                       › Extra-Note: pressure ulcer                                                         Are the interventions working?
                                                           SOW goal = 6.0% - therefore
                                                           with respect to where we
                                                           “should” be we are RED

                                                                                                29                                                                                                                 30


Statistical Process Control                                                                                                      SPC Key Terms, continued


                                                                                                                                                                                                                                                                                           ons 
                                                                                                                                                                                                                                                                         ealth Data  Solutio
 SPC can tell you whether the variation in your QI/QM                                                                                 SPC presents a Dynamic Display
 scores is due to chance or because of a special cause or                                                                             Variation in a process is measured by asking:
                                                                                                                                             Is it “normal” or the result of a “special” cause?
 meaningful changes over time.*                                                                                                              Does the process need to be re-evaluated?
                                                                                                                                      Common Cause Variation – random, due to regular, natural, or
 Originally developed for the manufacturing field, SPC has                                                                            ordinary causes. Common Cause Variation is expected to occur.
                                                                                                                                      Example: acuity of residents.
 also been effectively applied to healthcare.                                                                                         Special Cause Variation – due to irregular or unnatural causes.


                                                                                                                                                                                                                                                          /2009  |   © eHe
                                                                                                                                      When special causes are present, a process will be “out of control”
                                                                                                                        utions


                                                                                                                                                                                                                                           utions
                                                                                                                                      or “unstable”. E ample resident falls
                                                                                                                                          unstable Example:
                                                                                         | 4/6/2009 | © eHealth Data Solu


                                                                                                                                                                                                            | 4/6/2009 | © eHealth Data Solu
                                                                                                                                      Process = “controlled”: outcomes can be predicted within LIMITS

                                                            =                  ?                                                      Process ≠ “controlled”: the SPC chart will tell you WHEN to assist
                                                                                                                                      and explain WHY.

                                                                                                                                  The risk of “tampering” with a controlled process must be balanced
                                                                                                                                                  against the risk of “under controlling”…


                                                                                                                                                                                                                                                    |  4/1/
                                                                                                                                                                                                                                                    Page 88
 *JCAHO and ISO require SPC charts as proof of QA/QI                                            31                                                                                                                 32
SPC Key Terms, Continued.
•   Data Points: plotted over time                                                                                    Example: Incontinence
•   Mean: average of data points over time
•   Upper Control Limit (UCL): + 3 standard deviations from the mean                                           In 2006, an average of 60.3% residents triggered 5.1 each month
•   Lower Control Limit (LCL): – 3 standard deviations from the mean
                                                                                                                                         Percent of Residents with 5.1 per month
                                                                                                                       Jan    Feb   Mar    Apr   May Jun     Jul   Aug   Sep   Oct   Nov   Dec
                                                                                                               %       54     52    45      88   54    50    57    48    71    70    60    68
                                                                                                               with
                                                                                                               LRI


                                                                                                      utions


                                                                                                                                                                                                                                utions
                                                                       | 4/6/2009 | © eHealth Data Solu


                                                                                                                                                                                                 | 4/6/2009 | © eHealth Data Solu
                                                       4/6/2009
                                                                              33                                                                                                                        34


                                                                                                                                                 Example 1
Trends and SPC


                                                                                                                                                                                                                                                                                ons 
                                                                                                                                                                                                                                                              ealth Data  Solutio
    A trend is also an indicator of a special cause.
    Trend: an unusually long series of consecutive increases
    or decreases in the data.
    Many people infer trends that are not really present
    because the consecutive data points are not long enough
    to be statistically significant.


                                                                                                                                                                                                                                               /2009  |   © eHe
                                                                                                      utions


                                                                                                                                                                                                                                utions
    The
    Th consecutive “ ” of data points must be, minimally
                ti “run” f d t     i t      tb
                                                                       | 4/6/2009 | © eHealth Data Solu


                                                                                                                                                                                                 | 4/6/2009 | © eHealth Data Solu
                                                   i i ll
    between 5-7, depending on the size of the data base.
      Points above / below the average
                                                                                                                            • Is this process stable?
      Points in an increasing or decreasing trend
                                                                                                                            • Is this level of incontinence acceptable?
      Points above / below state or national norm


                                                                                                                                                                                                                                         |  4/1/
                                                                                                                                                                                                                                         Page 99
                                                                              35                                                                                                                        36
Illinois Health Care Spring It Technology Conference

More Related Content

What's hot

Bz Bod LLC Business Proposal
Bz Bod LLC Business ProposalBz Bod LLC Business Proposal
Bz Bod LLC Business Proposalterrybteo
 
Stephen Hale, Ogilvy Earth, National Green Brands Forum, June 17th 2010, Melb...
Stephen Hale, Ogilvy Earth, National Green Brands Forum, June 17th 2010, Melb...Stephen Hale, Ogilvy Earth, National Green Brands Forum, June 17th 2010, Melb...
Stephen Hale, Ogilvy Earth, National Green Brands Forum, June 17th 2010, Melb...3 Pillars Network
 
Kellogg School of Management Consulting Recruiting Info
Kellogg School of Management Consulting Recruiting InfoKellogg School of Management Consulting Recruiting Info
Kellogg School of Management Consulting Recruiting InfoOrlando O'Neill
 
Edu solutions
Edu solutionsEdu solutions
Edu solutionsawsumraja
 
Beyond EHR - Achieving Operational Efficiency
Beyond EHR - Achieving Operational Efficiency Beyond EHR - Achieving Operational Efficiency
Beyond EHR - Achieving Operational Efficiency Callum Bir
 
Mohr Integrative Governancest - STSRT Canterbury 2012 Conference
Mohr Integrative Governancest - STSRT Canterbury 2012 ConferenceMohr Integrative Governancest - STSRT Canterbury 2012 Conference
Mohr Integrative Governancest - STSRT Canterbury 2012 ConferenceSociotechnical Roundtable
 

What's hot (7)

SWN WIB Presentation 09.28.12
SWN WIB Presentation 09.28.12SWN WIB Presentation 09.28.12
SWN WIB Presentation 09.28.12
 
Bz Bod LLC Business Proposal
Bz Bod LLC Business ProposalBz Bod LLC Business Proposal
Bz Bod LLC Business Proposal
 
Stephen Hale, Ogilvy Earth, National Green Brands Forum, June 17th 2010, Melb...
Stephen Hale, Ogilvy Earth, National Green Brands Forum, June 17th 2010, Melb...Stephen Hale, Ogilvy Earth, National Green Brands Forum, June 17th 2010, Melb...
Stephen Hale, Ogilvy Earth, National Green Brands Forum, June 17th 2010, Melb...
 
Kellogg School of Management Consulting Recruiting Info
Kellogg School of Management Consulting Recruiting InfoKellogg School of Management Consulting Recruiting Info
Kellogg School of Management Consulting Recruiting Info
 
Edu solutions
Edu solutionsEdu solutions
Edu solutions
 
Beyond EHR - Achieving Operational Efficiency
Beyond EHR - Achieving Operational Efficiency Beyond EHR - Achieving Operational Efficiency
Beyond EHR - Achieving Operational Efficiency
 
Mohr Integrative Governancest - STSRT Canterbury 2012 Conference
Mohr Integrative Governancest - STSRT Canterbury 2012 ConferenceMohr Integrative Governancest - STSRT Canterbury 2012 Conference
Mohr Integrative Governancest - STSRT Canterbury 2012 Conference
 

Viewers also liked

Zero to Zend Framework in 10 minutes
Zero to Zend Framework in 10 minutesZero to Zend Framework in 10 minutes
Zero to Zend Framework in 10 minutesJeremy Kendall
 
Intro to #memtech PHP 2011-12-05
Intro to #memtech PHP   2011-12-05Intro to #memtech PHP   2011-12-05
Intro to #memtech PHP 2011-12-05Jeremy Kendall
 
A Brief Introduction to Zend_Form
A Brief Introduction to Zend_FormA Brief Introduction to Zend_Form
A Brief Introduction to Zend_FormJeremy Kendall
 
TDD in PHP - Memphis PHP 2011-08-25
TDD in PHP - Memphis PHP 2011-08-25TDD in PHP - Memphis PHP 2011-08-25
TDD in PHP - Memphis PHP 2011-08-25Jeremy Kendall
 
Leveraging the Power of Graph Databases in PHP
Leveraging the Power of Graph Databases in PHPLeveraging the Power of Graph Databases in PHP
Leveraging the Power of Graph Databases in PHPJeremy Kendall
 
Tdd in php a brief example
Tdd in php   a brief exampleTdd in php   a brief example
Tdd in php a brief exampleJeremy Kendall
 
Didactica concepto, objeto y finalidades
Didactica   concepto, objeto y finalidadesDidactica   concepto, objeto y finalidades
Didactica concepto, objeto y finalidadesAlejandro De Greef
 
Php 102: Out with the Bad, In with the Good
Php 102: Out with the Bad, In with the GoodPhp 102: Out with the Bad, In with the Good
Php 102: Out with the Bad, In with the GoodJeremy Kendall
 

Viewers also liked (8)

Zero to Zend Framework in 10 minutes
Zero to Zend Framework in 10 minutesZero to Zend Framework in 10 minutes
Zero to Zend Framework in 10 minutes
 
Intro to #memtech PHP 2011-12-05
Intro to #memtech PHP   2011-12-05Intro to #memtech PHP   2011-12-05
Intro to #memtech PHP 2011-12-05
 
A Brief Introduction to Zend_Form
A Brief Introduction to Zend_FormA Brief Introduction to Zend_Form
A Brief Introduction to Zend_Form
 
TDD in PHP - Memphis PHP 2011-08-25
TDD in PHP - Memphis PHP 2011-08-25TDD in PHP - Memphis PHP 2011-08-25
TDD in PHP - Memphis PHP 2011-08-25
 
Leveraging the Power of Graph Databases in PHP
Leveraging the Power of Graph Databases in PHPLeveraging the Power of Graph Databases in PHP
Leveraging the Power of Graph Databases in PHP
 
Tdd in php a brief example
Tdd in php   a brief exampleTdd in php   a brief example
Tdd in php a brief example
 
Didactica concepto, objeto y finalidades
Didactica   concepto, objeto y finalidadesDidactica   concepto, objeto y finalidades
Didactica concepto, objeto y finalidades
 
Php 102: Out with the Bad, In with the Good
Php 102: Out with the Bad, In with the GoodPhp 102: Out with the Bad, In with the Good
Php 102: Out with the Bad, In with the Good
 

Similar to Illinois Health Care Spring It Technology Conference

Social Media Measurement and ROI: One Company’s Perspective
Social Media Measurement and ROI: One Company’s PerspectiveSocial Media Measurement and ROI: One Company’s Perspective
Social Media Measurement and ROI: One Company’s PerspectiveBoris Loukanov
 
Saiful hidayat pengembangan e health sebagai pendukung pelayanan dokter kelua...
Saiful hidayat pengembangan e health sebagai pendukung pelayanan dokter kelua...Saiful hidayat pengembangan e health sebagai pendukung pelayanan dokter kelua...
Saiful hidayat pengembangan e health sebagai pendukung pelayanan dokter kelua...Saiful Hidayat
 
Partnership courseproject.2012.v1 team dream
Partnership courseproject.2012.v1   team dreamPartnership courseproject.2012.v1   team dream
Partnership courseproject.2012.v1 team dreamJean Dearden
 
Taking the Training Wheels Off Social Software
Taking the Training Wheels Off Social SoftwareTaking the Training Wheels Off Social Software
Taking the Training Wheels Off Social SoftwareAlan Lepofsky
 
Introduction &amp; EHR Benefits Realization
Introduction &amp; EHR Benefits RealizationIntroduction &amp; EHR Benefits Realization
Introduction &amp; EHR Benefits RealizationDave Shiple
 
Organizational Climate for Engagement
Organizational Climate for EngagementOrganizational Climate for Engagement
Organizational Climate for EngagementThe LEAD Institute
 
Reducing Risks in Healthcare Operations Management
Reducing Risks in Healthcare Operations ManagementReducing Risks in Healthcare Operations Management
Reducing Risks in Healthcare Operations ManagementBoon Koo
 
Safety 2012 producing a sustainability report session 654
Safety 2012 producing a sustainability report   session 654Safety 2012 producing a sustainability report   session 654
Safety 2012 producing a sustainability report session 654FayFeeney
 
B2 staffing needs of an organization -ppt - stan keasling
B2 staffing needs of an organization -ppt - stan keaslingB2 staffing needs of an organization -ppt - stan keasling
B2 staffing needs of an organization -ppt - stan keaslingHousing Assistance Council
 
Faculty of Tropical Medicine, Mahidol University's Site Visit at Ramathibodi
Faculty of Tropical Medicine, Mahidol University's Site Visit at RamathibodiFaculty of Tropical Medicine, Mahidol University's Site Visit at Ramathibodi
Faculty of Tropical Medicine, Mahidol University's Site Visit at RamathibodiNawanan Theera-Ampornpunt
 
Ntt Data Advisory & Interactive 20120529
Ntt Data Advisory & Interactive 20120529Ntt Data Advisory & Interactive 20120529
Ntt Data Advisory & Interactive 20120529Dana Helland
 
Resistance to Change, a Leaders' perspective. Webinar amp oct 2013 21st
Resistance to Change, a Leaders' perspective. Webinar  amp oct 2013 21stResistance to Change, a Leaders' perspective. Webinar  amp oct 2013 21st
Resistance to Change, a Leaders' perspective. Webinar amp oct 2013 21stAssentire Ltd
 
Gemba walk: the start of your lean journey
Gemba walk: the start of your lean journeyGemba walk: the start of your lean journey
Gemba walk: the start of your lean journeyboscollkid
 
Jean marc saubade-the consumer goods forum
Jean marc saubade-the consumer goods forumJean marc saubade-the consumer goods forum
Jean marc saubade-the consumer goods forumECR Community
 
HITC Attestation Webinar 1.11.12
HITC Attestation Webinar 1.11.12HITC Attestation Webinar 1.11.12
HITC Attestation Webinar 1.11.12Think DCS
 
Assessing and Transforming Leadership Culture
Assessing and Transforming Leadership CultureAssessing and Transforming Leadership Culture
Assessing and Transforming Leadership CultureProfiles Asia
 

Similar to Illinois Health Care Spring It Technology Conference (20)

Social Media Measurement and ROI: One Company’s Perspective
Social Media Measurement and ROI: One Company’s PerspectiveSocial Media Measurement and ROI: One Company’s Perspective
Social Media Measurement and ROI: One Company’s Perspective
 
Saiful hidayat pengembangan e health sebagai pendukung pelayanan dokter kelua...
Saiful hidayat pengembangan e health sebagai pendukung pelayanan dokter kelua...Saiful hidayat pengembangan e health sebagai pendukung pelayanan dokter kelua...
Saiful hidayat pengembangan e health sebagai pendukung pelayanan dokter kelua...
 
Partnership courseproject.2012.v1 team dream
Partnership courseproject.2012.v1   team dreamPartnership courseproject.2012.v1   team dream
Partnership courseproject.2012.v1 team dream
 
Taking the Training Wheels Off Social Software
Taking the Training Wheels Off Social SoftwareTaking the Training Wheels Off Social Software
Taking the Training Wheels Off Social Software
 
Profile Smiling One August 2010
Profile Smiling One   August 2010Profile Smiling One   August 2010
Profile Smiling One August 2010
 
Introduction &amp; EHR Benefits Realization
Introduction &amp; EHR Benefits RealizationIntroduction &amp; EHR Benefits Realization
Introduction &amp; EHR Benefits Realization
 
Organizational Climate for Engagement
Organizational Climate for EngagementOrganizational Climate for Engagement
Organizational Climate for Engagement
 
May 2012 GHS Town Hall
May 2012 GHS Town HallMay 2012 GHS Town Hall
May 2012 GHS Town Hall
 
Reducing Risks in Healthcare Operations Management
Reducing Risks in Healthcare Operations ManagementReducing Risks in Healthcare Operations Management
Reducing Risks in Healthcare Operations Management
 
Safety 2012 producing a sustainability report session 654
Safety 2012 producing a sustainability report   session 654Safety 2012 producing a sustainability report   session 654
Safety 2012 producing a sustainability report session 654
 
B2 staffing needs of an organization -ppt - stan keasling
B2 staffing needs of an organization -ppt - stan keaslingB2 staffing needs of an organization -ppt - stan keasling
B2 staffing needs of an organization -ppt - stan keasling
 
Faculty of Tropical Medicine, Mahidol University's Site Visit at Ramathibodi
Faculty of Tropical Medicine, Mahidol University's Site Visit at RamathibodiFaculty of Tropical Medicine, Mahidol University's Site Visit at Ramathibodi
Faculty of Tropical Medicine, Mahidol University's Site Visit at Ramathibodi
 
Ntt Data Advisory & Interactive 20120529
Ntt Data Advisory & Interactive 20120529Ntt Data Advisory & Interactive 20120529
Ntt Data Advisory & Interactive 20120529
 
Resistance to Change, a Leaders' perspective. Webinar amp oct 2013 21st
Resistance to Change, a Leaders' perspective. Webinar  amp oct 2013 21stResistance to Change, a Leaders' perspective. Webinar  amp oct 2013 21st
Resistance to Change, a Leaders' perspective. Webinar amp oct 2013 21st
 
Mobility & HR
Mobility & HRMobility & HR
Mobility & HR
 
Angela sinickas
Angela sinickasAngela sinickas
Angela sinickas
 
Gemba walk: the start of your lean journey
Gemba walk: the start of your lean journeyGemba walk: the start of your lean journey
Gemba walk: the start of your lean journey
 
Jean marc saubade-the consumer goods forum
Jean marc saubade-the consumer goods forumJean marc saubade-the consumer goods forum
Jean marc saubade-the consumer goods forum
 
HITC Attestation Webinar 1.11.12
HITC Attestation Webinar 1.11.12HITC Attestation Webinar 1.11.12
HITC Attestation Webinar 1.11.12
 
Assessing and Transforming Leadership Culture
Assessing and Transforming Leadership CultureAssessing and Transforming Leadership Culture
Assessing and Transforming Leadership Culture
 

Recently uploaded

College Call Girls in Haridwar 9667172968 Short 4000 Night 10000 Best call gi...
College Call Girls in Haridwar 9667172968 Short 4000 Night 10000 Best call gi...College Call Girls in Haridwar 9667172968 Short 4000 Night 10000 Best call gi...
College Call Girls in Haridwar 9667172968 Short 4000 Night 10000 Best call gi...perfect solution
 
Top Quality Call Girl Service Kalyanpur 6378878445 Available Call Girls Any Time
Top Quality Call Girl Service Kalyanpur 6378878445 Available Call Girls Any TimeTop Quality Call Girl Service Kalyanpur 6378878445 Available Call Girls Any Time
Top Quality Call Girl Service Kalyanpur 6378878445 Available Call Girls Any TimeCall Girls Delhi
 
Call Girls Gwalior Just Call 8617370543 Top Class Call Girl Service Available
Call Girls Gwalior Just Call 8617370543 Top Class Call Girl Service AvailableCall Girls Gwalior Just Call 8617370543 Top Class Call Girl Service Available
Call Girls Gwalior Just Call 8617370543 Top Class Call Girl Service AvailableDipal Arora
 
Top Rated Bangalore Call Girls Richmond Circle ⟟ 8250192130 ⟟ Call Me For Gen...
Top Rated Bangalore Call Girls Richmond Circle ⟟ 8250192130 ⟟ Call Me For Gen...Top Rated Bangalore Call Girls Richmond Circle ⟟ 8250192130 ⟟ Call Me For Gen...
Top Rated Bangalore Call Girls Richmond Circle ⟟ 8250192130 ⟟ Call Me For Gen...narwatsonia7
 
The Most Attractive Hyderabad Call Girls Kothapet 𖠋 6297143586 𖠋 Will You Mis...
The Most Attractive Hyderabad Call Girls Kothapet 𖠋 6297143586 𖠋 Will You Mis...The Most Attractive Hyderabad Call Girls Kothapet 𖠋 6297143586 𖠋 Will You Mis...
The Most Attractive Hyderabad Call Girls Kothapet 𖠋 6297143586 𖠋 Will You Mis...chandars293
 
Night 7k to 12k Navi Mumbai Call Girl Photo 👉 BOOK NOW 9833363713 👈 ♀️ night ...
Night 7k to 12k Navi Mumbai Call Girl Photo 👉 BOOK NOW 9833363713 👈 ♀️ night ...Night 7k to 12k Navi Mumbai Call Girl Photo 👉 BOOK NOW 9833363713 👈 ♀️ night ...
Night 7k to 12k Navi Mumbai Call Girl Photo 👉 BOOK NOW 9833363713 👈 ♀️ night ...aartirawatdelhi
 
Call Girls Cuttack Just Call 9907093804 Top Class Call Girl Service Available
Call Girls Cuttack Just Call 9907093804 Top Class Call Girl Service AvailableCall Girls Cuttack Just Call 9907093804 Top Class Call Girl Service Available
Call Girls Cuttack Just Call 9907093804 Top Class Call Girl Service AvailableDipal Arora
 
Book Paid Powai Call Girls Mumbai 𖠋 9930245274 𖠋Low Budget Full Independent H...
Book Paid Powai Call Girls Mumbai 𖠋 9930245274 𖠋Low Budget Full Independent H...Book Paid Powai Call Girls Mumbai 𖠋 9930245274 𖠋Low Budget Full Independent H...
Book Paid Powai Call Girls Mumbai 𖠋 9930245274 𖠋Low Budget Full Independent H...Call Girls in Nagpur High Profile
 
All Time Service Available Call Girls Marine Drive 📳 9820252231 For 18+ VIP C...
All Time Service Available Call Girls Marine Drive 📳 9820252231 For 18+ VIP C...All Time Service Available Call Girls Marine Drive 📳 9820252231 For 18+ VIP C...
All Time Service Available Call Girls Marine Drive 📳 9820252231 For 18+ VIP C...Arohi Goyal
 
Call Girls Ludhiana Just Call 9907093804 Top Class Call Girl Service Available
Call Girls Ludhiana Just Call 9907093804 Top Class Call Girl Service AvailableCall Girls Ludhiana Just Call 9907093804 Top Class Call Girl Service Available
Call Girls Ludhiana Just Call 9907093804 Top Class Call Girl Service AvailableDipal Arora
 
Call Girls Dehradun Just Call 9907093804 Top Class Call Girl Service Available
Call Girls Dehradun Just Call 9907093804 Top Class Call Girl Service AvailableCall Girls Dehradun Just Call 9907093804 Top Class Call Girl Service Available
Call Girls Dehradun Just Call 9907093804 Top Class Call Girl Service AvailableDipal Arora
 
Call Girls Siliguri Just Call 9907093804 Top Class Call Girl Service Available
Call Girls Siliguri Just Call 9907093804 Top Class Call Girl Service AvailableCall Girls Siliguri Just Call 9907093804 Top Class Call Girl Service Available
Call Girls Siliguri Just Call 9907093804 Top Class Call Girl Service AvailableDipal Arora
 
VIP Service Call Girls Sindhi Colony 📳 7877925207 For 18+ VIP Call Girl At Th...
VIP Service Call Girls Sindhi Colony 📳 7877925207 For 18+ VIP Call Girl At Th...VIP Service Call Girls Sindhi Colony 📳 7877925207 For 18+ VIP Call Girl At Th...
VIP Service Call Girls Sindhi Colony 📳 7877925207 For 18+ VIP Call Girl At Th...jageshsingh5554
 
Call Girls Service Surat Samaira ❤️🍑 8250192130 👄 Independent Escort Service ...
Call Girls Service Surat Samaira ❤️🍑 8250192130 👄 Independent Escort Service ...Call Girls Service Surat Samaira ❤️🍑 8250192130 👄 Independent Escort Service ...
Call Girls Service Surat Samaira ❤️🍑 8250192130 👄 Independent Escort Service ...CALL GIRLS
 
Top Rated Bangalore Call Girls Mg Road ⟟ 8250192130 ⟟ Call Me For Genuine Sex...
Top Rated Bangalore Call Girls Mg Road ⟟ 8250192130 ⟟ Call Me For Genuine Sex...Top Rated Bangalore Call Girls Mg Road ⟟ 8250192130 ⟟ Call Me For Genuine Sex...
Top Rated Bangalore Call Girls Mg Road ⟟ 8250192130 ⟟ Call Me For Genuine Sex...narwatsonia7
 
Best Rate (Hyderabad) Call Girls Jahanuma ⟟ 8250192130 ⟟ High Class Call Girl...
Best Rate (Hyderabad) Call Girls Jahanuma ⟟ 8250192130 ⟟ High Class Call Girl...Best Rate (Hyderabad) Call Girls Jahanuma ⟟ 8250192130 ⟟ High Class Call Girl...
Best Rate (Hyderabad) Call Girls Jahanuma ⟟ 8250192130 ⟟ High Class Call Girl...astropune
 
Call Girls Faridabad Just Call 9907093804 Top Class Call Girl Service Available
Call Girls Faridabad Just Call 9907093804 Top Class Call Girl Service AvailableCall Girls Faridabad Just Call 9907093804 Top Class Call Girl Service Available
Call Girls Faridabad Just Call 9907093804 Top Class Call Girl Service AvailableDipal Arora
 
Best Rate (Guwahati ) Call Girls Guwahati ⟟ 8617370543 ⟟ High Class Call Girl...
Best Rate (Guwahati ) Call Girls Guwahati ⟟ 8617370543 ⟟ High Class Call Girl...Best Rate (Guwahati ) Call Girls Guwahati ⟟ 8617370543 ⟟ High Class Call Girl...
Best Rate (Guwahati ) Call Girls Guwahati ⟟ 8617370543 ⟟ High Class Call Girl...Dipal Arora
 
Call Girls Varanasi Just Call 9907093804 Top Class Call Girl Service Available
Call Girls Varanasi Just Call 9907093804 Top Class Call Girl Service AvailableCall Girls Varanasi Just Call 9907093804 Top Class Call Girl Service Available
Call Girls Varanasi Just Call 9907093804 Top Class Call Girl Service AvailableDipal Arora
 
Russian Call Girls in Jaipur Riya WhatsApp ❤8445551418 VIP Call Girls Jaipur
Russian Call Girls in Jaipur Riya WhatsApp ❤8445551418 VIP Call Girls JaipurRussian Call Girls in Jaipur Riya WhatsApp ❤8445551418 VIP Call Girls Jaipur
Russian Call Girls in Jaipur Riya WhatsApp ❤8445551418 VIP Call Girls Jaipurparulsinha
 

Recently uploaded (20)

College Call Girls in Haridwar 9667172968 Short 4000 Night 10000 Best call gi...
College Call Girls in Haridwar 9667172968 Short 4000 Night 10000 Best call gi...College Call Girls in Haridwar 9667172968 Short 4000 Night 10000 Best call gi...
College Call Girls in Haridwar 9667172968 Short 4000 Night 10000 Best call gi...
 
Top Quality Call Girl Service Kalyanpur 6378878445 Available Call Girls Any Time
Top Quality Call Girl Service Kalyanpur 6378878445 Available Call Girls Any TimeTop Quality Call Girl Service Kalyanpur 6378878445 Available Call Girls Any Time
Top Quality Call Girl Service Kalyanpur 6378878445 Available Call Girls Any Time
 
Call Girls Gwalior Just Call 8617370543 Top Class Call Girl Service Available
Call Girls Gwalior Just Call 8617370543 Top Class Call Girl Service AvailableCall Girls Gwalior Just Call 8617370543 Top Class Call Girl Service Available
Call Girls Gwalior Just Call 8617370543 Top Class Call Girl Service Available
 
Top Rated Bangalore Call Girls Richmond Circle ⟟ 8250192130 ⟟ Call Me For Gen...
Top Rated Bangalore Call Girls Richmond Circle ⟟ 8250192130 ⟟ Call Me For Gen...Top Rated Bangalore Call Girls Richmond Circle ⟟ 8250192130 ⟟ Call Me For Gen...
Top Rated Bangalore Call Girls Richmond Circle ⟟ 8250192130 ⟟ Call Me For Gen...
 
The Most Attractive Hyderabad Call Girls Kothapet 𖠋 6297143586 𖠋 Will You Mis...
The Most Attractive Hyderabad Call Girls Kothapet 𖠋 6297143586 𖠋 Will You Mis...The Most Attractive Hyderabad Call Girls Kothapet 𖠋 6297143586 𖠋 Will You Mis...
The Most Attractive Hyderabad Call Girls Kothapet 𖠋 6297143586 𖠋 Will You Mis...
 
Night 7k to 12k Navi Mumbai Call Girl Photo 👉 BOOK NOW 9833363713 👈 ♀️ night ...
Night 7k to 12k Navi Mumbai Call Girl Photo 👉 BOOK NOW 9833363713 👈 ♀️ night ...Night 7k to 12k Navi Mumbai Call Girl Photo 👉 BOOK NOW 9833363713 👈 ♀️ night ...
Night 7k to 12k Navi Mumbai Call Girl Photo 👉 BOOK NOW 9833363713 👈 ♀️ night ...
 
Call Girls Cuttack Just Call 9907093804 Top Class Call Girl Service Available
Call Girls Cuttack Just Call 9907093804 Top Class Call Girl Service AvailableCall Girls Cuttack Just Call 9907093804 Top Class Call Girl Service Available
Call Girls Cuttack Just Call 9907093804 Top Class Call Girl Service Available
 
Book Paid Powai Call Girls Mumbai 𖠋 9930245274 𖠋Low Budget Full Independent H...
Book Paid Powai Call Girls Mumbai 𖠋 9930245274 𖠋Low Budget Full Independent H...Book Paid Powai Call Girls Mumbai 𖠋 9930245274 𖠋Low Budget Full Independent H...
Book Paid Powai Call Girls Mumbai 𖠋 9930245274 𖠋Low Budget Full Independent H...
 
All Time Service Available Call Girls Marine Drive 📳 9820252231 For 18+ VIP C...
All Time Service Available Call Girls Marine Drive 📳 9820252231 For 18+ VIP C...All Time Service Available Call Girls Marine Drive 📳 9820252231 For 18+ VIP C...
All Time Service Available Call Girls Marine Drive 📳 9820252231 For 18+ VIP C...
 
Call Girls Ludhiana Just Call 9907093804 Top Class Call Girl Service Available
Call Girls Ludhiana Just Call 9907093804 Top Class Call Girl Service AvailableCall Girls Ludhiana Just Call 9907093804 Top Class Call Girl Service Available
Call Girls Ludhiana Just Call 9907093804 Top Class Call Girl Service Available
 
Call Girls Dehradun Just Call 9907093804 Top Class Call Girl Service Available
Call Girls Dehradun Just Call 9907093804 Top Class Call Girl Service AvailableCall Girls Dehradun Just Call 9907093804 Top Class Call Girl Service Available
Call Girls Dehradun Just Call 9907093804 Top Class Call Girl Service Available
 
Call Girls Siliguri Just Call 9907093804 Top Class Call Girl Service Available
Call Girls Siliguri Just Call 9907093804 Top Class Call Girl Service AvailableCall Girls Siliguri Just Call 9907093804 Top Class Call Girl Service Available
Call Girls Siliguri Just Call 9907093804 Top Class Call Girl Service Available
 
VIP Service Call Girls Sindhi Colony 📳 7877925207 For 18+ VIP Call Girl At Th...
VIP Service Call Girls Sindhi Colony 📳 7877925207 For 18+ VIP Call Girl At Th...VIP Service Call Girls Sindhi Colony 📳 7877925207 For 18+ VIP Call Girl At Th...
VIP Service Call Girls Sindhi Colony 📳 7877925207 For 18+ VIP Call Girl At Th...
 
Call Girls Service Surat Samaira ❤️🍑 8250192130 👄 Independent Escort Service ...
Call Girls Service Surat Samaira ❤️🍑 8250192130 👄 Independent Escort Service ...Call Girls Service Surat Samaira ❤️🍑 8250192130 👄 Independent Escort Service ...
Call Girls Service Surat Samaira ❤️🍑 8250192130 👄 Independent Escort Service ...
 
Top Rated Bangalore Call Girls Mg Road ⟟ 8250192130 ⟟ Call Me For Genuine Sex...
Top Rated Bangalore Call Girls Mg Road ⟟ 8250192130 ⟟ Call Me For Genuine Sex...Top Rated Bangalore Call Girls Mg Road ⟟ 8250192130 ⟟ Call Me For Genuine Sex...
Top Rated Bangalore Call Girls Mg Road ⟟ 8250192130 ⟟ Call Me For Genuine Sex...
 
Best Rate (Hyderabad) Call Girls Jahanuma ⟟ 8250192130 ⟟ High Class Call Girl...
Best Rate (Hyderabad) Call Girls Jahanuma ⟟ 8250192130 ⟟ High Class Call Girl...Best Rate (Hyderabad) Call Girls Jahanuma ⟟ 8250192130 ⟟ High Class Call Girl...
Best Rate (Hyderabad) Call Girls Jahanuma ⟟ 8250192130 ⟟ High Class Call Girl...
 
Call Girls Faridabad Just Call 9907093804 Top Class Call Girl Service Available
Call Girls Faridabad Just Call 9907093804 Top Class Call Girl Service AvailableCall Girls Faridabad Just Call 9907093804 Top Class Call Girl Service Available
Call Girls Faridabad Just Call 9907093804 Top Class Call Girl Service Available
 
Best Rate (Guwahati ) Call Girls Guwahati ⟟ 8617370543 ⟟ High Class Call Girl...
Best Rate (Guwahati ) Call Girls Guwahati ⟟ 8617370543 ⟟ High Class Call Girl...Best Rate (Guwahati ) Call Girls Guwahati ⟟ 8617370543 ⟟ High Class Call Girl...
Best Rate (Guwahati ) Call Girls Guwahati ⟟ 8617370543 ⟟ High Class Call Girl...
 
Call Girls Varanasi Just Call 9907093804 Top Class Call Girl Service Available
Call Girls Varanasi Just Call 9907093804 Top Class Call Girl Service AvailableCall Girls Varanasi Just Call 9907093804 Top Class Call Girl Service Available
Call Girls Varanasi Just Call 9907093804 Top Class Call Girl Service Available
 
Russian Call Girls in Jaipur Riya WhatsApp ❤8445551418 VIP Call Girls Jaipur
Russian Call Girls in Jaipur Riya WhatsApp ❤8445551418 VIP Call Girls JaipurRussian Call Girls in Jaipur Riya WhatsApp ❤8445551418 VIP Call Girls Jaipur
Russian Call Girls in Jaipur Riya WhatsApp ❤8445551418 VIP Call Girls Jaipur
 

Illinois Health Care Spring It Technology Conference

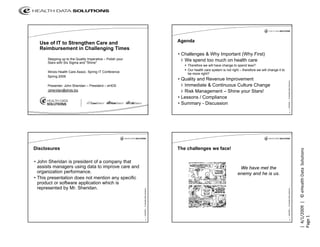
  • 1. Use of IT to Strengthen Care and Agenda Reimbursement in Challenging Times • Challenges & Why Important (Why First) Stepping up to the Quality Imperative – Polish your Stars with Six Sigma and "Shine" › We spend too much on health care Therefore we will have change to spend less? Our health care system is not right – therefore we will change it to Illinois Health Care Assoc. Spring IT Conference be more right? Spring 2009 • Quality and Revenue Improvement utions P Presenter: John Sheridan – P id t – eHDS t J h Sh id President HDS › Immediate & Continuous Culture Change | 4/6/2009 | © eHealth Data Solu Jsheridan@ehds.biz › Risk Management – Shine your Stars! • Lessons / Compliance • Summary - Discussion 2 Disclosures The challenges we face! ons  ealth Data  Solutio • John Sheridan is president of a company that assists managers using data to improve care and We have met the organization performance. enemy and he is us. • This presentation does not mention any specific product or software application which is /2009  |   © eHe represented by Mr. Sheridan. utions utions | 4/6/2009 | © eHealth Data Solu | 4/6/2009 | © eHealth Data Solu |  4/1/ Page 11 3 4
  • 2. Step by step – 1. Target Declines – 2. Call in Do the right thing! Therapy – 3. Manage the Schedule for MDS Facility: Iowa Place Time: Q4‐08 QI/QM: 9.1 ADL decline • Reimbursement 9 residents decline in ADL 9 residents decline in ADL Resident Case Mix Opportunity on Residents who have declined in their ADL Score on the assessment (and addressed with  › Evidence for more care directs care and service BLACK, JESSICA BRAXTON, JORDAN Assessme Therapy Potential Payment Payment to residents and improves Case Mix CRIMENI, JANINE DAVIDSON, JANINE nt ADL RUG Case RUG Case Payment Days Days Case  DINNOCENZO, JANE Referenc Scor Opportun Case Mix  Opportun Using RUGs to improve Quality Measures DUNN, JANE Resident Name SSN e e Code Mix Code Mix Source ity Points ity Mix  Points – Evaluate residents who decline in ADL and Mobility Scores ENGLE, JANINE EVANKO, JANE Date Inde x Index Q4‐2008 Added Q1‐2008 – ADL decline, mobility worsening – are the 5-Star key measures FLEISSNER, JESSICA BLACK, JESSICA 349‐11‐ 10/23/20 9999 08 15 RAC 1.28 Medicare utions utions – Evaluate potential for restorative care p 349‐45‐ 11/14/20 | 4/6/2009 | © eHealth Data Solu | 4/6/2009 | © eHealth Data Solu BRAXTON, JORDAN BRAXTON JORDAN 9999 08 4 CA1 0 92 RAA 1 040 M di id 0.92 1.040 Medicaid 47 5.64 5 64 45 5.40 5 40 • Quality and Integrity CRIMENI, JANINE 349‐70‐ 11/11/20 9999 08 17 CC2 1.49 RAD 1.62 Medicaid 50 6.5 42 5.46 › Get Ready for Medicare and Medicaid Audit 349‐90‐ 12/14/20 DAVIDSON, JANINE 9999 08 10 IB2 0.85 RAB 1.2 Medicaid 17 5.95 75 26.25 350‐18‐ 10/8/200 DINNOCENZO, JANE 9999 8 12 PD1 0.84 RAB 1.2 Medicaid 84 30.24 8 2.88 All data are real examples that have been de-identified. 5 6 Case Study on IT Evaluation for Optimum Why Use IT? ons  Therapy and Restorative Care Opportunity F-287 Automated Data Processing Requirement ealth Data  Solutio CMI 34 Interval Comparison ‐ Minnesota Place  RUG (1) All Payer Q3‐ (2) All P (1) All P Q3 (2) All Payer Q4‐ Q4 Q3 ‐ Q3 Q4 ‐ Q4 • Intent F 287 F-287 Group 08 08 CMI Days CMI Points Days CMI Points Potential  1.022 Potential  1.046 › …to enable a facility to better monitor a All 6,920 6,873.48 5,954 6,050.50 7,071.06  6,230.11  resident’s decline and progress over time. 0.99 1.02 0.0286  0.0302  Computer-aided data analysis facilitates a more Restorative Care 148.90  107.77  efficient, comprehensive and sophisticated /2009  |   © eHe Therapy 48.68  71.84  review of health data. utions utions Total › Th primary purpose of maintaining th The i f i t i i the | 4/6/2009 | © eHealth Data Solu | 4/6/2009 | © eHealth Data Solu Opportunity 197.58  179.61  assessment data is so a facility can monitor Evaluate Residents and apply restorative care to maintain status and to assist improvement. resident progress over time. The information Where declines have occurred, evaluate and apply therapy (Parts A or B) where appropriate. should be readily available at all times. |  4/1/ Page 22 7 8
  • 3. CMS has 8 initiatives for Healthcare Recovery Audit Contract Expansion financial integrity - • CMS p g programs related to health care financial integrity: g y › The Medicare Accountability Contractor (MAC) conversion for payers › The Zone Program Integrity Contractor (ZPIC) › The NCCI (National Correct Coding Initiative) › The Medicaid Integrity Contractor (MIC) - Medicaid Payment Integrity › PROBES - After data analysis, Contractors must verify if billing problems exist through probe reviews. utions utions › PERM – Payment Error Rate Measurement – states participate every | 4/6/2009 | © eHealth Data Solu | 4/6/2009 | © eHealth Data Solu three years › CERTs – Comprehensive Error Rate Testing Inpatient Hospital – 85 percent ($823.3 million) RAC - Fees › The RAC – Medicare Payments from 10/1/2007 forward – Automatic Inpatient Rehab – 6 percent ($59.7 million) Region A –12.45 Percent and Complex reviews for appropriate care and correct coding Outpatient Hospital – 4 percent ($44 million) Region B – 12.50 Percent Physicians – 2 percent ($19.9 million) Region C – 9 Percent SNFs – 2 percent ($16.3 million) Region D – 9.49 Percent DME – 1 percent ($6.3 million) 9 10 Ambulance/Lab/Other – < 1 percent ($5.4 million) Prevent/Reduce Recoupment ons  of Medicare and Medicaid Dollars UB-04 / MDS Exceptions [RAC Recovery Audit Contract] ealth Data  Solutio Coun • CMS estimates 10.4 billion in Medicare errors and UB‐04 ‐ MDS Exception Report t 51 Principal Diagnosis does not have a matching ICD9 code or explicit diagnosis field not set on corresponding MDSs a federal 18.0 billion in Medicaid errors. 43 33 Excluded service No admission MDS corresponding to admission date 21 RUG in claim does not match RUG in corresponding MDS 19 Therapy level for patient exceeds therapy cap • Check your electronic records of bills (UB-04) with 16 16 Rehab therapy RUG but no therapy charges Non‐rehab RUGs but with therapy charges those of clinical assessments (MDS). 14 13 Claim type and dates inconsistent with corresponding MDSs Unjustified automatic exception modifier /2009  |   © eHe 13 No qualifying hospital stay before admission 12 Speech therapy but no dysphagia or other allowed diagnosis utions utions • Checks whether Principal and Admitting 11 Therapies on same day may indicate a need for a procedure code modifier | 4/6/2009 | © eHealth Data Solu | 4/6/2009 | © eHealth Data Solu 10 No corresponding MDSs for claim Diagnoses are supported by the care documented 5 4 Admission date is greater than 30 days from qualifying hospital stay Missing occurrence entries for speech therapy and present in the record. 3 3 Therapy cap modifier missing after therapy cap reached Missing occurrence entries for physical therapy › Prevent/reduce RAC recoupment of Medicare 2 2 Missing value code for physical therapy Missing value code for speech therapy and Medicaid $. 1 1 Missing occurrence entries for occupational therapy Outpatient claim dates overlap with part A claim dates without required condition code |  4/1/ 1 Invalid ICD9 code(s)  Page 33 11 12
  • 4. Challenges and Obstacles The Steps for Buy-In • Too much Data – What can we do? • Recognition of a need • It’s just the data! • Too little time • Discussion about the need • We need to do what is in front of us now • I only know what I know • Find a solution to the need • Excellence demands growth utions utions | 4/6/2009 | © eHealth Data Solu | 4/6/2009 | © eHealth Data Solu › use of new technology and new methods is challenging › growing pains may cause us to seek relief • Support implementation of the solutions no pain, no gain to resolve the need • Can-do spirit! 13 14 Information, Technology and Management National Quality Forum – A National Consensus ons  www.qualityforum.org ealth Data  Solutio • Serious Reportable Events - Transparency & accountability are critical in • Source of Data reducing medical errors (data in the IT systems) • Management of a Discipline › “Tens of thousands of lives are forever changed each year as a result of healthcare errors. There is a critical need to enhance health system capacity, › Concentrated area of knowledge about so that all patients will receive care that is safe and effective.” - NQF President and CEO Janet Corrigan tools and tool sets › Backup and redundancy • There are 28 Events – CMS plans to recoup $ for "Never Events" /2009  |   © eHe utions utions › › Access The SRE list includes: | 4/6/2009 | © eHealth Data Solu | 4/6/2009 | © eHealth Data Solu Injuries caused by care management rather than the underlying disease › Timeliness – “Fall & Fracture” or “High Risk Pressure Ulcer” Errors that occur from failure to follow standard care or institutional practices and • Evaluation and Analysis policies › A discipline of all management › › The events are largely preventable, but also very serious. The errors are of concern to the public and healthcare providers and warrant careful investigation that should be targeted for mandatory public reporting. |  4/1/ Page 44 15 16
  • 5. 2008/9 Hospitals are Not Paid for Some SREs / NQF is the Basis for the QMs and QI/QMs Never Events (Pay for Performance) – When will Iowa emerge? • 2003: Minnesota is the first state to require reporting entire NQF list. › Now required b CA CT IL IN MA NJ OR VT WA and WY N i d by CA, CT, IL, IN, MA, NJ, OR, VT, WA, d WY. › Other states are considering implementation of the SREs. • October 1, 2008: CMS reduced payment to treat a list of complications CMS deems preventable with good care. › Many of these complications are included on NQF’s SREs list. › The Medicare payment provision encourages the adoption of evidence-based patient safety practices aimed at preventing hospital utions utions acquired conditions. conditions | 4/6/2009 | © eHealth Data Solu | 4/6/2009 | © eHealth Data Solu • The CMS plan › Respond to unintended negative consequences with appropriate corrections and interventions. › Extend the SRE Medicare and Medicaid payment reduction to SNFs. › OIG’s work plan for 2009 is laying the foundation. This process produced the QMs 17 18 Summary of Why SNF Health Care – One Framework ons  ealth Data  Solutio Admin./ED’s Should Work to Improve Quality & Assure Reimbursement • Use of Information Technology 1. The Quality Committee recommends approval of written policy on quality and quality improvement that is approved by the organization’s team and then effectively communicated to all staff and all associated providers. › A logical management system – feedback loop 2. The Quality Committee sets the agenda for the facility’s discussion on quality. of analytics 3. Each Admin/ED has the responsibility to assure that quality receives appropriate time for discussion not only at QA Meetings, but in all activities regarding care. 4. The Admin/ED oversight at her/his facility Quality Committee includes measures for /2009  |   © eHe › Source of data for the analytics quality and resident/patient safety as part of the performance evaluation of the ED, RVP utions utions and Division VP. | 4/6/2009 | © eHealth Data Solu | 4/6/2009 | © eHealth Data Solu 5. The Admin/ED must act with the Quality Committee to improve the quality literacy of the facility staff and volunteers (IT is the source of data) › Tools and tool sets to express the analysis 6. The Quality Committee aligns the mandate for quality improvement in the organization and recommends how this mandate is measured and enforced. Board Engagement in Quality: Findings of a Survey of Hospital and System Leaders - H. Joanna Jiang, PhD,; Carlin Lockee,; Karma Bass, FAHE; and Irene Fraser,PhD; Journal of Healthcare Management 53:2 March/April l 2008 |  4/1/ Page 55 19 20
  • 6. Suggested QA Process Overview - (IT Dashboard) 1. Each Department Presents Their Own QA Information Outcomes Measurement 2. HSKP – Upkeep of Cleaning Schedules, etc. (automated) (K-Tags) a. Laundry – temperature and maintenance logs for laundry equipment b. Maintenance – review of performance for water temperatures, fire & safety systems, call lights, Outcomes need to be reviewed in the context of a preventative maintenance on specialized equipment t ti i t i li d i t continuous monitoring and improvement process. ti it i di t c. Dietary – audits of food temperatures, dish-machine temperatures, & sanitation levels d. Activities – review of participation (F-249) 3. Customer Service Review This approach requires an organization to follow a. Review results of satisfaction surveys – online presentation – look at history through IT five essential steps: b. Discussion of plan for focused resolution of any issues 1) identify important aspects of care, 4. Grievance/Concern Form Review 2) implement indicators of performance, a. Review summary of concern forms received in last month – trend analysis, etc. utions utions b. Discussion of plan… 3) collect and analyze data, | 4/6/2009 | © eHealth Data Solu | 4/6/2009 | © eHealth Data Solu 5. Loss Control Review – examine recent losses – plan review and development 4) isolate common and special causes, and –(IT reports to insurer) 5) develop and implement solutions that improve either a process 6. Infection Control – review of data from last month(s). Analyze distribution map. (IT) or an outcome. 7. Incident Report – online review of IT data Fall analysis – use projector 8. QI/QM Review – IT data – use projector and review control charts – Coordinate Care Plans Donabedian A. Explorations in quality assessment and monitoring. Volume I: the definition of quality and 9. Survey/Complaint – review issues occurring in last month. approaches to its assessment. Ann Arbor, Mich.: Health Administration Press. 10. Medical Records – review select audits completed in last month (IT based) 21 22 Identify QIs-73.5% of Measures Improved Identify - QI/QMs ons  Long Term Care Aggregate Quality of Care Performance QI/QM Residents Population 2007 2006 Accidents 1.1 Fractures 44 1,109 4.00% 4.90% that are… ealth Data  Solutio 1.2 Falls 327 1,155 28.30% 26.30% Behavior/Emotional Patterns 2.1 Depression 516 1,170 44.10% 47.10% 2.2 Affect on others 330 1,150 28.70% 31.60% 2.2‐Hi Affect on others high risk 308 968 31.80% 35.70% 2.2‐Lo Affect on others low risk 25 215 11.60% 9.20% 2.3 Depression w/o therapy 23D i / h 129 1,155 11.20% 1 155 11 20% 13.80% 13 80% Directly Related to the Survey F-Tags Clinical Management 3.1 Medications 896 1,155 77.60% 79.30% Cognitive Patterns 4.1 Cognitive impairment 66 270 24.40% 27.70% Elimination/Incontinence F-Tag Standard QI/QM 5.1 Incontinence low risk 462 864 53.50% 51.70% 5.2 Catheter 112 1,155 9.70% 13.20% 5.3 Incontinence w/o plan 224 613 36.50% 42.60% 5.4 Impaction 0 1,155 0.00% 0.10% 248 Activities Little or No Activity Infection Control 6.1 Urinary tract infection 198 1,155 17.10% 19.90% Nutrition/Eating 314 7.1 Weight loss 198 1,089 18.20% 19.20% 7.2 Tube feeding 7.3 Dehydration 83 1 1,155 7.20% 1,155 0.10% 7.10% 0.00% Pressure Ulcers High Risk Pressure Ulcers /2009  |   © eHe Pain Management 8.1 Pain 92 1,155 8.00% 11.90% 324 utions utions Prevent Accidents Falls (Last 30 Days) Physical Functioning 9.1 ADL decline 299 1,066 28.00% 31.50% 9.2 Bed or chair 69 1,150 6.00% , 6.00% | 4/6/2009 | © eHealth Data Solu | 4/6/2009 | © eHealth Data Solu 325 9.3 Mobility worse 259 848 30.50% 32.80% 9.4 ROM decline Psychotropic Drug Use 10.1 Psychotropic drug use 163 183 1,146 14.20% 1,050 17.40% 17.50% 18.40% Nutrition Weight Loss (5% - 30 Days) 10.1‐Hi Psychotropic drug use high  329 risk 67 252 26.60% 33.10% 10.1‐Lo Psychotropic drug use low  risk 140 920 15.20% 14.50% Unnecessary Drugs 9+ Medications 10.2 Antianxiety/hypnotic use 275 1,050 26.20% 27.30% 10.3 Frequent hypnotic 83 1,155 7.20% 8.40% Quality of Life 11.1 Physical restraints 15 1,155 1.30% 3.00% 11.2 Little or no activity 110 1,150 9.60% 10.20% Skin Care 12.1 Pressure ulcers high risk 160 847 18.90% 21.10% 12.2 Pressure ulcers low risk 9 429 2.10% 5.30% |  4/1/ Page 66 Post‐Acute Care 13.1 Short‐stay delirium 29 887 3.30% 3.30% 13.2 Short‐stay pain 130 895 14.50% 16.90% 13.3 Short‐stay pressure ulcers 153 808 18.90% 18.70% 23 24
  • 7. QI/QMs and F-Tag 323 / F-324 QI/QMs and F-Tag 314 Level of Harm Residents Affected Level of Harm Residents Affected Inspectors Determined: (Least>Most) (Few>Some>Many) Inspectors Determined: (Least>Most) (Few>Some>Many) 3=Actual Harm Few Give residents proper 2=Minimal harm Few Make sure each resident is treatment to prevent or potential for being watched and has Facility 1.8% new bed (pressure) actual harm assistance devices when Fx sores or heal existing needed: prevent accidents. USA 1.9% sores. 6% Adequate supervision Prevent and/or heal utions utions 13.60% pressure ulcers | 4/6/2009 | © eHealth Data Solu Assistance devices to | 4/6/2009 | © eHealth Data Solu Facility 11.8% 11 8% Falls prevent accidents NC State Coach Valvano USA 12.9% 12.90% was cognizant of the fact that today's success is 0.0% 3.5% 7.0% 10.5% 14.0% 17.5% tomorrow's failure. 0.00% 2.00% 4.00% 6.00% 8.00% 10.00%12.00%14.00% Q4 – 2007 Fractures & Falls Q4-07 High Risk Pressure Ulcers 25 26 Using and Interpreting SPC Charts* – A First Step Statistical Process Control Charts Key Terms ons  to Cost Effective Continuous Improvement ealth Data  Solutio • Using Statistical Process Control to facilitate Variation: amount, rate, extent, or degree of change* , , , g g quality improvement Standard Deviation: the typical distance from • Correctly identify quality deficiencies the mean (average) Benchmark against state norm, other facilities, In a “normal distribution,” 68% of scores will fall within 1 standard deviation of the mean. and your historical data. /2009  |   © eHe 95% will fall within 2 standard deviations utions utions Create trend and SPC charts to measure change 99 73% will fall within 3 standard deviations 99.73% | 4/6/2009 | © eHealth Data Solu | 4/6/2009 | © eHealth Data Solu over time. 99.9999998% will fall within 6σ (standard deviations) Inclusive of the Upper and Lower “control” limits Use these tools to empower and validate your quality committee. * "variation." Dictionary.com Unabridged (v 1.1). Random House, Inc. 23 Mar. 2007. <Dictionary.com http://dictionary.reference.com/browse/variation>. |  4/1/ Page 77 *Using statistics to identify and target quality improvement 27 28
  • 8. Hypothetical Example of “Your” Data • Incontinence w/o Plan Evaluating Quality Step by Step Using SPC › Strategy: Red – Needs Improvement › 7.9% gap (UPB-LPB) › 14 periods above national norm 1. 1 Review QI/QMs monthly › 0 periods equal to or below › national norm 8 occasions special cause 2. Group and categorize the QI/QMs › Note: Graph starts at 40% 3. Calculate from the previous month • Pressure Ulcers High 4. Review trends vs. month-to-month QI/QMs Risk › Strategy: Yellow 5. Review the SPC chart to determine: utions utions › 3.5% gap g p Is any change normal variation, or an ariation | 4/6/2009 | © eHealth Data Solu | 4/6/2009 | © eHealth Data Solu › 0 periods above national norm › 14 periods equal to or below national norm Is there a process problem? › 2 occasions special cause › Note: Graph starts at 8% Is quality improving? › Extra-Note: pressure ulcer Are the interventions working? SOW goal = 6.0% - therefore with respect to where we “should” be we are RED 29 30 Statistical Process Control SPC Key Terms, continued ons  ealth Data  Solutio SPC can tell you whether the variation in your QI/QM SPC presents a Dynamic Display scores is due to chance or because of a special cause or Variation in a process is measured by asking: Is it “normal” or the result of a “special” cause? meaningful changes over time.* Does the process need to be re-evaluated? Common Cause Variation – random, due to regular, natural, or Originally developed for the manufacturing field, SPC has ordinary causes. Common Cause Variation is expected to occur. Example: acuity of residents. also been effectively applied to healthcare. Special Cause Variation – due to irregular or unnatural causes. /2009  |   © eHe When special causes are present, a process will be “out of control” utions utions or “unstable”. E ample resident falls unstable Example: | 4/6/2009 | © eHealth Data Solu | 4/6/2009 | © eHealth Data Solu Process = “controlled”: outcomes can be predicted within LIMITS = ? Process ≠ “controlled”: the SPC chart will tell you WHEN to assist and explain WHY. The risk of “tampering” with a controlled process must be balanced against the risk of “under controlling”… |  4/1/ Page 88 *JCAHO and ISO require SPC charts as proof of QA/QI 31 32
  • 9. SPC Key Terms, Continued. • Data Points: plotted over time Example: Incontinence • Mean: average of data points over time • Upper Control Limit (UCL): + 3 standard deviations from the mean In 2006, an average of 60.3% residents triggered 5.1 each month • Lower Control Limit (LCL): – 3 standard deviations from the mean Percent of Residents with 5.1 per month Jan Feb Mar Apr May Jun Jul Aug Sep Oct Nov Dec % 54 52 45 88 54 50 57 48 71 70 60 68 with LRI utions utions | 4/6/2009 | © eHealth Data Solu | 4/6/2009 | © eHealth Data Solu 4/6/2009 33 34 Example 1 Trends and SPC ons  ealth Data  Solutio A trend is also an indicator of a special cause. Trend: an unusually long series of consecutive increases or decreases in the data. Many people infer trends that are not really present because the consecutive data points are not long enough to be statistically significant. /2009  |   © eHe utions utions The Th consecutive “ ” of data points must be, minimally ti “run” f d t i t tb | 4/6/2009 | © eHealth Data Solu | 4/6/2009 | © eHealth Data Solu i i ll between 5-7, depending on the size of the data base. Points above / below the average • Is this process stable? Points in an increasing or decreasing trend • Is this level of incontinence acceptable? Points above / below state or national norm |  4/1/ Page 99 35 36