Il&fs
•
0 likes•61 views

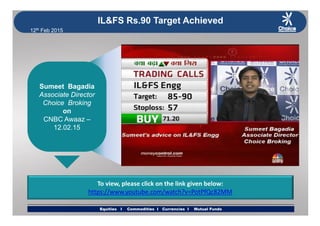
As per view given by Mr. Sumeet Bagadia, our Associate Director - Choice Broking on CNBC Awaaz - IL&FS Rs.90 Target Achieved.....
Report
Share
Report
Share
Download to read offline

Recommended
Mr. Sumeet Bagadia View on Asian Paints
As per view given by Mr. Sumeet Bagadia, our Associate Director - Choice Broking on CNBC Awaaz - Asian Paints Rs. 805 Target Achieved....
Traders choice adaniport
The document provides a technical analysis of ADANIPORT stock and recommends a buy. It summarizes:
1) The stock has formed a double bottom pattern on the daily chart, indicating a bullish reversal.
2) The stock has moved above a consolidation phase, signaling the resumption of an upward trend.
3) Technical indicators like the 21-day and 100-day moving averages also provide positive signals.
4) Based on the analysis, the stock price is expected to rise to Rs. 230 in the coming trading sessions.
Traders choice kwality
The document provides a technical analysis of the stock KWALITY. It recommends buying the stock at 127.6, with a stop loss of 122 and target price of 138. The analysis notes that the stock has shown strength by retracing losses quickly and breaking above a downward trend line. Upside movement has also seen rising volume, indicating growing appetite for the stock. Based on this technical analysis, the document expects the stock to reach 138 in the next few trading sessions.
Traders choice thomascook
Thomas Cook stock is expected to rise further based on technical analysis. The stock terminated its correction at the 38.2% retracement level and has since risen, breaking above a downward trendline. It has consolidated gains in a tight range recently. Its latest upward move indicates bulls have returned and the price may rise further to Rs. 235 over the next few trading sessions.
16 jan 2015
This document provides a weekly equities call tracker from January 12th to 16th. It is solely for informational purposes for Choice Broking clients and does not constitute investment advice. Choice Broking makes recommendations based on technical analysis of market psychology, price patterns, and volume levels, which is complementary to but separate from fundamental analysis. The recommendations are intended for trading purposes only and are valid for the day of the report. Past performance is not a guarantee of future returns and losses are possible.
Silverview
As per view given by Mr. Sumeet Bagadia (Associate Director in Choice Equity Broking Private Limited) on ET NOW – 25.08.14
Traders choice infibeam
This document recommends buying shares of INFIBEAM at Rs. 700 per share. It analyzes technical indicators like moving averages and chart patterns. It observes that the stock has been trending positively, taking support at its 21-day moving average. The stock has formed an ascending triangle pattern and given a positive breakout. Based on this technical analysis, the document forecasts that the stock price will rise to Rs. 740 in the next few trading sessions.
Traders Choice- GICHSGFIN
This document provides a technical analysis of GICHSGFIN stock. It recommends buying the stock at Rs. 210 with a stop loss of Rs. 199 and target of Rs. 232. The analysis notes that the stock found support for the fifth time at a certain level and formed a base. It also reversed from support as seen by a positive candlestick pattern. The momentum oscillator RSI also reversed from support and crossed above its average line, indicating an upward momentum. On longer time frames, the stock is forming a bullish hammer candlestick pattern.
Techno Buy : UPL
The document summarizes a technical analysis of UPL stock. It states that the stock has broken out of a symmetrical triangle pattern and engulfing bullish pattern, indicating upside potential. Momentum indicators also show a positive signal. Based on the technical analysis, it recommends buying UPL at 555 or up to 540 with a stop loss of 515 and target of 650.
Techno Sell - Aluminium
The document provides a technical analysis recommendation to sell Aluminium. It summarizes that prices have broken a "Rising Wedge" formation and momentum indicators show negative divergence, confirming lower prices. Prices have also failed to move above a previous high, signaling a "Dow Theory" sell. The analysis expects prices to move lower to 105.20 in the next few trading sessions as long as 108.6 is not surpassed. It recommends selling Aluminium at 107.5 with a stop loss of 108.6 and target of 105.20.
Techno buy siemensl 14.03.2017
This document provides a technical analysis of a stock and recommends a buy. It summarizes that:
- The stock has broken out of a bullish pattern and a one-year falling trend line with high volume.
- The price is supported at a 61.8% Fibonacci retracement of a previous down move and is trading above its 20- and 200-day moving averages, indicating short- and long-term trends are positive.
- The price is trading above the upper band of its Bollinger Bands, generating a fresh buy signal and suggesting increased volatility in the near term.
Based on this technical analysis, the document recommends buying futures of the stock at a specified price with targets
Traders Choice - SCHNEIDER
This document provides a technical analysis of SCHNEIDER stock and recommends buying it at 176 with a stop loss of 169 and target of 190. It notes that the stock has broken out to higher levels, risen above its 250-day moving average resistance, and seen an escalation in bullish volume in the consolidation area. Additionally, the RSI momentum oscillator has risen above its consolidated range and previous reversal point, suggesting fresh upward momentum in the coming days if the stock sustains above current levels.
Techno sell zinc 01.10.15
The technical analysis of the zinc market suggests prices will likely drift lower. Prices have found resistance near the middle Bollinger band, formed a bearish candlestick near the 50% retracement level, and the super trend and RSI indicators show a downward trend and lack of momentum. On an hourly timeframe, the RSI has formed a negative reversal. Based on this technical setup, prices are expected to fall toward 103.8 as long as they remain below resistance at 114.8. The analyst recommends selling zinc at 110.35 with a stop-loss of 114.8 and target price of 103.8.
Techno Buy (DHFL)
The document provides a technical analysis and recommendation for the stock DHFL. It summarizes that:
1) DHFL has broken out of a reversal pattern on high volume, indicating upside potential in the coming sessions.
2) The stock has formed a large bullish candle on the weekly chart with good volume.
3) During a recent correction, DHFL saw low volume, suggesting potential upside from current levels.
4) Momentum indicators are positive, with the RSI above 60 and a positive crossover, supporting further gains.
5) The recommendation is to buy DHFL at 443-435 with a stop loss of 420 and target of 485.
Techno buy indusindbnk05012017
The document summarizes the technical analysis of a stock that indicates bullish trends. On daily, weekly, and monthly charts, the stock has formed multiple bullish patterns like double bottom, flag pattern breakouts, and tweezer bottoms. Short, medium, and long-term moving averages also show the stock is trading above them, indicating bullish trends. Momentum indicators like MACD have given buy signals, which is considered a positive sign. Based on this technical analysis, further upside movement in the stock is expected. The analyst recommends buying the stock at the current price for targets above 1200.
Traders choice capf
- The stock CAPF is in a strong positive movement after a brief negative period and is rising again.
- It is trading above its short and long term moving averages, demonstrating strength across all timeframes.
- The RSI momentum oscillator found support at 58, an area that previously signaled reversals of corrections, and further movement of the stock to 590 is expected in the next few trading sessions based on the analysis.
Commodities call tracker 25th apr'16 to 29th apr'16
This document provides a weekly commodities call tracker from April 25th to April 29th, 2016. It discusses various commodities like gold, silver, base metals, and energy. The tracker is solely for informational purposes of Choice Broking clients and does not constitute investment advice. It also contains disclaimers that Choice Broking is not liable for any losses resulting from acting on the information provided. The recommendations are based on technical analysis to forecast market psychology, price patterns, and volume levels.
Techno Buy: NMDC
The document provides a technical analysis of NMDC stock. It summarizes that:
- On the weekly chart, the stock has found support at 92 levels, which is a sign of potential upside. It has bounced back from this support level in the past.
- On the daily chart, the stock has formed a "double bottom" pattern indicating a bullish reversal and potential upside from current levels.
- Momentum indicators like the RSI are showing positive divergence, further supporting upside potential for the stock.
- The analysis recommends buying NMDC at 99.50 with a stop loss of 93 and target of 115.
Asian Paint View on CNBC Awaaz
View on Asian Paints given by Mr. Sumeet Bagadia, our Associate Director - Choice Broking on CNBC Awaaz - 02.01.15.
Traders Choice - SRTRANSFIN
The document provides a recommendation to sell SRTRANSFIN futures in January at 780 with a stop loss of 796 and target of 750. It cites technical factors for this recommendation, including that the stock broke below a horizontal support line and formed a failed bullish pattern. Momentum indicators are also tilting downward. Given falling market intensity and the stock likely to follow broader indices, it is recommended to sell the futures contract with the expectation it will move further downward.
Techno Sell: Nickel
The document provides a technical analysis of nickel prices on the MCX exchange. It summarizes that:
1) Nickel prices on MCX broke down from a symmetrical triangle formation and are facing resistance at the 61.8% Fibonacci retracement level, indicating potential downside.
2) Prices are trading below the 60-day moving average and the RSI is below 40, supporting a bearish view.
3) LME nickel prices are in a falling channel formation and facing resistance, also pointing to downside risk.
4) Based on this technical analysis, nickel prices are expected to drift lower to around 570 levels over the next few trading sessions as long as 690 levels
Weeky call tracker 25th apr -29th apr 2016
This document provides a summary of equity call recommendations from April 25th to April 29th. It discusses technical analysis of market psychology, price patterns, and volume levels to forecast future price and market movements. The recommendations are intended for trading purposes only and are valid for the day of the report. Choice Broking obtained the information from sources believed to be reliable but not independently verified. Past performance is not a guarantee of future returns and there is risk of loss of entire investment. The analysts and firm have no interest in the stock or instrument recommendations.
Equities Weeky call tracker 23th may -27th may 16
This document provides an equities weekly call tracker from May 23, 2016 to May 27, 2016 published by Choice Broking. It includes recommendations on equities, commodities, currencies, and mutual funds for trading purposes. However, the recommendations are not intended as investment advice and Choice Broking is not liable for any losses incurred from following the recommendations. All analyses and opinions in the tracker are based on publicly available information and there may be risks involved including market volatility and lack of guaranteed returns.
Gujrat pipavav
Sumeet Bagadia, Associate Director of Choice Broking, discusses equities, commodities, currencies and mutual funds on CNBC Awaaz on January 2nd, 2015. The video link provided summarizes his views on these asset classes. The document also provides standard disclaimers that the views expressed are for informational purposes only and should not be considered investment advice, and that Choice Broking has not independently verified the information presented.
Traders Choice-POLARIS
This document provides a technical analysis of Polaris stock with the following key points:
1) Polaris stock has protected its lows and given a positive breakout, indicating momentum is increasing.
2) It has shown an ascending triangle breakout pattern signaling further upward movement.
3) Support has continued at the 21 day moving average.
4) The momentum oscillator RSI has broken out of its previous upper band adding to the positive outlook.
5) Rising volume accompanies the positive breakout.
Traders choice brfl
The document provides a technical analysis and recommendation to buy BRFL stock at Rs. 164 per share with a stop loss of Rs. 158 and target of Rs. 175 based on 3 points:
1) The stock has formed a base over the past week and is resuming its upward movement after a steep fall.
2) The stock has found support at previous horizontal support and resistance levels.
3) The stock is supported by its 100-day and 250-day moving averages, demonstrating a mid to long-term upward trend.
Based on this analysis, the recommendation is to expect the stock to reach Rs. 175 in the next few trading sessions.
Choice spark jamnaauto
The document provides a technical analysis of Jamna Auto Industries Limited stock. It summarizes that:
- The stock has broken above a horizontal trend line at 190, signaling upside movement. It has also crossed above moving averages, indicating positive momentum.
- The stock is trading above its 200-day moving average and has broken out of a 10-day range, suggesting strong positive movement from current levels.
- Technical indicators like RSI also show positive momentum. Based on this analysis, upside movement in the stock is expected. The report recommends buying the stock between 190-194, with a target of 215 and stop loss of 184.
Trades Choice - TORNTPOWER
- The document recommends buying TORNTPOWER stock based on a technical analysis. It cites an inverted head and shoulder pattern breakout on the higher time frame chart and consolidation on the daily chart as bullish signals.
- Volume activity has increased after the consolidation phase, and the RSI momentum oscillator has found support at a previous resistance level, indicating more upside potential for the stock.
- The target price given is Rs. 250, with support at Rs. 215 and the current price being Rs. 229.
Traders Choice: FIEMIND
This document provides a technical analysis of FIEMIND stock. It recommends buying the stock in cash at Rs. 717, with a stop loss of Rs. 695 and target of Rs. 760. The analysis indicates that the stock has formed a bottom around previous resistance levels and momentum is increasing based on rising RSI values cutting above average lines. Recent price action shows bulls returning as prices move above consolidation ranges.
Traders Choice - Alankit
1) The stock ALANKIT has seen a significant rise in price over the past couple of months, reaching an all-time high in the recent trading session by forming an ideal continuation pattern called a flag pattern.
2) The bulls have taken a pause over the past few trading sessions but have generated enough momentum to push the stock to a new high.
3) The enthusiasm of the bulls and a positive reversal in the RSI indicator suggest that further upside in the stock's price can be expected.
More Related Content
What's hot
Techno Buy : UPL
The document summarizes a technical analysis of UPL stock. It states that the stock has broken out of a symmetrical triangle pattern and engulfing bullish pattern, indicating upside potential. Momentum indicators also show a positive signal. Based on the technical analysis, it recommends buying UPL at 555 or up to 540 with a stop loss of 515 and target of 650.
Techno Sell - Aluminium
The document provides a technical analysis recommendation to sell Aluminium. It summarizes that prices have broken a "Rising Wedge" formation and momentum indicators show negative divergence, confirming lower prices. Prices have also failed to move above a previous high, signaling a "Dow Theory" sell. The analysis expects prices to move lower to 105.20 in the next few trading sessions as long as 108.6 is not surpassed. It recommends selling Aluminium at 107.5 with a stop loss of 108.6 and target of 105.20.
Techno buy siemensl 14.03.2017
This document provides a technical analysis of a stock and recommends a buy. It summarizes that:
- The stock has broken out of a bullish pattern and a one-year falling trend line with high volume.
- The price is supported at a 61.8% Fibonacci retracement of a previous down move and is trading above its 20- and 200-day moving averages, indicating short- and long-term trends are positive.
- The price is trading above the upper band of its Bollinger Bands, generating a fresh buy signal and suggesting increased volatility in the near term.
Based on this technical analysis, the document recommends buying futures of the stock at a specified price with targets
Traders Choice - SCHNEIDER
This document provides a technical analysis of SCHNEIDER stock and recommends buying it at 176 with a stop loss of 169 and target of 190. It notes that the stock has broken out to higher levels, risen above its 250-day moving average resistance, and seen an escalation in bullish volume in the consolidation area. Additionally, the RSI momentum oscillator has risen above its consolidated range and previous reversal point, suggesting fresh upward momentum in the coming days if the stock sustains above current levels.
Techno sell zinc 01.10.15
The technical analysis of the zinc market suggests prices will likely drift lower. Prices have found resistance near the middle Bollinger band, formed a bearish candlestick near the 50% retracement level, and the super trend and RSI indicators show a downward trend and lack of momentum. On an hourly timeframe, the RSI has formed a negative reversal. Based on this technical setup, prices are expected to fall toward 103.8 as long as they remain below resistance at 114.8. The analyst recommends selling zinc at 110.35 with a stop-loss of 114.8 and target price of 103.8.
Techno Buy (DHFL)
The document provides a technical analysis and recommendation for the stock DHFL. It summarizes that:
1) DHFL has broken out of a reversal pattern on high volume, indicating upside potential in the coming sessions.
2) The stock has formed a large bullish candle on the weekly chart with good volume.
3) During a recent correction, DHFL saw low volume, suggesting potential upside from current levels.
4) Momentum indicators are positive, with the RSI above 60 and a positive crossover, supporting further gains.
5) The recommendation is to buy DHFL at 443-435 with a stop loss of 420 and target of 485.
Techno buy indusindbnk05012017
The document summarizes the technical analysis of a stock that indicates bullish trends. On daily, weekly, and monthly charts, the stock has formed multiple bullish patterns like double bottom, flag pattern breakouts, and tweezer bottoms. Short, medium, and long-term moving averages also show the stock is trading above them, indicating bullish trends. Momentum indicators like MACD have given buy signals, which is considered a positive sign. Based on this technical analysis, further upside movement in the stock is expected. The analyst recommends buying the stock at the current price for targets above 1200.
Traders choice capf
- The stock CAPF is in a strong positive movement after a brief negative period and is rising again.
- It is trading above its short and long term moving averages, demonstrating strength across all timeframes.
- The RSI momentum oscillator found support at 58, an area that previously signaled reversals of corrections, and further movement of the stock to 590 is expected in the next few trading sessions based on the analysis.
Commodities call tracker 25th apr'16 to 29th apr'16
This document provides a weekly commodities call tracker from April 25th to April 29th, 2016. It discusses various commodities like gold, silver, base metals, and energy. The tracker is solely for informational purposes of Choice Broking clients and does not constitute investment advice. It also contains disclaimers that Choice Broking is not liable for any losses resulting from acting on the information provided. The recommendations are based on technical analysis to forecast market psychology, price patterns, and volume levels.
Techno Buy: NMDC
The document provides a technical analysis of NMDC stock. It summarizes that:
- On the weekly chart, the stock has found support at 92 levels, which is a sign of potential upside. It has bounced back from this support level in the past.
- On the daily chart, the stock has formed a "double bottom" pattern indicating a bullish reversal and potential upside from current levels.
- Momentum indicators like the RSI are showing positive divergence, further supporting upside potential for the stock.
- The analysis recommends buying NMDC at 99.50 with a stop loss of 93 and target of 115.
Asian Paint View on CNBC Awaaz
View on Asian Paints given by Mr. Sumeet Bagadia, our Associate Director - Choice Broking on CNBC Awaaz - 02.01.15.
Traders Choice - SRTRANSFIN
The document provides a recommendation to sell SRTRANSFIN futures in January at 780 with a stop loss of 796 and target of 750. It cites technical factors for this recommendation, including that the stock broke below a horizontal support line and formed a failed bullish pattern. Momentum indicators are also tilting downward. Given falling market intensity and the stock likely to follow broader indices, it is recommended to sell the futures contract with the expectation it will move further downward.
Techno Sell: Nickel
The document provides a technical analysis of nickel prices on the MCX exchange. It summarizes that:
1) Nickel prices on MCX broke down from a symmetrical triangle formation and are facing resistance at the 61.8% Fibonacci retracement level, indicating potential downside.
2) Prices are trading below the 60-day moving average and the RSI is below 40, supporting a bearish view.
3) LME nickel prices are in a falling channel formation and facing resistance, also pointing to downside risk.
4) Based on this technical analysis, nickel prices are expected to drift lower to around 570 levels over the next few trading sessions as long as 690 levels
Weeky call tracker 25th apr -29th apr 2016
This document provides a summary of equity call recommendations from April 25th to April 29th. It discusses technical analysis of market psychology, price patterns, and volume levels to forecast future price and market movements. The recommendations are intended for trading purposes only and are valid for the day of the report. Choice Broking obtained the information from sources believed to be reliable but not independently verified. Past performance is not a guarantee of future returns and there is risk of loss of entire investment. The analysts and firm have no interest in the stock or instrument recommendations.
Equities Weeky call tracker 23th may -27th may 16
This document provides an equities weekly call tracker from May 23, 2016 to May 27, 2016 published by Choice Broking. It includes recommendations on equities, commodities, currencies, and mutual funds for trading purposes. However, the recommendations are not intended as investment advice and Choice Broking is not liable for any losses incurred from following the recommendations. All analyses and opinions in the tracker are based on publicly available information and there may be risks involved including market volatility and lack of guaranteed returns.
Gujrat pipavav
Sumeet Bagadia, Associate Director of Choice Broking, discusses equities, commodities, currencies and mutual funds on CNBC Awaaz on January 2nd, 2015. The video link provided summarizes his views on these asset classes. The document also provides standard disclaimers that the views expressed are for informational purposes only and should not be considered investment advice, and that Choice Broking has not independently verified the information presented.
Traders Choice-POLARIS
This document provides a technical analysis of Polaris stock with the following key points:
1) Polaris stock has protected its lows and given a positive breakout, indicating momentum is increasing.
2) It has shown an ascending triangle breakout pattern signaling further upward movement.
3) Support has continued at the 21 day moving average.
4) The momentum oscillator RSI has broken out of its previous upper band adding to the positive outlook.
5) Rising volume accompanies the positive breakout.
Traders choice brfl
The document provides a technical analysis and recommendation to buy BRFL stock at Rs. 164 per share with a stop loss of Rs. 158 and target of Rs. 175 based on 3 points:
1) The stock has formed a base over the past week and is resuming its upward movement after a steep fall.
2) The stock has found support at previous horizontal support and resistance levels.
3) The stock is supported by its 100-day and 250-day moving averages, demonstrating a mid to long-term upward trend.
Based on this analysis, the recommendation is to expect the stock to reach Rs. 175 in the next few trading sessions.
Choice spark jamnaauto
The document provides a technical analysis of Jamna Auto Industries Limited stock. It summarizes that:
- The stock has broken above a horizontal trend line at 190, signaling upside movement. It has also crossed above moving averages, indicating positive momentum.
- The stock is trading above its 200-day moving average and has broken out of a 10-day range, suggesting strong positive movement from current levels.
- Technical indicators like RSI also show positive momentum. Based on this analysis, upside movement in the stock is expected. The report recommends buying the stock between 190-194, with a target of 215 and stop loss of 184.
Trades Choice - TORNTPOWER
- The document recommends buying TORNTPOWER stock based on a technical analysis. It cites an inverted head and shoulder pattern breakout on the higher time frame chart and consolidation on the daily chart as bullish signals.
- Volume activity has increased after the consolidation phase, and the RSI momentum oscillator has found support at a previous resistance level, indicating more upside potential for the stock.
- The target price given is Rs. 250, with support at Rs. 215 and the current price being Rs. 229.
What's hot (20)
Commodities call tracker 25th apr'16 to 29th apr'16
Commodities call tracker 25th apr'16 to 29th apr'16
Similar to Il&fs
Traders Choice: FIEMIND
This document provides a technical analysis of FIEMIND stock. It recommends buying the stock in cash at Rs. 717, with a stop loss of Rs. 695 and target of Rs. 760. The analysis indicates that the stock has formed a bottom around previous resistance levels and momentum is increasing based on rising RSI values cutting above average lines. Recent price action shows bulls returning as prices move above consolidation ranges.
Traders Choice - Alankit
1) The stock ALANKIT has seen a significant rise in price over the past couple of months, reaching an all-time high in the recent trading session by forming an ideal continuation pattern called a flag pattern.
2) The bulls have taken a pause over the past few trading sessions but have generated enough momentum to push the stock to a new high.
3) The enthusiasm of the bulls and a positive reversal in the RSI indicator suggest that further upside in the stock's price can be expected.
ChoiceBroking Techno Buy: HDFC LTD.
The document analyzes technical indicators for HDFC Ltd stock. It notes that earlier resistance had turned to support, and the stock found multiple support at a horizontal line. A bullish engulfing candle validated this support line. The stock has also crossed its 21-day moving average and momentum oscillator RSI shows increasing internal momentum. Based on this technical analysis, further upside for the stock is expected up to a resistance level of 1320. The document recommends buying HDFC Ltd at 1218-1205 with a stop loss of 1160 and target of 1320.
Traders choice dlf
The document recommends buying shares of DLF at 133 rupees per share, with a stop loss of 127 rupees and target price of 145 rupees. It notes that the real estate sector and DLF stock have shown positive developments, with the stock breaking out of a consolidation phase and trend line and trading above short and long term moving averages, indicating growing momentum. Given these factors, it expects the stock to rise further to 145 rupees in the coming trading sessions.
Traders Choice - BALRAMPUR CHINI
- The document recommends buying shares of Balrampur Chini at Rs. 90, with a short term target price of Rs. 96, based on a technical analysis of the stock chart.
- The sugar sector and Balrampur Chini stock have been in a long consolidation phase but have recently broken out of bullish patterns, signaling a resumption of the earlier upward trend.
- On the daily chart, Balrampur Chini stock price has broken above previous highs on rising volume, and technical indicators like RSI are in rising trajectories, providing further confirmation of the bullish outlook.
Traders Choice - MINDTREE
The document provides a technical analysis and recommendations for selling Mindtree stock in January futures. It summarizes:
1) Mindtree stock had formed a triple top pattern and shooting star candlestick pattern at resistance, indicating higher chances of a bearish reversal.
2) Volume had increased at the reversal point, which could signal distribution.
3) The RSI momentum oscillator was reverting from resistance and had broken below its average line, further indicating a potential downtrend.
4) Based on the technical patterns and indicators, the analyst recommends selling Mindtree in January futures with a stop loss of 1520 and target of 1430.
Traders choice ntpc
The document provides a technical analysis and recommendation to buy NTPC stock at 137 with a stop loss of 134 and target of 143. It notes that NTPC has formed a bullish candlestick pattern and taken support at its 100-day and 250-day moving averages, indicating a potential reversal and further upward movement. The analysis recommends expecting NTPC's price to move up to 143 based on these technical indicators.
Traders choice bharatforge
The document recommends buying shares of Bharat Forge at Rs. 953.25, with a stop loss of Rs. 928 and target price of Rs. 1020. It notes that the stock has formed a strong base on higher time frames, indicating an end to its short-term correction. The stock has broken out of its mild corrective phase at current levels and is resuming its previous upward trend. The stock continues to find support at its 21-day moving average, signaling positivity in the near term. Positive Directional Indicator is also nearing dominance, suggesting further upward movement to Rs. 1020.
Weeky call tracker 25th apr -29th apr 2016
This document provides a summary of equity call recommendations from April 25th to April 29th. It discusses technical analysis of market psychology, price patterns, and volume levels to forecast future price and market movements. The recommendations are intended for trading purposes only and are valid for the day of the report. Choice Broking obtained the information from sources believed to be reliable but not independently verified. Past performance is not a guarantee of future returns and there is risk of loss of entire investment. The analysts and firm have no interest in the stock or instrument recommendations.
Traders Choice
This document provides a technical analysis of ZEEL stock and recommends selling it short in January futures. It notes that ZEEL formed a double top pattern and dark cloud cover, both negative indicators. The stock is also breaking below its 21-day moving average and momentum oscillator RSI is reversing from an overbought range. Given these technical factors and market conditions, further downside is expected. The recommendation is to short sell ZEEL futures at 417.75 with a stop loss of 423.2 and target of 406.5.
Traders Choice - CYIENT
- The document recommends buying Cyient stock at Rs. 435 with a stop loss of Rs. 420 and target of Rs. 465 on January 21st, 2016.
- Technical indicators like momentum oscillator RSI and volume are showing the stock is rebounding from an oversold position and momentum is building.
- On intraday timeframes, there is positive divergence on the daily chart indicating further upward momentum. Price is sustaining above the 21 hour moving average with above average volume, signaling an upward move in the near term.
Traders choice kei
The document recommends buying KEI in cash at 115 price with a stop loss of 109 and target of 126 based on a technical analysis. It notes that the stock has resumed its upward move after a brief pause, breached its consolidation phase, and taken support at multiple moving averages. The rise in price and volume indicates incremental strength, and the analysis expects further momentum in the stock price to reach 126 in the next few trading sessions.
Traders choice suryalaxmi
The document recommends buying shares of SURYALAXMI at 152 with a target price of 172 within the next few trading sessions. It notes that the textile sector has been rising, SURYALAXMI has been moving higher the past two sessions and rising above short and long term moving averages. Volume has also been picking up the past couple days. The analysis indicates the stock could reach 172 based on these positive technical indicators.
Traders choice eveready
The document provides a technical analysis and recommendation for the stock EVEREADY. It summarizes that:
1) The stock has formed a rounding bottom pattern indicating steady accumulation at lower levels.
2) The stock has breached previous resistance areas, showing that demand has absorbed supply pressure.
3) The stock is trading above short and long-term moving averages, demonstrating positive momentum.
4) Based on this technical analysis, the stock is expected to reach Rs. 272 in the next few trading sessions.
Traders choice fsl
This document recommends buying FSL stock at Rs. 45.65 per share, with a stop loss of Rs. 42 and target of Rs. 52. It analyzes technical indicators that signal the stock is in an upward trend, including forming a positive Cup & Handle pattern, breaching previous reversal areas with high volume, and a sustained RSI above average. Given these factors, it expects the stock to rise to Rs. 52 in the next few trading sessions.
Traders choice pnb
The document provides a technical analysis and recommendation for selling PNB Futures at 79.75 with a stop loss of 82 and target of 75. It notes that the stock has breached below support levels, is sustaining below moving averages, and momentum oscillators suggest further downside. Based on these technical indicators, the analysis recommends expecting further downside in the stock price to 75.
Traders Choice: ORIENTCEM
This document provides a technical analysis of ORIENTCEM stock and recommends a buy. It observes that the stock protected its initial low and resumed upward movement in the second half of trading, forming a Morning Star pattern at support. The momentum oscillator RSI has crossed above its average line with positive divergence, indicating further upside potential. Based on this analysis, additional gains are expected. The target price provided is Rs. 162 with a stop loss of Rs. 144.
Traders choice reliance
This document provides a technical analysis and recommendation to buy Reliance shares at Rs. 993.8 per share. The analysis notes that the stock has taken support at its 250-day moving average, breached prior support lines and consolidation areas, and shows rising momentum on indicators like RSI. A breakout of an inverted head and shoulder pattern on intraday charts further supports the bullish outlook. Based on these technical factors, the document recommends buying Reliance with a stop loss of Rs. 970 and target price of Rs. 1040, expecting further momentum in the stock price over the next few trading sessions.
Traders choice ioc
The document recommends buying shares of IOC with a target price of Rs. 515 and a stop loss of Rs. 475 based on technical analysis. It notes that IOC and other oil marketing companies have been moving strongly upwards in tandem. IOC has broken out of a consolidation phase indicating the previous upward trend will continue. Volume is also expanding at the breakout level, suggesting a genuine upward move that could take the price to Rs. 515.
Similar to Il&fs (19)
Recently uploaded
Tax System, Behaviour, Justice, and Voluntary Compliance Culture in Nigeria -...
Tax System, Behaviour, Justice, and Voluntary Compliance Culture in Nigeria -...Godwin Emmanuel Oyedokun MBA MSc PhD FCA FCTI FCNA CFE FFAR
Lecture slide titled Tax System, Behaviour, Justice, and Voluntary Compliance Culture in Nigeria - Prof Oyedokun.pptx1. Elemental Economics - Introduction to mining.pdf
After this first you should: Understand the nature of mining; have an awareness of the industry’s boundaries, corporate structure and size; appreciation the complex motivations and objectives of the industries’ various participants; know how mineral reserves are defined and estimated, and how they evolve over time.
falcon-invoice-discounting-a-strategic-approach-to-optimize-investments
Falcon stands out as a top-tier P2P Invoice Discounting platform in India, bridging esteemed blue-chip companies and eager investors. Our goal is to transform the investment landscape in India by establishing a comprehensive destination for borrowers and investors with diverse profiles and needs, all while minimizing risk. What sets Falcon apart is the elimination of intermediaries such as commercial banks and depository institutions, allowing investors to enjoy higher yields.
一比一原版(UoB毕业证)伯明翰大学毕业证如何办理
UoB本科学位证成绩单【微信95270640】伯明翰大学没毕业>办理伯明翰大学毕业证成绩单【微信UoB】UoB毕业证成绩单UoB学历证书UoB文凭《UoB毕业套号文凭网认证伯明翰大学毕业证成绩单》《哪里买伯明翰大学毕业证文凭UoB成绩学校快递邮寄信封》《开版伯明翰大学文凭》UoB留信认证本科硕士学历认证
如果您是以下情况,我们都能竭诚为您解决实际问题:【公司采用定金+余款的付款流程,以最大化保障您的利益,让您放心无忧】
1、在校期间,因各种原因未能顺利毕业,拿不到官方毕业证+微信95270640
2、面对父母的压力,希望尽快拿到伯明翰大学伯明翰大学硕士毕业证成绩单;
3、不清楚流程以及材料该如何准备伯明翰大学伯明翰大学硕士毕业证成绩单;
4、回国时间很长,忘记办理;
5、回国马上就要找工作,办给用人单位看;
6、企事业单位必须要求办理的;
面向美国乔治城大学毕业留学生提供以下服务:
【★伯明翰大学伯明翰大学硕士毕业证成绩单毕业证、成绩单等全套材料,从防伪到印刷,从水印到钢印烫金,与学校100%相同】
【★真实使馆认证(留学人员回国证明),使馆存档可通过大使馆查询确认】
【★真实教育部认证,教育部存档,教育部留服网站可查】
【★真实留信认证,留信网入库存档,可查伯明翰大学伯明翰大学硕士毕业证成绩单】
我们从事工作十余年的有着丰富经验的业务顾问,熟悉海外各国大学的学制及教育体系,并且以挂科生解决毕业材料不全问题为基础,为客户量身定制1对1方案,未能毕业的回国留学生成功搭建回国顺利发展所需的桥梁。我们一直努力以高品质的教育为起点,以诚信、专业、高效、创新作为一切的行动宗旨,始终把“诚信为主、质量为本、客户第一”作为我们全部工作的出发点和归宿点。同时为海内外留学生提供大学毕业证购买、补办成绩单及各类分数修改等服务;归国认证方面,提供《留信网入库》申请、《国外学历学位认证》申请以及真实学籍办理等服务,帮助众多莘莘学子实现了一个又一个梦想。
专业服务,请勿犹豫联系我
如果您真实毕业回国,对于学历认证无从下手,请联系我,我们免费帮您递交
诚招代理:本公司诚聘当地代理人员,如果你有业余时间,或者你有同学朋友需要,有兴趣就请联系我
你赢我赢,共创双赢
你做代理,可以帮助伯明翰大学同学朋友
你做代理,可以拯救伯明翰大学失足青年
你做代理,可以挽救伯明翰大学一个个人才
你做代理,你将是别人人生伯明翰大学的转折点
你做代理,可以改变自己,改变他人,给他人和自己一个机会大块就啃啃得满嘴满脸猴屁股般的红艳大家一个劲地指着对方吃吃地笑瓜裂得古怪奇形怪状却丝毫不影响瓜味甜丝丝的满嘴生津遍地都是瓜横七竖八的活像掷满了一地的大石块摘走二三只爷爷是断然发现不了的即便发现爷爷也不恼反而教山娃辨认孰熟孰嫩孰甜孰淡名义上是护瓜往往在瓜棚里坐上一刻饱吃一顿后山娃就领着阿黑漫山遍野地跑阿黑是一条黑色的大猎狗挺机灵的是山娃多年的忠实伙伴平时山娃上学阿黑也摇头晃脑地跟去暑假用不着上学阿钩
Abhay Bhutada Leads Poonawalla Fincorp To Record Low NPA And Unprecedented Gr...
Under the leadership of Abhay Bhutada, Poonawalla Fincorp has achieved record-low Non-Performing Assets (NPA) and witnessed unprecedented growth. Bhutada's strategic vision and effective management have significantly enhanced the company's financial health, showcasing a robust performance in the financial sector. This achievement underscores the company's resilience and ability to thrive in a competitive market, setting a new benchmark for operational excellence in the industry.
An Overview of the Prosocial dHEDGE Vault works
How the prosocial dHEDGE earns you money while saving the world!
Role of Information Technology in Revenue - Prof Oyedokun.pptx
Role of Information Technology in Revenue - Prof Oyedokun.pptxGodwin Emmanuel Oyedokun MBA MSc PhD FCA FCTI FCNA CFE FFAR
Lecture slide on the Role of Information Technology in Revenue Generation and Collection
How Non-Banking Financial Companies Empower Startups With Venture Debt Financing
How Non-Banking Financial Companies Empower Startups With Venture Debt Financing
Bridging the gap: Online job postings, survey data and the assessment of job ...
Bridging the gap: Online job postings, survey data and the assessment of job ...Labour Market Information Council | Conseil de l’information sur le marché du travail
OJP data from firms like Vicinity Jobs have emerged as a complement to traditional sources of labour demand data, such as the Job Vacancy and Wages Survey (JVWS). Ibrahim Abuallail, PhD Candidate, University of Ottawa, presented research relating to bias in OJPs and a proposed approach to effectively adjust OJP data to complement existing official data (such as from the JVWS) and improve the measurement of labour demand.Earn a passive income with prosocial investing
Invest in prosocial funds that earn you an income while improving the world
Independent Study - College of Wooster Research (2023-2024) FDI, Culture, Glo...
Independent Study - College of Wooster Research (2023-2024) FDI, Culture, Glo...AntoniaOwensDetwiler
"Does Foreign Direct Investment Negatively Affect Preservation of Culture in the Global South? Case Studies in Thailand and Cambodia."
Do elements of globalization, such as Foreign Direct Investment (FDI), negatively affect the ability of countries in the Global South to preserve their culture? This research aims to answer this question by employing a cross-sectional comparative case study analysis utilizing methods of difference. Thailand and Cambodia are compared as they are in the same region and have a similar culture. The metric of difference between Thailand and Cambodia is their ability to preserve their culture. This ability is operationalized by their respective attitudes towards FDI; Thailand imposes stringent regulations and limitations on FDI while Cambodia does not hesitate to accept most FDI and imposes fewer limitations. The evidence from this study suggests that FDI from globally influential countries with high gross domestic products (GDPs) (e.g. China, U.S.) challenges the ability of countries with lower GDPs (e.g. Cambodia) to protect their culture. Furthermore, the ability, or lack thereof, of the receiving countries to protect their culture is amplified by the existence and implementation of restrictive FDI policies imposed by their governments.
My study abroad in Bali, Indonesia, inspired this research topic as I noticed how globalization is changing the culture of its people. I learned their language and way of life which helped me understand the beauty and importance of cultural preservation. I believe we could all benefit from learning new perspectives as they could help us ideate solutions to contemporary issues and empathize with others.Independent Study - College of Wooster Research (2023-2024)
"Does Foreign Direct Investment Negatively Affect Preservation of Culture in the Global South? Case Studies in Thailand and Cambodia."
Do elements of globalization, such as Foreign Direct Investment (FDI), negatively affect the ability of countries in the Global South to preserve their culture? This research aims to answer this question by employing a cross-sectional comparative case study analysis utilizing methods of difference. Thailand and Cambodia are compared as they are in the same region and have a similar culture. The metric of difference between Thailand and Cambodia is their ability to preserve their culture. This ability is operationalized by their respective attitudes towards FDI; Thailand imposes stringent regulations and limitations on FDI while Cambodia does not hesitate to accept most FDI and imposes fewer limitations. The evidence from this study suggests that FDI from globally influential countries with high gross domestic products (GDPs) (e.g. China, U.S.) challenges the ability of countries with lower GDPs (e.g. Cambodia) to protect their culture. Furthermore, the ability, or lack thereof, of the receiving countries to protect their culture is amplified by the existence and implementation of restrictive FDI policies imposed by their governments.
My study abroad in Bali, Indonesia, inspired this research topic as I noticed how globalization is changing the culture of its people. I learned their language and way of life which helped me understand the beauty and importance of cultural preservation. I believe we could all benefit from learning new perspectives as they could help us ideate solutions to contemporary issues and empathize with others.
Who Is the Largest Producer of Soybean in India Now.pdf
This blog explores the current largest producer of soybean in India and the factors contributing to their dominance.
Pensions and housing - Pensions PlayPen - 4 June 2024 v3 (1).pdf
Wayhome's analysis of the UK market and how pension schemes can help solve the problems it presents younger people
5 Tips for Creating Standard Financial Reports
Well-crafted financial reports serve as vital tools for decision-making and transparency within an organization. By following the undermentioned tips, you can create standardized financial reports that effectively communicate your company's financial health and performance to stakeholders.
SWAIAP Fraud Risk Mitigation Prof Oyedokun.pptx
SWAIAP Fraud Risk Mitigation Prof Oyedokun.pptxGodwin Emmanuel Oyedokun MBA MSc PhD FCA FCTI FCNA CFE FFAR
Lecture slide titled Fraud Risk Mitigation, Webinar Lecture Delivered at the Society for West African Internal Audit Practitioners (SWAIAP) on Wednesday, November 8, 2023.
BONKMILLON Unleashes Its Bonkers Potential on Solana.pdf
Introducing BONKMILLON - The Most Bonkers Meme Coin Yet
Let's be real for a second – the world of meme coins can feel like a bit of a circus at times. Every other day, there's a new token promising to take you "to the moon" or offering some groundbreaking utility that'll change the game forever. But how many of them actually deliver on that hype?
Recently uploaded (20)
Tax System, Behaviour, Justice, and Voluntary Compliance Culture in Nigeria -...
Tax System, Behaviour, Justice, and Voluntary Compliance Culture in Nigeria -...
1. Elemental Economics - Introduction to mining.pdf
1. Elemental Economics - Introduction to mining.pdf
falcon-invoice-discounting-a-strategic-approach-to-optimize-investments
falcon-invoice-discounting-a-strategic-approach-to-optimize-investments
Abhay Bhutada Leads Poonawalla Fincorp To Record Low NPA And Unprecedented Gr...
Abhay Bhutada Leads Poonawalla Fincorp To Record Low NPA And Unprecedented Gr...
Role of Information Technology in Revenue - Prof Oyedokun.pptx
Role of Information Technology in Revenue - Prof Oyedokun.pptx
How Non-Banking Financial Companies Empower Startups With Venture Debt Financing
How Non-Banking Financial Companies Empower Startups With Venture Debt Financing
Bridging the gap: Online job postings, survey data and the assessment of job ...
Bridging the gap: Online job postings, survey data and the assessment of job ...
Independent Study - College of Wooster Research (2023-2024) FDI, Culture, Glo...
Independent Study - College of Wooster Research (2023-2024) FDI, Culture, Glo...
Independent Study - College of Wooster Research (2023-2024)
Independent Study - College of Wooster Research (2023-2024)
Who Is the Largest Producer of Soybean in India Now.pdf
Who Is the Largest Producer of Soybean in India Now.pdf
Pensions and housing - Pensions PlayPen - 4 June 2024 v3 (1).pdf
Pensions and housing - Pensions PlayPen - 4 June 2024 v3 (1).pdf
BONKMILLON Unleashes Its Bonkers Potential on Solana.pdf
BONKMILLON Unleashes Its Bonkers Potential on Solana.pdf
Il&fs
- 1. 12th Feb 2015 IL&FS Rs.90 Target Achieved Sumeet BagadiaSumeet BagadiaSumeet Bagadia Associate Director Choice Broking on Sumeet Bagadia Associate Director Choice Broking onon CNBC Awaaz – 12.02.15 on CNBC Awaaz – 12.02.15 To view, please click on the link given below: h // b / h? P PfQ 82MM Equities I Commodities I Currencies I Mutual FundsEquities I Commodities I Currencies I Mutual Funds https://www.youtube.com/watch?v=PotPfQc82MM
- 2. Follow Our Trends At 31st December 2014 www.choiceindia.comcustomercare@choiceindia.com This is solely for information of clients of Choice Broking and does not construe to be an investment advice. It is also not intended as an offer or solicitation for the purchase and sale of any financial instruments. Any action taken by you on the basis of the information contained herein is your responsibility alone and Choice Broking its subsidiaries or its employees or associates will not be liable in any manner for the consequences of such action taken by you. We have exercised due diligence in checking the correctness and authenticity of the information contained in this recommendation, but Choice Broking or any of its subsidiaries or associates or employees shall t b i ibl f l d th t i t f i d t t i th i f ti t i d i thi d ti ti t k b i f thi i f ti T h i l Disclaimer not be in any way responsible for any loss or damage that may arise to any person from any inadvertent error in the information contained in this recommendation or any action taken on basis of this information. Technical analysis studies market psychology, price patterns and volume levels. It is used to forecast future price and market movements. Technical analysis is complementary to fundamental analysis and news sources. The recommendations issued herewith might be contrary to recommendations issued by Choice Broking in the company research undertaken as the recommendations stated in this report is derived purely from technical analysis. Choice Broking has based this document on information obtained from sources it believes to be reliable but which it has not independently verified; Choice Broking makes no guarantee, representation or warranty and accepts no responsibility or liability as to its accuracy or completeness. The opinions contained within the report are based upon publicly available information at the time of publication and are subject to change without notice. The information and any disclosures provided herein are in summary form and have been prepared for informational purposes. The recommendations and suggested price levels are intended purely for trading purposes. The recommendations are valid for the day of the report however trading trends and volumes might vary substantially on an intraday basis and the recommendations may be subject to change. The information and any disclosures provided herein may be considered confidential. Any use, distribution, modification, copying, forwarding or disclosure by any person is strictly prohibited. The information and any disclosures provided herein do not constitute a solicitation or offer to p rchase or sell an sec rit or other financial prod ct or instr ment The c rrent performance ma be na dited Past performance does not g arantee f t re ret rns There can be no ass rance that Equities I Commodities I Currencies I Mutual Funds solicitation or offer to purchase or sell any security or other financial product or instrument. The current performance may be unaudited. Past performance does not guarantee future returns. There can be no assurance that investments will achieve any targeted rates of return, and there is no guarantee against the loss of your entire investment. POTENTIAL CONFLICT OF INTEREST DISCLOSURE (as on date of report) Disclosure of interest statement – • Analyst interest of the stock /Instrument(s): - No. • Firm interest of the stock / Instrument (s): - No.