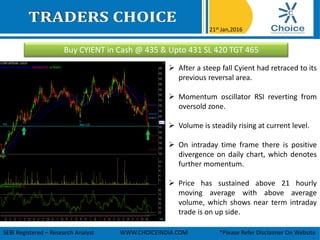
- The document recommends buying Cyient stock at Rs. 435 with a stop loss of Rs. 420 and target of Rs. 465 on January 21st, 2016.
- Technical indicators like momentum oscillator RSI and volume are showing the stock is rebounding from an oversold position and momentum is building.
- On intraday timeframes, there is positive divergence on the daily chart indicating further upward momentum. Price is sustaining above the 21 hour moving average with above average volume, signaling an upward move in the near term.
1. Buy CYIENT in Cash @ 435 & Upto 431 SL 420 TGT 465
21st Jan,2016
SEBI Registered – Research Analyst WWW.CHOICEINDIA.COM *Please Refer Disclaimer On Website
After a steep fall Cyient had retraced to its
previous reversal area.
Momentum oscillator RSI reverting from
oversold zone.
Volume is steadily rising at current level.
On intraday time frame there is positive
divergence on daily chart, which denotes
further momentum.
Price has sustained above 21 hourly
moving average with above average
volume, which shows near term intraday
trade is on up side.
2. www.choiceindia.comcustomercare@choiceindia.com
Research Team
Mr. Sumeet Bagadia Associate Director
Kunal Parmar Research Associate
Amit Pathania Research Associate
Vikas Chaudhari Research Associate
Kapil Shah Research Associate
Rajnath Yadav Research Associate
Satish Kumar Research Associate
Disclaimer
This is solely for information of clients of Choice Broking and does not construe to be an investment advice. It is also not intended as an offer or solicitation for the purchase and sale of any
financial instruments. Any action taken by you on the basis of the information contained herein is your responsibility alone and Choice Broking its subsidiaries or its employees or associates will
not be liable in any manner for the consequences of such action taken by you. We have exercised due diligence in checking the correctness and authenticity of the information contained in this
recommendation, but Choice Broking or any of its subsidiaries or associates or employees shall not be in any way responsible for any loss or damage that may arise to any person from any
inadvertent error in the information contained in this recommendation or any action taken on basis of this information. Technical analysis studies market psychology, price patterns and volume
levels. It is used to forecast future price and market movements. Technical analysis is complementary to fundamental analysis and news sources. The recommendations issued herewith might
be contrary to recommendations issued by Choice Broking in the company research undertaken as the recommendations stated in this report is derived purely from technical analysis. Choice
Broking has based this document on information obtained from sources it believes to be reliable but which it has not independently verified; Choice Broking makes no guarantee, representation
or warranty and accepts no responsibility or liability as to its accuracy or completeness. The opinions contained within the report are based upon publicly available information at the time of
publication and are subject to change without notice. The information and any disclosures provided herein are in summary form and have been prepared for informational purposes. The
recommendations and suggested price levels are intended purely for trading purposes. The recommendations are valid for the day of the report however trading trends and volumes might vary
substantially on an intraday basis and the recommendations may be subject to change. The information and any disclosures provided herein may be considered confidential. Any use,
distribution, modification, copying, forwarding or disclosure by any person is strictly prohibited. The information and any disclosures provided herein do not constitute a solicitation or offer to
purchase or sell any security or other financial product or instrument. The current performance may be unaudited. Past performance does not guarantee future returns. There can be no
assurance that investments will achieve any targeted rates of return, and there is no guarantee against the loss of your entire investment.
POTENTIAL CONFLICT OF INTEREST DISCLOSURE (as on date of report) Disclosure of interest statement – • Analyst interest of the stock /Instrument(s): - No. • Firm interest of the stock /
Instrument (s): - No.