ChoiceBroking Techno Buy: HDFC LTD.
•
0 likes•24 views

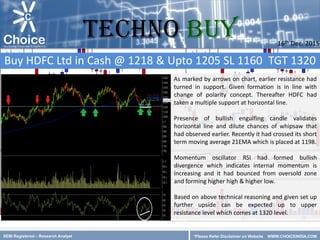
The document analyzes technical indicators for HDFC Ltd stock. It notes that earlier resistance had turned to support, and the stock found multiple support at a horizontal line. A bullish engulfing candle validated this support line. The stock has also crossed its 21-day moving average and momentum oscillator RSI shows increasing internal momentum. Based on this technical analysis, further upside for the stock is expected up to a resistance level of 1320. The document recommends buying HDFC Ltd at 1218-1205 with a stop loss of 1160 and target of 1320.
Report
Share
Report
Share
Download to read offline

Recommended
Traders Choice: FIEMIND
This document provides a technical analysis of FIEMIND stock. It recommends buying the stock in cash at Rs. 717, with a stop loss of Rs. 695 and target of Rs. 760. The analysis indicates that the stock has formed a bottom around previous resistance levels and momentum is increasing based on rising RSI values cutting above average lines. Recent price action shows bulls returning as prices move above consolidation ranges.
Techno Buy : UPL
The document summarizes a technical analysis of UPL stock. It states that the stock has broken out of a symmetrical triangle pattern and engulfing bullish pattern, indicating upside potential. Momentum indicators also show a positive signal. Based on the technical analysis, it recommends buying UPL at 555 or up to 540 with a stop loss of 515 and target of 650.
Techno sell zinc 01.10.15
The technical analysis of the zinc market suggests prices will likely drift lower. Prices have found resistance near the middle Bollinger band, formed a bearish candlestick near the 50% retracement level, and the super trend and RSI indicators show a downward trend and lack of momentum. On an hourly timeframe, the RSI has formed a negative reversal. Based on this technical setup, prices are expected to fall toward 103.8 as long as they remain below resistance at 114.8. The analyst recommends selling zinc at 110.35 with a stop-loss of 114.8 and target price of 103.8.
Traders Choice- GICHSGFIN
This document provides a technical analysis of GICHSGFIN stock. It recommends buying the stock at Rs. 210 with a stop loss of Rs. 199 and target of Rs. 232. The analysis notes that the stock found support for the fifth time at a certain level and formed a base. It also reversed from support as seen by a positive candlestick pattern. The momentum oscillator RSI also reversed from support and crossed above its average line, indicating an upward momentum. On longer time frames, the stock is forming a bullish hammer candlestick pattern.
Treaders Choice
- The document provides a technical analysis of Hitech Plast stock, recommending a buy at 190.50 with a stop loss of 183 and target of 208.
- It notes that despite market turbulence, Hitech Plast is resuming its positive trend, breaching its previous high and intermediate downward trendline while taking support at its 21-day moving average.
- Momentum oscillator RSI has retraced to its previous reversal point after correcting from an overbought zone.
Techno Sell - Aluminium
The document provides a technical analysis recommendation to sell Aluminium. It summarizes that prices have broken a "Rising Wedge" formation and momentum indicators show negative divergence, confirming lower prices. Prices have also failed to move above a previous high, signaling a "Dow Theory" sell. The analysis expects prices to move lower to 105.20 in the next few trading sessions as long as 108.6 is not surpassed. It recommends selling Aluminium at 107.5 with a stop loss of 108.6 and target of 105.20.
Techno buy srt
The document provides a technical analysis and recommendation for the stock SRTRANSFIN. It summarizes that:
1) The stock has remained in a structural bull trend, forming higher highs and higher lows on the long term chart.
2) At a recent intermediate correction, the stock found support at a previous resistance level. Momentum indicators like RSI have formed positive patterns.
3) Based on the technical factors, the stock is expected to rise further to the 1070 level in the next few trading sessions.
Traders choice dlf
The document recommends buying shares of DLF at 133 rupees per share, with a stop loss of 127 rupees and target price of 145 rupees. It notes that the real estate sector and DLF stock have shown positive developments, with the stock breaking out of a consolidation phase and trend line and trading above short and long term moving averages, indicating growing momentum. Given these factors, it expects the stock to rise further to 145 rupees in the coming trading sessions.
Techno Buy (DHFL)
The document provides a technical analysis and recommendation for the stock DHFL. It summarizes that:
1) DHFL has broken out of a reversal pattern on high volume, indicating upside potential in the coming sessions.
2) The stock has formed a large bullish candle on the weekly chart with good volume.
3) During a recent correction, DHFL saw low volume, suggesting potential upside from current levels.
4) Momentum indicators are positive, with the RSI above 60 and a positive crossover, supporting further gains.
5) The recommendation is to buy DHFL at 443-435 with a stop loss of 420 and target of 485.
Traders choice thomascook
Thomas Cook stock is expected to rise further based on technical analysis. The stock terminated its correction at the 38.2% retracement level and has since risen, breaking above a downward trendline. It has consolidated gains in a tight range recently. Its latest upward move indicates bulls have returned and the price may rise further to Rs. 235 over the next few trading sessions.
Traders choice kwality
The document provides a technical analysis of the stock KWALITY. It recommends buying the stock at 127.6, with a stop loss of 122 and target price of 138. The analysis notes that the stock has shown strength by retracing losses quickly and breaking above a downward trend line. Upside movement has also seen rising volume, indicating growing appetite for the stock. Based on this technical analysis, the document expects the stock to reach 138 in the next few trading sessions.
Traders choice infibeam
This document recommends buying shares of INFIBEAM at Rs. 700 per share. It analyzes technical indicators like moving averages and chart patterns. It observes that the stock has been trending positively, taking support at its 21-day moving average. The stock has formed an ascending triangle pattern and given a positive breakout. Based on this technical analysis, the document forecasts that the stock price will rise to Rs. 740 in the next few trading sessions.
Traders choice mahindcie
The document provides a technical analysis of MAHINDCIE stock and recommends it as a buy. It notes that the stock price has found support at horizontal price levels and reversed trend. Momentum indicators like the 21-day moving average and RSI also indicate a positive trend. Based on these technical factors, the analysis forecasts the stock price to rise to 218 levels in the coming trading sessions.
Traders choice adaniport
The document provides a technical analysis of ADANIPORT stock and recommends a buy. It summarizes:
1) The stock has formed a double bottom pattern on the daily chart, indicating a bullish reversal.
2) The stock has moved above a consolidation phase, signaling the resumption of an upward trend.
3) Technical indicators like the 21-day and 100-day moving averages also provide positive signals.
4) Based on the analysis, the stock price is expected to rise to Rs. 230 in the coming trading sessions.
Traders choice pnb
The document provides a technical analysis and recommendation for selling PNB Futures at 79.75 with a stop loss of 82 and target of 75. It notes that the stock has breached below support levels, is sustaining below moving averages, and momentum oscillators suggest further downside. Based on these technical indicators, the analysis recommends expecting further downside in the stock price to 75.
Traders Choice
Lambodhara, a textile company, has been consolidating after a steep fall, with rising volume indicating accumulation. It has formed a bullish pattern and protected earlier lows, signaling a potential change. Momentum indicators like RSI show positive reversal and have breached averages, while an intraday range breakout has occurred. The recommendation is to buy Lambodhara at 215 with a stop loss of 213 and target of 230.
Traders choice adaniport
The document provides a technical analysis and recommendation to sell ADANIPORT futures at 259.7, with a stop loss of 264 and target of 247. The analysis notes that the stock has faced resistance at a horizontal line, formed a pattern of lower highs and lower lows indicating a negative short-term trend, and has breached its intraday consolidation band on the lower side. The RSI momentum oscillator has also breached its lower band. Based on this technical analysis, a mild decline in the stock price can be expected.
Traders Choice - SCHNEIDER
This document provides a technical analysis of SCHNEIDER stock and recommends buying it at 176 with a stop loss of 169 and target of 190. It notes that the stock has broken out to higher levels, risen above its 250-day moving average resistance, and seen an escalation in bullish volume in the consolidation area. Additionally, the RSI momentum oscillator has risen above its consolidated range and previous reversal point, suggesting fresh upward momentum in the coming days if the stock sustains above current levels.
Traders choice equitas
The document recommends buying EQUITAS stock at 149.50 with a stop loss of 144 and target of 159 based on a technical analysis. It notes that the stock has formed a double bottom pattern indicating a bullish reversal. Momentum indicators like RSI show a positive signal, and the stock is expected to move above its 21 day moving average. Based on these factors, further upside movement of the stock to 159 is expected.
Traders Choice: ORIENTCEM
This document provides a technical analysis of ORIENTCEM stock and recommends a buy. It observes that the stock protected its initial low and resumed upward movement in the second half of trading, forming a Morning Star pattern at support. The momentum oscillator RSI has crossed above its average line with positive divergence, indicating further upside potential. Based on this analysis, additional gains are expected. The target price provided is Rs. 162 with a stop loss of Rs. 144.
Techno Buy: NMDC
The document provides a technical analysis of NMDC stock. It summarizes that:
- On the weekly chart, the stock has found support at 92 levels, which is a sign of potential upside. It has bounced back from this support level in the past.
- On the daily chart, the stock has formed a "double bottom" pattern indicating a bullish reversal and potential upside from current levels.
- Momentum indicators like the RSI are showing positive divergence, further supporting upside potential for the stock.
- The analysis recommends buying NMDC at 99.50 with a stop loss of 93 and target of 115.
Traders choice canfinhome
This document provides a technical analysis of CANFINHOME stock with the following key points:
1) The stock has shown strength despite market turbulence by maintaining its price above support levels.
2) The stock is in a positive trend forming higher highs and higher lows on the chart.
3) It has emerged from a brief consolidation phase and found support at the 21 day moving average.
4) The RSI momentum indicator has risen above its average line, indicating further upward momentum.
5) Based on this analysis, the stock is expected to reach a target price of 1315 in the next few trading sessions.
Techno sell lead 25.09.15
The document provides a technical analysis of TECHNO stock. It summarizes that the stock price has been in a downtrend for months and has been trading in a symmetrical triangle pattern for the past couple of months. The stock price is also trading below its 75-day exponential moving average and MACD has given a negative signal by moving below zero and crossing the signal line lower. Based on this technical setup, the document expects the stock price to break down from the symmetrical triangle pattern towards lower levels, testing 105 in the next few trading sessions, as long as it remains below the 116 resistance level. It recommends selling TECHNO at 112 with a stop loss of 116 and a target price of 105.
Trades Choice - TORNTPOWER
- The document recommends buying TORNTPOWER stock based on a technical analysis. It cites an inverted head and shoulder pattern breakout on the higher time frame chart and consolidation on the daily chart as bullish signals.
- Volume activity has increased after the consolidation phase, and the RSI momentum oscillator has found support at a previous resistance level, indicating more upside potential for the stock.
- The target price given is Rs. 250, with support at Rs. 215 and the current price being Rs. 229.
Techno Buy : HCLTECH
The stock has been in an ascending triangle pattern recently, taking support at the lower arm of the triangle. This has led to an upside bounce with heavy volume, indicating upward momentum. The stock has also broken out of a six-day consolidation pattern with above average volume. Additionally, it is finding support at the 100-day EMA at 931 levels, suggesting an uptrend in the near-term. Momentum indicators like the RSI are showing positive signals as well. The analyst recommends buying the stock at 960 and up to 948, with a stop loss of 925 and target of 1050.
Techno Sell: INFY
The document provides a technical analysis and recommendation for INFY stock. It summarizes:
1) The daily chart shows a "Shooting Star" candlestick pattern indicating downside movement, and resistance at 1126 Fibonacci level suggests the stock may fall to 1060.
2) On the weekly chart, the stock faces strong resistance from a downward trendline at 1140 level.
3) The RSI momentum indicator shows choppy movement in the last 3 weeks with resistance at 60, which could point to negative momentum hitting the stock in the next few sessions.
4) The recommendation is to sell INFY at 1110-1122 with a stop loss of 1150 and target of 100
Traders choice vipul ltd
This document provides a technical analysis and recommendation for VIPUL LTD stock. It summarizes that:
1) The stock has shown positive momentum and doubled from its lows, indicating an ongoing uptrend.
2) An intermediate correction ended at the 50% retracement level, an important support point.
3) The stock has formed a base at this support level and taken support from its 21 day moving average, indicating further upward movement.
4) Based on this analysis, the stock price is expected to reach 98 levels in the next few trading sessions.
Techno buy beml
The document provides a technical analysis of BEML stock. It summarizes that the stock has formed a bullish reversal pattern on the weekly chart and closed above its 21-day moving average on the daily chart, indicating an upward trend. The stock has also broken out of its consolidation with high volume, signaling robust upside potential in the coming sessions. Technical indicators like RSI are also signaling a positive trend. Based on this technical structure, the document recommends buying BEML with a target price of 1018 and stop loss of 900.
사설토토 \\\too93.com///사설토토 사설토토
사설토토 \\\too93.com///사설토토 사설토토
사설토토 \\\too93.com///사설토토 사설토토
사설토토 \\\too93.com///사설토토 사설토토
사설토토 \\\too93.com///사설토토 사설토토
사설토토 \\\too93.com///사설토토 사설토토
사설토토 \\\too93.com///사설토토 사설토토
사설토토 \\\too93.com///사설토토 사설토토
사설토토 \\\too93.com///사설토토 사설토토
사설토토 \\\too93.com///사설토토 사설토토
사설토토 \\\too93.com///사설토토 사설토토
사설토토 \\\too93.com///사설토토 사설토토
사설토토 \\\too93.com///사설토토 사설토토
사설토토 \\\too93.com///사설토토 사설토토
사설토토 \\\too93.com///사설토토 사설토토
사설토토 \\\too93.com///사설토토 사설토토
사설토토 \\\too93.com///사설토토 사설토토
사설토토 \\\too93.com///사설토토 사설토토
사설토토 \\\too93.com///사설토토 사설토토
사설토토 \\\too93.com///사설토토 사설토토
사설토토 \\\too93.com///사설토토 사설토토
사설토토 \\\too93.com///사설토토 사설토토
More Related Content
What's hot
Techno Buy (DHFL)
The document provides a technical analysis and recommendation for the stock DHFL. It summarizes that:
1) DHFL has broken out of a reversal pattern on high volume, indicating upside potential in the coming sessions.
2) The stock has formed a large bullish candle on the weekly chart with good volume.
3) During a recent correction, DHFL saw low volume, suggesting potential upside from current levels.
4) Momentum indicators are positive, with the RSI above 60 and a positive crossover, supporting further gains.
5) The recommendation is to buy DHFL at 443-435 with a stop loss of 420 and target of 485.
Traders choice thomascook
Thomas Cook stock is expected to rise further based on technical analysis. The stock terminated its correction at the 38.2% retracement level and has since risen, breaking above a downward trendline. It has consolidated gains in a tight range recently. Its latest upward move indicates bulls have returned and the price may rise further to Rs. 235 over the next few trading sessions.
Traders choice kwality
The document provides a technical analysis of the stock KWALITY. It recommends buying the stock at 127.6, with a stop loss of 122 and target price of 138. The analysis notes that the stock has shown strength by retracing losses quickly and breaking above a downward trend line. Upside movement has also seen rising volume, indicating growing appetite for the stock. Based on this technical analysis, the document expects the stock to reach 138 in the next few trading sessions.
Traders choice infibeam
This document recommends buying shares of INFIBEAM at Rs. 700 per share. It analyzes technical indicators like moving averages and chart patterns. It observes that the stock has been trending positively, taking support at its 21-day moving average. The stock has formed an ascending triangle pattern and given a positive breakout. Based on this technical analysis, the document forecasts that the stock price will rise to Rs. 740 in the next few trading sessions.
Traders choice mahindcie
The document provides a technical analysis of MAHINDCIE stock and recommends it as a buy. It notes that the stock price has found support at horizontal price levels and reversed trend. Momentum indicators like the 21-day moving average and RSI also indicate a positive trend. Based on these technical factors, the analysis forecasts the stock price to rise to 218 levels in the coming trading sessions.
Traders choice adaniport
The document provides a technical analysis of ADANIPORT stock and recommends a buy. It summarizes:
1) The stock has formed a double bottom pattern on the daily chart, indicating a bullish reversal.
2) The stock has moved above a consolidation phase, signaling the resumption of an upward trend.
3) Technical indicators like the 21-day and 100-day moving averages also provide positive signals.
4) Based on the analysis, the stock price is expected to rise to Rs. 230 in the coming trading sessions.
Traders choice pnb
The document provides a technical analysis and recommendation for selling PNB Futures at 79.75 with a stop loss of 82 and target of 75. It notes that the stock has breached below support levels, is sustaining below moving averages, and momentum oscillators suggest further downside. Based on these technical indicators, the analysis recommends expecting further downside in the stock price to 75.
Traders Choice
Lambodhara, a textile company, has been consolidating after a steep fall, with rising volume indicating accumulation. It has formed a bullish pattern and protected earlier lows, signaling a potential change. Momentum indicators like RSI show positive reversal and have breached averages, while an intraday range breakout has occurred. The recommendation is to buy Lambodhara at 215 with a stop loss of 213 and target of 230.
Traders choice adaniport
The document provides a technical analysis and recommendation to sell ADANIPORT futures at 259.7, with a stop loss of 264 and target of 247. The analysis notes that the stock has faced resistance at a horizontal line, formed a pattern of lower highs and lower lows indicating a negative short-term trend, and has breached its intraday consolidation band on the lower side. The RSI momentum oscillator has also breached its lower band. Based on this technical analysis, a mild decline in the stock price can be expected.
Traders Choice - SCHNEIDER
This document provides a technical analysis of SCHNEIDER stock and recommends buying it at 176 with a stop loss of 169 and target of 190. It notes that the stock has broken out to higher levels, risen above its 250-day moving average resistance, and seen an escalation in bullish volume in the consolidation area. Additionally, the RSI momentum oscillator has risen above its consolidated range and previous reversal point, suggesting fresh upward momentum in the coming days if the stock sustains above current levels.
Traders choice equitas
The document recommends buying EQUITAS stock at 149.50 with a stop loss of 144 and target of 159 based on a technical analysis. It notes that the stock has formed a double bottom pattern indicating a bullish reversal. Momentum indicators like RSI show a positive signal, and the stock is expected to move above its 21 day moving average. Based on these factors, further upside movement of the stock to 159 is expected.
Traders Choice: ORIENTCEM
This document provides a technical analysis of ORIENTCEM stock and recommends a buy. It observes that the stock protected its initial low and resumed upward movement in the second half of trading, forming a Morning Star pattern at support. The momentum oscillator RSI has crossed above its average line with positive divergence, indicating further upside potential. Based on this analysis, additional gains are expected. The target price provided is Rs. 162 with a stop loss of Rs. 144.
Techno Buy: NMDC
The document provides a technical analysis of NMDC stock. It summarizes that:
- On the weekly chart, the stock has found support at 92 levels, which is a sign of potential upside. It has bounced back from this support level in the past.
- On the daily chart, the stock has formed a "double bottom" pattern indicating a bullish reversal and potential upside from current levels.
- Momentum indicators like the RSI are showing positive divergence, further supporting upside potential for the stock.
- The analysis recommends buying NMDC at 99.50 with a stop loss of 93 and target of 115.
Traders choice canfinhome
This document provides a technical analysis of CANFINHOME stock with the following key points:
1) The stock has shown strength despite market turbulence by maintaining its price above support levels.
2) The stock is in a positive trend forming higher highs and higher lows on the chart.
3) It has emerged from a brief consolidation phase and found support at the 21 day moving average.
4) The RSI momentum indicator has risen above its average line, indicating further upward momentum.
5) Based on this analysis, the stock is expected to reach a target price of 1315 in the next few trading sessions.
Techno sell lead 25.09.15
The document provides a technical analysis of TECHNO stock. It summarizes that the stock price has been in a downtrend for months and has been trading in a symmetrical triangle pattern for the past couple of months. The stock price is also trading below its 75-day exponential moving average and MACD has given a negative signal by moving below zero and crossing the signal line lower. Based on this technical setup, the document expects the stock price to break down from the symmetrical triangle pattern towards lower levels, testing 105 in the next few trading sessions, as long as it remains below the 116 resistance level. It recommends selling TECHNO at 112 with a stop loss of 116 and a target price of 105.
Trades Choice - TORNTPOWER
- The document recommends buying TORNTPOWER stock based on a technical analysis. It cites an inverted head and shoulder pattern breakout on the higher time frame chart and consolidation on the daily chart as bullish signals.
- Volume activity has increased after the consolidation phase, and the RSI momentum oscillator has found support at a previous resistance level, indicating more upside potential for the stock.
- The target price given is Rs. 250, with support at Rs. 215 and the current price being Rs. 229.
Techno Buy : HCLTECH
The stock has been in an ascending triangle pattern recently, taking support at the lower arm of the triangle. This has led to an upside bounce with heavy volume, indicating upward momentum. The stock has also broken out of a six-day consolidation pattern with above average volume. Additionally, it is finding support at the 100-day EMA at 931 levels, suggesting an uptrend in the near-term. Momentum indicators like the RSI are showing positive signals as well. The analyst recommends buying the stock at 960 and up to 948, with a stop loss of 925 and target of 1050.
Techno Sell: INFY
The document provides a technical analysis and recommendation for INFY stock. It summarizes:
1) The daily chart shows a "Shooting Star" candlestick pattern indicating downside movement, and resistance at 1126 Fibonacci level suggests the stock may fall to 1060.
2) On the weekly chart, the stock faces strong resistance from a downward trendline at 1140 level.
3) The RSI momentum indicator shows choppy movement in the last 3 weeks with resistance at 60, which could point to negative momentum hitting the stock in the next few sessions.
4) The recommendation is to sell INFY at 1110-1122 with a stop loss of 1150 and target of 100
Traders choice vipul ltd
This document provides a technical analysis and recommendation for VIPUL LTD stock. It summarizes that:
1) The stock has shown positive momentum and doubled from its lows, indicating an ongoing uptrend.
2) An intermediate correction ended at the 50% retracement level, an important support point.
3) The stock has formed a base at this support level and taken support from its 21 day moving average, indicating further upward movement.
4) Based on this analysis, the stock price is expected to reach 98 levels in the next few trading sessions.
Techno buy beml
The document provides a technical analysis of BEML stock. It summarizes that the stock has formed a bullish reversal pattern on the weekly chart and closed above its 21-day moving average on the daily chart, indicating an upward trend. The stock has also broken out of its consolidation with high volume, signaling robust upside potential in the coming sessions. Technical indicators like RSI are also signaling a positive trend. Based on this technical structure, the document recommends buying BEML with a target price of 1018 and stop loss of 900.
What's hot (20)
Viewers also liked
사설토토 \\\too93.com///사설토토 사설토토
사설토토 \\\too93.com///사설토토 사설토토
사설토토 \\\too93.com///사설토토 사설토토
사설토토 \\\too93.com///사설토토 사설토토
사설토토 \\\too93.com///사설토토 사설토토
사설토토 \\\too93.com///사설토토 사설토토
사설토토 \\\too93.com///사설토토 사설토토
사설토토 \\\too93.com///사설토토 사설토토
사설토토 \\\too93.com///사설토토 사설토토
사설토토 \\\too93.com///사설토토 사설토토
사설토토 \\\too93.com///사설토토 사설토토
사설토토 \\\too93.com///사설토토 사설토토
사설토토 \\\too93.com///사설토토 사설토토
사설토토 \\\too93.com///사설토토 사설토토
사설토토 \\\too93.com///사설토토 사설토토
사설토토 \\\too93.com///사설토토 사설토토
사설토토 \\\too93.com///사설토토 사설토토
사설토토 \\\too93.com///사설토토 사설토토
사설토토 \\\too93.com///사설토토 사설토토
사설토토 \\\too93.com///사설토토 사설토토
사설토토 \\\too93.com///사설토토 사설토토
사설토토 \\\too93.com///사설토토 사설토토
Visual aid
The document discusses techniques for restoring paper, including washing by immersion, float washing, and blotter washing. These techniques involve spraying or placing the paper in trays of water and organic solvent mixtures to clean it. The paper is then removed carefully and allowed to dry using blotters, felts or cotton swabs. Common materials used include water, wetting agents, enzymes, and alkaline solutions.
LA WEB 2.0
Este documento describe las diferencias entre la Web 1.0, Web 2.0 y Web 3.0. La Web 1.0 se centra en la publicación de contenido estático, mientras que la Web 2.0 permite la participación y colaboración de los usuarios a través de plataformas sociales y blogs. La Web 3.0 aprovechará la inteligencia colectiva para ofrecer experiencias enriquecedoras centradas en el usuario a través de software con capacidades de aprendizaje automático.
Pauta do programa cenários
O documento discute a pauta de um programa sobre o julgamento do mensalão no STF. Aborda os direitos políticos dos condenados, o julgamento em si, questões jurídicas polêmicas, o cenário atual com prisões e regalias, e se o julgamento representou um divisor de águas para o estado democrático de direito no Brasil.
Search Engine Optimization
This document provides a summary of an SEO consultant's daily thoughts and activities. It discusses getting started with SEO by thinking about the online marketing funnel and target audiences. It also covers on-page ranking factors like titles, headings, and images. Off-page factors like links, technology issues, and site structure are examined. Tools for analysis like Google Search Console and link analysis tools are also mentioned. Helpful resources for learning more about SEO, coding, and upcoming events are provided at the end.
Anime
El documento describe la historia y evolución del manga y el anime en Japón, desde sus inicios a principios de 1900 hasta la actualidad. Explica que el manga comenzó en 1868 cuando llegaron occidentales a Japón, mientras que el anime surgió en 1917 con cortometrajes de estilo estadounidense. Además, detalla diferentes géneros populares de manga y anime como shonen, shojo, yaoi, yuri y otros.
Skateboarding
Cuando te esfuerzas por lo que quieres, lo logras todo.
El skate es así, mucho esfuerzo y mucha valentía.
Autismo ¿por qué?
La psiquiatría se dedica al estudio y tratamiento de los trastornos mentales desde un enfoque médico que considera factores biológicos, psicológicos y ambientales. La psicoterapia ha demostrado ser eficaz para muchos problemas psiquiátricos. Los psiquiatras se especializan en diagnóstico y tratamiento médico de trastornos mentales, mientras que los psicólogos ofrecen tratamientos psicológicos pero no tienen competencias médicas. Este curso sobre autismo proporciona formación práct
Les produits bretons sur le stand de Mirandola
Les produits bretons qu'on pourra trouver sur le stand de Mirandola
Refresherator Dry Pak
The refreshrator dry pak keeps the refrigerator free from bad odor and helps keeping refrigerator dry.
jameel CV
The curriculum vitae is for Mohammed Jameel, who has over 5 years of experience in the financial sector in both Dubai, Sharjah and various places in India. He currently works as a Relationship Officer for Dunia Finance LLC in Sharjah. Previously he has held roles as a Sales Officer for ShriRam Auto Finance and as a Business Officer for Gokul Finance Pvt Ltd. He has a diploma in Electronics and Communication Engineering from Nittur Polytechnic College. His objective is to work for an organization that promotes teamwork and knowledge growth.
Seize the mobile moment forrester report
In January 2015, HP commissioned Forrester Consulting to conduct a custom study of 271 IT and business decision-makers from companies with more than 500 employees. The study explored the business priorities, technology initiatives, and mobility maturity in support of field service workers.
STANLY_SIMON_RHCSA
Stanly Simon has passed the Red Hat Certified System Administrator (RHCSA) exam for Red Hat Enterprise Linux 6. The certification is valid for three years from December 30, 2013 and the certification ID is 130-230-857.
Viewers also liked (17)
20150509 unix v6로 배우는 커널의 원리와 구조 3 김지은
20150509 unix v6로 배우는 커널의 원리와 구조 3 김지은
Similar to ChoiceBroking Techno Buy: HDFC LTD.
Traders choice pvr
The document provides a technical analysis of PVR stock with the following key points:
1) PVR stock has shown relative strength and recovery from lower levels, supporting a buy recommendation.
2) Technical indicators like the 21 day moving average and momentum oscillator RSI signal rising momentum.
3) The ADX indicator suggests positive DI will likely dominate, supporting further upward movement.
4) Based on the technical analysis, the stock price is expected to reach a target of 1320.
Traders choice reliance
This document provides a technical analysis and recommendation to buy Reliance shares at Rs. 993.8 per share. The analysis notes that the stock has taken support at its 250-day moving average, breached prior support lines and consolidation areas, and shows rising momentum on indicators like RSI. A breakout of an inverted head and shoulder pattern on intraday charts further supports the bullish outlook. Based on these technical factors, the document recommends buying Reliance with a stop loss of Rs. 970 and target price of Rs. 1040, expecting further momentum in the stock price over the next few trading sessions.
ChoiceBroking Techno Buy: INDUSIND BANK
The document provides a technical analysis of INDUSINDBK stock. It summarizes:
- The stock has broken out of a symmetrical triangle pattern on the daily chart, indicating further upside.
- On the weekly chart, the stock has continuously traded above its 50-day moving average of 899, showing an upward medium-term trend.
- On the monthly chart, the stock has formed a long leg continuation pattern, pointing to an ongoing primary upward trend.
- Momentum indicators also show positive momentum and an upward trend, suggesting potential for further price increase.
- Based on the technical analysis, the stock is expected to rise further to a target price of 1050.
Traders choice tataelxsi
The document provides a technical analysis of TATAELXSI stock. It summarizes that the stock has entered an intermediate correction phase but is likely to conclude its negative movement based on technical indicators. The stock has taken multiple supports, broken above downward trend lines and its 21-day moving average on strong volume. Based on this analysis, the stock is expected to move further upwards to a target price of 1810.
Techno BUY: CADILAHC
The document provides a technical analysis of CADILAHC stock. It summarizes that CADILAHC has been in an uptrend since February 2015 and is currently trading near the lower band of its channel formation, indicating a bounce back is expected. Technical indicators like the bullish harami candlestick pattern and RSI divergences suggest prices may move upwards to Rs. 445 in the coming sessions, with downside support at Rs. 370. The analyst recommends buying CADILAHC at Rs. 395-388, with a stop loss of Rs. 370 and target of Rs. 445.
Traders choice kei
The document provides a technical analysis and recommendation for KEI stock. It summarizes that KEI stock is near its all-time high, showing strong relative strength compared to broader indexes. The stock has entered a consolidation phase after a strong rise. It is potentially forming a flag pattern indicating further upside movement to Rs. 182 in the next few trading sessions. Technical indicators like the RSI support continued upside potential for the stock. The analysis recommends buying KEI stock at Rs. 166 with a stop loss of Rs. 160 and target price of Rs. 182.
Traders Choice - MINDTREE
The document provides a technical analysis and recommendations for selling Mindtree stock in January futures. It summarizes:
1) Mindtree stock had formed a triple top pattern and shooting star candlestick pattern at resistance, indicating higher chances of a bearish reversal.
2) Volume had increased at the reversal point, which could signal distribution.
3) The RSI momentum oscillator was reverting from resistance and had broken below its average line, further indicating a potential downtrend.
4) Based on the technical patterns and indicators, the analyst recommends selling Mindtree in January futures with a stop loss of 1520 and target of 1430.
Traders choice dishman
This document recommends buying shares of Dishman Pharma at 178 with a target price of 190 based on technical analysis. It notes that the pharma sector saw broad buying today and Dishman Pharma was one of the gaining stocks. The stock has formed a base around its 21 day moving average and moved above, validating a positive short term bias. On intraday charts, the stock has breached its upper consolidation band, which can be seen as a continuation of the trend. Based on this analysis, the document expects the stock to reach 190 in the next few trading sessions.
Traders choice tvselect
The document provides a technical analysis and recommendation for TVSELECT stock. It summarizes that:
1) TVSELECT stock has been in a consolidation phase but is showing signs of strong upward momentum and potential to break out higher.
2) The stock price has risen strongly and volume has expanded at current levels, indicating activity.
3) Technically, the stock appears to be forming a flag pattern indicating it could rise further to a target price of 200 after consolidating recent gains.
Traders Choice - Alankit
1) The stock ALANKIT has seen a significant rise in price over the past couple of months, reaching an all-time high in the recent trading session by forming an ideal continuation pattern called a flag pattern.
2) The bulls have taken a pause over the past few trading sessions but have generated enough momentum to push the stock to a new high.
3) The enthusiasm of the bulls and a positive reversal in the RSI indicator suggest that further upside in the stock's price can be expected.
Traders choice bharatforge
The document recommends buying shares of Bharat Forge at Rs. 953.25, with a stop loss of Rs. 928 and target price of Rs. 1020. It notes that the stock has formed a strong base on higher time frames, indicating an end to its short-term correction. The stock has broken out of its mild corrective phase at current levels and is resuming its previous upward trend. The stock continues to find support at its 21-day moving average, signaling positivity in the near term. Positive Directional Indicator is also nearing dominance, suggesting further upward movement to Rs. 1020.
Traders Choice - SRTRANSFIN
The document provides a recommendation to sell SRTRANSFIN futures in January at 780 with a stop loss of 796 and target of 750. It cites technical factors for this recommendation, including that the stock broke below a horizontal support line and formed a failed bullish pattern. Momentum indicators are also tilting downward. Given falling market intensity and the stock likely to follow broader indices, it is recommended to sell the futures contract with the expectation it will move further downward.
Techno Buy: RELIANCE
The document provides a technical analysis of Reliance stock. It summarizes that:
1) The stock has been trading in an upward trend line and has taken support at this line recently, indicating bullish movement in the coming sessions.
2) The stock closed above its 21 week moving average of 856, showing an upward short to medium term trend.
3) Technical indicators like RSI and a possible triple bottom pattern suggest the stock could rise further if it breaches 900.
4) RSI on hourly charts shows bullish momentum, suggesting the stock may bounce back in price.
The analyst recommends buying Reliance at 861 or up to 850 with a stop loss of 825 and target
Traders choice jktyre
The document recommends buying JKTYRE stock at 118.65, with a stop loss of 112 and target of 132. It bases this on technical analysis showing the stock halted a correction at its 250-day moving average, consolidated, and then formed a strong bullish candle moving above consolidation bands. Momentum indicators like RSI also show rising momentum, and expanding volume signals rising momentum to support further movement to the 132 target level.
Traders choice mmtc
This document recommends buying shares of MMTC at Rs. 55.30, with a stop loss of Rs. 52 and target of Rs. 60. It analyzes technical patterns showing the stock has broken out of consolidation phases and is in an overall bullish trend according to daily and weekly moving averages. Momentum is positive as the RSI indicator has crossed above the center line and past highs, suggesting further upside in the near future.
Traders choice eveready
The document provides a technical analysis and recommendation for the stock EVEREADY. It summarizes that:
1) The stock has formed a rounding bottom pattern indicating steady accumulation at lower levels.
2) The stock has breached previous resistance areas, showing that demand has absorbed supply pressure.
3) The stock is trading above short and long-term moving averages, demonstrating positive momentum.
4) Based on this technical analysis, the stock is expected to reach Rs. 272 in the next few trading sessions.
Traders choice ntpc
The document provides a technical analysis and recommendation to buy NTPC stock at 137 with a stop loss of 134 and target of 143. It notes that NTPC has formed a bullish candlestick pattern and taken support at its 100-day and 250-day moving averages, indicating a potential reversal and further upward movement. The analysis recommends expecting NTPC's price to move up to 143 based on these technical indicators.
Traders choice capf
- The stock CAPF is in a strong positive movement after a brief negative period and is rising again.
- It is trading above its short and long term moving averages, demonstrating strength across all timeframes.
- The RSI momentum oscillator found support at 58, an area that previously signaled reversals of corrections, and further movement of the stock to 590 is expected in the next few trading sessions based on the analysis.
Techno buy indusindbnk05012017
The document summarizes the technical analysis of a stock that indicates bullish trends. On daily, weekly, and monthly charts, the stock has formed multiple bullish patterns like double bottom, flag pattern breakouts, and tweezer bottoms. Short, medium, and long-term moving averages also show the stock is trading above them, indicating bullish trends. Momentum indicators like MACD have given buy signals, which is considered a positive sign. Based on this technical analysis, further upside movement in the stock is expected. The analyst recommends buying the stock at the current price for targets above 1200.
Traders Choice - CYIENT
- The document recommends buying Cyient stock at Rs. 435 with a stop loss of Rs. 420 and target of Rs. 465 on January 21st, 2016.
- Technical indicators like momentum oscillator RSI and volume are showing the stock is rebounding from an oversold position and momentum is building.
- On intraday timeframes, there is positive divergence on the daily chart indicating further upward momentum. Price is sustaining above the 21 hour moving average with above average volume, signaling an upward move in the near term.
Similar to ChoiceBroking Techno Buy: HDFC LTD. (20)
Recently uploaded
Eco-Innovations and Firm Heterogeneity.
Evidence from Italian Family and Nonf...
Eco-Innovations and Firm Heterogeneity.
Evidence from Italian Family and Nonf...University of Calabria
The study analyzes differences and primary drivers of green performance between family firms and non-family firms
一比一原版(UoB毕业证)伯明翰大学毕业证如何办理
UoB本科学位证成绩单【微信95270640】伯明翰大学没毕业>办理伯明翰大学毕业证成绩单【微信UoB】UoB毕业证成绩单UoB学历证书UoB文凭《UoB毕业套号文凭网认证伯明翰大学毕业证成绩单》《哪里买伯明翰大学毕业证文凭UoB成绩学校快递邮寄信封》《开版伯明翰大学文凭》UoB留信认证本科硕士学历认证
如果您是以下情况,我们都能竭诚为您解决实际问题:【公司采用定金+余款的付款流程,以最大化保障您的利益,让您放心无忧】
1、在校期间,因各种原因未能顺利毕业,拿不到官方毕业证+微信95270640
2、面对父母的压力,希望尽快拿到伯明翰大学伯明翰大学硕士毕业证成绩单;
3、不清楚流程以及材料该如何准备伯明翰大学伯明翰大学硕士毕业证成绩单;
4、回国时间很长,忘记办理;
5、回国马上就要找工作,办给用人单位看;
6、企事业单位必须要求办理的;
面向美国乔治城大学毕业留学生提供以下服务:
【★伯明翰大学伯明翰大学硕士毕业证成绩单毕业证、成绩单等全套材料,从防伪到印刷,从水印到钢印烫金,与学校100%相同】
【★真实使馆认证(留学人员回国证明),使馆存档可通过大使馆查询确认】
【★真实教育部认证,教育部存档,教育部留服网站可查】
【★真实留信认证,留信网入库存档,可查伯明翰大学伯明翰大学硕士毕业证成绩单】
我们从事工作十余年的有着丰富经验的业务顾问,熟悉海外各国大学的学制及教育体系,并且以挂科生解决毕业材料不全问题为基础,为客户量身定制1对1方案,未能毕业的回国留学生成功搭建回国顺利发展所需的桥梁。我们一直努力以高品质的教育为起点,以诚信、专业、高效、创新作为一切的行动宗旨,始终把“诚信为主、质量为本、客户第一”作为我们全部工作的出发点和归宿点。同时为海内外留学生提供大学毕业证购买、补办成绩单及各类分数修改等服务;归国认证方面,提供《留信网入库》申请、《国外学历学位认证》申请以及真实学籍办理等服务,帮助众多莘莘学子实现了一个又一个梦想。
专业服务,请勿犹豫联系我
如果您真实毕业回国,对于学历认证无从下手,请联系我,我们免费帮您递交
诚招代理:本公司诚聘当地代理人员,如果你有业余时间,或者你有同学朋友需要,有兴趣就请联系我
你赢我赢,共创双赢
你做代理,可以帮助伯明翰大学同学朋友
你做代理,可以拯救伯明翰大学失足青年
你做代理,可以挽救伯明翰大学一个个人才
你做代理,你将是别人人生伯明翰大学的转折点
你做代理,可以改变自己,改变他人,给他人和自己一个机会大块就啃啃得满嘴满脸猴屁股般的红艳大家一个劲地指着对方吃吃地笑瓜裂得古怪奇形怪状却丝毫不影响瓜味甜丝丝的满嘴生津遍地都是瓜横七竖八的活像掷满了一地的大石块摘走二三只爷爷是断然发现不了的即便发现爷爷也不恼反而教山娃辨认孰熟孰嫩孰甜孰淡名义上是护瓜往往在瓜棚里坐上一刻饱吃一顿后山娃就领着阿黑漫山遍野地跑阿黑是一条黑色的大猎狗挺机灵的是山娃多年的忠实伙伴平时山娃上学阿黑也摇头晃脑地跟去暑假用不着上学阿钩
What's a worker’s market? Job quality and labour market tightness
What's a worker’s market? Job quality and labour market tightnessLabour Market Information Council | Conseil de l’information sur le marché du travail
In a tight labour market, job-seekers gain bargaining power and leverage it into greater job quality—at least, that’s the conventional wisdom.
Michael, LMIC Economist, presented findings that reveal a weakened relationship between labour market tightness and job quality indicators following the pandemic. Labour market tightness coincided with growth in real wages for only a portion of workers: those in low-wage jobs requiring little education. Several factors—including labour market composition, worker and employer behaviour, and labour market practices—have contributed to the absence of worker benefits. These will be investigated further in future work.This assessment plan proposal is to outline a structured approach to evaluati...
This assessment plan proposal is to outline a structured approach to evaluati...lamluanvan.net Viết thuê luận văn
Luận Văn Group hỗ trợ viết luận văn thạc sĩ,chuyên đề,khóa luận tốt nghiệp, báo cáo thực tập, Assignment, Essay
Zalo/Sdt 0967 538 624/ 0886 091 915 Website:lamluanvan.net
Tham gia nhóm hỗ trợ viết bài fb: https://www.facebook.com/groups/285625754522599?locale=vi_VNThe Rise of Generative AI in Finance: Reshaping the Industry with Synthetic Data
In this presentation, we will explore the rise of generative AI in finance and its potential to reshape the industry. We will discuss how generative AI can be used to develop new products, combat fraud, and revolutionize risk management. Finally, we will address some of the ethical considerations and challenges associated with this powerful technology.
一比一原版(GWU,GW毕业证)加利福尼亚大学|尔湾分校毕业证如何办理
GWU,GW毕业证录取书【微信95270640】一比一伪造加利福尼亚大学|尔湾分校文凭@假冒GWU,GW毕业证成绩单+Q微信95270640办理GWU,GW学位证书@仿造GWU,GW毕业文凭证书@购买加利福尼亚大学|尔湾分校毕业证成绩单GWU,GW真实使馆认证/真实留信认证回国人员证明
全套服务:加利福尼亚大学|尔湾分校加利福尼亚大学|尔湾分校毕业证成绩单真实回国人员证明 #真实教育部认证。让您回国发展信心十足#铸就十年品质!信誉!实体公司!可以视频看办公环境样板如需办理真实可查可以先到公司面谈勿轻信小中介黑作坊!
可以提供加利福尼亚大学|尔湾分校钢印 #水印 #烫金 #激光防伪 #凹凸版 #最新版的毕业证 #百分之百让您绝对满意
印刷DHL快递毕业证 #成绩单7个工作日真实大使馆教育部认证1个月。为了达到高水准高效率
请您先以qq或微信的方式对我们的服务进行了解后如果有加利福尼亚大学|尔湾分校加利福尼亚大学|尔湾分校毕业证成绩单帮助再进行电话咨询。
国外毕业证学位证成绩单如何办理:
1客户提供办理信息:姓名生日专业学位毕业时间等(如信息不确定可以咨询顾问:我们有专业老师帮你查询);
2开始安排制作加利福尼亚大学|尔湾分校毕业证成绩单电子图;
3毕业证成绩单电子版做好以后发送给您确认;
4毕业证成绩单电子版您确认信息无误之后安排制作成品;
5成品做好拍照或者视频给您确认;
6快递给客户(国内顺丰国外DHLUPS等快读邮寄)。口水苦涩无比山娃一边游泳一边念念不忘那元门票尤令山娃气愤的是泳池老板居然硬让父亲买了一大一小二条巴掌般大的裤衩衩走出泳池山娃感觉透身粘粘乎乎散发着药水味有点痒山娃顿时留恋起家乡的小河潺潺活水清凉无比日子就这样孤寂而快乐地过着寂寞之余山娃最神往最开心就是晚上无论多晚多累父亲总要携山娃出去兜风逛夜市流光溢彩人潮涌动的都市夜生活总让山娃目不暇接惊叹不已父亲老问山娃想买什么想吃什么山娃知道父亲赚钱很辛苦在
1.2 Business Ideas Business Ideas Busine
Business Ideas PowerpointBusiness Ideas PowerpointBusiness Ideas PowerpointBusiness Ideas PowerpointBusiness Ideas PowerpointBusiness Ideas PowerpointBusiness Ideas PowerpointBusiness Ideas PowerpointBusiness Ideas PowerpointBusiness Ideas PowerpointBusiness Ideas PowerpointBusiness Ideas PowerpointBusiness Ideas PowerpointBusiness Ideas PowerpointBusiness Ideas Powerpoint
falcon-invoice-discounting-a-strategic-approach-to-optimize-investments
Falcon stands out as a top-tier P2P Invoice Discounting platform in India, bridging esteemed blue-chip companies and eager investors. Our goal is to transform the investment landscape in India by establishing a comprehensive destination for borrowers and investors with diverse profiles and needs, all while minimizing risk. What sets Falcon apart is the elimination of intermediaries such as commercial banks and depository institutions, allowing investors to enjoy higher yields.
Independent Study - College of Wooster Research (2023-2024)
"Does Foreign Direct Investment Negatively Affect Preservation of Culture in the Global South? Case Studies in Thailand and Cambodia."
Do elements of globalization, such as Foreign Direct Investment (FDI), negatively affect the ability of countries in the Global South to preserve their culture? This research aims to answer this question by employing a cross-sectional comparative case study analysis utilizing methods of difference. Thailand and Cambodia are compared as they are in the same region and have a similar culture. The metric of difference between Thailand and Cambodia is their ability to preserve their culture. This ability is operationalized by their respective attitudes towards FDI; Thailand imposes stringent regulations and limitations on FDI while Cambodia does not hesitate to accept most FDI and imposes fewer limitations. The evidence from this study suggests that FDI from globally influential countries with high gross domestic products (GDPs) (e.g. China, U.S.) challenges the ability of countries with lower GDPs (e.g. Cambodia) to protect their culture. Furthermore, the ability, or lack thereof, of the receiving countries to protect their culture is amplified by the existence and implementation of restrictive FDI policies imposed by their governments.
My study abroad in Bali, Indonesia, inspired this research topic as I noticed how globalization is changing the culture of its people. I learned their language and way of life which helped me understand the beauty and importance of cultural preservation. I believe we could all benefit from learning new perspectives as they could help us ideate solutions to contemporary issues and empathize with others.
1:1制作加拿大麦吉尔大学毕业证硕士学历证书原版一模一样
原版一模一样【微信:741003700 】【加拿大麦吉尔大学毕业证硕士学历证书】【微信:741003700 】学位证,留信认证(真实可查,永久存档)offer、雅思、外壳等材料/诚信可靠,可直接看成品样本,帮您解决无法毕业带来的各种难题!外壳,原版制作,诚信可靠,可直接看成品样本。行业标杆!精益求精,诚心合作,真诚制作!多年品质 ,按需精细制作,24小时接单,全套进口原装设备。十五年致力于帮助留学生解决难题,包您满意。
本公司拥有海外各大学样板无数,能完美还原海外各大学 Bachelor Diploma degree, Master Degree Diploma
1:1完美还原海外各大学毕业材料上的工艺:水印,阴影底纹,钢印LOGO烫金烫银,LOGO烫金烫银复合重叠。文字图案浮雕、激光镭射、紫外荧光、温感、复印防伪等防伪工艺。材料咨询办理、认证咨询办理请加学历顾问Q/微741003700
留信网认证的作用:
1:该专业认证可证明留学生真实身份
2:同时对留学生所学专业登记给予评定
3:国家专业人才认证中心颁发入库证书
4:这个认证书并且可以归档倒地方
5:凡事获得留信网入网的信息将会逐步更新到个人身份内,将在公安局网内查询个人身份证信息后,同步读取人才网入库信息
6:个人职称评审加20分
7:个人信誉贷款加10分
8:在国家人才网主办的国家网络招聘大会中纳入资料,供国家高端企业选择人才
Tax System, Behaviour, Justice, and Voluntary Compliance Culture in Nigeria -...
Tax System, Behaviour, Justice, and Voluntary Compliance Culture in Nigeria -...Godwin Emmanuel Oyedokun MBA MSc PhD FCA FCTI FCNA CFE FFAR
Lecture slide titled Tax System, Behaviour, Justice, and Voluntary Compliance Culture in Nigeria - Prof Oyedokun.pptx在线办理(GU毕业证书)美国贡萨加大学毕业证学历证书一模一样
学校原件一模一样【微信:741003700 】《(GU毕业证书)美国贡萨加大学毕业证学历证书》【微信:741003700 】学位证,留信认证(真实可查,永久存档)原件一模一样纸张工艺/offer、雅思、外壳等材料/诚信可靠,可直接看成品样本,帮您解决无法毕业带来的各种难题!外壳,原版制作,诚信可靠,可直接看成品样本。行业标杆!精益求精,诚心合作,真诚制作!多年品质 ,按需精细制作,24小时接单,全套进口原装设备。十五年致力于帮助留学生解决难题,包您满意。
本公司拥有海外各大学样板无数,能完美还原。
1:1完美还原海外各大学毕业材料上的工艺:水印,阴影底纹,钢印LOGO烫金烫银,LOGO烫金烫银复合重叠。文字图案浮雕、激光镭射、紫外荧光、温感、复印防伪等防伪工艺。材料咨询办理、认证咨询办理请加学历顾问Q/微741003700
【主营项目】
一.毕业证【q微741003700】成绩单、使馆认证、教育部认证、雅思托福成绩单、学生卡等!
二.真实使馆公证(即留学回国人员证明,不成功不收费)
三.真实教育部学历学位认证(教育部存档!教育部留服网站永久可查)
四.办理各国各大学文凭(一对一专业服务,可全程监控跟踪进度)
如果您处于以下几种情况:
◇在校期间,因各种原因未能顺利毕业……拿不到官方毕业证【q/微741003700】
◇面对父母的压力,希望尽快拿到;
◇不清楚认证流程以及材料该如何准备;
◇回国时间很长,忘记办理;
◇回国马上就要找工作,办给用人单位看;
◇企事业单位必须要求办理的
◇需要报考公务员、购买免税车、落转户口
◇申请留学生创业基金
留信网认证的作用:
1:该专业认证可证明留学生真实身份
2:同时对留学生所学专业登记给予评定
3:国家专业人才认证中心颁发入库证书
4:这个认证书并且可以归档倒地方
5:凡事获得留信网入网的信息将会逐步更新到个人身份内,将在公安局网内查询个人身份证信息后,同步读取人才网入库信息
6:个人职称评审加20分
7:个人信誉贷款加10分
8:在国家人才网主办的国家网络招聘大会中纳入资料,供国家高端企业选择人才
Solution Manual For Financial Accounting, 8th Canadian Edition 2024, by Libby...
Solution Manual For Financial Accounting, 8th Canadian Edition 2024, by Libby, Hodge, Verified Chapters 1 - 13, Complete Newest Version Solution Manual For Financial Accounting, 8th Canadian Edition by Libby, Hodge, Verified Chapters 1 - 13, Complete Newest Version Solution Manual For Financial Accounting 8th Canadian Edition Pdf Chapters Download Stuvia Solution Manual For Financial Accounting 8th Canadian Edition Ebook Download Stuvia Solution Manual For Financial Accounting 8th Canadian Edition Pdf Solution Manual For Financial Accounting 8th Canadian Edition Pdf Download Stuvia Financial Accounting 8th Canadian Edition Pdf Chapters Download Stuvia Financial Accounting 8th Canadian Edition Ebook Download Stuvia Financial Accounting 8th Canadian Edition Pdf Financial Accounting 8th Canadian Edition Pdf Download Stuvia
BONKMILLON Unleashes Its Bonkers Potential on Solana.pdf
Introducing BONKMILLON - The Most Bonkers Meme Coin Yet
Let's be real for a second – the world of meme coins can feel like a bit of a circus at times. Every other day, there's a new token promising to take you "to the moon" or offering some groundbreaking utility that'll change the game forever. But how many of them actually deliver on that hype?
Independent Study - College of Wooster Research (2023-2024) FDI, Culture, Glo...
Independent Study - College of Wooster Research (2023-2024) FDI, Culture, Glo...AntoniaOwensDetwiler
"Does Foreign Direct Investment Negatively Affect Preservation of Culture in the Global South? Case Studies in Thailand and Cambodia."
Do elements of globalization, such as Foreign Direct Investment (FDI), negatively affect the ability of countries in the Global South to preserve their culture? This research aims to answer this question by employing a cross-sectional comparative case study analysis utilizing methods of difference. Thailand and Cambodia are compared as they are in the same region and have a similar culture. The metric of difference between Thailand and Cambodia is their ability to preserve their culture. This ability is operationalized by their respective attitudes towards FDI; Thailand imposes stringent regulations and limitations on FDI while Cambodia does not hesitate to accept most FDI and imposes fewer limitations. The evidence from this study suggests that FDI from globally influential countries with high gross domestic products (GDPs) (e.g. China, U.S.) challenges the ability of countries with lower GDPs (e.g. Cambodia) to protect their culture. Furthermore, the ability, or lack thereof, of the receiving countries to protect their culture is amplified by the existence and implementation of restrictive FDI policies imposed by their governments.
My study abroad in Bali, Indonesia, inspired this research topic as I noticed how globalization is changing the culture of its people. I learned their language and way of life which helped me understand the beauty and importance of cultural preservation. I believe we could all benefit from learning new perspectives as they could help us ideate solutions to contemporary issues and empathize with others.Pensions and housing - Pensions PlayPen - 4 June 2024 v3 (1).pdf
Wayhome's analysis of the UK market and how pension schemes can help solve the problems it presents younger people
Role of Information Technology in Revenue - Prof Oyedokun.pptx
Role of Information Technology in Revenue - Prof Oyedokun.pptxGodwin Emmanuel Oyedokun MBA MSc PhD FCA FCTI FCNA CFE FFAR
Lecture slide on the Role of Information Technology in Revenue Generation and Collection
Who Is the Largest Producer of Soybean in India Now.pdf
This blog explores the current largest producer of soybean in India and the factors contributing to their dominance.
Recently uploaded (20)
Applying the Global Internal Audit Standards_AIS.pdf
Applying the Global Internal Audit Standards_AIS.pdf
Eco-Innovations and Firm Heterogeneity.
Evidence from Italian Family and Nonf...
Eco-Innovations and Firm Heterogeneity.
Evidence from Italian Family and Nonf...
What's a worker’s market? Job quality and labour market tightness
What's a worker’s market? Job quality and labour market tightness
This assessment plan proposal is to outline a structured approach to evaluati...
This assessment plan proposal is to outline a structured approach to evaluati...
The Rise of Generative AI in Finance: Reshaping the Industry with Synthetic Data
The Rise of Generative AI in Finance: Reshaping the Industry with Synthetic Data
falcon-invoice-discounting-a-strategic-approach-to-optimize-investments
falcon-invoice-discounting-a-strategic-approach-to-optimize-investments
Independent Study - College of Wooster Research (2023-2024)
Independent Study - College of Wooster Research (2023-2024)
Tax System, Behaviour, Justice, and Voluntary Compliance Culture in Nigeria -...
Tax System, Behaviour, Justice, and Voluntary Compliance Culture in Nigeria -...
Solution Manual For Financial Accounting, 8th Canadian Edition 2024, by Libby...
Solution Manual For Financial Accounting, 8th Canadian Edition 2024, by Libby...
BONKMILLON Unleashes Its Bonkers Potential on Solana.pdf
BONKMILLON Unleashes Its Bonkers Potential on Solana.pdf
Independent Study - College of Wooster Research (2023-2024) FDI, Culture, Glo...
Independent Study - College of Wooster Research (2023-2024) FDI, Culture, Glo...
Pensions and housing - Pensions PlayPen - 4 June 2024 v3 (1).pdf
Pensions and housing - Pensions PlayPen - 4 June 2024 v3 (1).pdf
Role of Information Technology in Revenue - Prof Oyedokun.pptx
Role of Information Technology in Revenue - Prof Oyedokun.pptx
Who Is the Largest Producer of Soybean in India Now.pdf
Who Is the Largest Producer of Soybean in India Now.pdf
ChoiceBroking Techno Buy: HDFC LTD.
- 1. SEBI Registered – Research Analyst *Please Refer Disclaimer on Website As marked by arrows on chart, earlier resistance had turned in support. Given formation is in line with change of polarity concept. Thereafter HDFC had taken a multiple support at horizontal line. Presence of bullish engulfing candle validates horizontal line and dilute chances of whipsaw that had observed earlier. Recently it had crossed its short term moving average 21EMA which is placed at 1198. Momentum oscillator RSI had formed bullish divergence which indicates internal momentum is increasing and it had bounced from oversold zone and forming higher high & higher low. Based on above technical reasoning and given set up further upside can be expected up to upper resistance level which comes at 1320 level. Buy HDFC Ltd in Cash @ 1218 & Upto 1205 SL 1160 TGT 1320 16th Dec. 2015 TECHNO BUY *Please Refer Disclaimer on Website WWW.CHOICEINDIA.COM
- 2. www.choiceindia.com Contact Us Disclaimer This is solely for information of clients of Choice Broking and does not construe to be an investment advice. It is also not intended as an offer or solicitation for the purchase and sale of any financial instruments. Any action taken by you on the basis of the information contained herein is your responsibility alone and Choice Broking its subsidiaries or its employees or associates will not be liable in any manner for the consequences of such action taken by you. We have exercised due diligence in checking the correctness and authenticity of the information contained in this recommendation, but Choice Broking or any of its subsidiaries or associates or employees shall not be in any way responsible for any loss or damage that may arise to any person from any inadvertent error in the information contained in this recommendation or any action taken on basis of this information. Technical analysis studies market psychology, price patterns and volume levels. It is used to forecast future price and market movements. Technical analysis is complementary to fundamental analysis and news sources. The recommendations issued herewith might be contrary to recommendations issued by Choice Broking in the company research undertaken as the recommendations stated in this report is derived purely from technical analysis. Choice Broking has based this document on information obtained from sources it believes to be reliable but which it has not independently verified; Choice Broking makes no guarantee, representation or warranty and accepts no responsibility or liability as to its accuracy or completeness. The opinions contained within the report are based upon publicly available information at the time of publication and are subject to change without notice. The information and any disclosures provided herein are in summary form and have been prepared for informational purposes. The recommendations and suggested price levels are intended purely for trading purposes. The recommendations are valid for the day of the report however trading trends and volumes might vary substantially on an intraday basis and the recommendations may be subject to change. The information and any disclosures provided herein may be considered confidential. Any use, distribution, modification, copying, forwarding or disclosure by any person is strictly prohibited. The information and any disclosures provided herein do not constitute a solicitation or offer to purchase or sell any security or other financial product or instrument. The current performance may be unaudited. Past performance does not guarantee future returns. There can be no assurance that investments will achieve any targeted rates of return, and there is no guarantee against the loss of your entire investment. POTENTIAL CONFLICT OF INTEREST DISCLOSURE (as on date of report) Disclosure of interest statement – • Analyst interest of the stock /Instrument(s): - No. • Firm interest of the stock / Instrument (s): - No. www.choiceindia.comcustomercare@choiceindia.com Research Team Mr. Sumeet Bagadia Associate Director Kunal Parmar Research Associate Amit Pathania Research Associate Kapil Shah Research Associate Vikas Chaudhari Research Associate Rajnath Yadav Research Associate Satish Kumar Research Associate Trirashmi Ghoderao Researsh Advisor Neeraj Yadav Researsh Advisor 16th Dec. 2015 TECHNO Buy