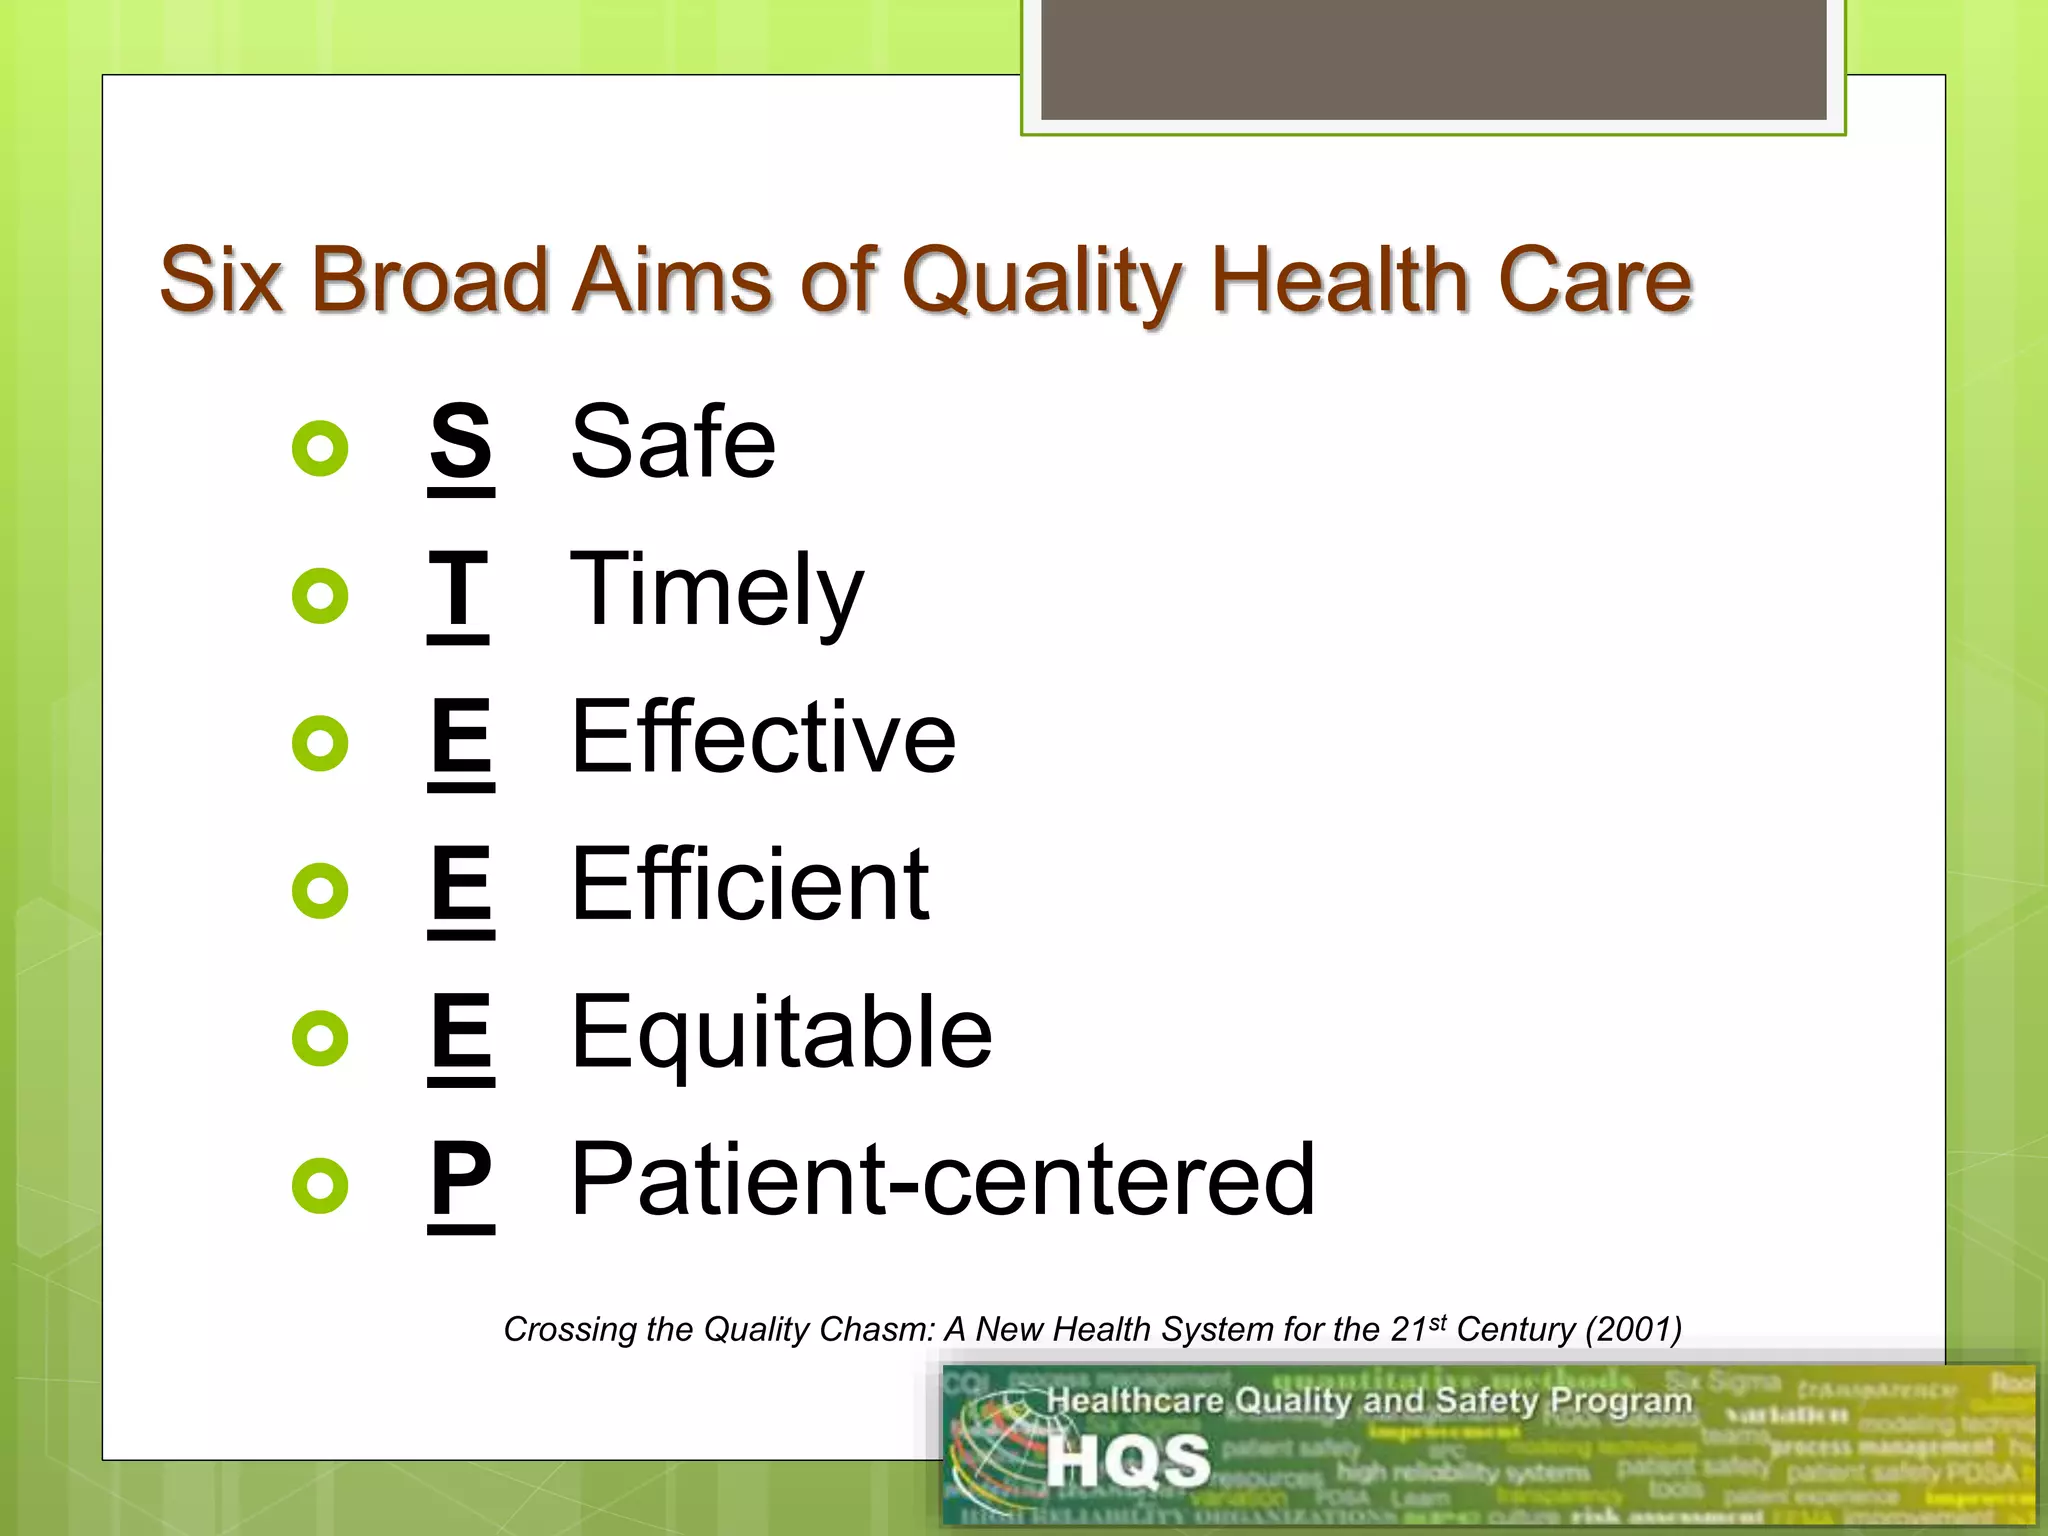
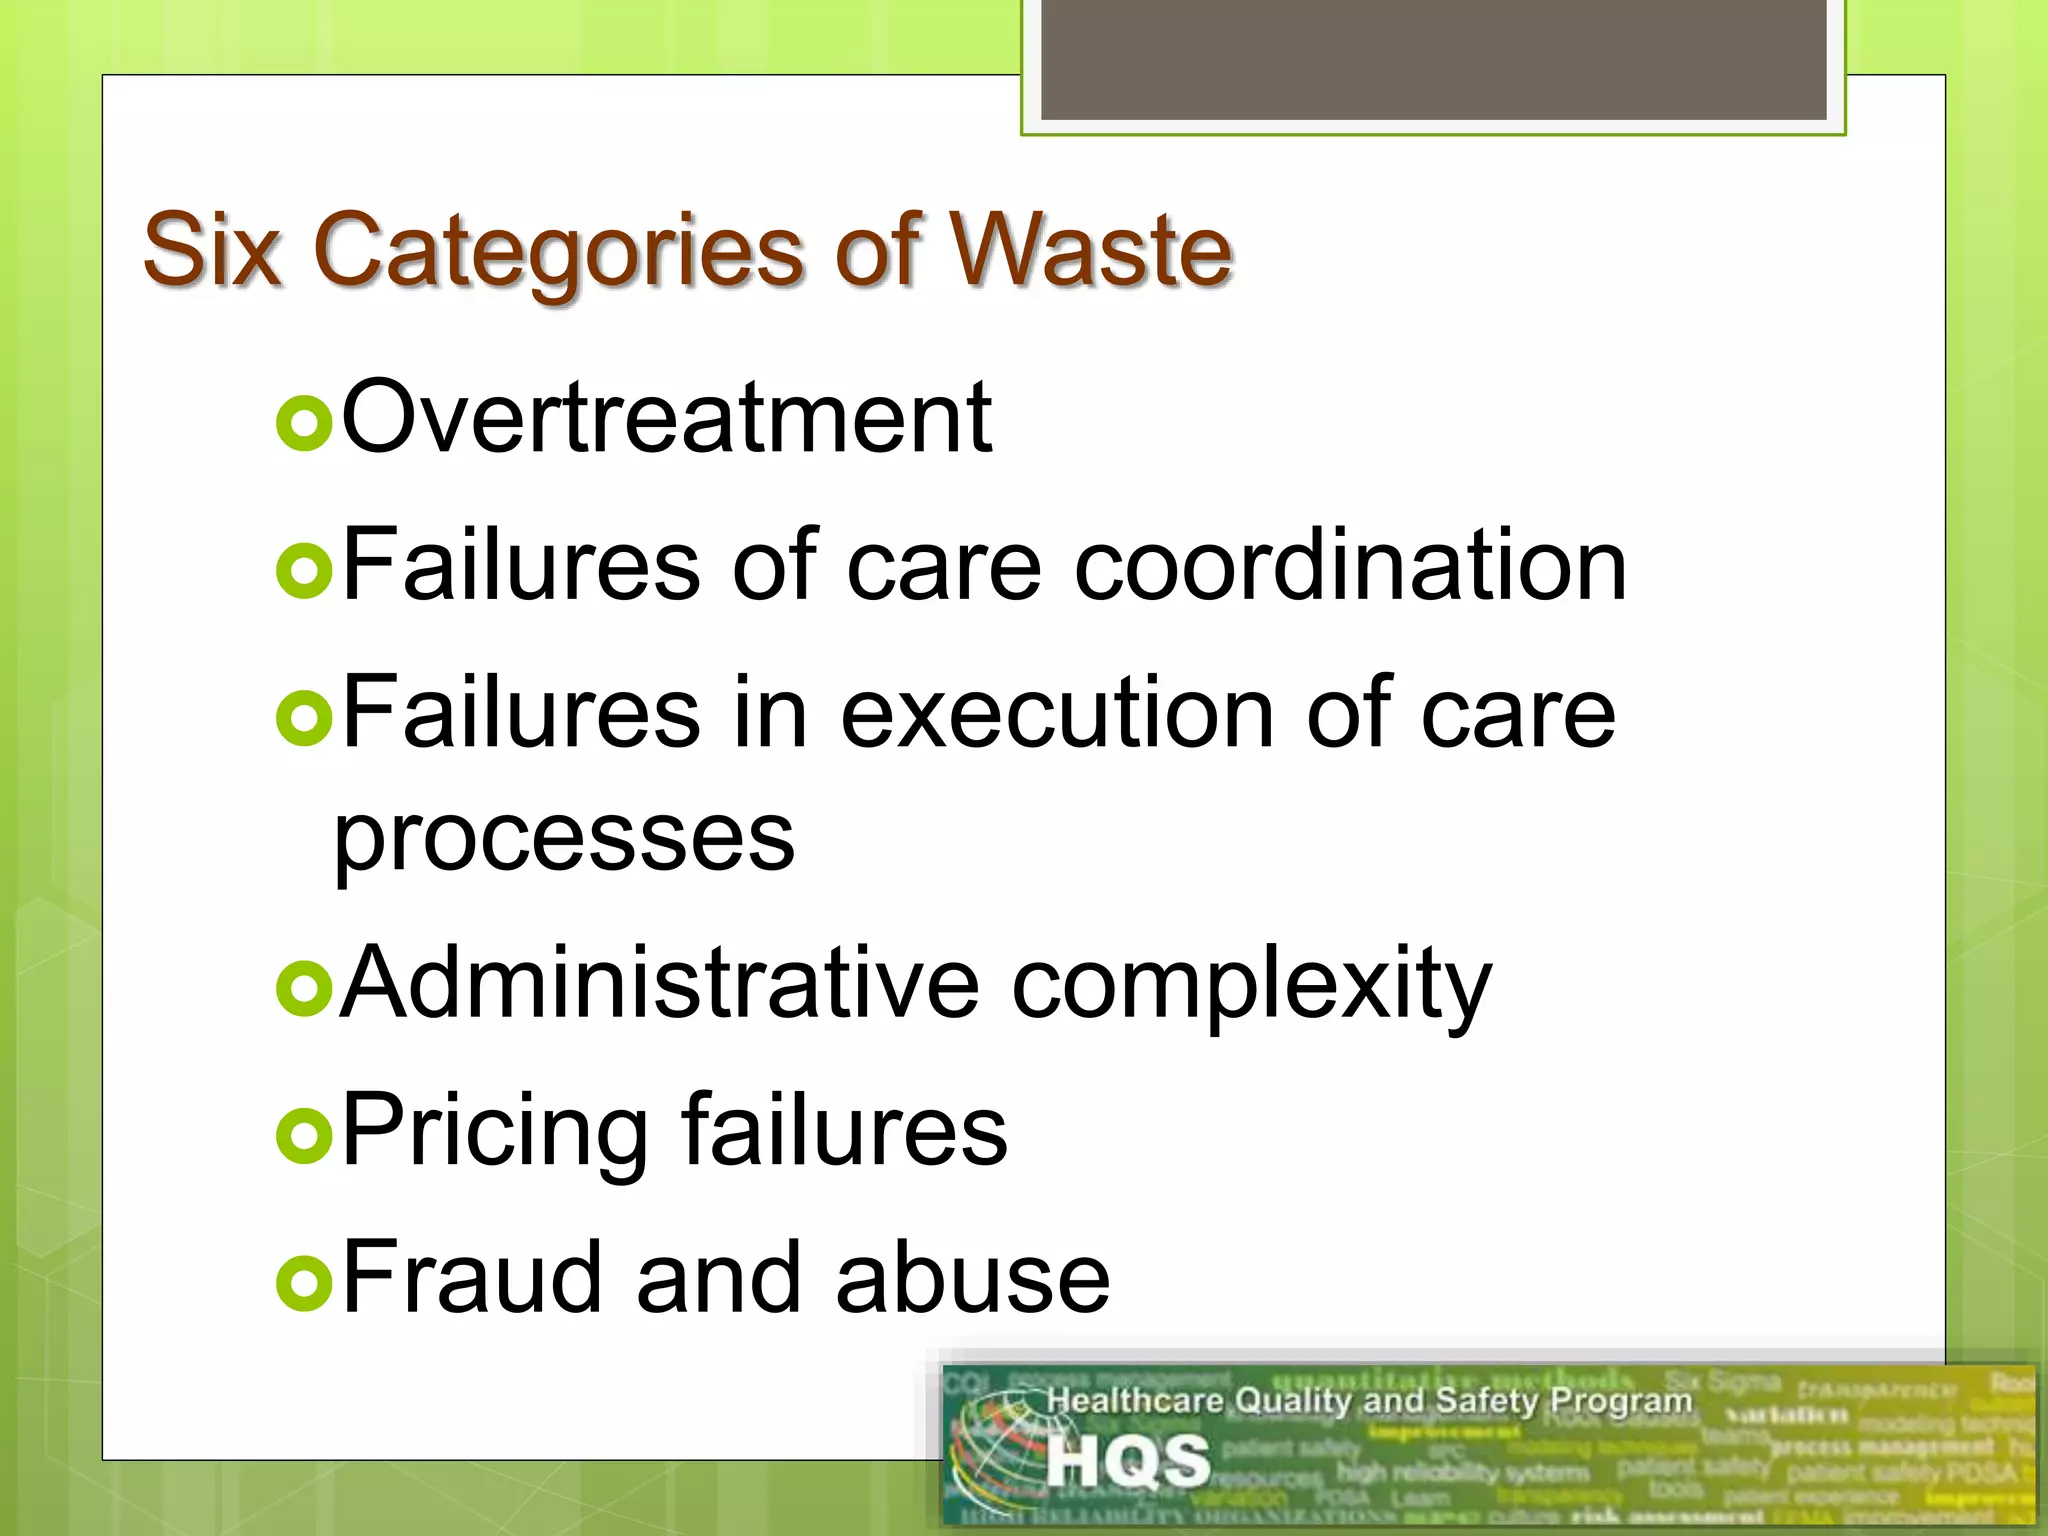
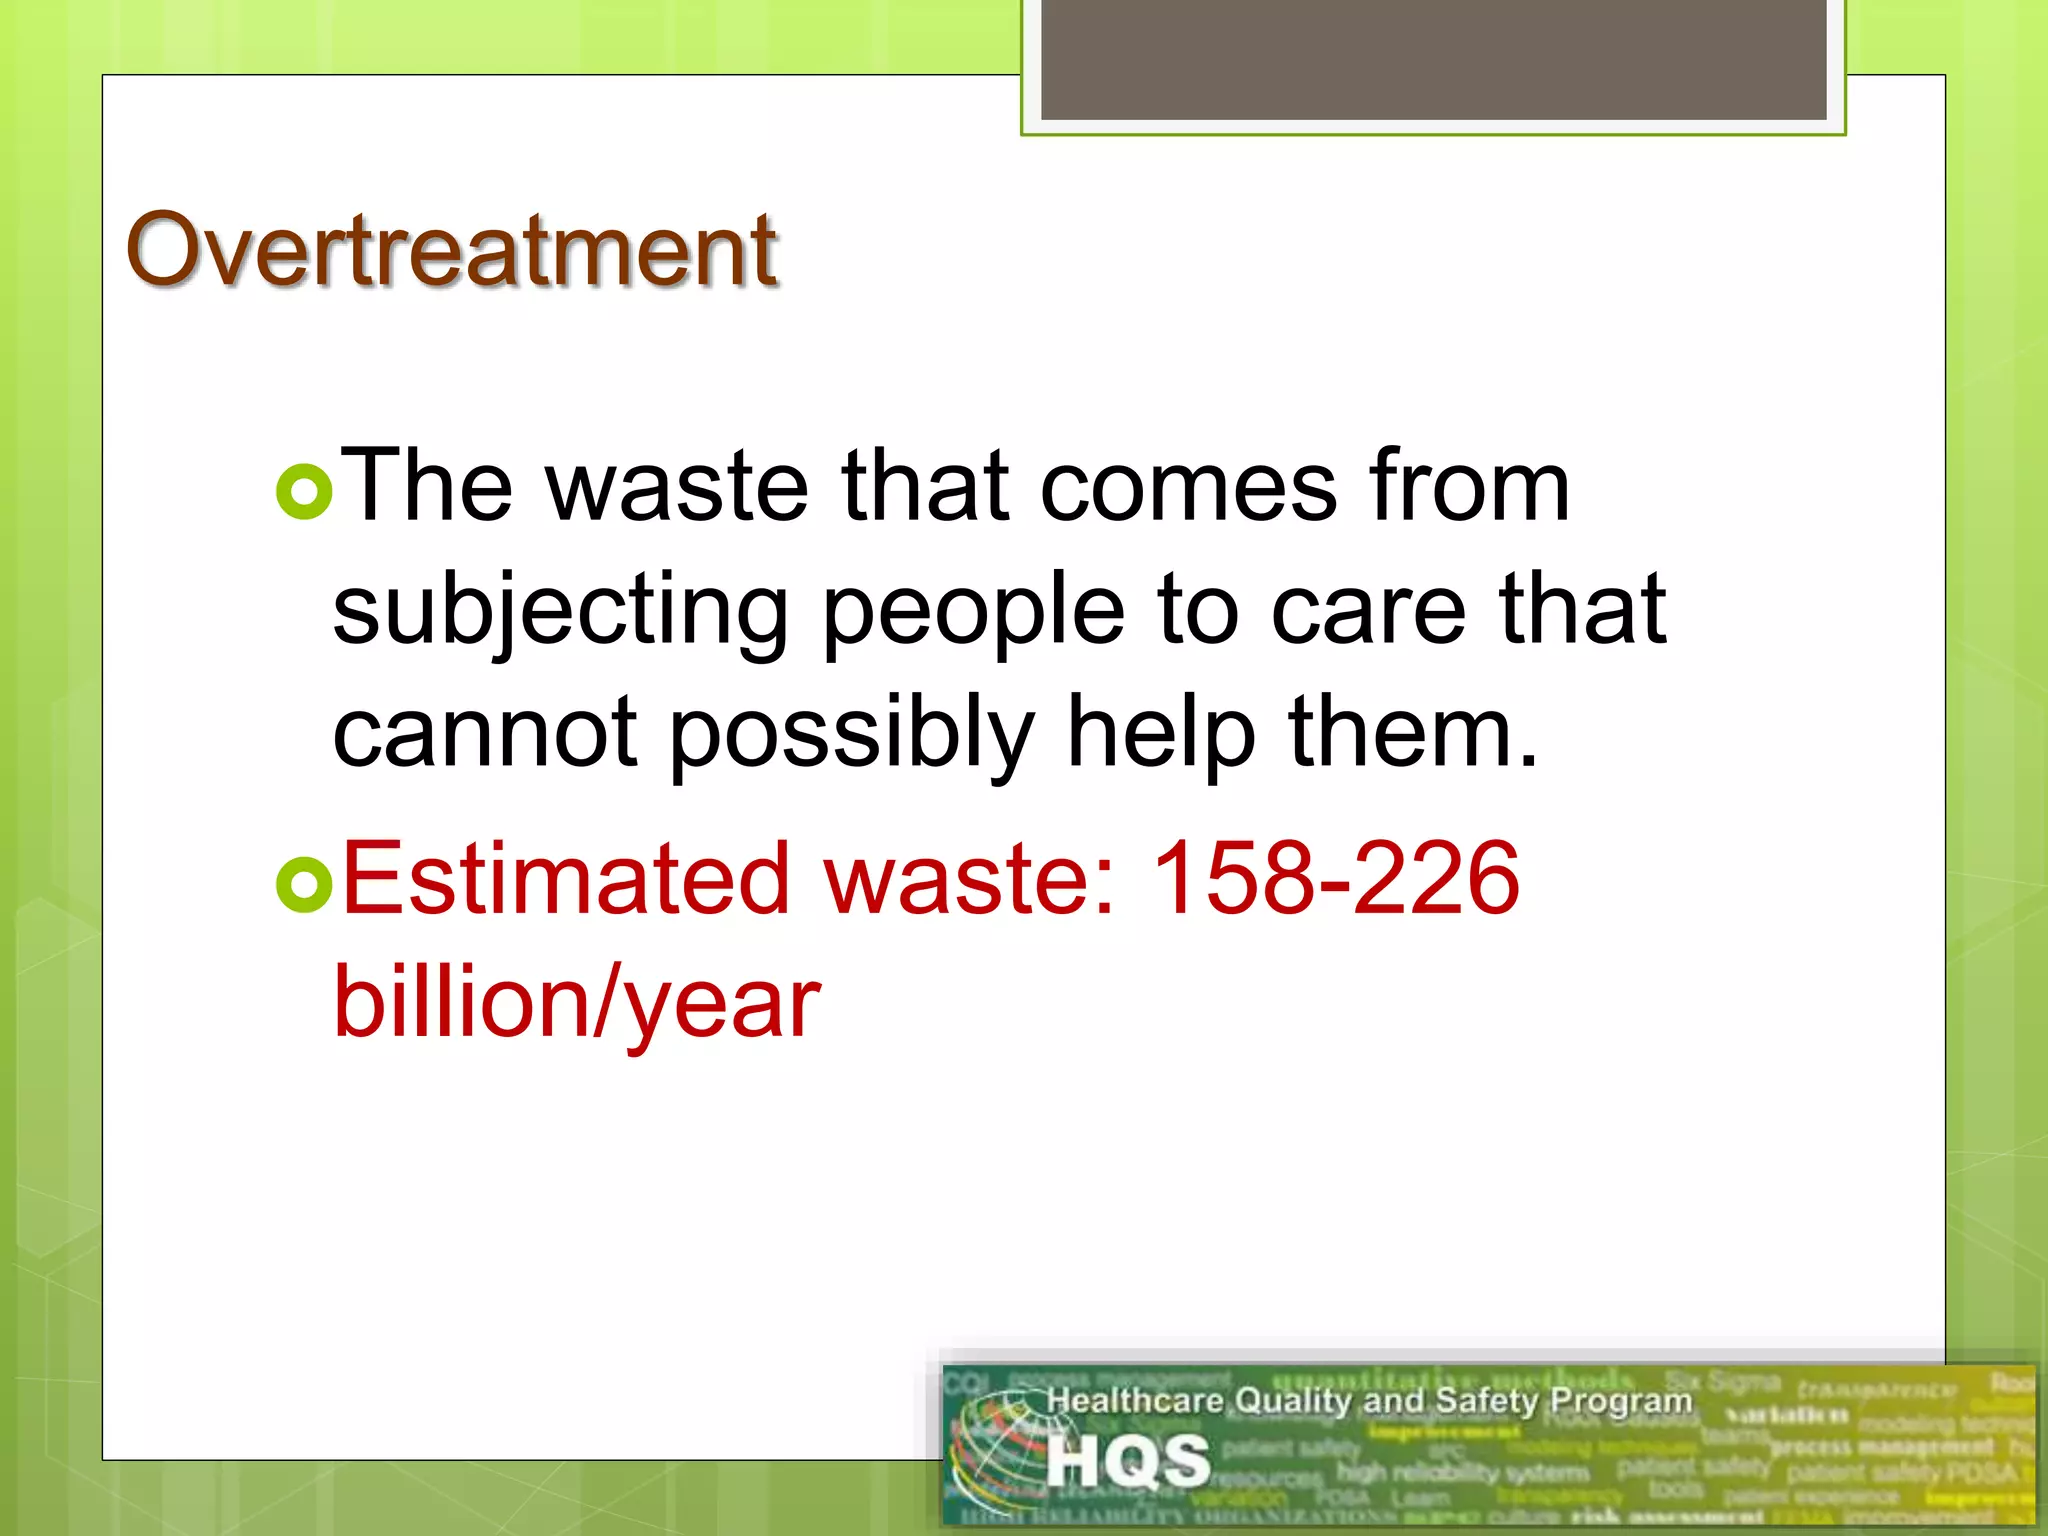
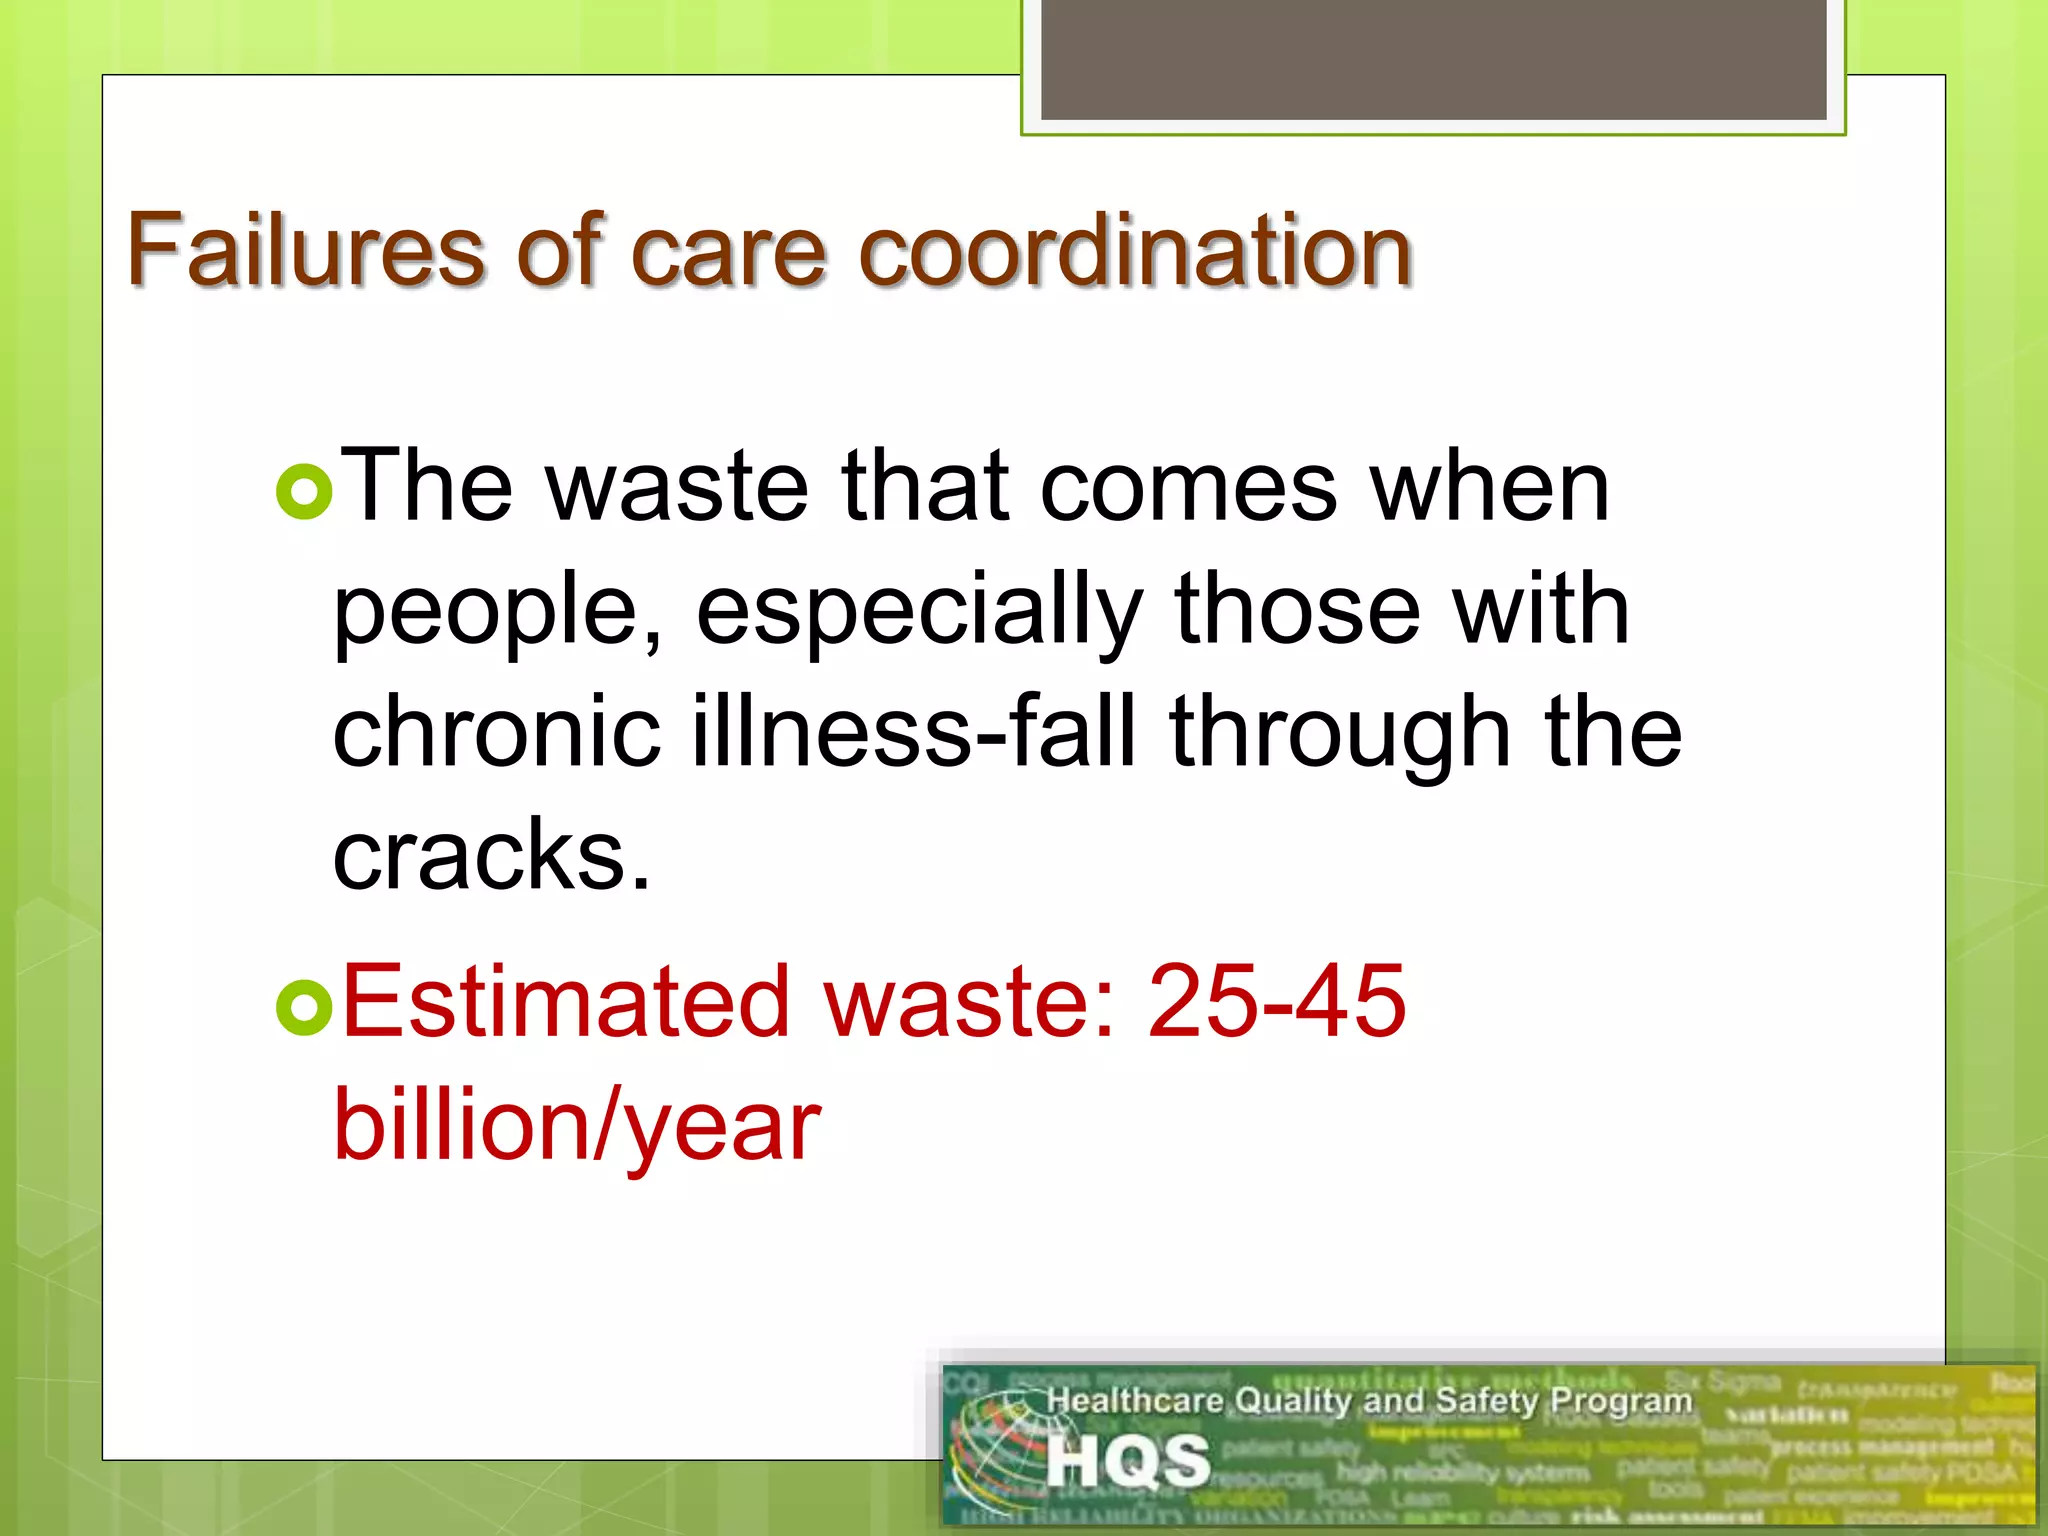
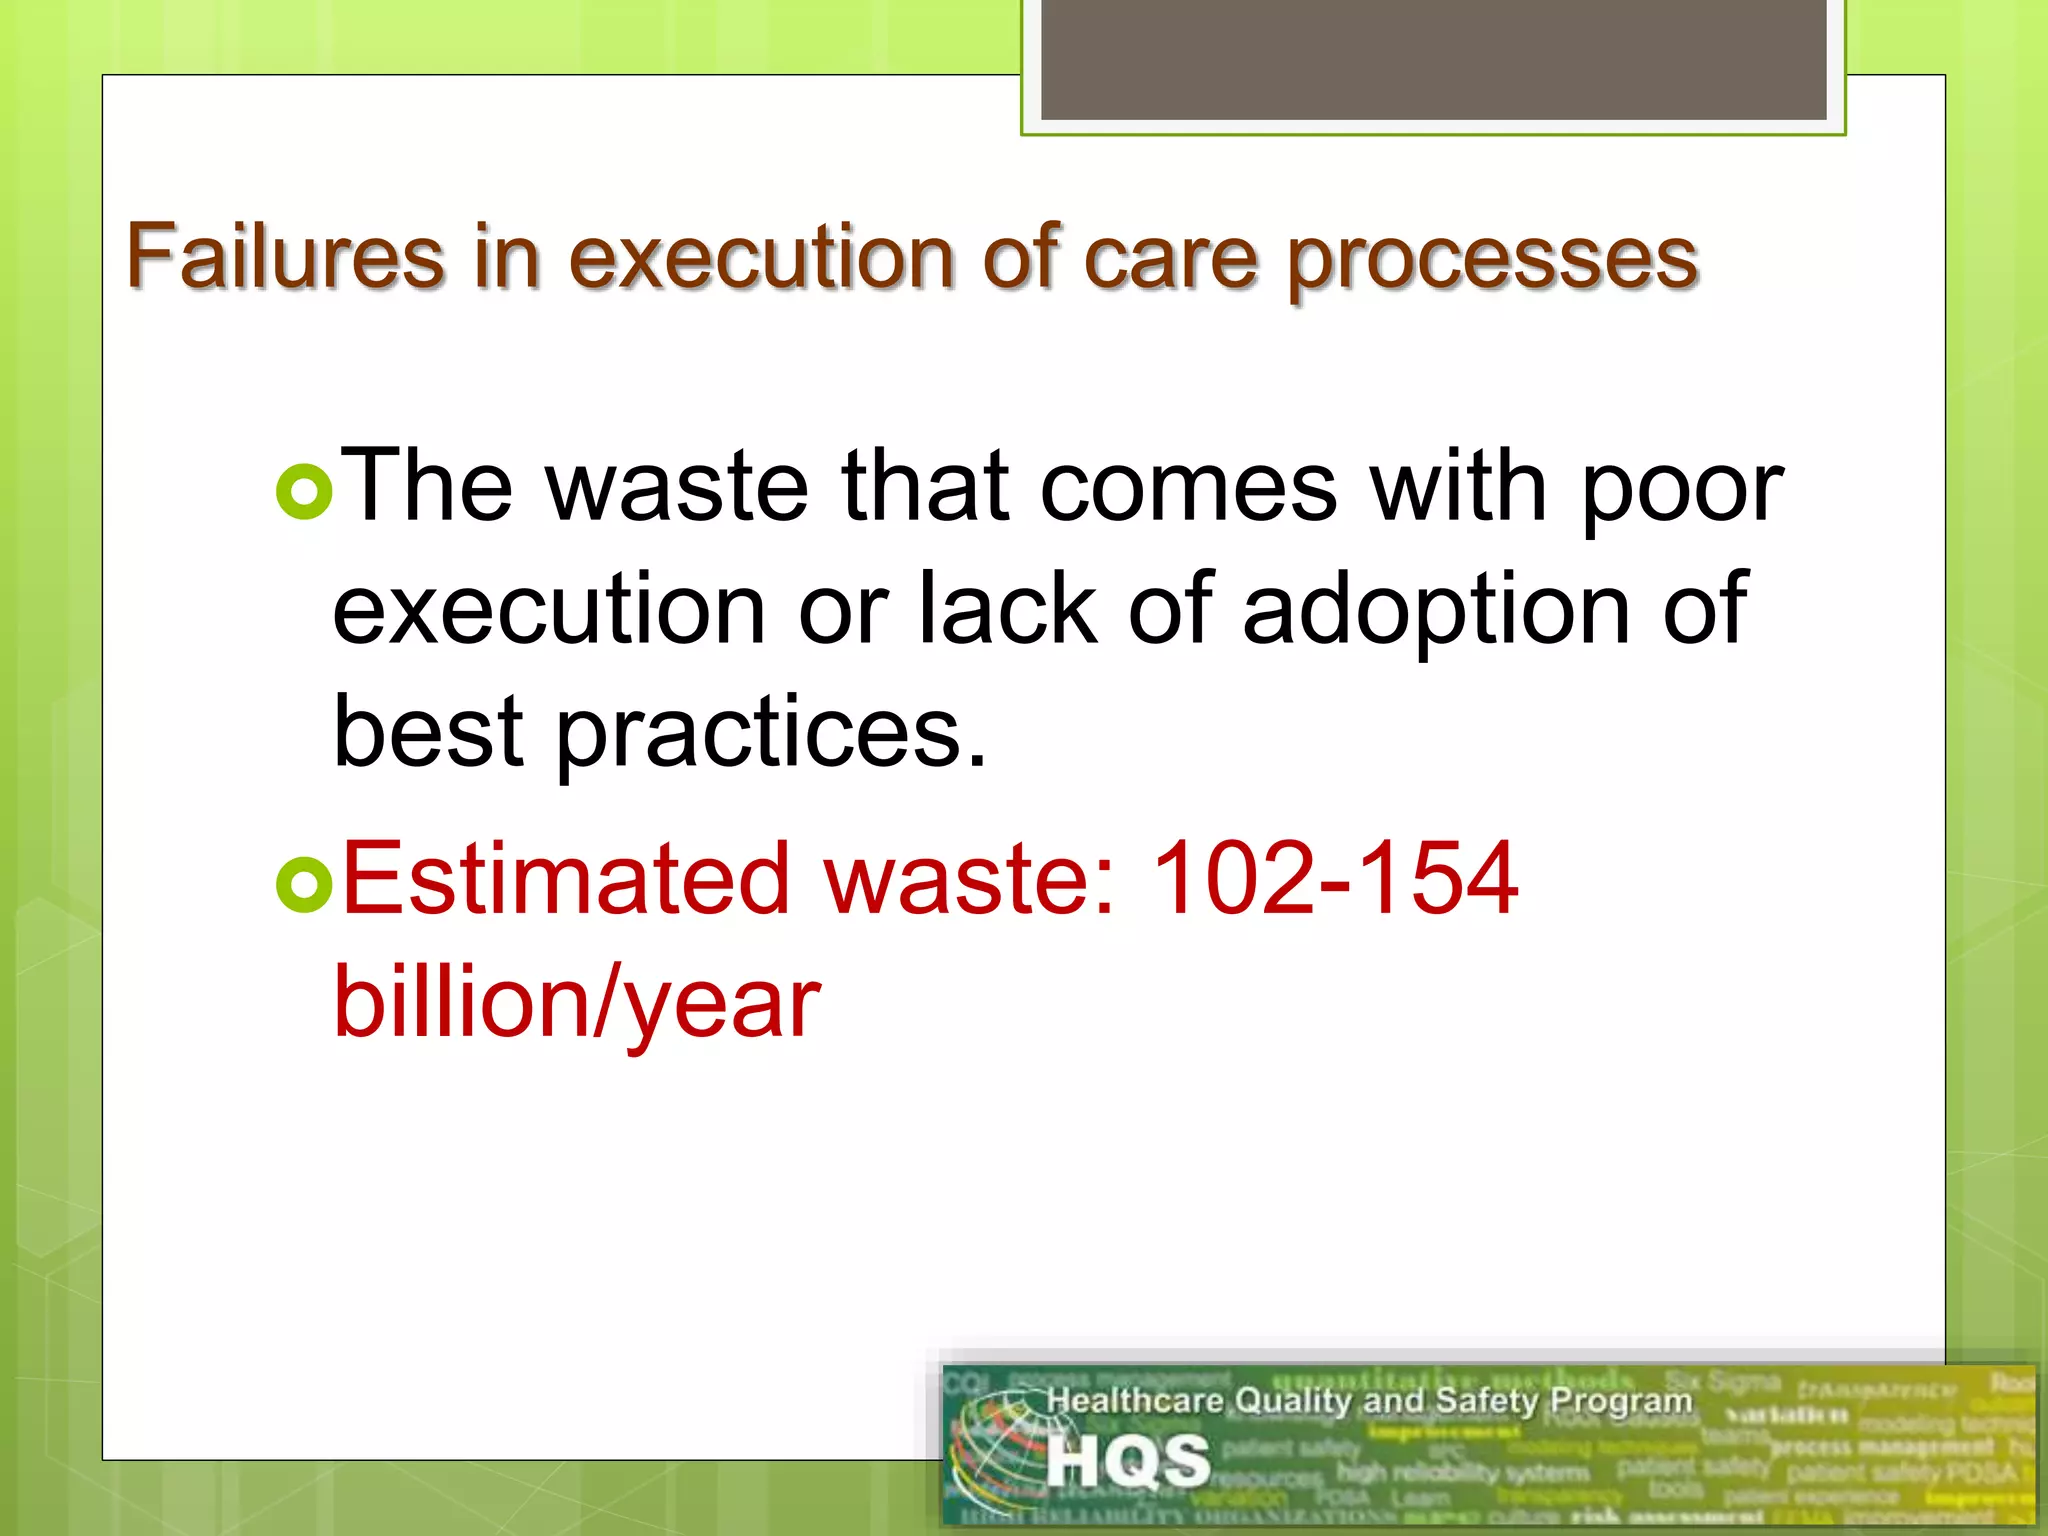
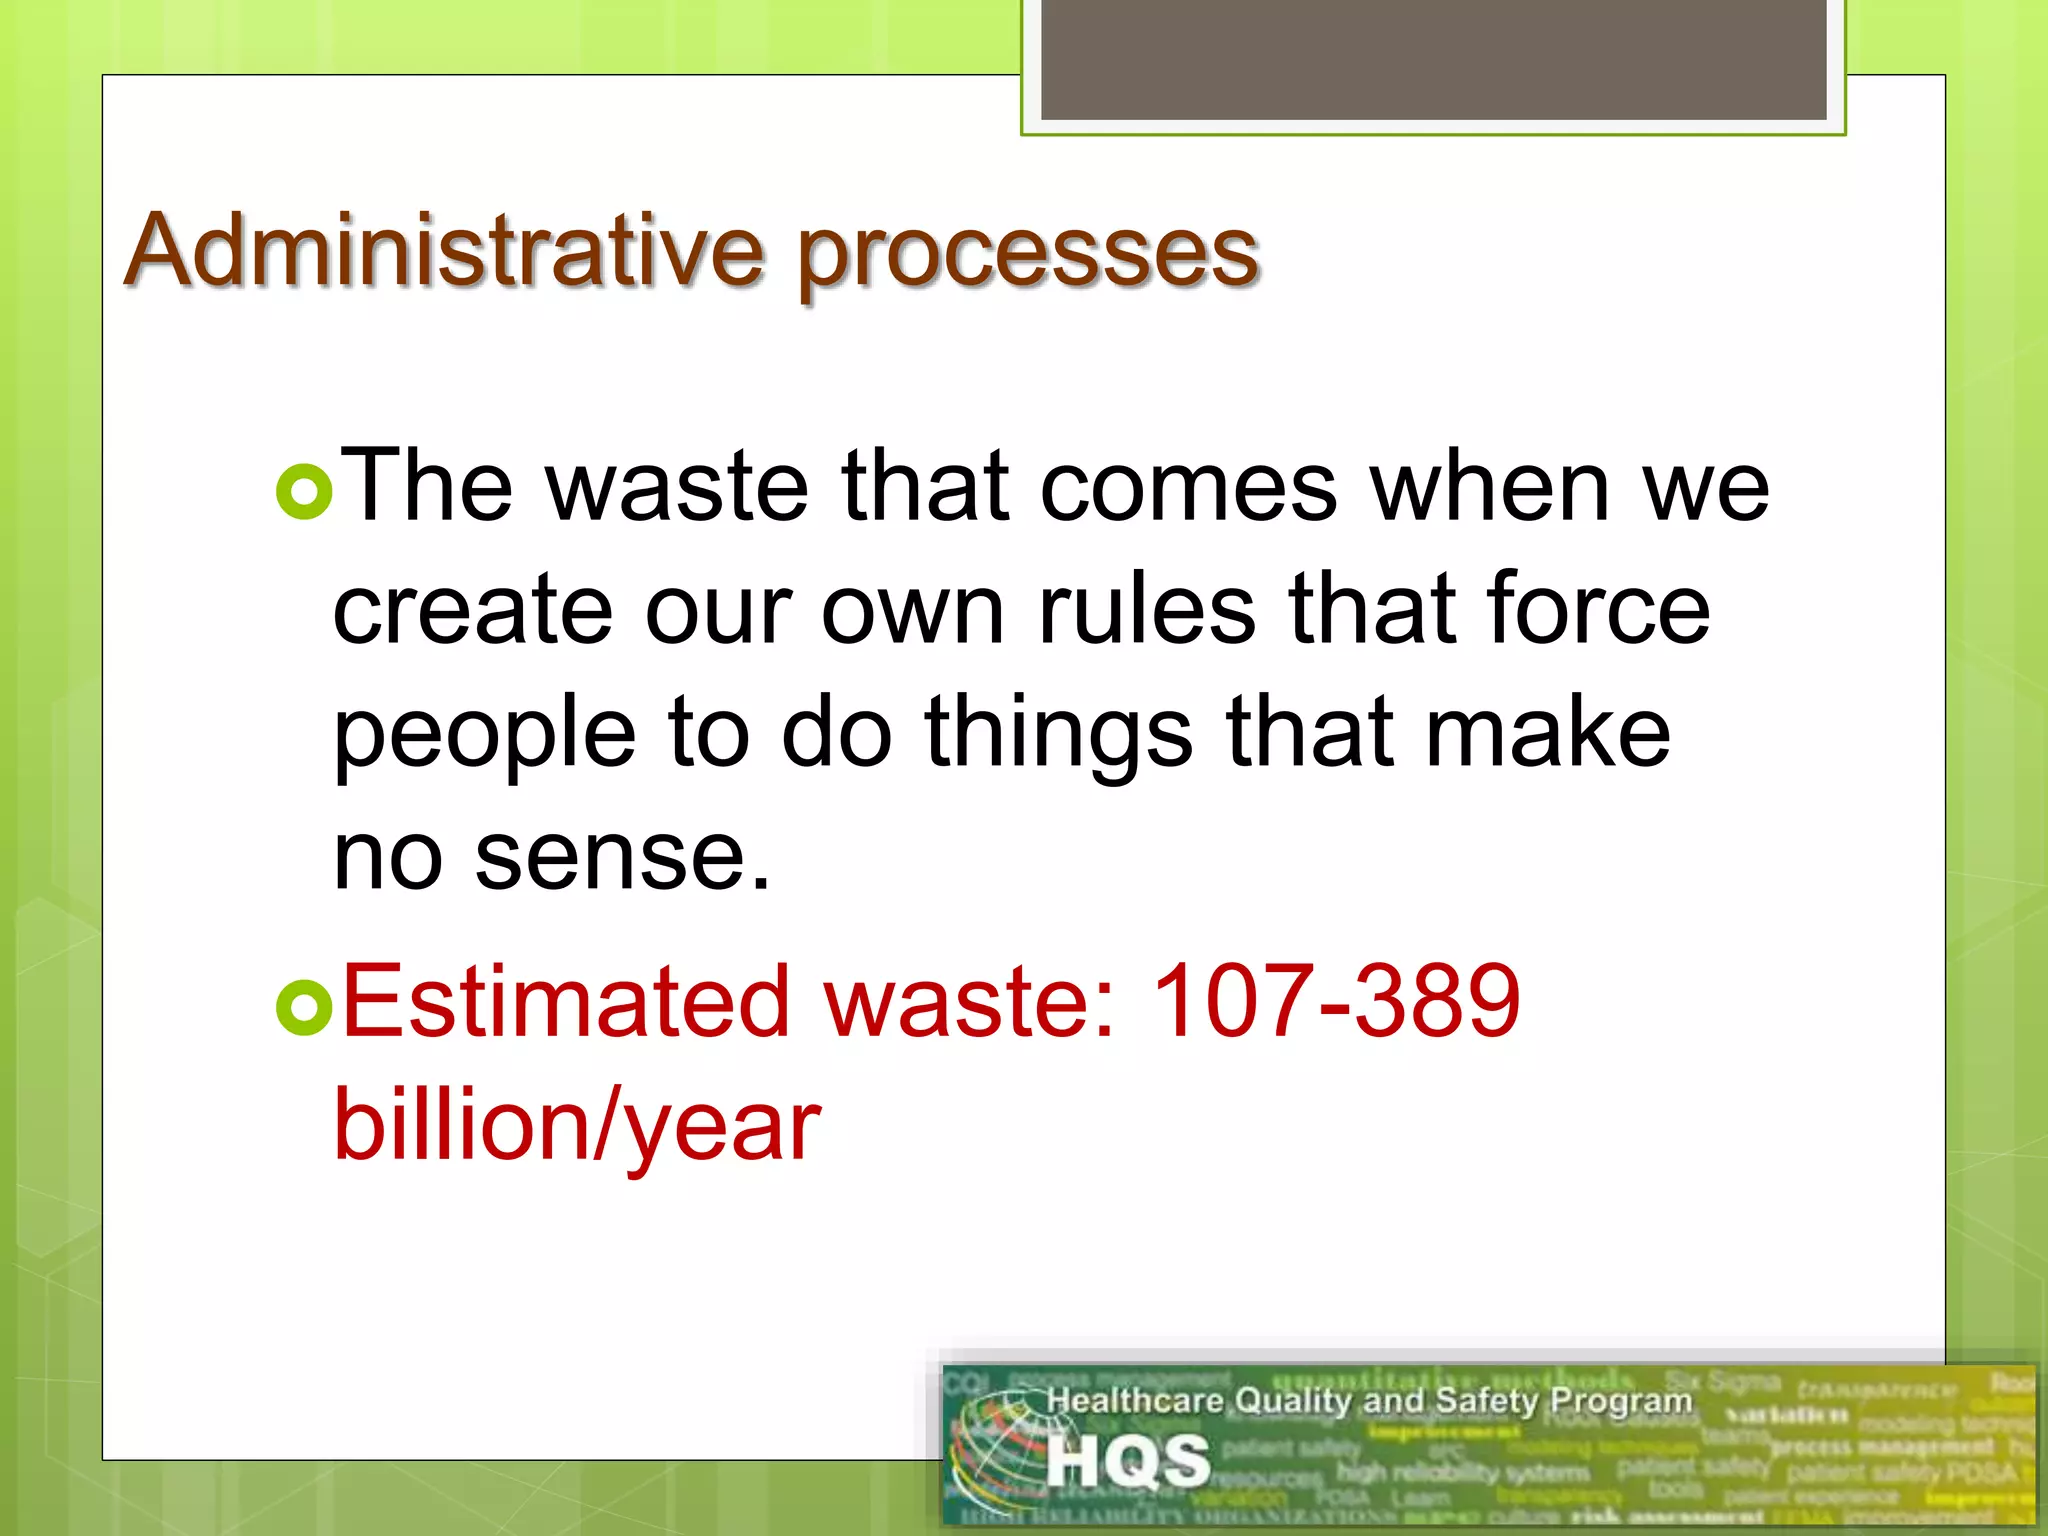
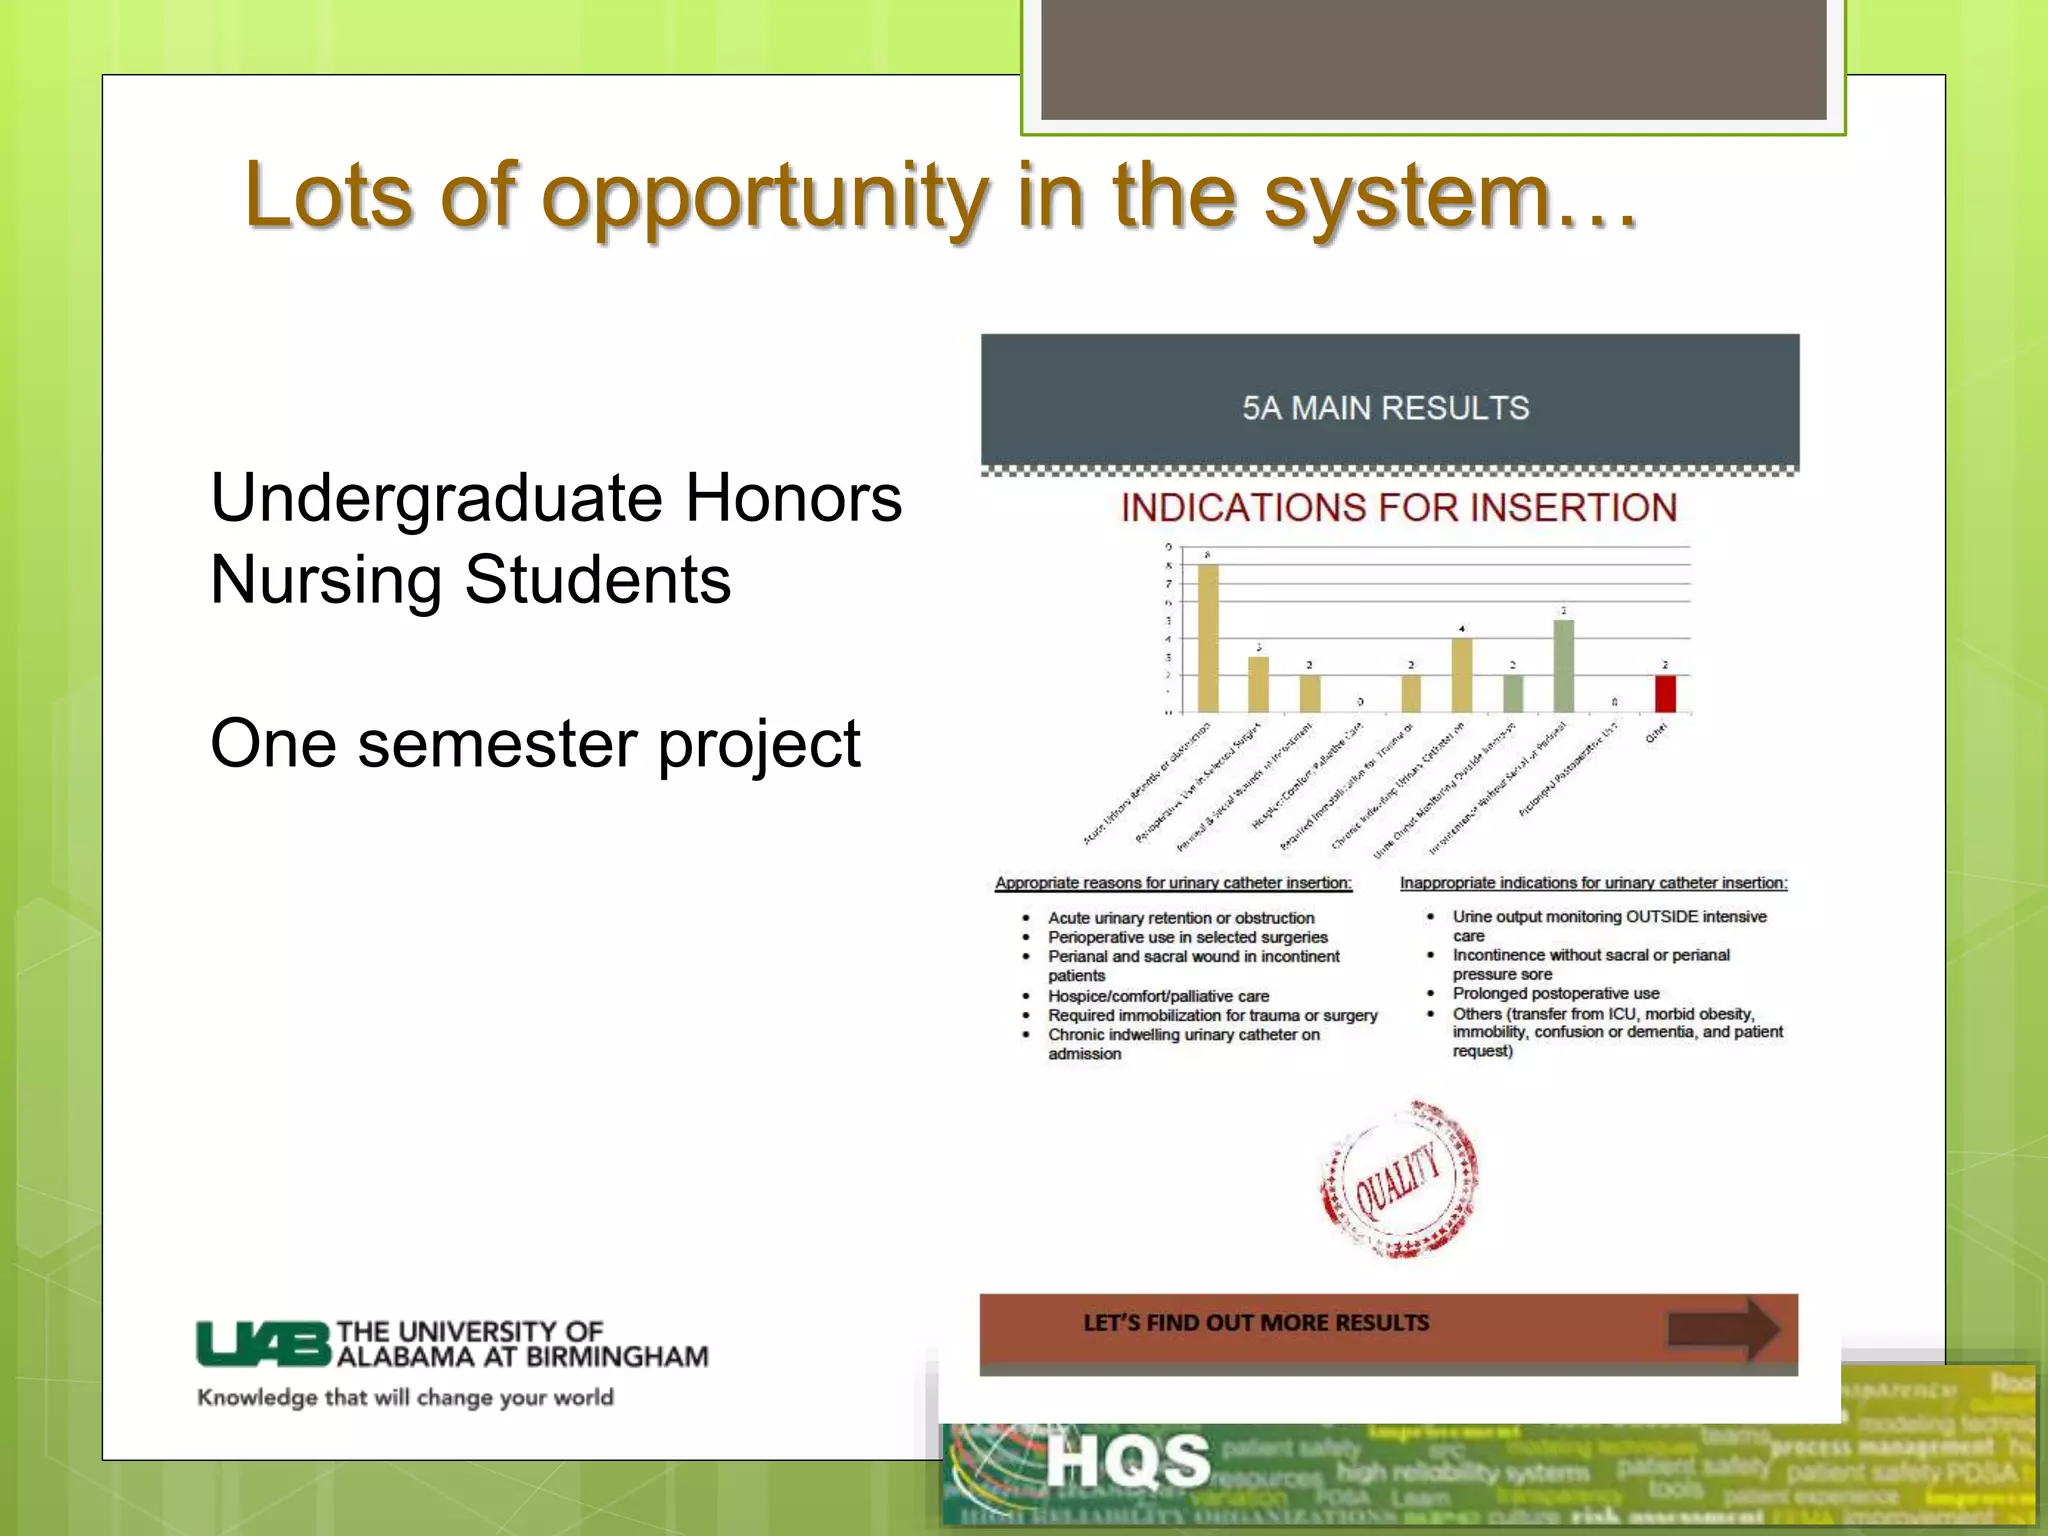
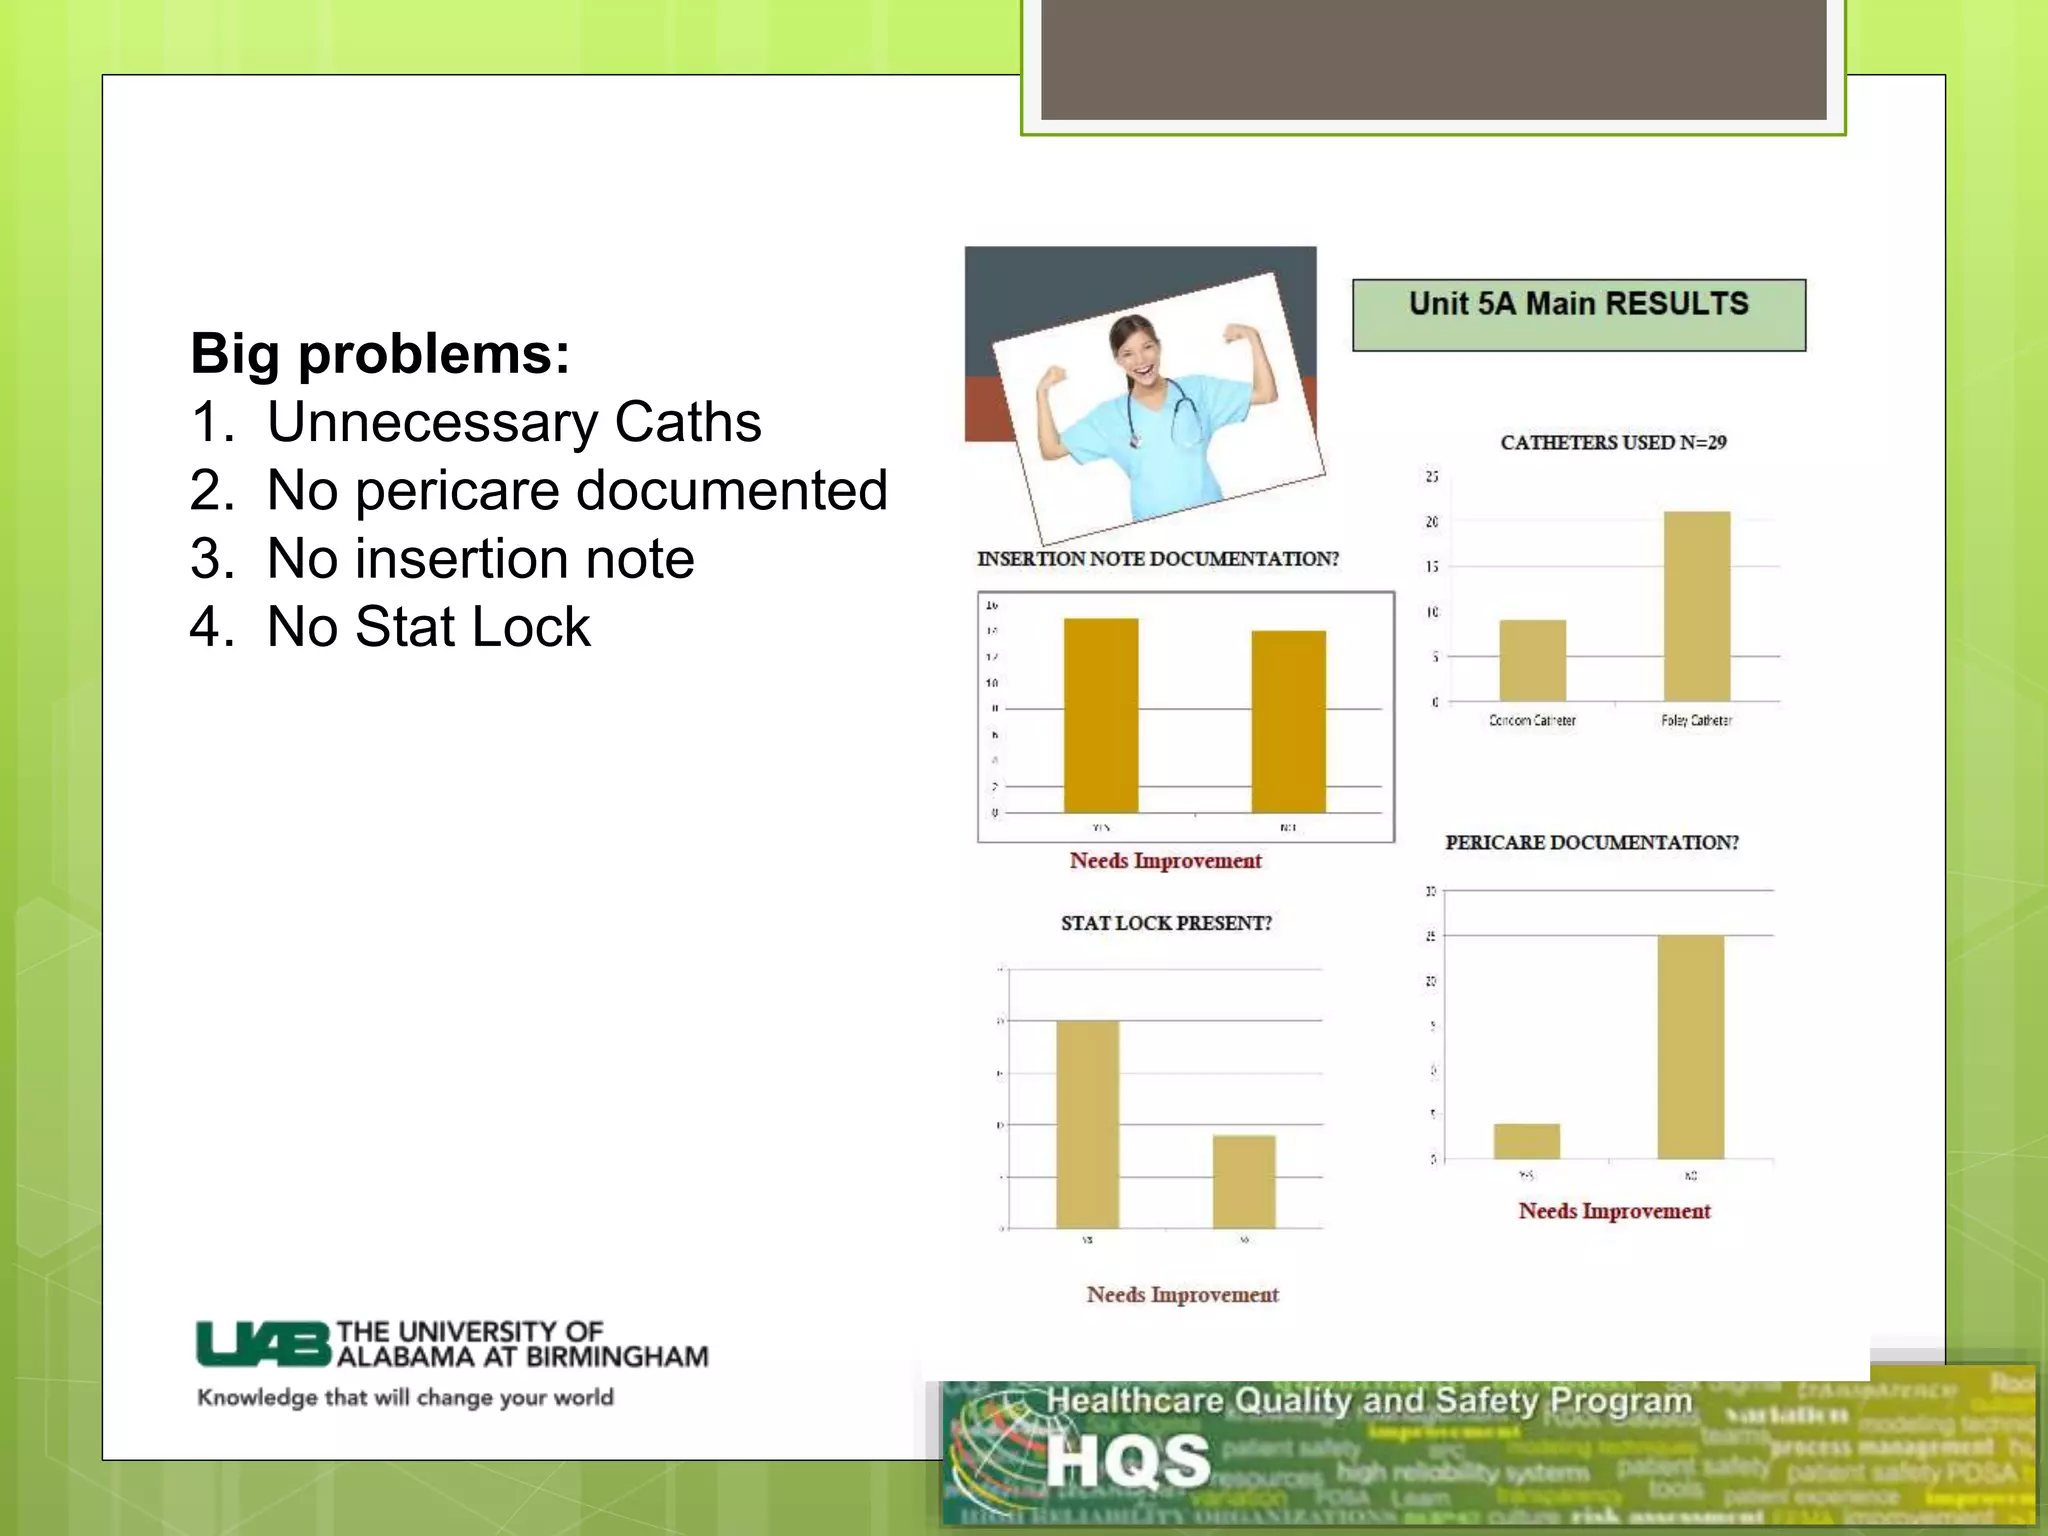
Identifying Problems
Rebecca S. (Suzie) Miltner, PhD, RN
Associate Professor, School of Nursing
Six Broad Aims of Quality Health Care
 S Safe
 T Timely
 E Effective
 E Efficient
 E Equitable
 P Patient-centered
Crossing the Quality Chasm: A New Health System for the 21st Century (2001)
$147
$356
$1,112
$2,851
$4,884
$5,240
$5,687
$6,131
$6,504
$6,900
$7,271
$7,651
$7,933
$8,157
$8,411
$8,658$8,925
$0
$1,000
$2,000
$3,000
$4,000
$5,000
$6,000
$7,000
$8,000
$9,000
1960 1970 1980 1990 2000 2001 2002 2003 2004 2005 2006 2007 2008 2009 2010 2011 2012
NOTE: According to CMS, population is the U.S. Bureau of the Census resident-based population, less armed forces overseas and their
dependents. SOURCE: Kaiser Family Foundation calculations using NHE data from Centers for Medicare and Medicaid Services, Office of the
Actuary, National Health Statistics Group, at http://www.cms.hhs.gov/NationalHealthExpendData/ (see National Health Expenditures by type of
service and source of funds; file nhe12.zip); Gross Domestic Product data from Bureau of Economic Analysis, at
http://bea.gov/national/index.htm#gdp (file gdplev.xls).
How Much Do We Spend?
National Health Expenditures per Capita, 1960-2012
NHE as
a Share
of GDP 5.0% 7.0% 8.9% 12.1% 13.4% 14.1% 14.9% 15.4% 15.5% 15.5% 15.6% 15.9% 16.4% 17.4% 17.4% 17.3% 17.2%
Avoiding underuse
 (e.g. not screening a person for high blood
pressure)
Avoiding overuse
 (e.g. performing tests that a patient doesn’t need)
Eliminating misuse
 (e.g. providing medications that may have
dangerous interactions)
Reducing Variation in Care
Putting a percentage of Medicare dollars
at risk
By 2017, at risk = 6%
3 areas of focus:
 Value Based Purchasing
 Readmissions
 Hospital acquired conditions
The Impact of CMS Changes
 Healthcare is almost 18%
of the GDP and is headed
for 20% of the GDP by
2020.
 We can lower payments
or pay for fewer services.
 Or we could eliminate
waste.
What can we do to reduce costs?
Overtreatment
Failures of care coordination
Failures in execution of care
processes
Administrative complexity
Pricing failures
Fraud and abuse
Six Categories of Waste
The waste that comes from
subjecting people to care that
cannot possibly help them.
Estimated waste: 158-226
billion/year
Overtreatment
The waste that comes when
people, especially those with
chronic illness-fall through the
cracks.
Estimated waste: 25-45
billion/year
Failures of care coordination
The waste that comes with poor
execution or lack of adoption of
best practices.
Estimated waste: 102-154
billion/year
Failures in execution of care processes
The waste that comes when we
create our own rules that force
people to do things that make
no sense.
Estimated waste: 107-389
billion/year
Administrative processes
The waste that comes when
prices migrate far from the
actual costs of production plus
fair profits.
Estimated waste: 84-178
billion/year
Pricing failures
The waste that comes when
thieves issue fake bills and run
scams as well as the inspection
and regulation costs due to
these thieves.
Estimated waste: 82-272
billion/year
Fraud and Abuse
Lots of opportunity in the system…
Undergraduate Honors
Nursing Students
One semester project
Big problems:
1. Unnecessary Caths
2. No pericare documented
3. No insertion note
4. No Stat Lock
Big problems:
1. Unnecessary Caths
2. No pericare documented
3. No insertion note
4. No Stat Lock
Intervention:
Educate the (day shift) staff.
Results
Lots of opportunity in the system…
But what about things that WE can fix?
Problem Identification
What is the problem?
Where does it come from (up or down)?
How do you define it?
20
Problem Identification
How do you feel about it?
What data do you have about your problem?
What will you do about it?
21
Usual Ideas to Fix a Problem
We need more people
We need more money
We need more time
We need to make people work harder
22
23
Where ideas to fix problems comes from
Transformational
 Big changes
 Culture shift
 Usually top-down
24
Where ideas to fix problems comes from
 Transformational
 Major changes
 Culture shift
 Usually top-down
 Incremental
 Small changes
 Slight change in a procedure to improve efficiencies
 Sometimes unnoticed by management
Barriers to Problem Solving
-25-
Looking for perfection
Fear of failure
Gathering Data to Understand a
Process: Suggested Steps
1. Observe processes (formal and informal)
2. Interview key personnel (voice of the
customer)
3. Create a process map
4. Collect data
Observe the Process
Process Observation
Process Observation Worksheet
Data collection tool
 Determine time for and between steps
 Time to complete a step (duration)
 Distance traveled (steps)
Standardized
 Ensure data is complete
 Reliable and Repeatable
Process Observation Worksheet
Example
on Worksheet
Process: Patient check-in
Step # Description Distance
Clock
Time
Task
Time
Wait
Time Observations
0:00
1 Patient arrives 0:10 0:10
2 Clerk requests ID 0:13 0:03
3 Patient registered (Y/N) N
3A Patient sent to HBU 575 0:15 0:02
3B HBU registers patient 0:47 0:32 0:20
4 Appointment (Y/N) 575 N
4A Make walk-in appointment 0:50 0:03
5 Check patient in 0:52 0:02
6 Patient sent to waiting room 100 0:56 0:04
Enter time that step
was completed.
Distance traveled
In steps
Task time calculated
later…
Intrapartum Nursing Observation Tool
 Check sheet to record
observed interventions
 Twenty-three specific
interventions and other
categories
 Observed care for 30
seconds and recorded
data during next 30
seconds
 All interventions
observed were recorded
 Kappa .95
In Pt Room 1 1 1 1
Surv-Hx
Surv-MVS
Surv-EFM 1 1
Surv-Med Effects
Surv-post-epi
Surv-Fetal Resus
Other Surv 1
IC-Document 1 1 1
IC-Proc Prep
IC-Assist HCP 1 1
IC-Discuss HCP 1
Other IC 1
Info-Relax
Info-Pain
Info-Fetus
Info-Procedures
Info-Pushing
Other Info
Emo-Presence
Emo-coach
Emo-Praise
Emo-Encourage
Other Emo 1 1 1
Spaghetti Diagrams
Also known as a movement or
transportation diagram
 Shows the pattern of movement of staff,
patient, or object
Visually displays movement
Helps identified unnecessary movement
Guides space redesign
Hagg- Woodbridge
2008
Spaghetti Diagram
Clinic 5 Room Turnover Project
Exam Room
Exam Room
Exam Room
Exam Room
ExamRoom
Exam Room
Exam Room
RN Station
Exam Room
Exam Room
Exam Room
Exam Room
Exam Room
ExamRoom
ExamRoom
ExamRoom
Check-in
Provider
Charting
Procedures
Calls Patient
“6+ Miles per Day”
Voice of the Customer
One of the first steps in understanding the
problem:
Understand what the customer values
Customers are:
 Patients and their families
 Other stakeholders (e.g., community, Board of
Directors, etc.)
 Internal users of the service
Example from IAD project
For nursing staff (MICU and 5M):
1. If you have an incontinent patient, what makes
it hard to take care of them?
2. If you have an incontinent patient, what makes
it easier to take care of them?
3. In a perfect world, what do you need to take
care of them?
4. Do you have any special interventions (things
you do, “tricks”) that you use to take care of
incontinent patients?
Example from IAD project
For Physicians:
1. What is your involvement in managing
patients with incontinence?
2. How does incontinence affect your plan
of care for the patient?
Questions for Patients
We are working on a project to improve the way we take
care of patients who have problems with toileting while
they are in the hospital.
1. Since you have been here, have you had a problem
getting to the bathroom or using the bedpan or urinal in
time?
2. While you have been here, what are the nurses or
doctors doing to help you manage this problem?
3. What seems to be working?
4. What seems not to work?
5. What suggestions do you have that would make this
better for you?
Map the Process: next topic
Collect Data: throughout the QA!
40
Skills Exercise:
Problem Identification
Get in groups of 5-6 people and discuss the case study.
Consider the following questions:
 What problem are you facing?
 How do you feel about it?
 What data do you have about your problem?
 What additional data do you need?
 What are your data telling you?
 What will you do about it?
Problem Statements
After gaining understanding, describe the
problem, opportunity or objective in
concise, measurable terms.
Include a summary of the problem and
the impact (aka the “PAIN”)
Problem Statements
A brief description of the problem and the
metric used to describe the problem
Where the problem is occurring by
process name and location
The time frame over which the problem
has been occurring
The size or magnitude of the problem
http://www.dummies.com/how-to/content/how-to-write-a-problem-statement-for-six-sigma.html
Problem Statements
 Poor Problem Statement: Human resources is
taking too long to fill vacancies.
 Better Problem Statement: Recruiting time for
registered nurses on the medical surgical units
at UAB is over 120 days when the stated goal is
60 days. With an average of 50 med/surg
vacancies a month, this delay is adding $27,000
per month in overtime and contractor labor, and
may result in poorer continuity of care and
increased errors.
Example Problem Statement
 Low mobility is common among hospitalized
patients and is associated with adverse
outcomes.
Example Problem Statement
 Low mobility (defined as bed and bed to chair activity
only) is common among hospitalized patients and is
associated with adverse outcomes including functional
decline and increased community care needs. In a
study at the BVAMC, geriatric hospitalized patients
spend an average of 83% of the time lying in bed. This
can lead to acute decline in functional status rendering
the patient dependent in ambulation which can lead to
increased LOS. Financial data suggests an
opportunity for improvement as well as there is >
$41,000 per quarter spend on home health PT after
hospitalization
Skills Exercise:
Problem Identification
Using your work from the previous case
study, WRITE a problem statement.
47
An important thing to consider….
Readiness for change
Be aware of the organization’s readiness to
change
Is the timing right?
Do you have support of leadership?
Do you have resources?
Does your team think they can do it?
49
Readiness for Change
Organizational Change influenced by:
Commitment to change
Capability to change (change efficacy)
Weiner, BJ (2009). A theory of organizational readiness for change.
Adapted from Weiner, BJ (2009). A theory of organizational readiness for change.
Possible Contextual
Factors
•Organizational Culture
•Policies and Procedures
•Past Experiences
•Organizational Resources
•Organizational Structure
Change Valence
(Value of Change)
Capability
•Task Demands
•Resource
Perceptions
•Situational Factors
Organizational
Readiness for Change
•Change Commitment
•Change Efficacy
Change Related Effort
•Initiation
•Persistence
•Cooperative Behavior
Implementation
Effectiveness
Organizational Readiness for Change

Identifying Problems

  • 1.
    Identifying Problems Rebecca S.(Suzie) Miltner, PhD, RN Associate Professor, School of Nursing
  • 2.
    Six Broad Aimsof Quality Health Care  S Safe  T Timely  E Effective  E Efficient  E Equitable  P Patient-centered Crossing the Quality Chasm: A New Health System for the 21st Century (2001)
  • 3.
    $147 $356 $1,112 $2,851 $4,884 $5,240 $5,687 $6,131 $6,504 $6,900 $7,271 $7,651 $7,933 $8,157 $8,411 $8,658$8,925 $0 $1,000 $2,000 $3,000 $4,000 $5,000 $6,000 $7,000 $8,000 $9,000 1960 1970 19801990 2000 2001 2002 2003 2004 2005 2006 2007 2008 2009 2010 2011 2012 NOTE: According to CMS, population is the U.S. Bureau of the Census resident-based population, less armed forces overseas and their dependents. SOURCE: Kaiser Family Foundation calculations using NHE data from Centers for Medicare and Medicaid Services, Office of the Actuary, National Health Statistics Group, at http://www.cms.hhs.gov/NationalHealthExpendData/ (see National Health Expenditures by type of service and source of funds; file nhe12.zip); Gross Domestic Product data from Bureau of Economic Analysis, at http://bea.gov/national/index.htm#gdp (file gdplev.xls). How Much Do We Spend? National Health Expenditures per Capita, 1960-2012 NHE as a Share of GDP 5.0% 7.0% 8.9% 12.1% 13.4% 14.1% 14.9% 15.4% 15.5% 15.5% 15.6% 15.9% 16.4% 17.4% 17.4% 17.3% 17.2%
  • 4.
    Avoiding underuse  (e.g.not screening a person for high blood pressure) Avoiding overuse  (e.g. performing tests that a patient doesn’t need) Eliminating misuse  (e.g. providing medications that may have dangerous interactions) Reducing Variation in Care
  • 5.
    Putting a percentageof Medicare dollars at risk By 2017, at risk = 6% 3 areas of focus:  Value Based Purchasing  Readmissions  Hospital acquired conditions The Impact of CMS Changes
  • 6.
     Healthcare isalmost 18% of the GDP and is headed for 20% of the GDP by 2020.  We can lower payments or pay for fewer services.  Or we could eliminate waste. What can we do to reduce costs?
  • 7.
    Overtreatment Failures of carecoordination Failures in execution of care processes Administrative complexity Pricing failures Fraud and abuse Six Categories of Waste
  • 8.
    The waste thatcomes from subjecting people to care that cannot possibly help them. Estimated waste: 158-226 billion/year Overtreatment
  • 9.
    The waste thatcomes when people, especially those with chronic illness-fall through the cracks. Estimated waste: 25-45 billion/year Failures of care coordination
  • 10.
    The waste thatcomes with poor execution or lack of adoption of best practices. Estimated waste: 102-154 billion/year Failures in execution of care processes
  • 11.
    The waste thatcomes when we create our own rules that force people to do things that make no sense. Estimated waste: 107-389 billion/year Administrative processes
  • 12.
    The waste thatcomes when prices migrate far from the actual costs of production plus fair profits. Estimated waste: 84-178 billion/year Pricing failures
  • 13.
    The waste thatcomes when thieves issue fake bills and run scams as well as the inspection and regulation costs due to these thieves. Estimated waste: 82-272 billion/year Fraud and Abuse
  • 14.
    Lots of opportunityin the system…
  • 15.
    Lots of opportunityin the system… Undergraduate Honors Nursing Students One semester project
  • 16.
    Big problems: 1. UnnecessaryCaths 2. No pericare documented 3. No insertion note 4. No Stat Lock
  • 17.
    Big problems: 1. UnnecessaryCaths 2. No pericare documented 3. No insertion note 4. No Stat Lock Intervention: Educate the (day shift) staff.
  • 18.
  • 19.
    Lots of opportunityin the system… But what about things that WE can fix?
  • 20.
    Problem Identification What isthe problem? Where does it come from (up or down)? How do you define it? 20
  • 21.
    Problem Identification How doyou feel about it? What data do you have about your problem? What will you do about it? 21
  • 22.
    Usual Ideas toFix a Problem We need more people We need more money We need more time We need to make people work harder 22
  • 23.
    23 Where ideas tofix problems comes from Transformational  Big changes  Culture shift  Usually top-down
  • 24.
    24 Where ideas tofix problems comes from  Transformational  Major changes  Culture shift  Usually top-down  Incremental  Small changes  Slight change in a procedure to improve efficiencies  Sometimes unnoticed by management
  • 25.
    Barriers to ProblemSolving -25- Looking for perfection Fear of failure
  • 26.
    Gathering Data toUnderstand a Process: Suggested Steps 1. Observe processes (formal and informal) 2. Interview key personnel (voice of the customer) 3. Create a process map 4. Collect data
  • 27.
  • 28.
  • 29.
    Process Observation Worksheet Datacollection tool  Determine time for and between steps  Time to complete a step (duration)  Distance traveled (steps) Standardized  Ensure data is complete  Reliable and Repeatable
  • 30.
    Process Observation Worksheet Example onWorksheet Process: Patient check-in Step # Description Distance Clock Time Task Time Wait Time Observations 0:00 1 Patient arrives 0:10 0:10 2 Clerk requests ID 0:13 0:03 3 Patient registered (Y/N) N 3A Patient sent to HBU 575 0:15 0:02 3B HBU registers patient 0:47 0:32 0:20 4 Appointment (Y/N) 575 N 4A Make walk-in appointment 0:50 0:03 5 Check patient in 0:52 0:02 6 Patient sent to waiting room 100 0:56 0:04 Enter time that step was completed. Distance traveled In steps Task time calculated later…
  • 31.
    Intrapartum Nursing ObservationTool  Check sheet to record observed interventions  Twenty-three specific interventions and other categories  Observed care for 30 seconds and recorded data during next 30 seconds  All interventions observed were recorded  Kappa .95 In Pt Room 1 1 1 1 Surv-Hx Surv-MVS Surv-EFM 1 1 Surv-Med Effects Surv-post-epi Surv-Fetal Resus Other Surv 1 IC-Document 1 1 1 IC-Proc Prep IC-Assist HCP 1 1 IC-Discuss HCP 1 Other IC 1 Info-Relax Info-Pain Info-Fetus Info-Procedures Info-Pushing Other Info Emo-Presence Emo-coach Emo-Praise Emo-Encourage Other Emo 1 1 1
  • 32.
    Spaghetti Diagrams Also knownas a movement or transportation diagram  Shows the pattern of movement of staff, patient, or object Visually displays movement Helps identified unnecessary movement Guides space redesign
  • 33.
    Hagg- Woodbridge 2008 Spaghetti Diagram Clinic5 Room Turnover Project Exam Room Exam Room Exam Room Exam Room ExamRoom Exam Room Exam Room RN Station Exam Room Exam Room Exam Room Exam Room Exam Room ExamRoom ExamRoom ExamRoom Check-in Provider Charting Procedures Calls Patient “6+ Miles per Day”
  • 34.
    Voice of theCustomer
  • 35.
    Voice of theCustomer One of the first steps in understanding the problem: Understand what the customer values Customers are:  Patients and their families  Other stakeholders (e.g., community, Board of Directors, etc.)  Internal users of the service
  • 36.
    Example from IADproject For nursing staff (MICU and 5M): 1. If you have an incontinent patient, what makes it hard to take care of them? 2. If you have an incontinent patient, what makes it easier to take care of them? 3. In a perfect world, what do you need to take care of them? 4. Do you have any special interventions (things you do, “tricks”) that you use to take care of incontinent patients?
  • 37.
    Example from IADproject For Physicians: 1. What is your involvement in managing patients with incontinence? 2. How does incontinence affect your plan of care for the patient?
  • 38.
    Questions for Patients Weare working on a project to improve the way we take care of patients who have problems with toileting while they are in the hospital. 1. Since you have been here, have you had a problem getting to the bathroom or using the bedpan or urinal in time? 2. While you have been here, what are the nurses or doctors doing to help you manage this problem? 3. What seems to be working? 4. What seems not to work? 5. What suggestions do you have that would make this better for you?
  • 39.
    Map the Process:next topic Collect Data: throughout the QA!
  • 40.
    40 Skills Exercise: Problem Identification Getin groups of 5-6 people and discuss the case study. Consider the following questions:  What problem are you facing?  How do you feel about it?  What data do you have about your problem?  What additional data do you need?  What are your data telling you?  What will you do about it?
  • 41.
    Problem Statements After gainingunderstanding, describe the problem, opportunity or objective in concise, measurable terms. Include a summary of the problem and the impact (aka the “PAIN”)
  • 42.
    Problem Statements A briefdescription of the problem and the metric used to describe the problem Where the problem is occurring by process name and location The time frame over which the problem has been occurring The size or magnitude of the problem http://www.dummies.com/how-to/content/how-to-write-a-problem-statement-for-six-sigma.html
  • 43.
    Problem Statements  PoorProblem Statement: Human resources is taking too long to fill vacancies.  Better Problem Statement: Recruiting time for registered nurses on the medical surgical units at UAB is over 120 days when the stated goal is 60 days. With an average of 50 med/surg vacancies a month, this delay is adding $27,000 per month in overtime and contractor labor, and may result in poorer continuity of care and increased errors.
  • 44.
    Example Problem Statement Low mobility is common among hospitalized patients and is associated with adverse outcomes.
  • 45.
    Example Problem Statement Low mobility (defined as bed and bed to chair activity only) is common among hospitalized patients and is associated with adverse outcomes including functional decline and increased community care needs. In a study at the BVAMC, geriatric hospitalized patients spend an average of 83% of the time lying in bed. This can lead to acute decline in functional status rendering the patient dependent in ambulation which can lead to increased LOS. Financial data suggests an opportunity for improvement as well as there is > $41,000 per quarter spend on home health PT after hospitalization
  • 46.
    Skills Exercise: Problem Identification Usingyour work from the previous case study, WRITE a problem statement.
  • 47.
    47 An important thingto consider…. Readiness for change
  • 48.
    Be aware ofthe organization’s readiness to change Is the timing right? Do you have support of leadership? Do you have resources? Does your team think they can do it?
  • 49.
    49 Readiness for Change OrganizationalChange influenced by: Commitment to change Capability to change (change efficacy) Weiner, BJ (2009). A theory of organizational readiness for change.
  • 50.
    Adapted from Weiner,BJ (2009). A theory of organizational readiness for change. Possible Contextual Factors •Organizational Culture •Policies and Procedures •Past Experiences •Organizational Resources •Organizational Structure Change Valence (Value of Change) Capability •Task Demands •Resource Perceptions •Situational Factors Organizational Readiness for Change •Change Commitment •Change Efficacy Change Related Effort •Initiation •Persistence •Cooperative Behavior Implementation Effectiveness Organizational Readiness for Change