Download to read offline
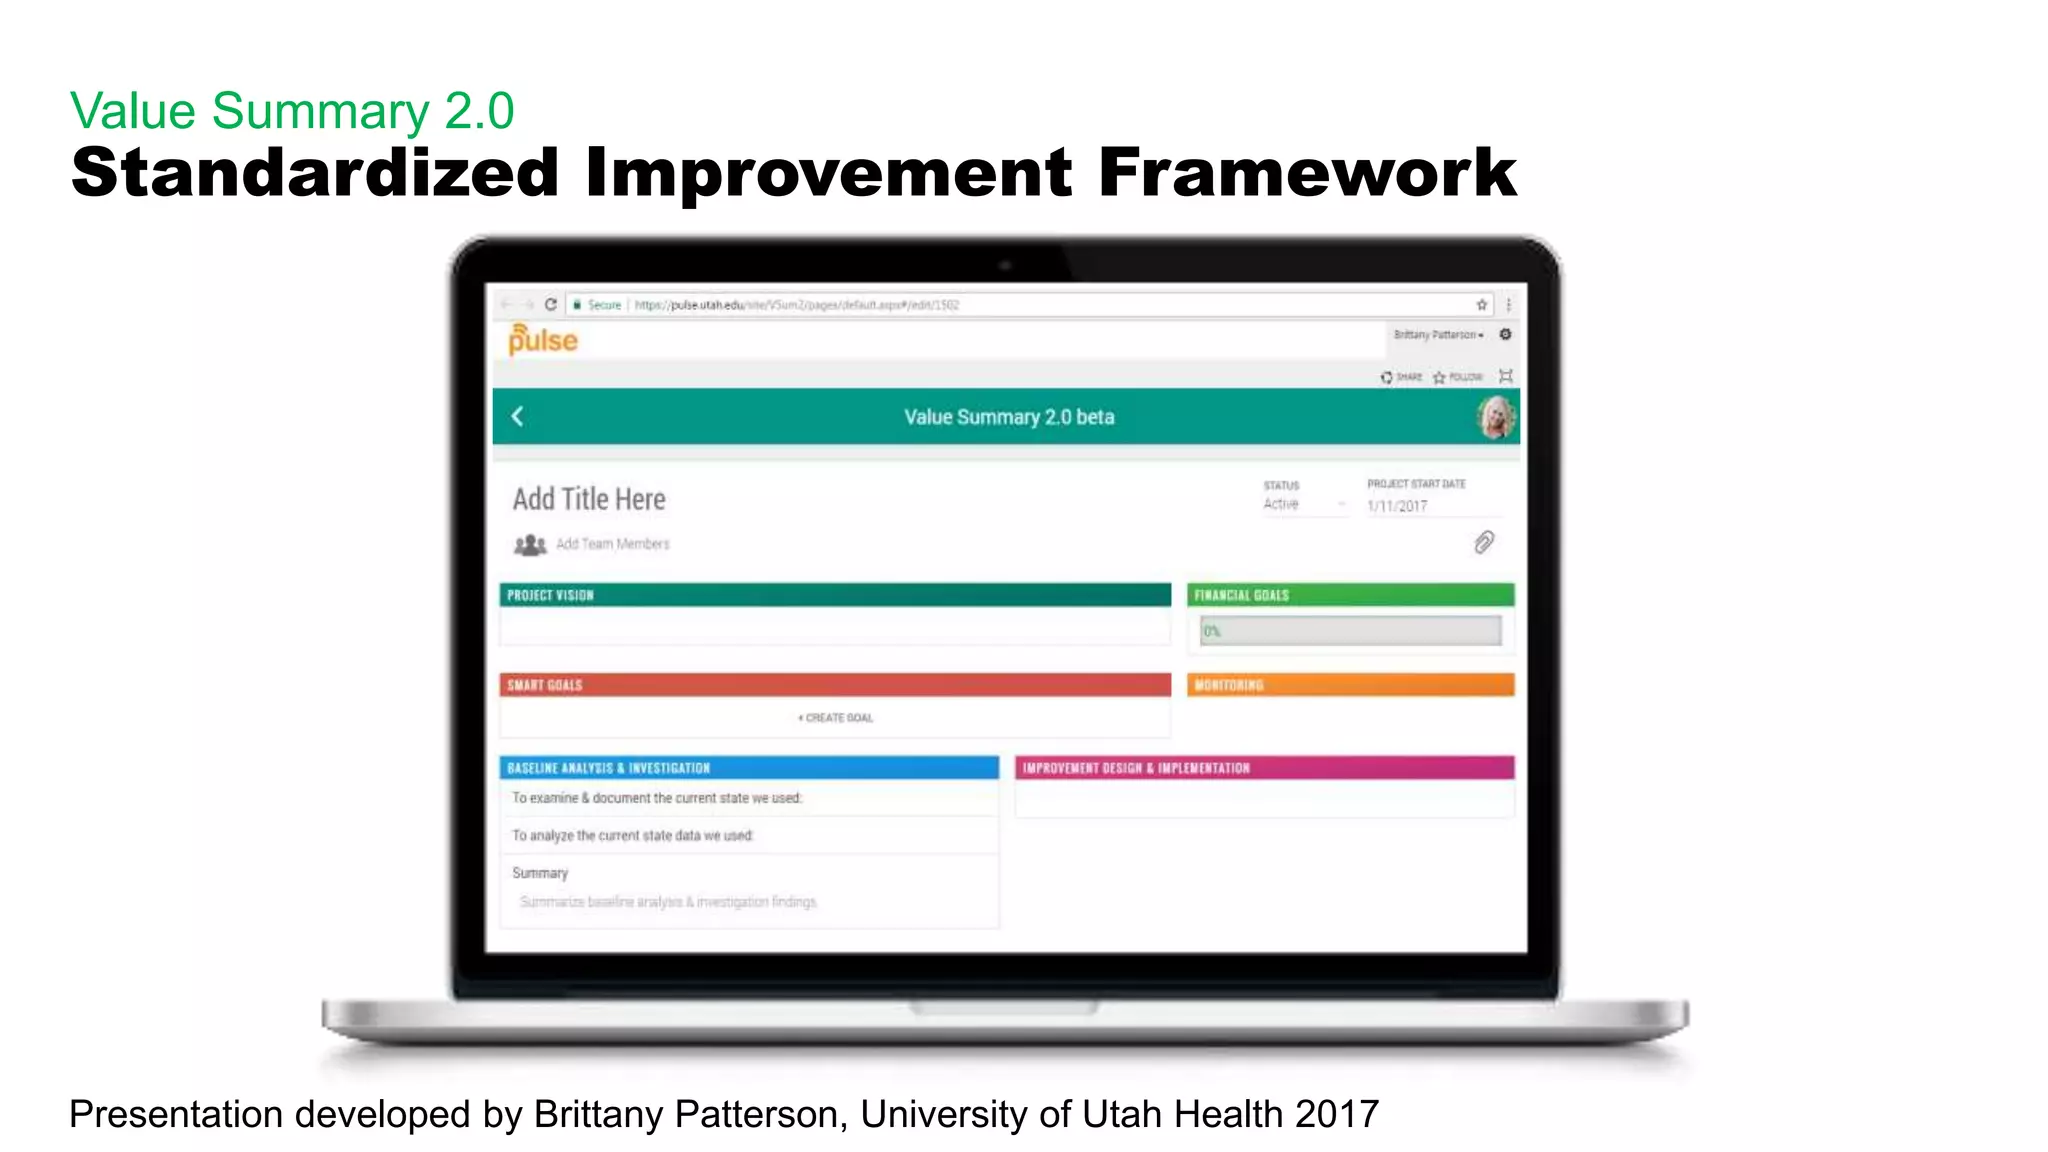
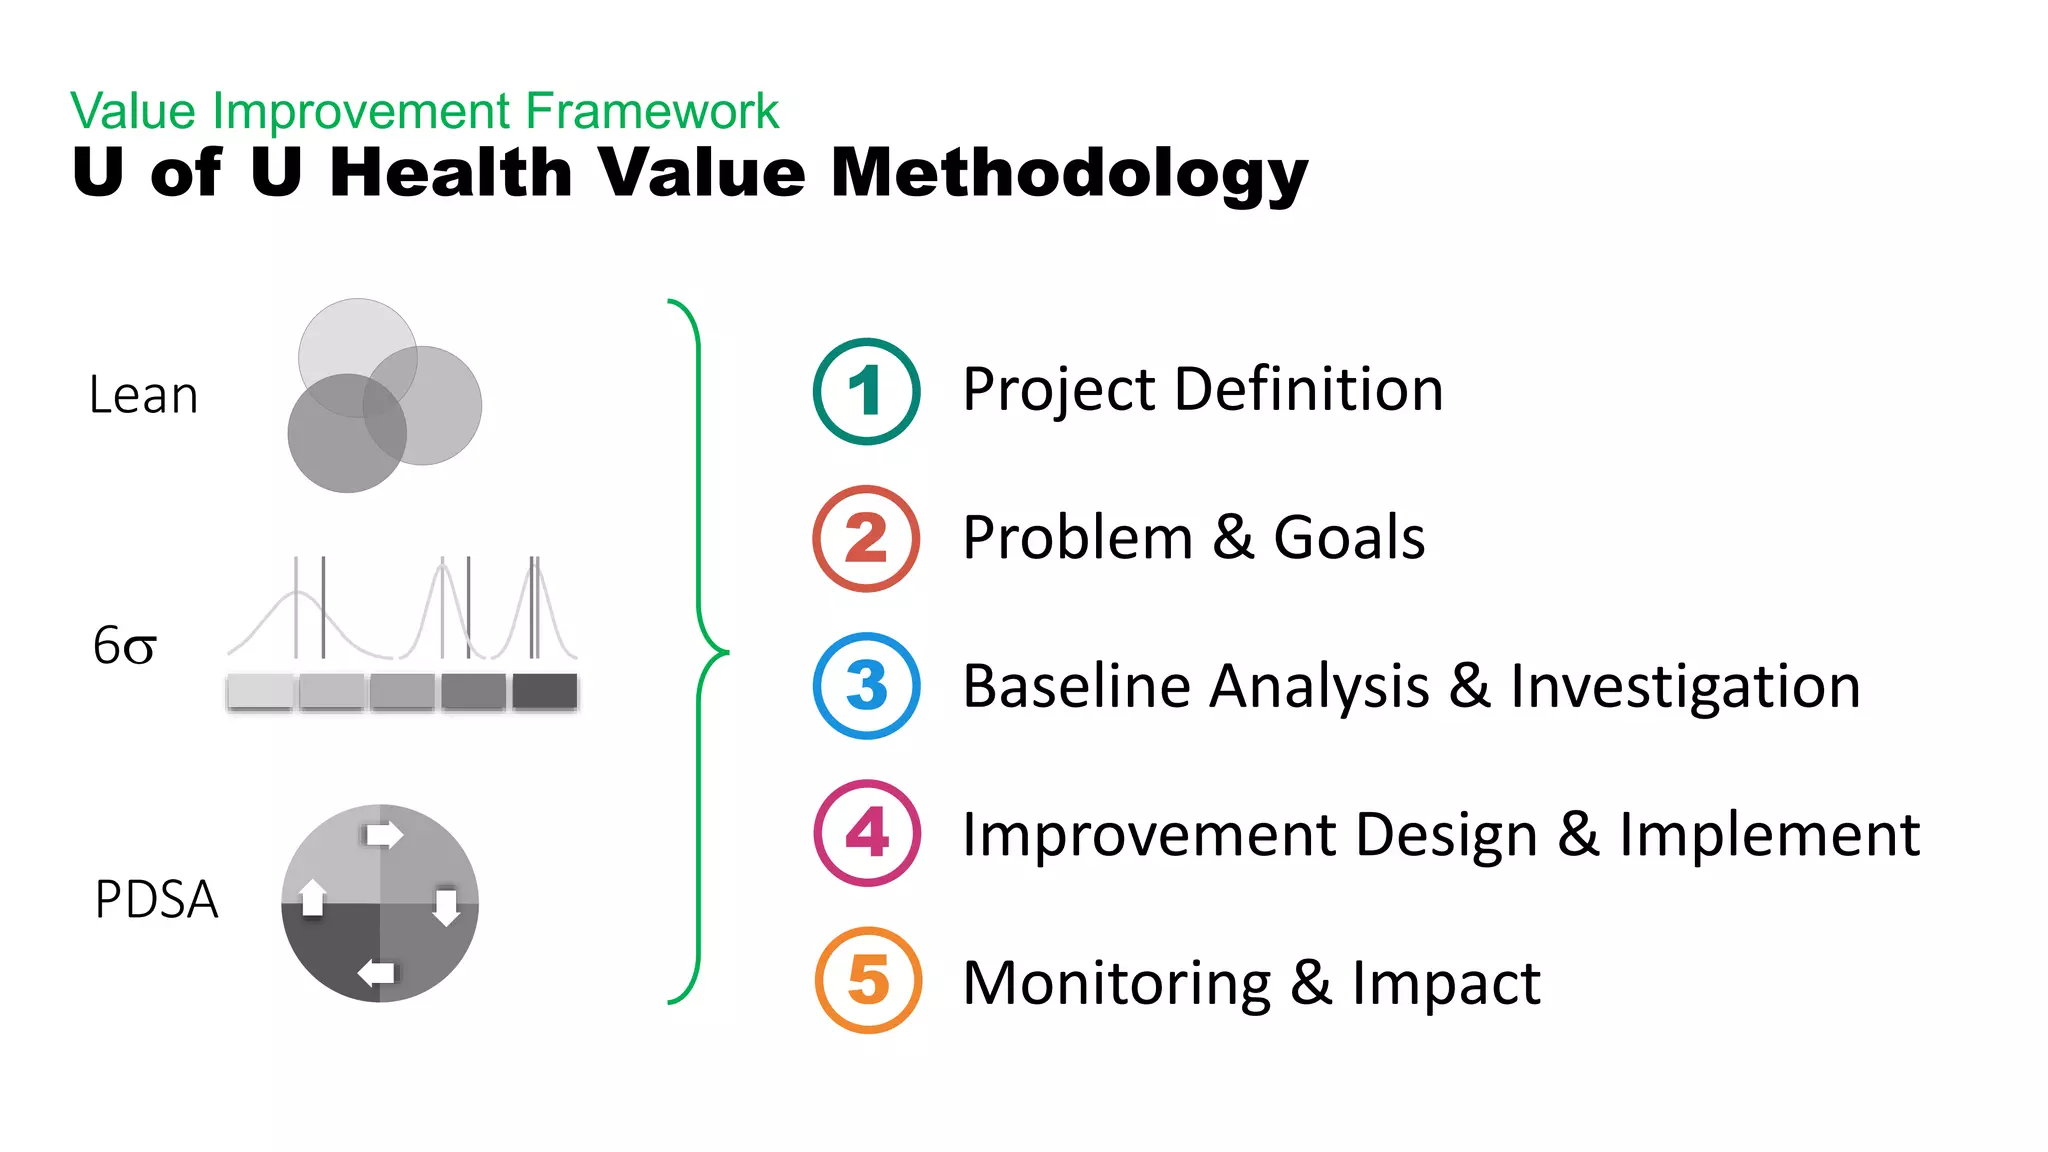
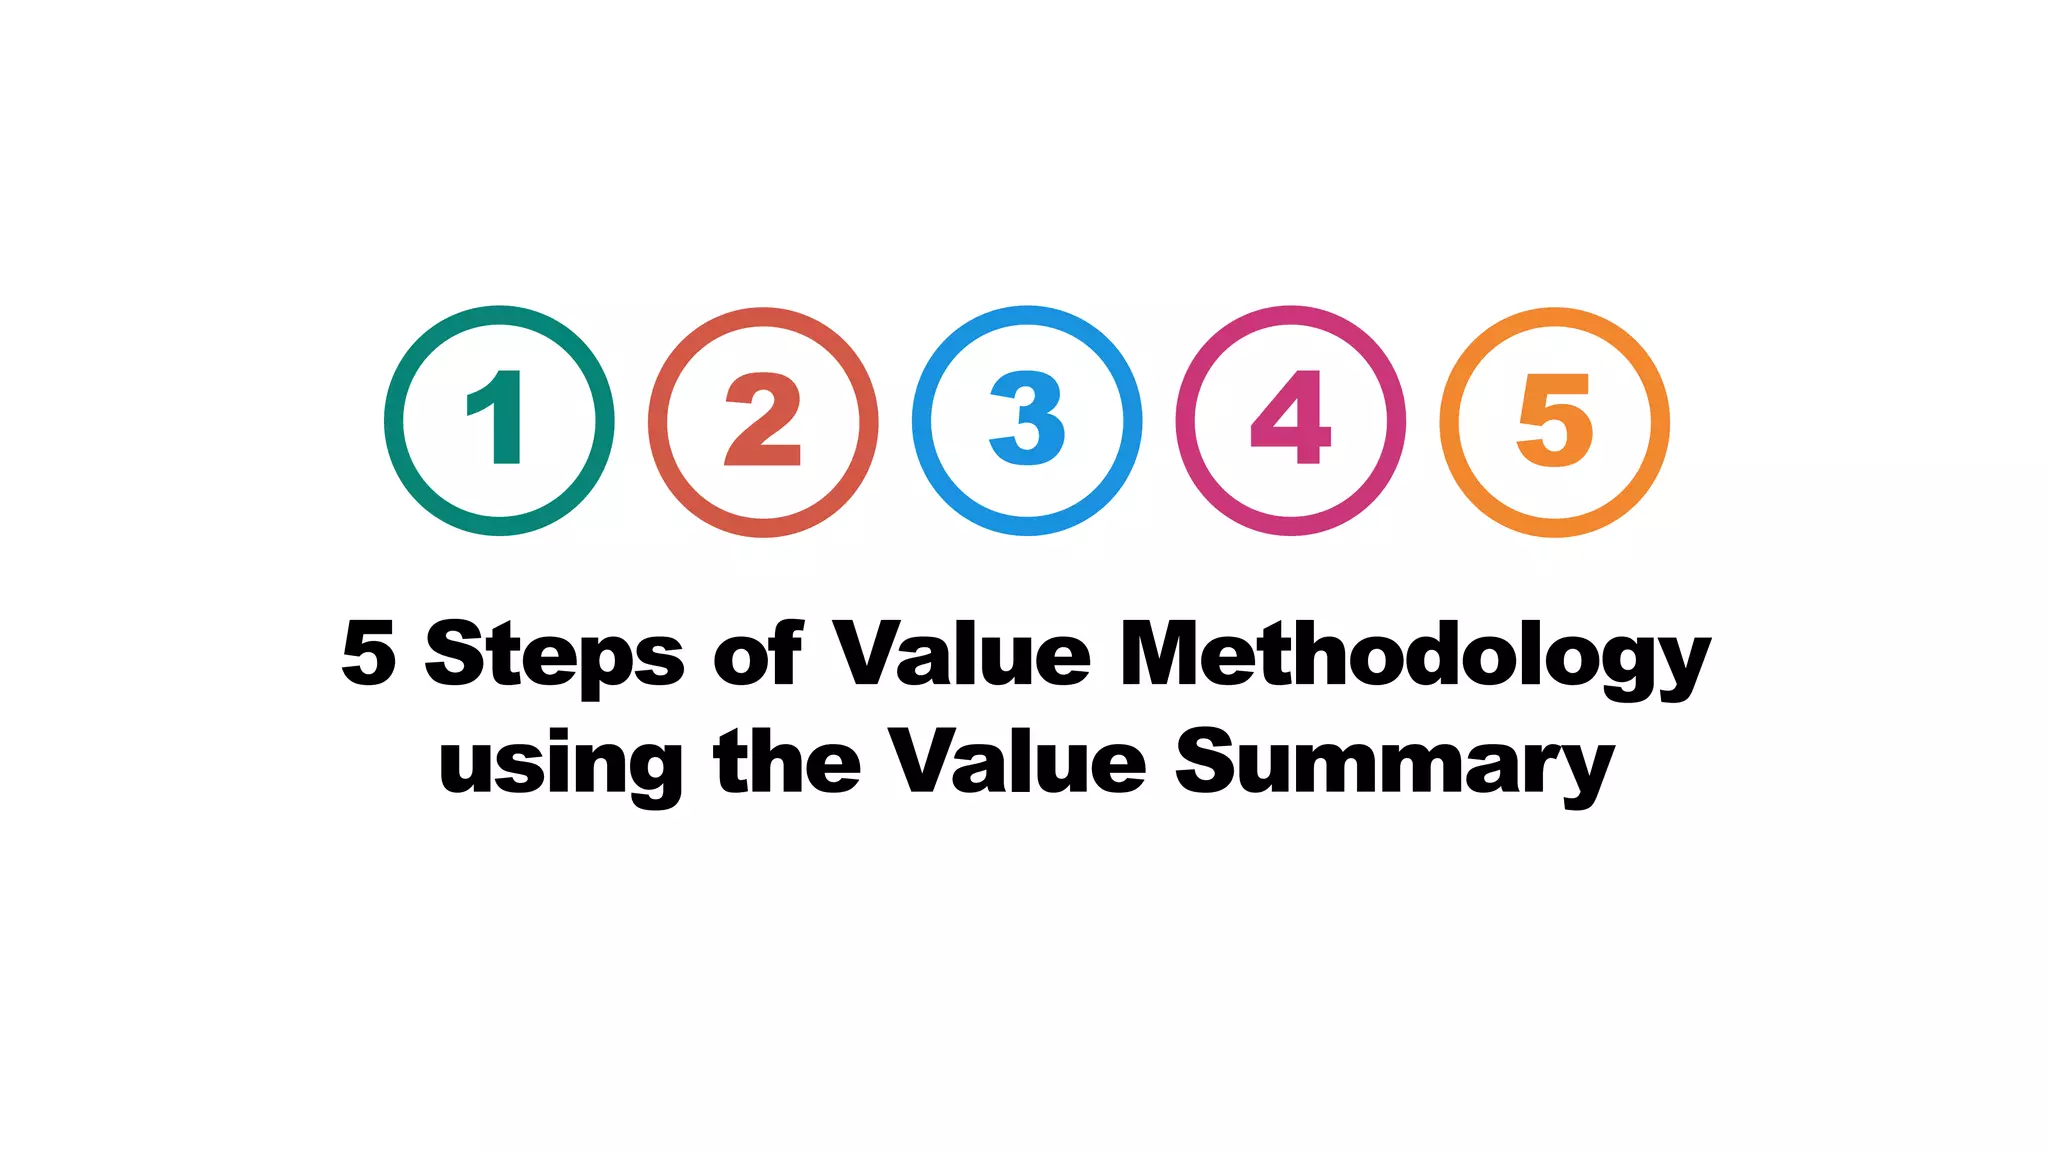
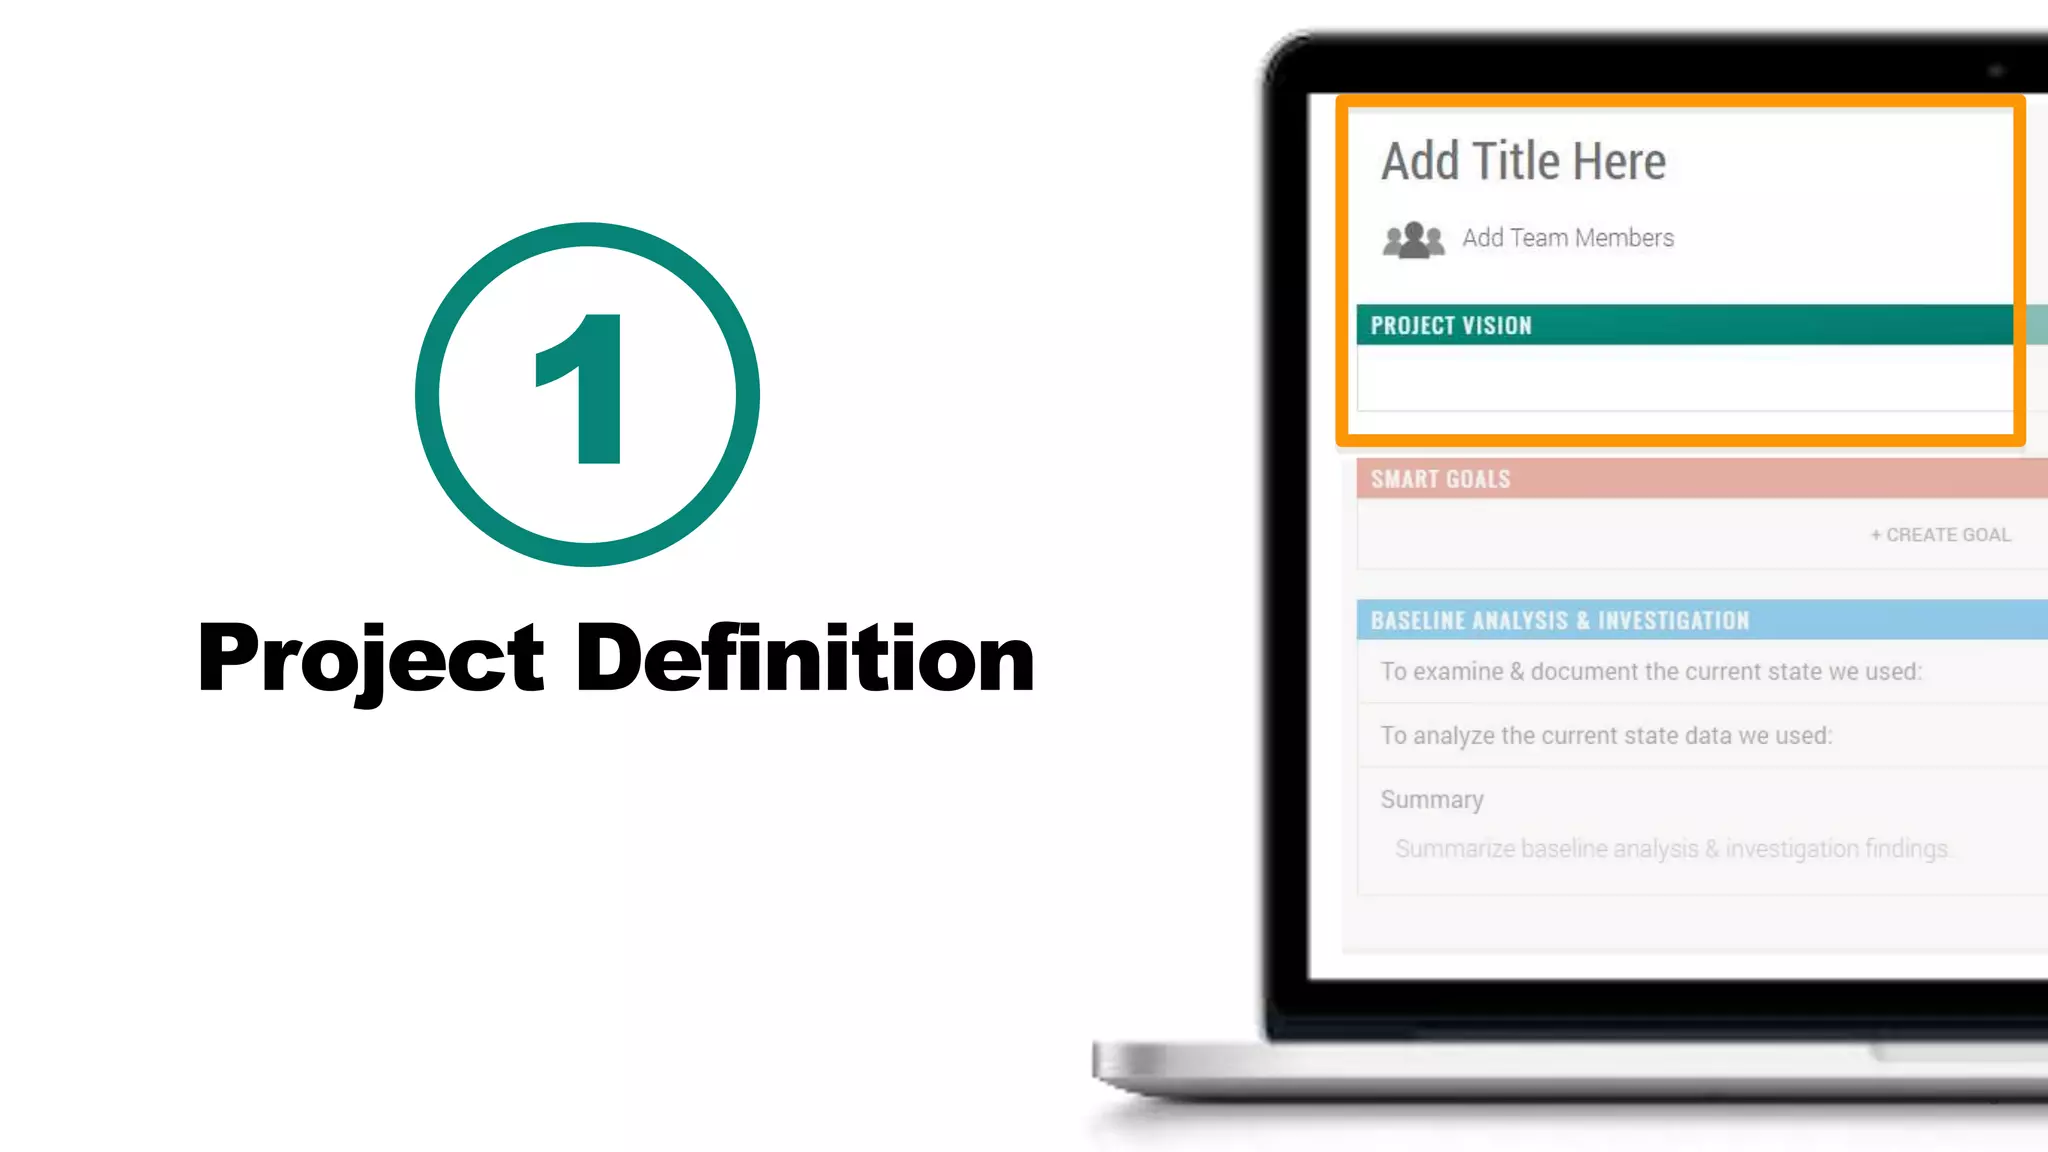

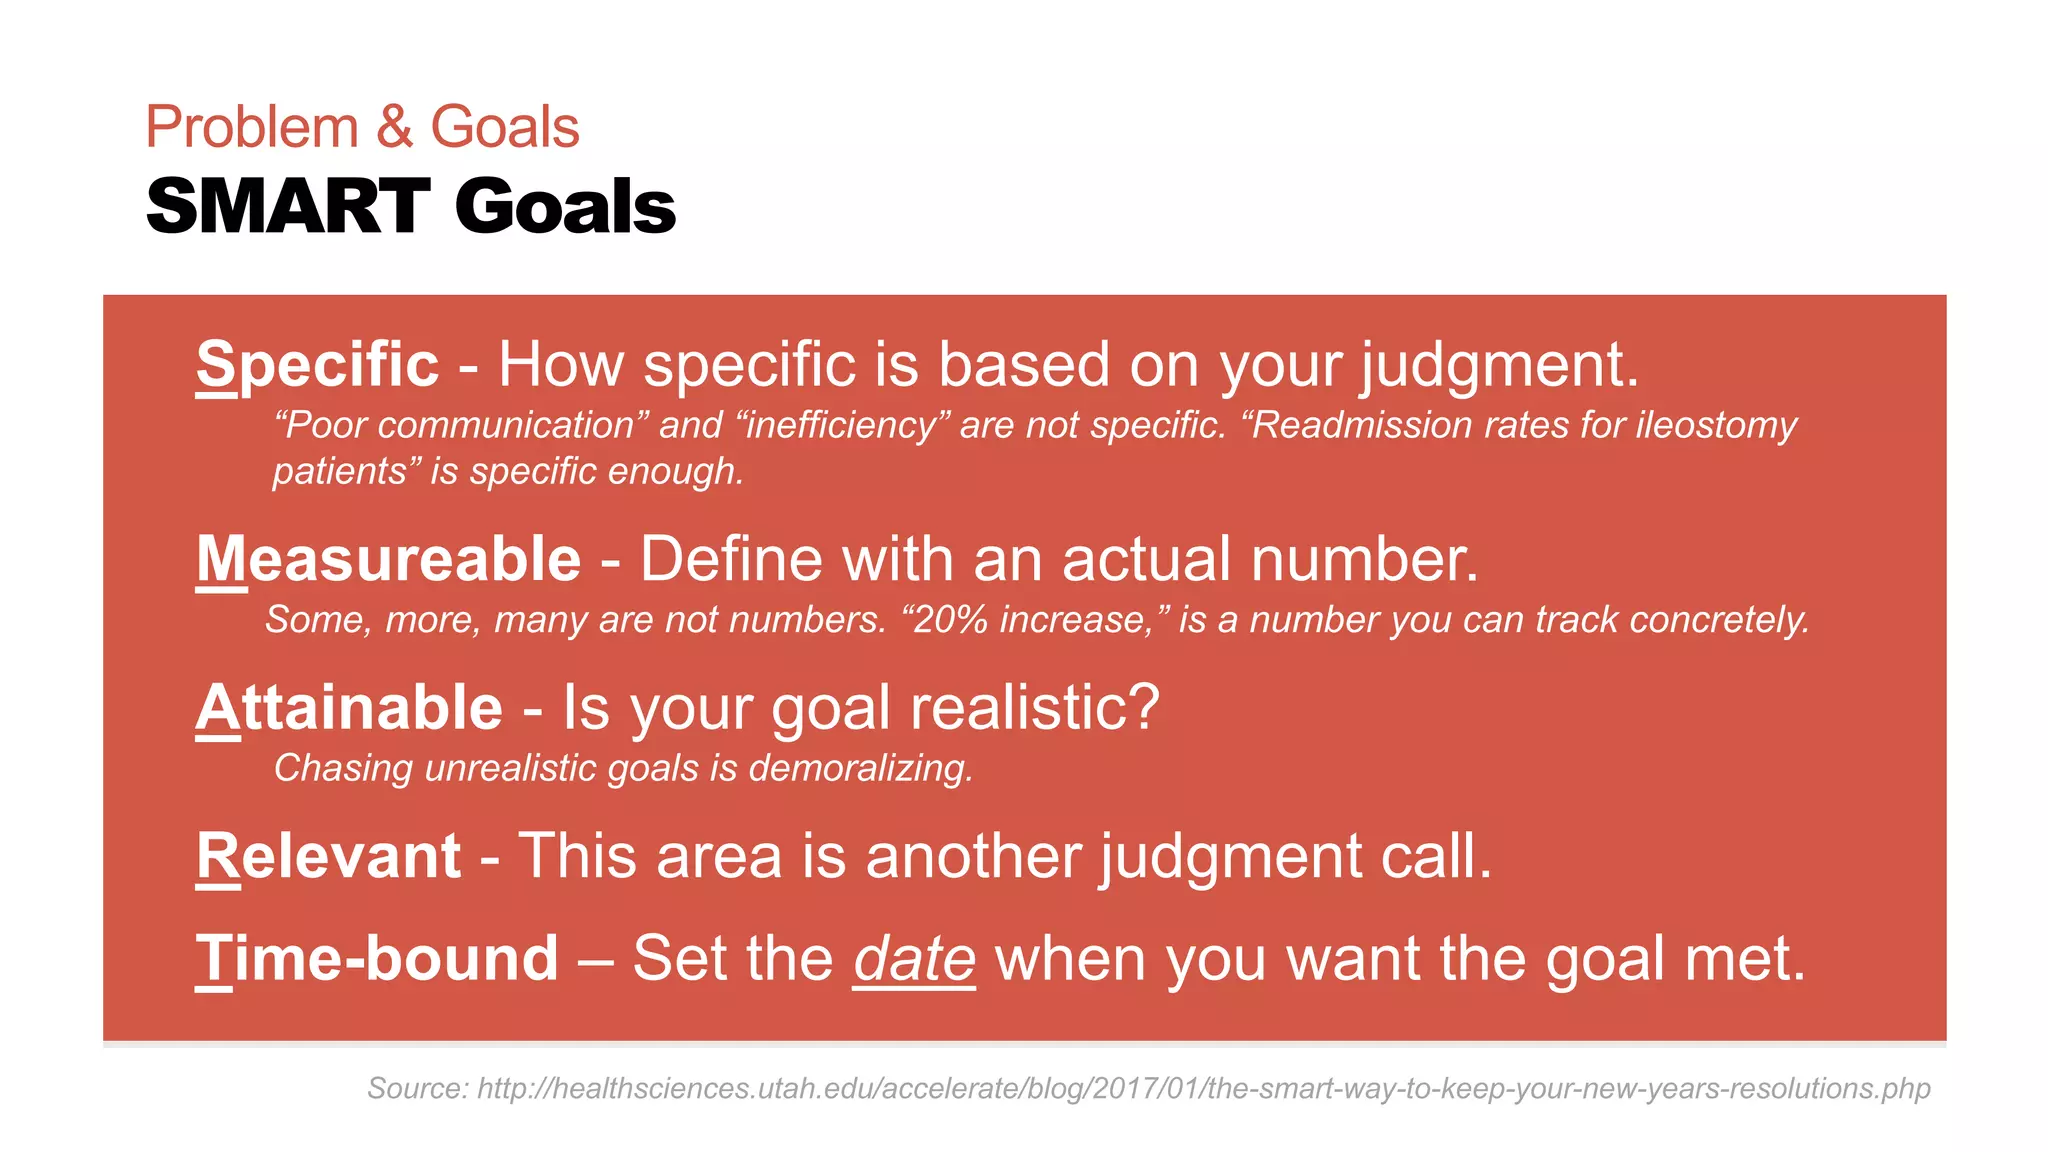
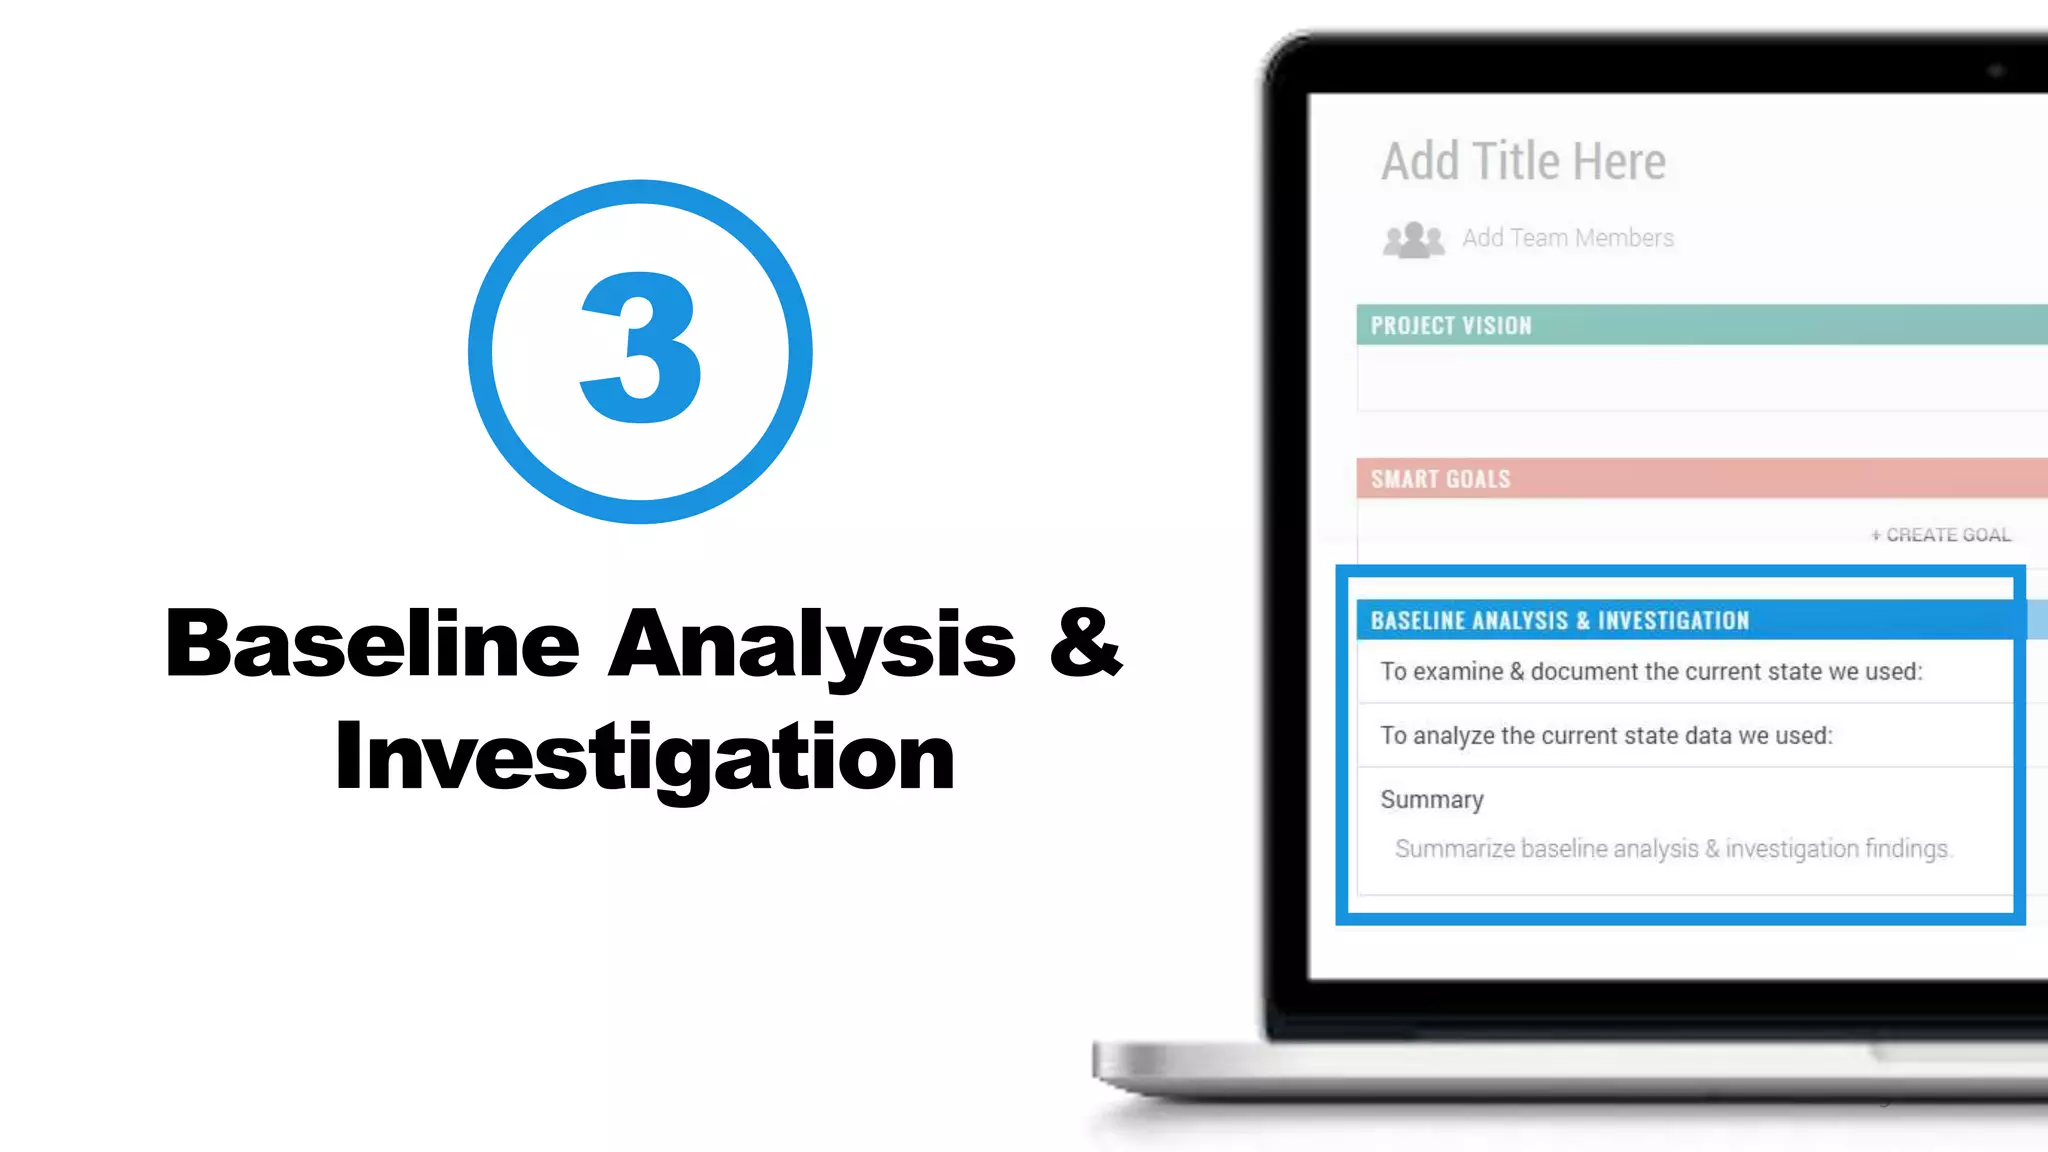
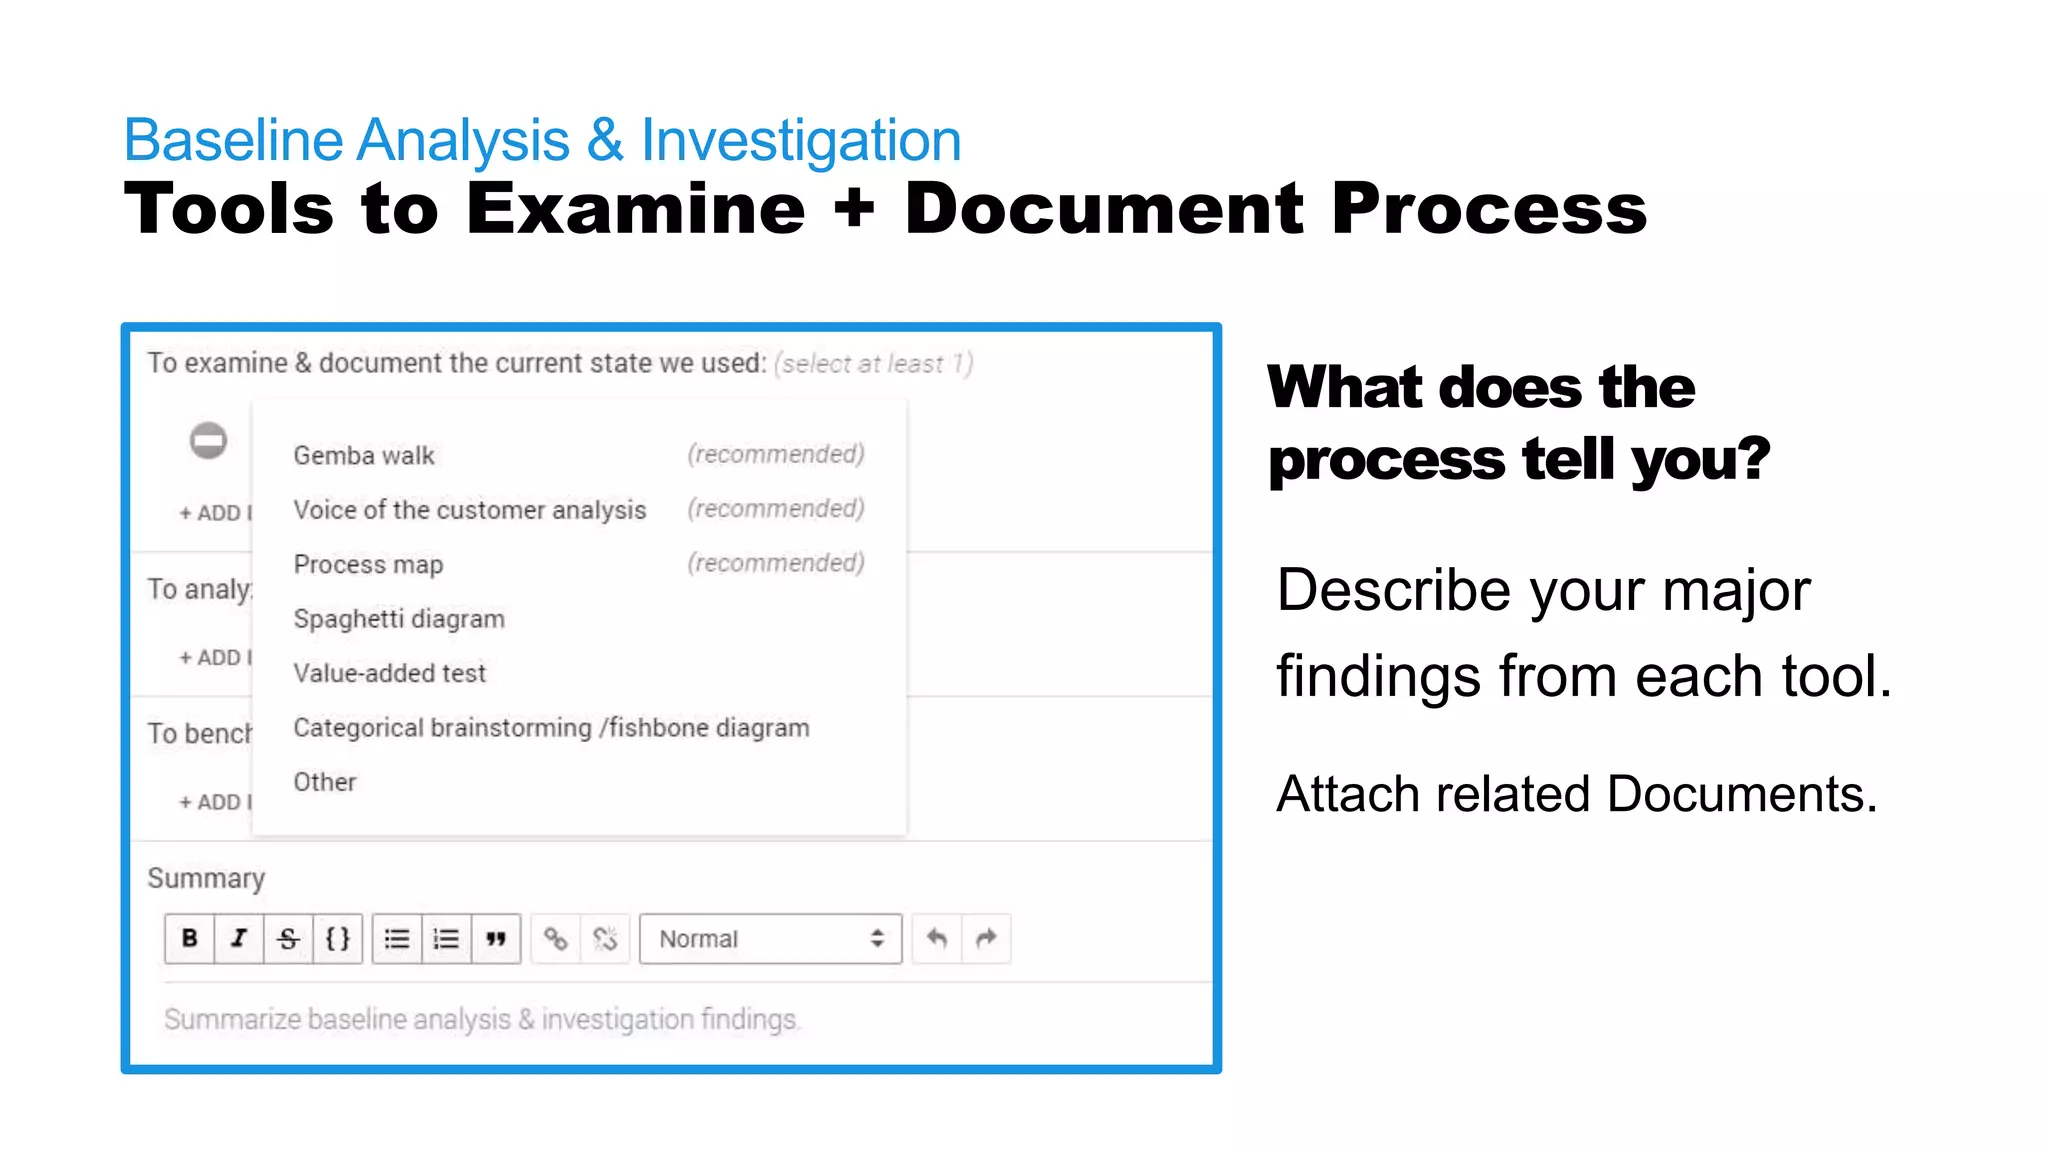
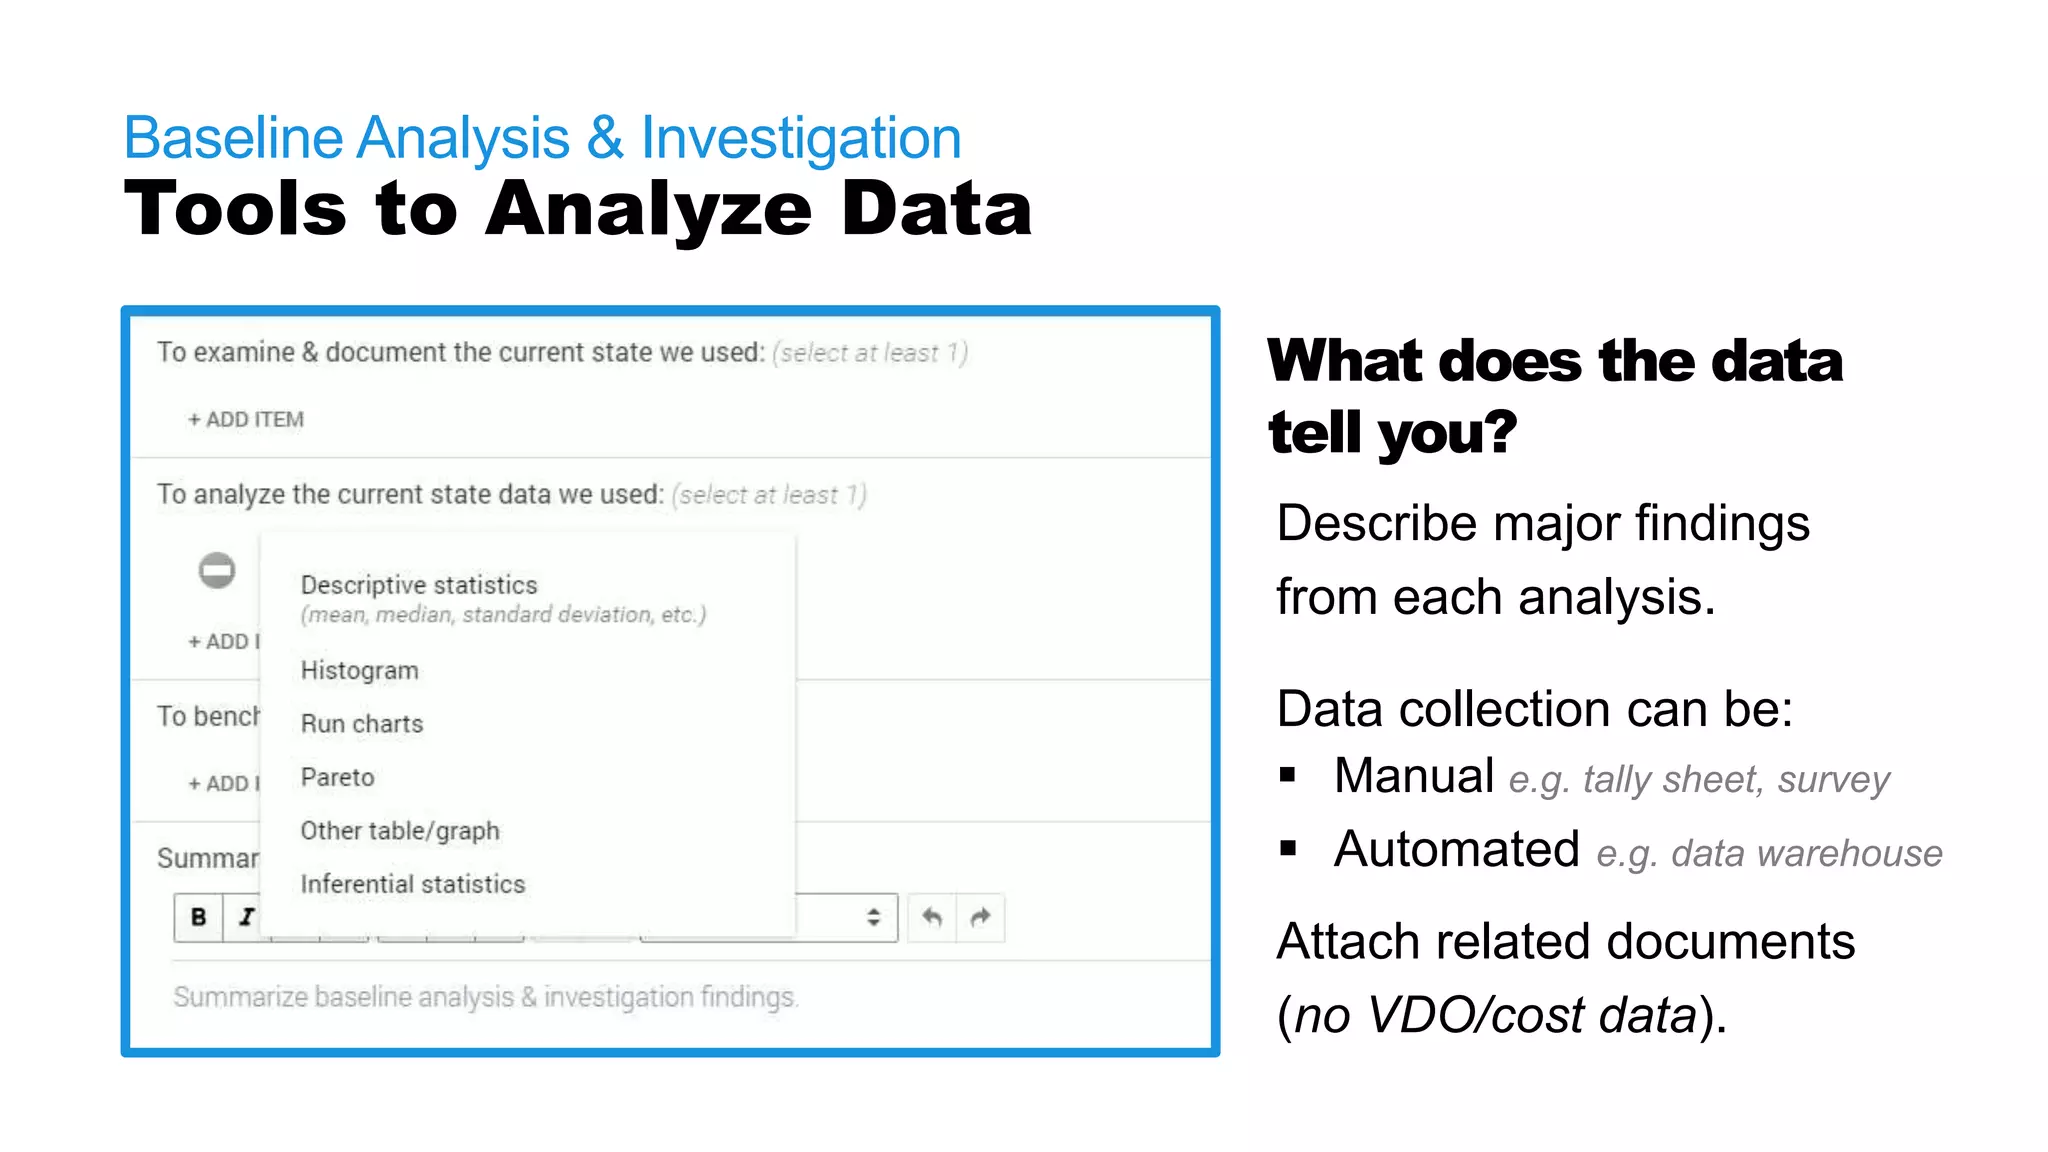
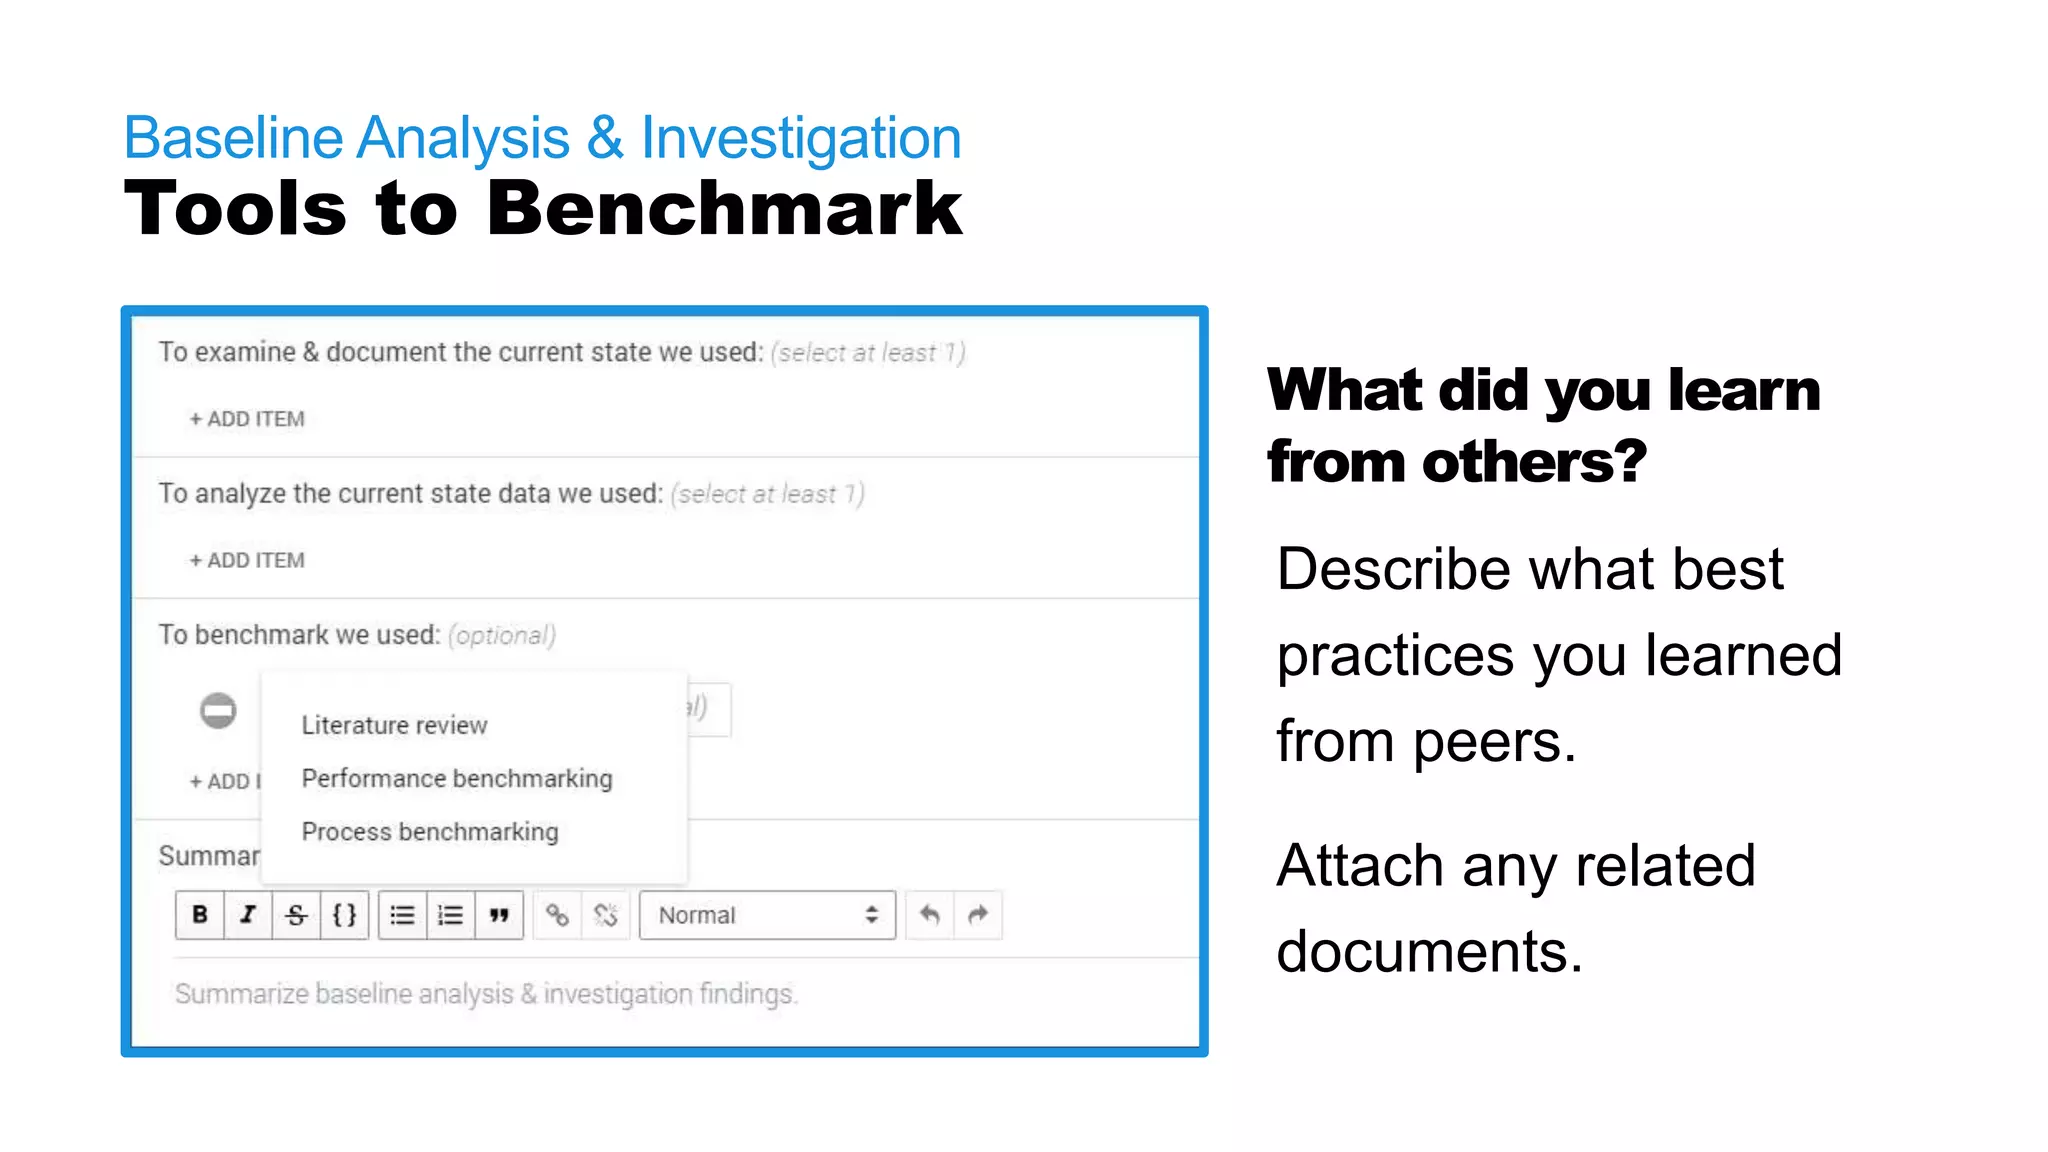
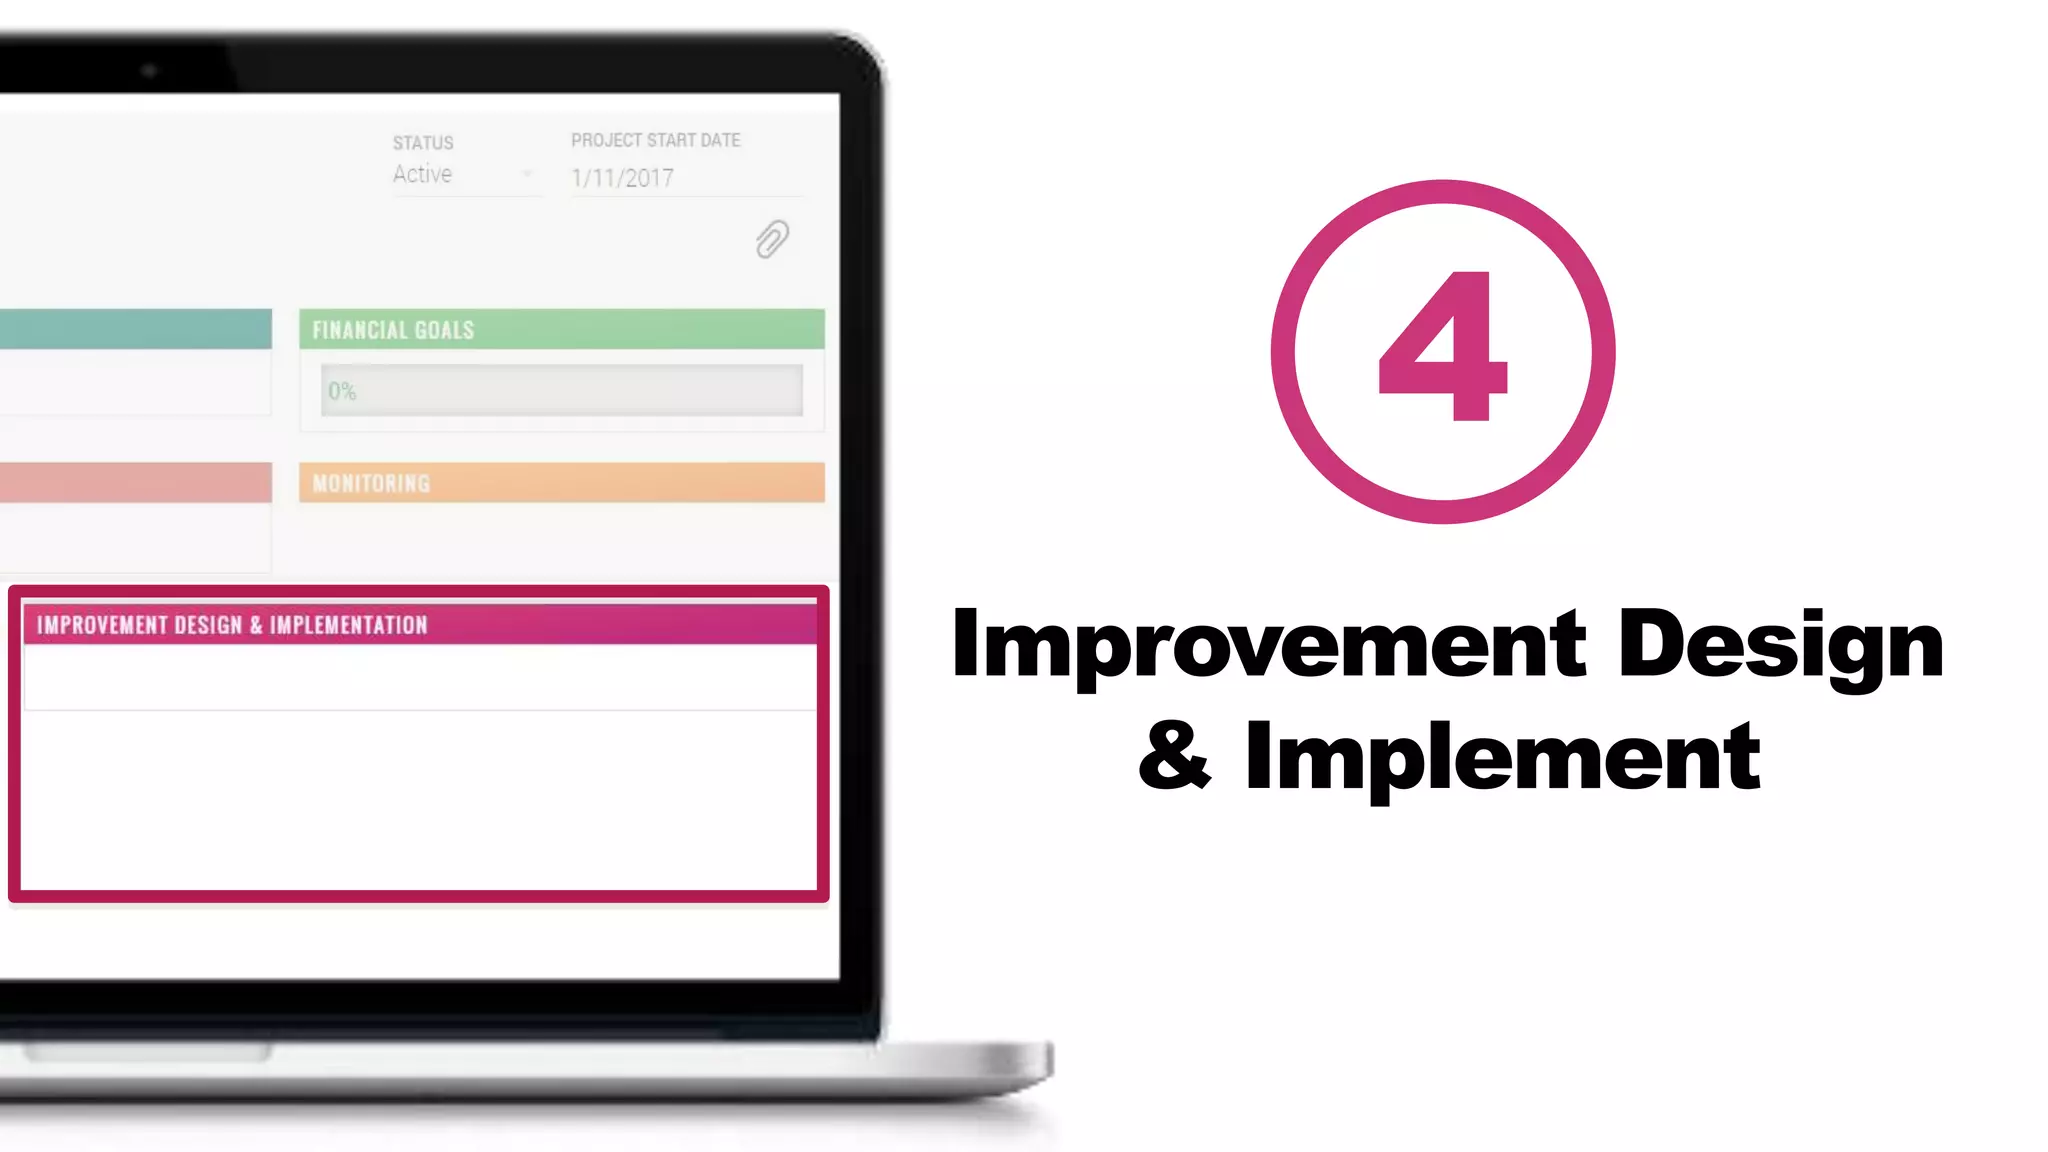
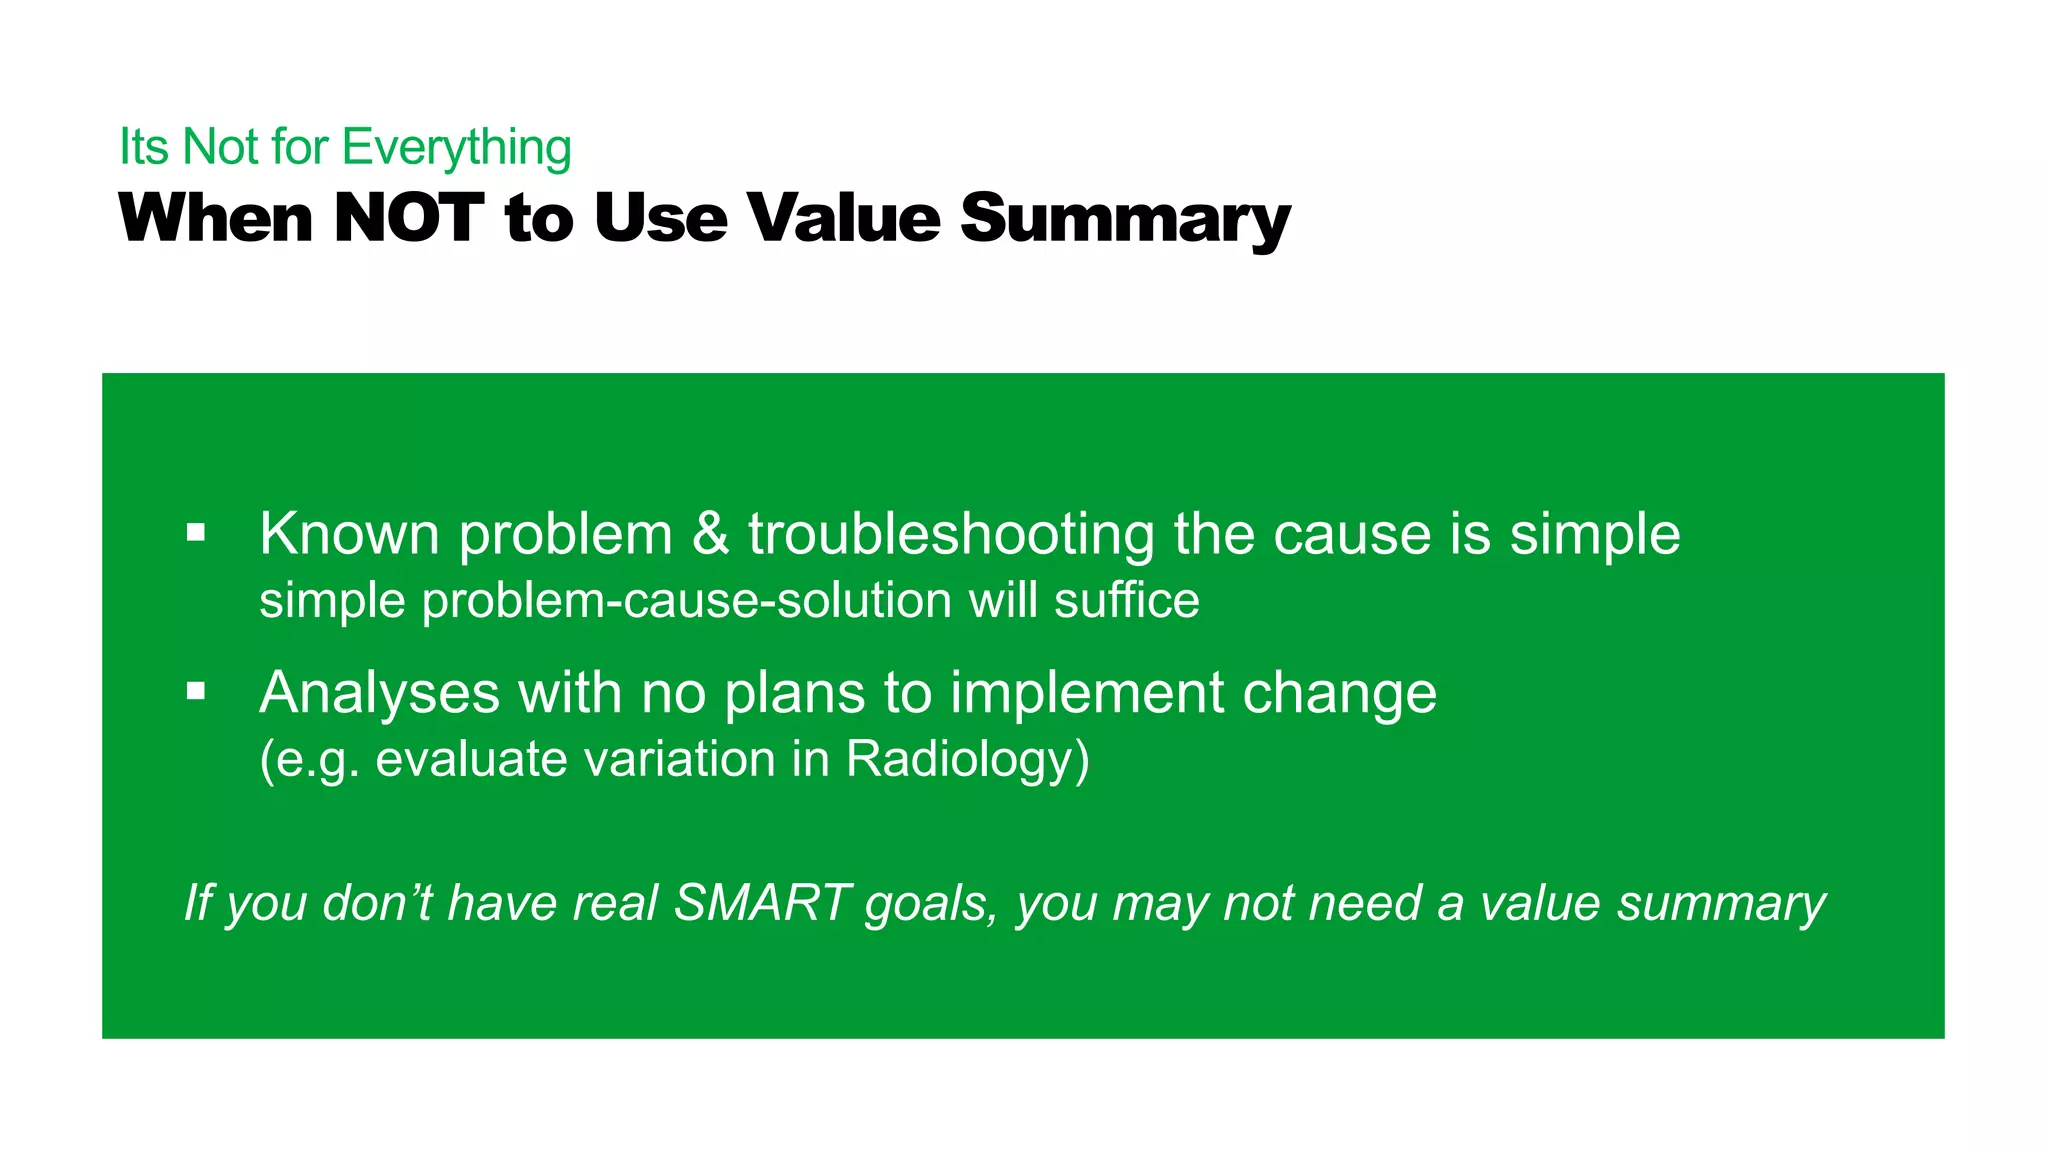
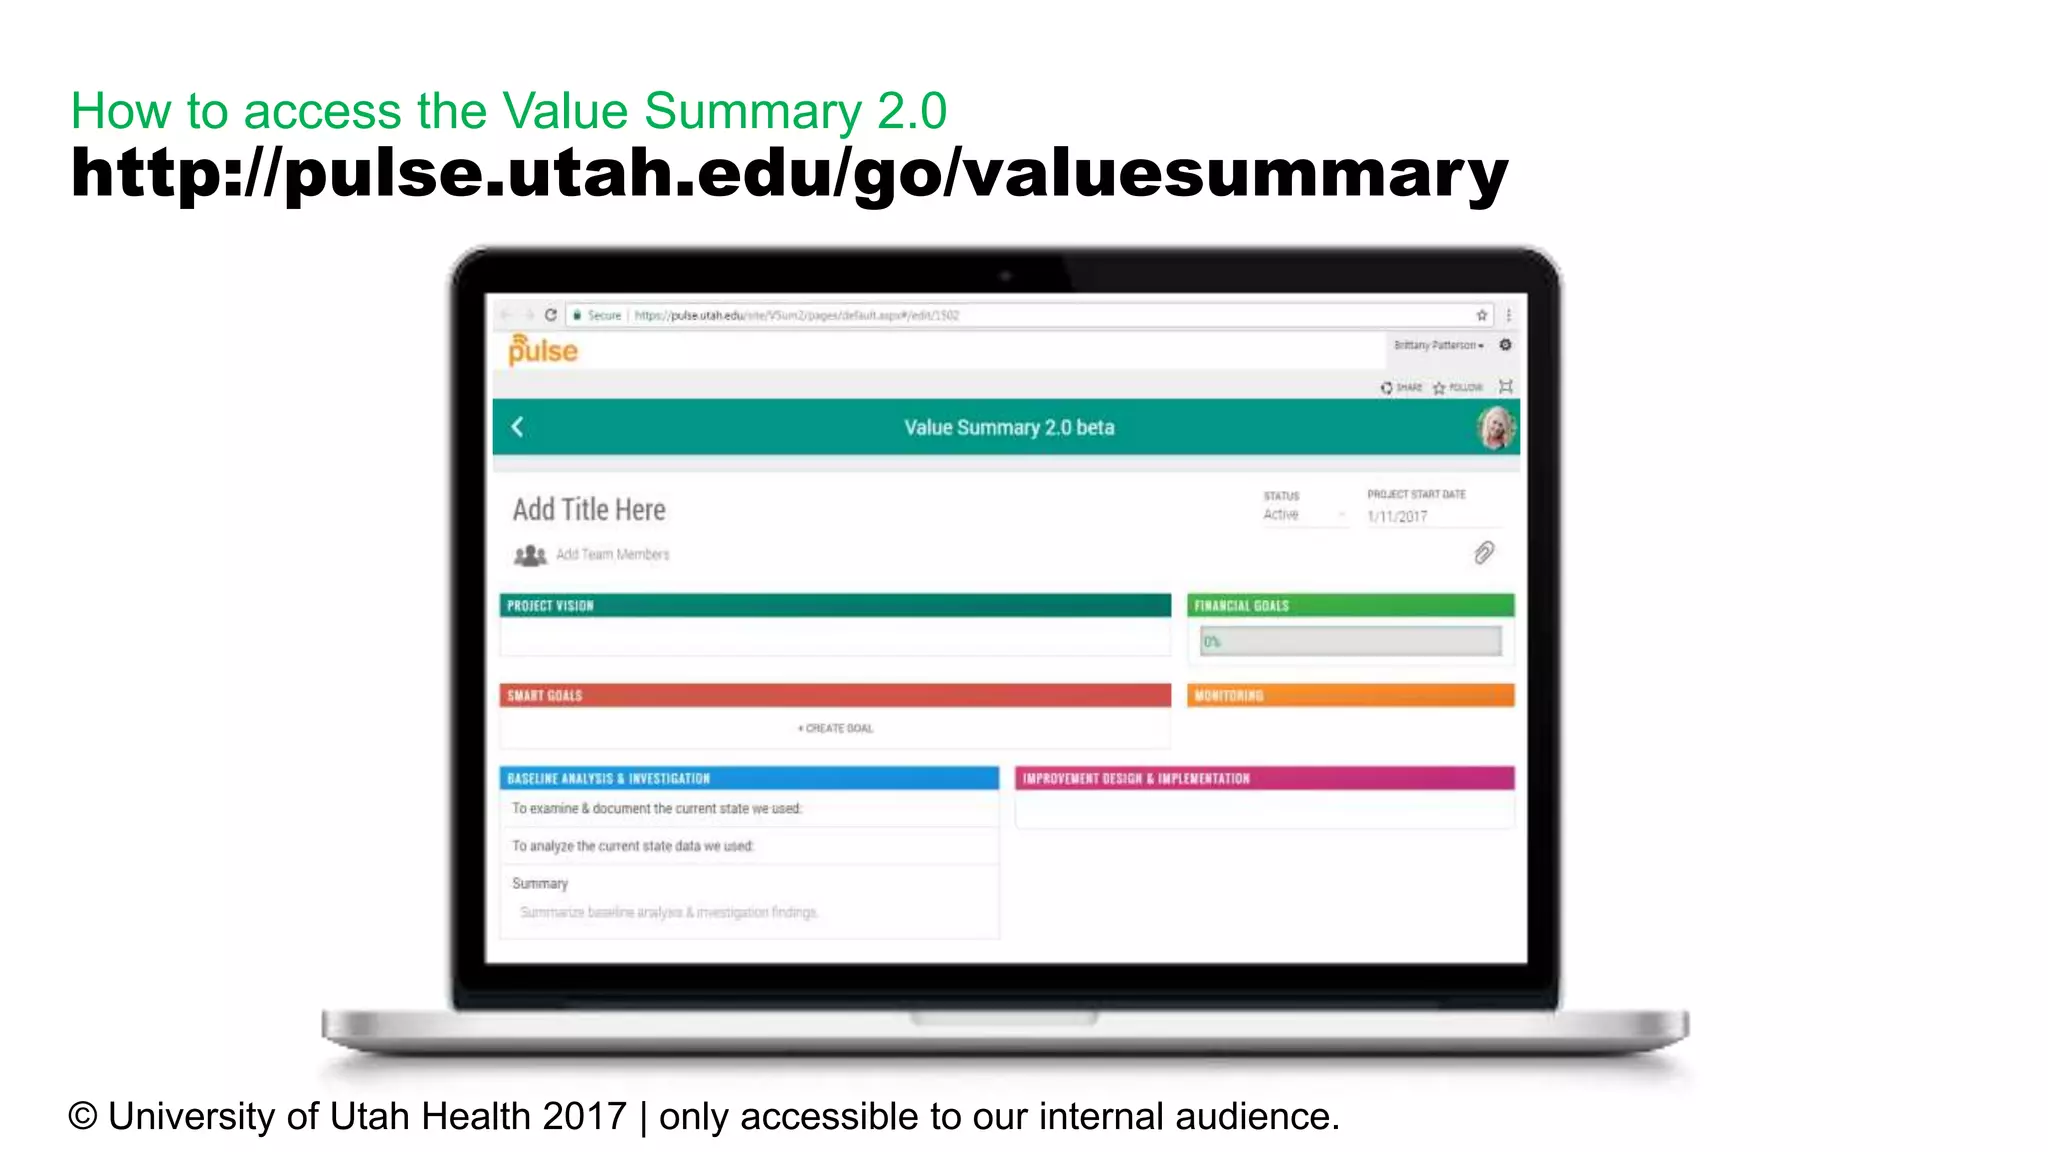

The document outlines the Value Summary 2.0 standardized improvement framework developed by Brittany Patterson of the University of Utah Health, focusing on the Lean 6S PDSA methodology. It emphasizes five key steps: project definition, baseline analysis, improvement design, implementation, and monitoring, highlighting the importance of SMART goals and continuous data monitoring. Additionally, it provides guidelines on when the framework should not be utilized, such as in cases of simple problem-solving or when there are no plans for change.


![Understanding Parkinson’s Disease: Causes, Symptoms, and Treatment [2025]](https://cdn.slidesharecdn.com/ss_thumbnails/understandingparkinson-251208102525-80ba3223-thumbnail.jpg?width=640&height=640&fit=bounds)


