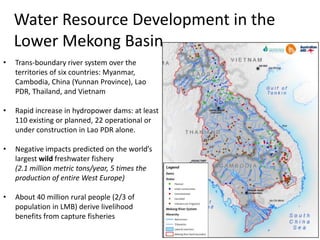
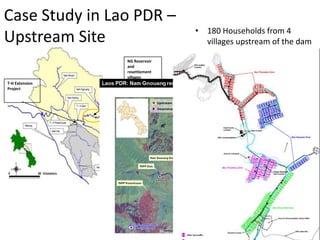
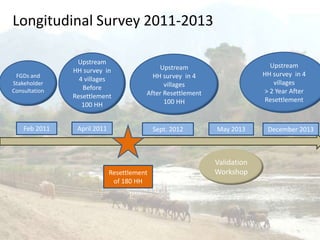
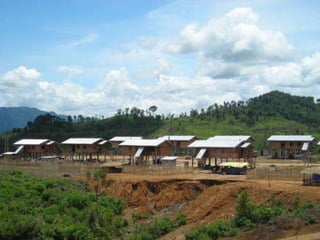
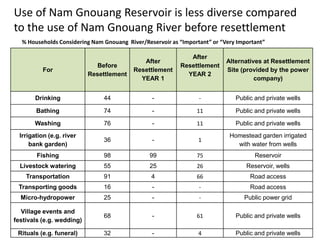
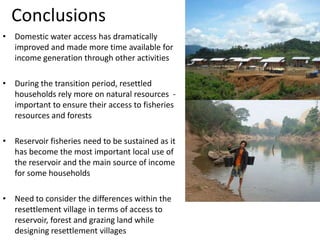
Hydropower development
and local livelihood adaptation:
a longitudinal case study in Lao PDR
Olivier Joffre and Yumiko Kura
Resilience 2014, Montpellier 8th Mai 2014
Water Resource Development in the
Lower Mekong Basin
• Trans-boundary river system over the
territories of six countries: Myanmar,
Cambodia, China (Yunnan Province), Lao
PDR, Thailand, and Vietnam
• Rapid increase in hydropower dams: at least
110 existing or planned, 22 operational or
under construction in Lao PDR alone.
• Negative impacts predicted on the world’s
largest wild freshwater fishery
(2.1 million metric tons/year, 5 times the
production of entire West Europe)
• About 40 million rural people (2/3 of
population in LMB) derive livelihood
benefits from capture fisheries
3
T-H Extension
Project
NG Reservoir
and
resettlement
villages
Case Study in Lao PDR –
Upstream Site • 180 Households from 4
villages upstream of the dam
were resettled to a single site
near the new reservoir
Objectives of the Case Study
• To understand how local communities use the river water, river
ecosystems and later reservoir ecosystem
• To assess the economic importance of the river and reservoir for
local livelihood and income
• To compare water use patterns and economic values before and
after the resettlement
FGDs and
Stakeholder
Consultation
Upstream
HH survey in
4 villages
Before
Resettlement
100 HH
April 2011 Sept. 2012
Upstream
HH survey in 4
villages
After Resettlement
100 HH
Validation
Workshop
May 2013Feb 2011
Resettlement
of 180 HH
Longitudinal Survey 2011-2013
Upstream
HH survey in 4
villages
> 2 Year After
Resettlement
December 2013
% Households Considering Nam Gnouang River/Reservoir as “Important” or “Very Important”
For
Before
Resettlement
After
Resettlement
YEAR 1
After
Resettlement
YEAR 2
Alternatives at Resettlement
Site (provided by the power
company)
Drinking 44 - - Public and private wells
Bathing 74 - 11 Public and private wells
Washing 76 - 11 Public and private wells
Irrigation (e.g. river
bank garden)
36 - 1
Homestead garden irrigated
with water from wells
Fishing 98 99 75 Reservoir
Livestock watering 55 25 26 Reservoir, wells
Transportation 91 4 66 Road access
Transporting goods 16 - - Road access
Micro-hydropower 25 - - Public power grid
Village events and
festivals (e.g. wedding)
68 - 61 Public and private wells
Rituals (e.g. funeral) 32 - 4 Public and private wells
Use of Nam Gnouang Reservoir is less diverse compared
to the use of Nam Gnouang River before resettlement
Water supply
significantly improved
River
54%
Spring
44%
Tap
2%
Dry Season
River
36%
Spring
50%
Rain and
river
5%
Rain and
spring
7%
Tap
2%
Rain Season
Before Resettlement
After Resettlement
0
50
100
150
200
250
300
350
400
450
Waterconsumption(l/day/HH)
Water Consumption per
Household
Dry
season
Rainy
season
Significant reduction and shift
in income portfolio
-
5.00
10.00
15.00
20.00
25.00
30.00
35.00
40.00
Before After 1 Year After 2 Year
Income(MKip/year/HH)
Change of Household Income
Remittances
Livestock
Non/Off-farm
TFP/NTFP
Fisheries
Agriculture
Compensation
from company
- Food
-Agriculture
inputs
- Cash
Compensa
tion from
company
Year 1
Average household income fell by
approximately 72%, primarily due to the
significant reduction in agriculture-
related income, not yet fully re-
established
Fisheries became the biggest contributor
to household income, due to reduction in
income from agriculture
Year 2
Overall income recovered– reaching 50%
of the income before resettlement.
Agriculture income is the most important
Income from fisheries fell compare to
Year 1, and less households were
engaged in fishing
Non-farm wages, remittances and
trading large livestock generated higher
share of income
0
2
4
6
8
10
12
14
16
Before resettlement After 1 Year After 2 Year
Income(M.Kip/HH/year)
River / Reservoir-based household income
Non Farm
Irrigated
Agriculture
Forestry
Fisheries
Fisheries important during
transition, but declining• Year 1 - 71% of resettled households
reported increase in fishing
activities, while 11% reported reduction
in fishing activity after resettlement
• Fish catch is distributed more evenly
throughout the year, no seasonal peaks
• Average household fish catch
decreased significantly between Year 1
and Year 2
• Some households have quit fishing:
- 100% of households engaged in
fishing before resettlement
- 95% in Year 1 after resettlement
- only 75% in Year 2
0
50
100
150
200
250
Jan Feb Mar Apr May Jun Jul Aug Sep Oct Nov Dec
Kg
Average monthly fish catch
per household
Before After 1 Year After 2 Year
Households strategies
for adaptation
• Location and distance are important factors
determining household strategy
• After 1 year, some households negotiated
house swaps to stay closer to original
upland rice fields
• Households located closer to the reservoir
invested more in fishing while households
farther away stopped fishing and focused on
NTFP and agriculture
• Large livestock decreased by 50% due to
lack of grazing land near the resettlement
site but households whose original grazing
land is closer were able to keep more
animals
• With better road access, more households
are involved in non-farm wage labor and
trading
0
2
4
6
8
10
12
14
16
MillionKip/HH/year
Change in River Related Income
Portfolio -
Before & 1 year After Resettlement
Non Farm
Irrigated
Agriculture
Forestry
Fisheries
CLOSE MEDIUM FAR
Conclusions
• Domestic water access has dramatically
improved and made more time available for
income generation through other activities
• During the transition period, resettled
households rely more on natural resources -
important to ensure their access to fisheries
resources and forests
• Reservoir fisheries need to be sustained as it
has become the most important local use of
the reservoir and the main source of income
for some households
• Need to consider the differences within the
resettlement village in terms of access to
reservoir, forest and grazing land while
designing resettlement villages
Thank you!
o.joffre@cgiar.org
y.kura@cgiar.org

Hydropower development and local livelihood adaptation: a longitudinal case study in Lao PDR

  • 1.
    Hydropower development and locallivelihood adaptation: a longitudinal case study in Lao PDR Olivier Joffre and Yumiko Kura Resilience 2014, Montpellier 8th Mai 2014
  • 2.
    Water Resource Developmentin the Lower Mekong Basin • Trans-boundary river system over the territories of six countries: Myanmar, Cambodia, China (Yunnan Province), Lao PDR, Thailand, and Vietnam • Rapid increase in hydropower dams: at least 110 existing or planned, 22 operational or under construction in Lao PDR alone. • Negative impacts predicted on the world’s largest wild freshwater fishery (2.1 million metric tons/year, 5 times the production of entire West Europe) • About 40 million rural people (2/3 of population in LMB) derive livelihood benefits from capture fisheries
  • 3.
    3 T-H Extension Project NG Reservoir and resettlement villages CaseStudy in Lao PDR – Upstream Site • 180 Households from 4 villages upstream of the dam were resettled to a single site near the new reservoir
  • 4.
    Objectives of theCase Study • To understand how local communities use the river water, river ecosystems and later reservoir ecosystem • To assess the economic importance of the river and reservoir for local livelihood and income • To compare water use patterns and economic values before and after the resettlement
  • 5.
    FGDs and Stakeholder Consultation Upstream HH surveyin 4 villages Before Resettlement 100 HH April 2011 Sept. 2012 Upstream HH survey in 4 villages After Resettlement 100 HH Validation Workshop May 2013Feb 2011 Resettlement of 180 HH Longitudinal Survey 2011-2013 Upstream HH survey in 4 villages > 2 Year After Resettlement December 2013
  • 7.
    % Households ConsideringNam Gnouang River/Reservoir as “Important” or “Very Important” For Before Resettlement After Resettlement YEAR 1 After Resettlement YEAR 2 Alternatives at Resettlement Site (provided by the power company) Drinking 44 - - Public and private wells Bathing 74 - 11 Public and private wells Washing 76 - 11 Public and private wells Irrigation (e.g. river bank garden) 36 - 1 Homestead garden irrigated with water from wells Fishing 98 99 75 Reservoir Livestock watering 55 25 26 Reservoir, wells Transportation 91 4 66 Road access Transporting goods 16 - - Road access Micro-hydropower 25 - - Public power grid Village events and festivals (e.g. wedding) 68 - 61 Public and private wells Rituals (e.g. funeral) 32 - 4 Public and private wells Use of Nam Gnouang Reservoir is less diverse compared to the use of Nam Gnouang River before resettlement
  • 8.
    Water supply significantly improved River 54% Spring 44% Tap 2% DrySeason River 36% Spring 50% Rain and river 5% Rain and spring 7% Tap 2% Rain Season Before Resettlement After Resettlement 0 50 100 150 200 250 300 350 400 450 Waterconsumption(l/day/HH) Water Consumption per Household Dry season Rainy season
  • 9.
    Significant reduction andshift in income portfolio - 5.00 10.00 15.00 20.00 25.00 30.00 35.00 40.00 Before After 1 Year After 2 Year Income(MKip/year/HH) Change of Household Income Remittances Livestock Non/Off-farm TFP/NTFP Fisheries Agriculture Compensation from company - Food -Agriculture inputs - Cash Compensa tion from company Year 1 Average household income fell by approximately 72%, primarily due to the significant reduction in agriculture- related income, not yet fully re- established Fisheries became the biggest contributor to household income, due to reduction in income from agriculture Year 2 Overall income recovered– reaching 50% of the income before resettlement. Agriculture income is the most important Income from fisheries fell compare to Year 1, and less households were engaged in fishing Non-farm wages, remittances and trading large livestock generated higher share of income 0 2 4 6 8 10 12 14 16 Before resettlement After 1 Year After 2 Year Income(M.Kip/HH/year) River / Reservoir-based household income Non Farm Irrigated Agriculture Forestry Fisheries
  • 10.
    Fisheries important during transition,but declining• Year 1 - 71% of resettled households reported increase in fishing activities, while 11% reported reduction in fishing activity after resettlement • Fish catch is distributed more evenly throughout the year, no seasonal peaks • Average household fish catch decreased significantly between Year 1 and Year 2 • Some households have quit fishing: - 100% of households engaged in fishing before resettlement - 95% in Year 1 after resettlement - only 75% in Year 2 0 50 100 150 200 250 Jan Feb Mar Apr May Jun Jul Aug Sep Oct Nov Dec Kg Average monthly fish catch per household Before After 1 Year After 2 Year
  • 11.
    Households strategies for adaptation •Location and distance are important factors determining household strategy • After 1 year, some households negotiated house swaps to stay closer to original upland rice fields • Households located closer to the reservoir invested more in fishing while households farther away stopped fishing and focused on NTFP and agriculture • Large livestock decreased by 50% due to lack of grazing land near the resettlement site but households whose original grazing land is closer were able to keep more animals • With better road access, more households are involved in non-farm wage labor and trading 0 2 4 6 8 10 12 14 16 MillionKip/HH/year Change in River Related Income Portfolio - Before & 1 year After Resettlement Non Farm Irrigated Agriculture Forestry Fisheries CLOSE MEDIUM FAR
  • 12.
    Conclusions • Domestic wateraccess has dramatically improved and made more time available for income generation through other activities • During the transition period, resettled households rely more on natural resources - important to ensure their access to fisheries resources and forests • Reservoir fisheries need to be sustained as it has become the most important local use of the reservoir and the main source of income for some households • Need to consider the differences within the resettlement village in terms of access to reservoir, forest and grazing land while designing resettlement villages
  • 13.

Editor's Notes

  • #4 The map shows the entire catchment of the Mekong sub-basins in Lao, where the case study was conducted.
  • #9 Before relocation, the river and springs were the main source of water supply, in both dry and rainy season. After relocation, households were given access to private and public wells – albeit not free access. In the dry season, public and private wells provide almost all water supply – almost equally so . In Phonkeo, Sensi and Thambing, private and public wells are the only source of water.In the rain season, rain  and spring water constitute the bulk of the water supply.Time saved from not having to collect water from river is significant after resettlement