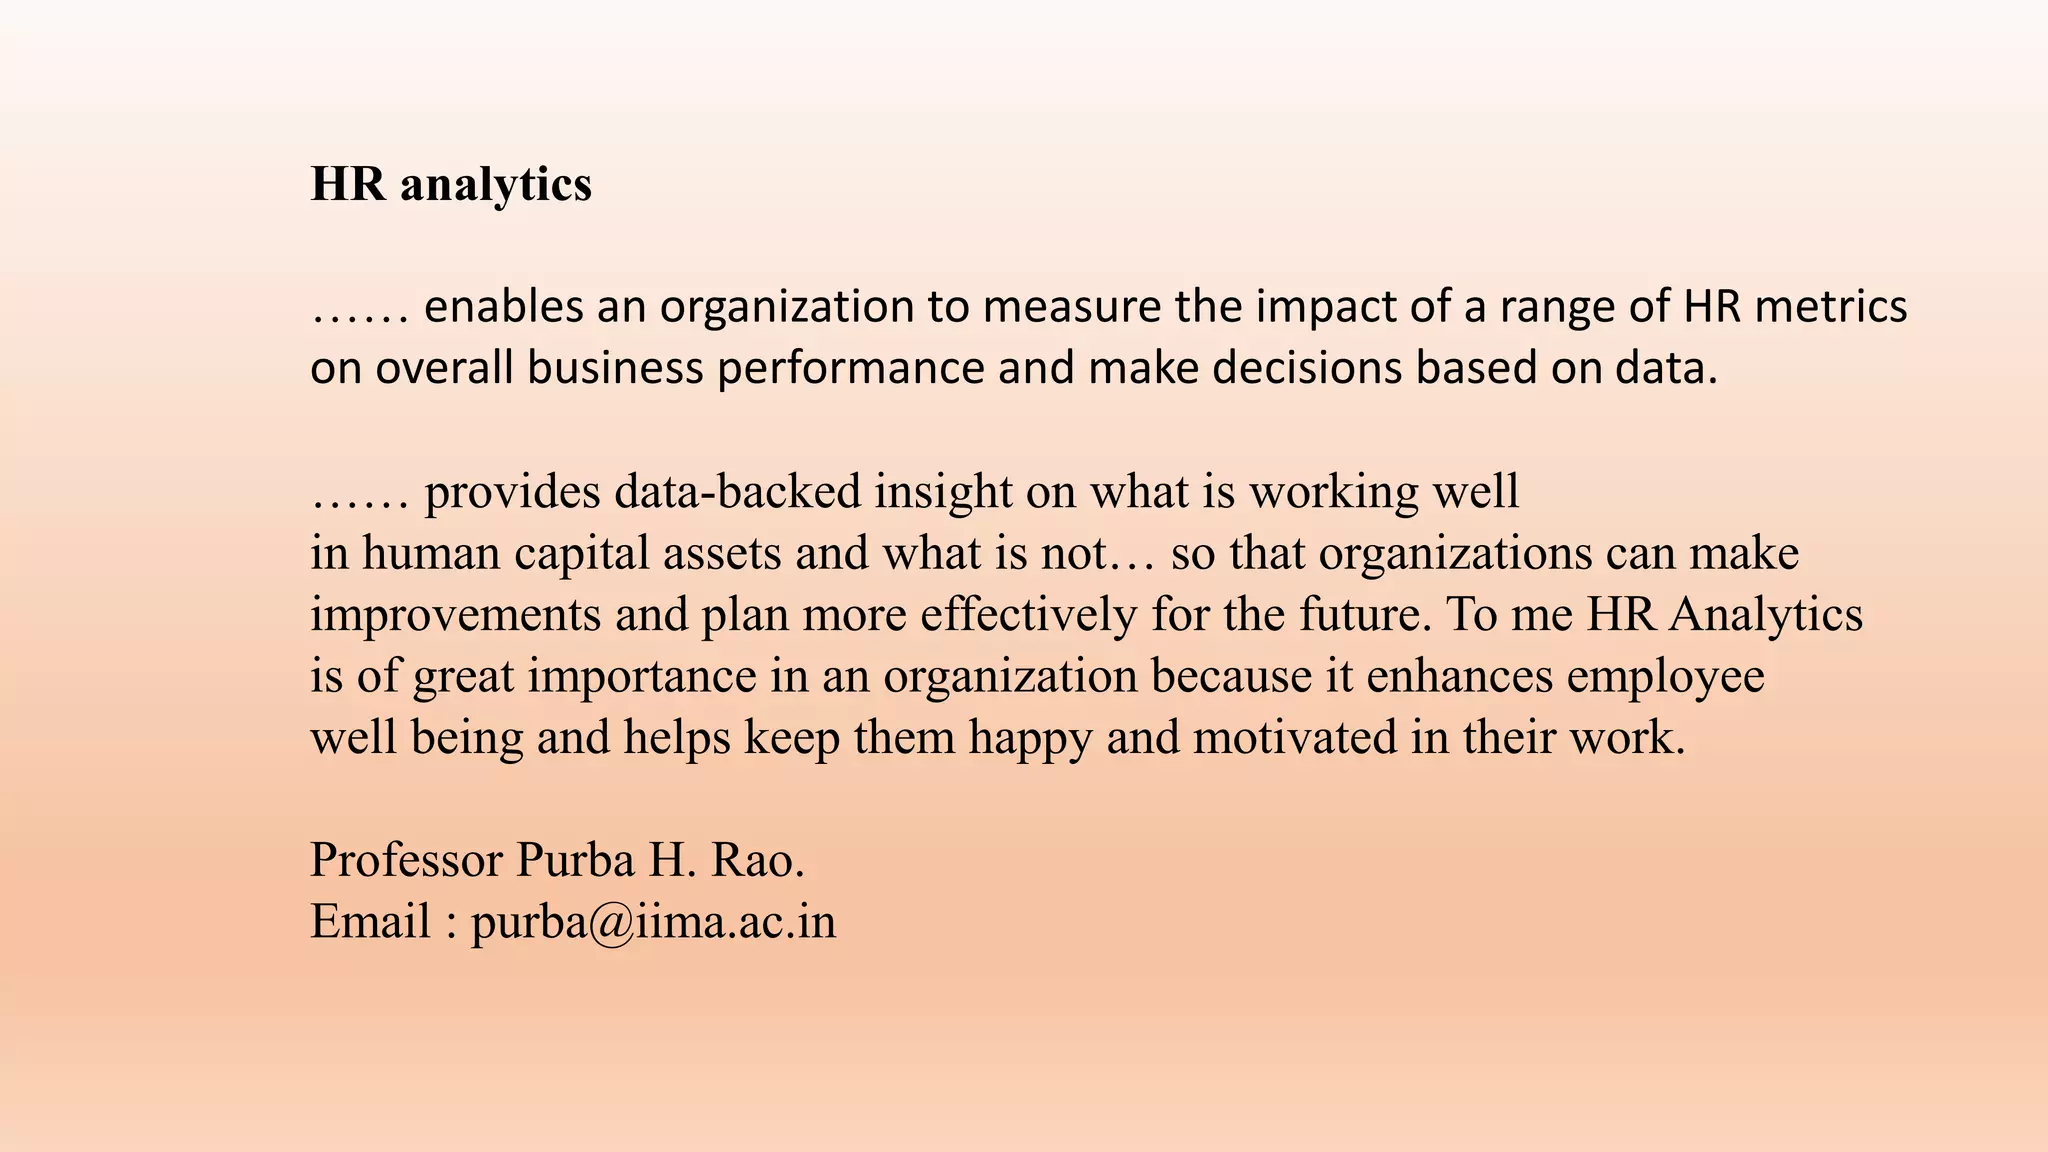
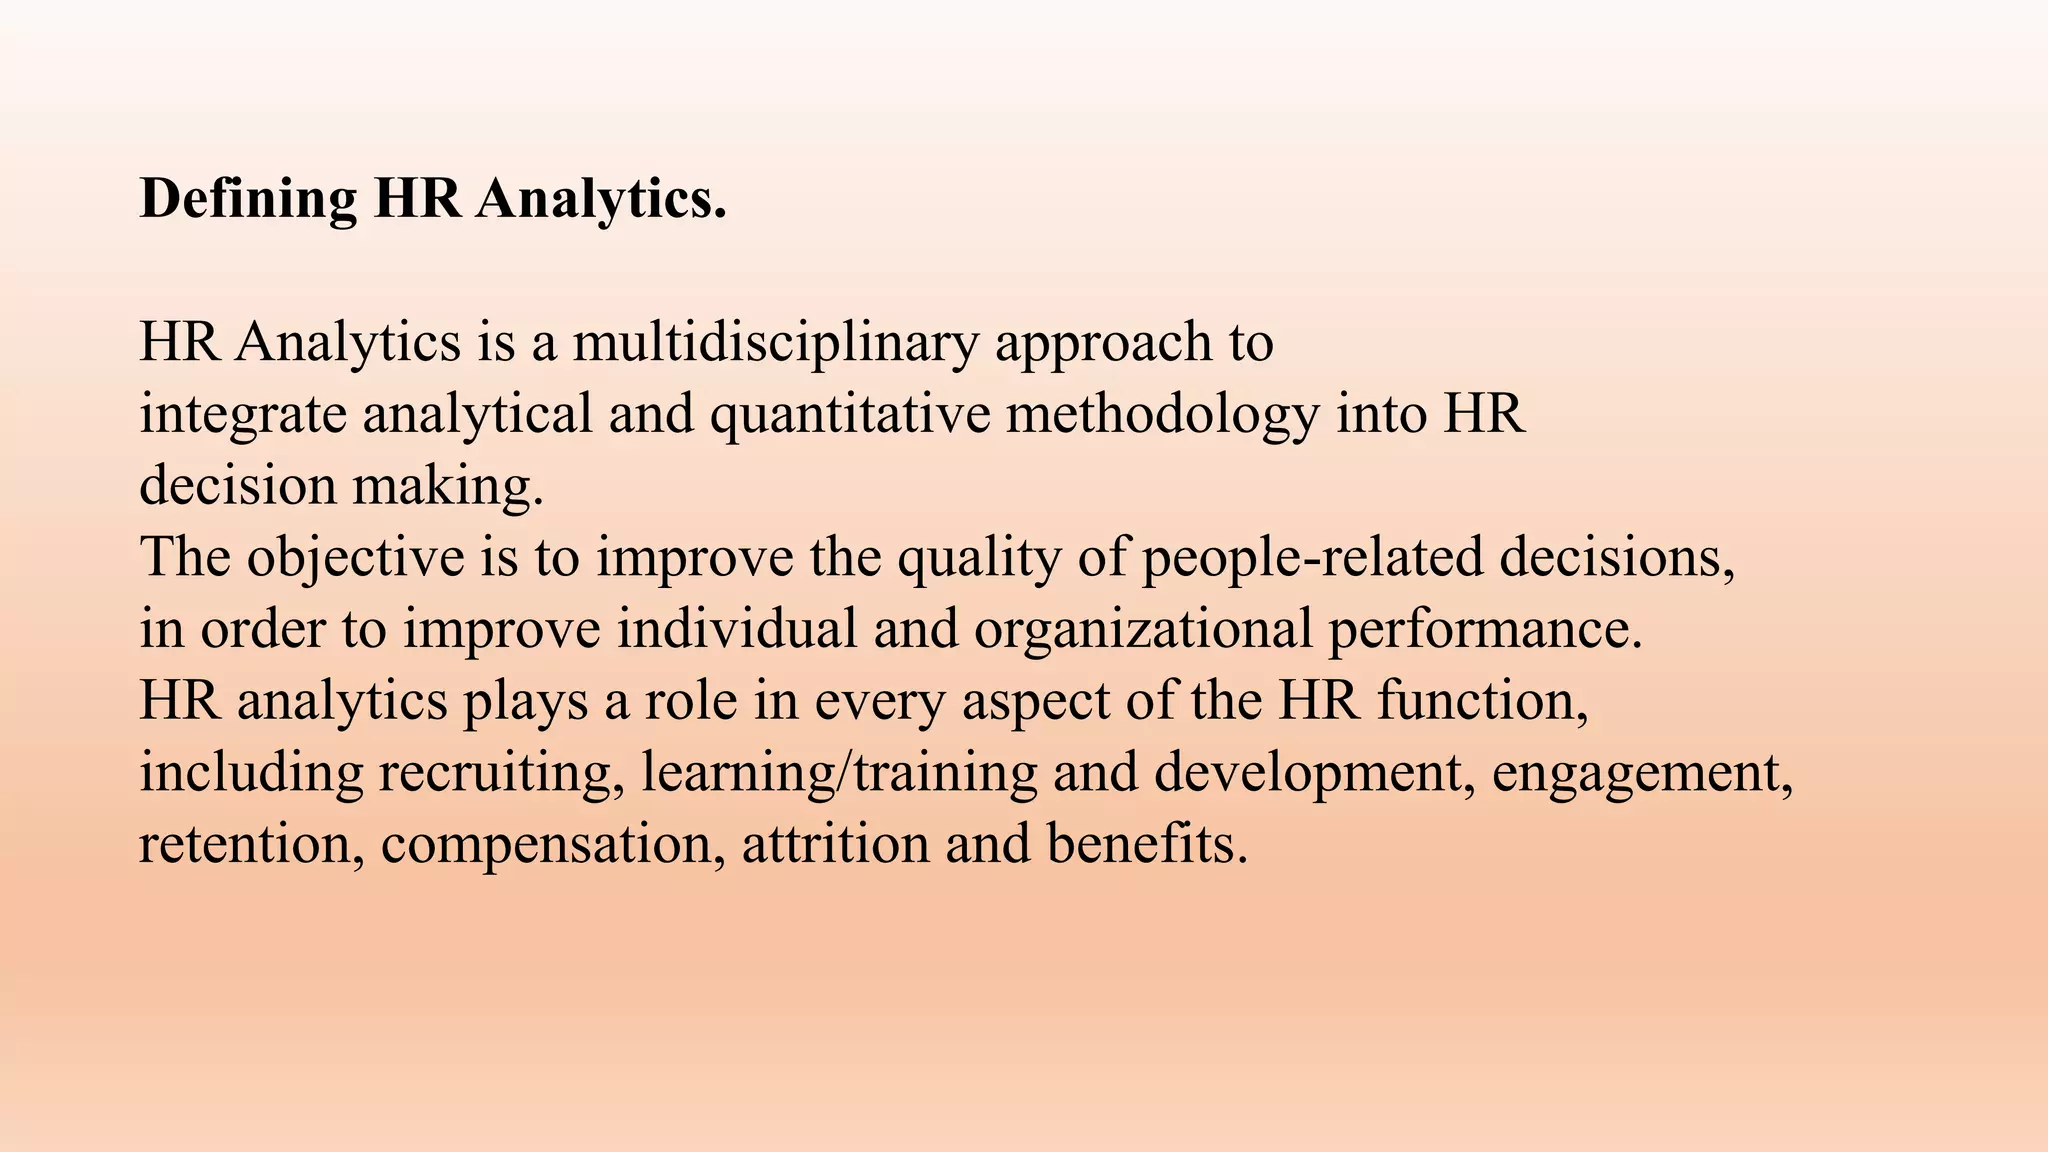
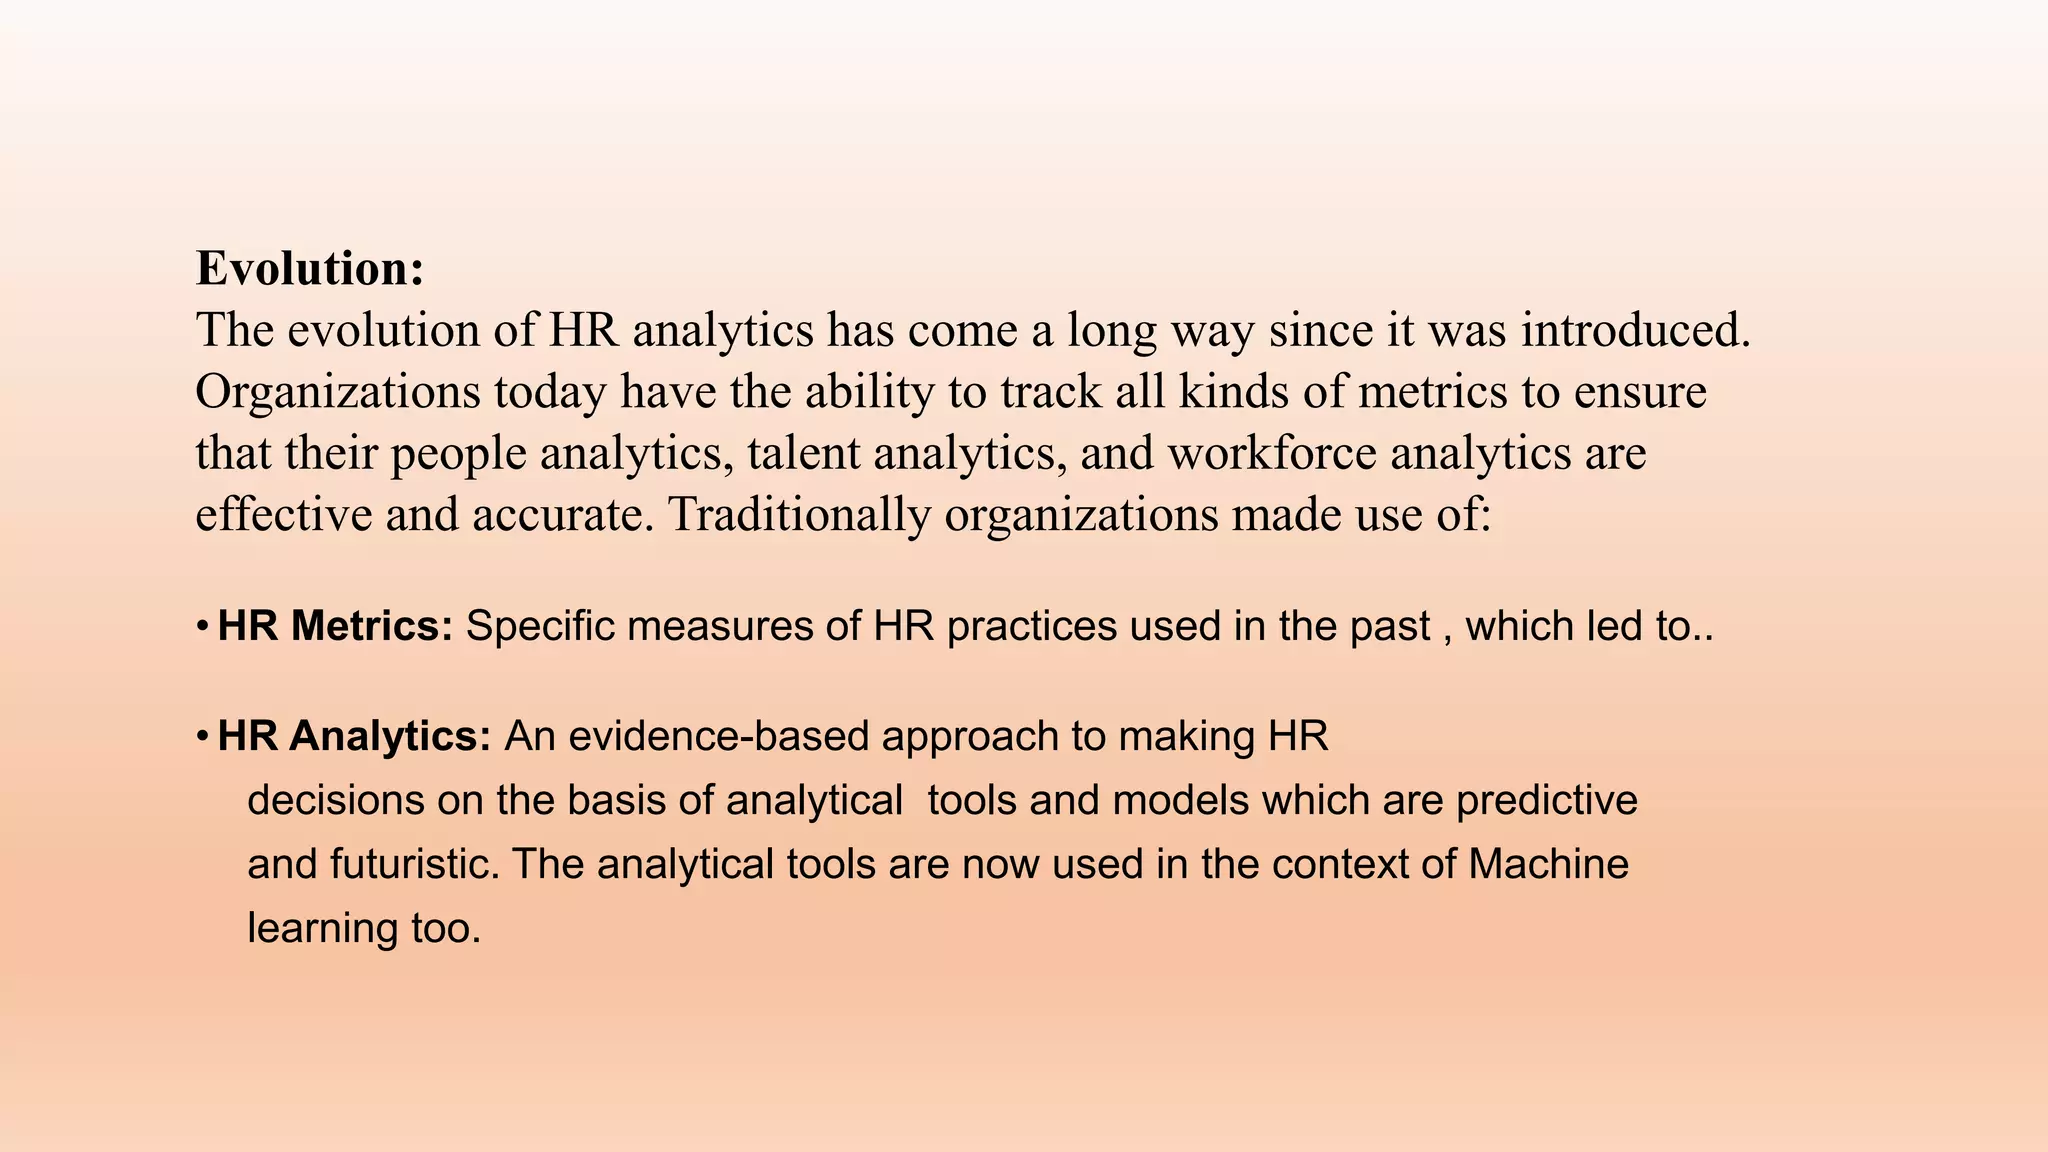
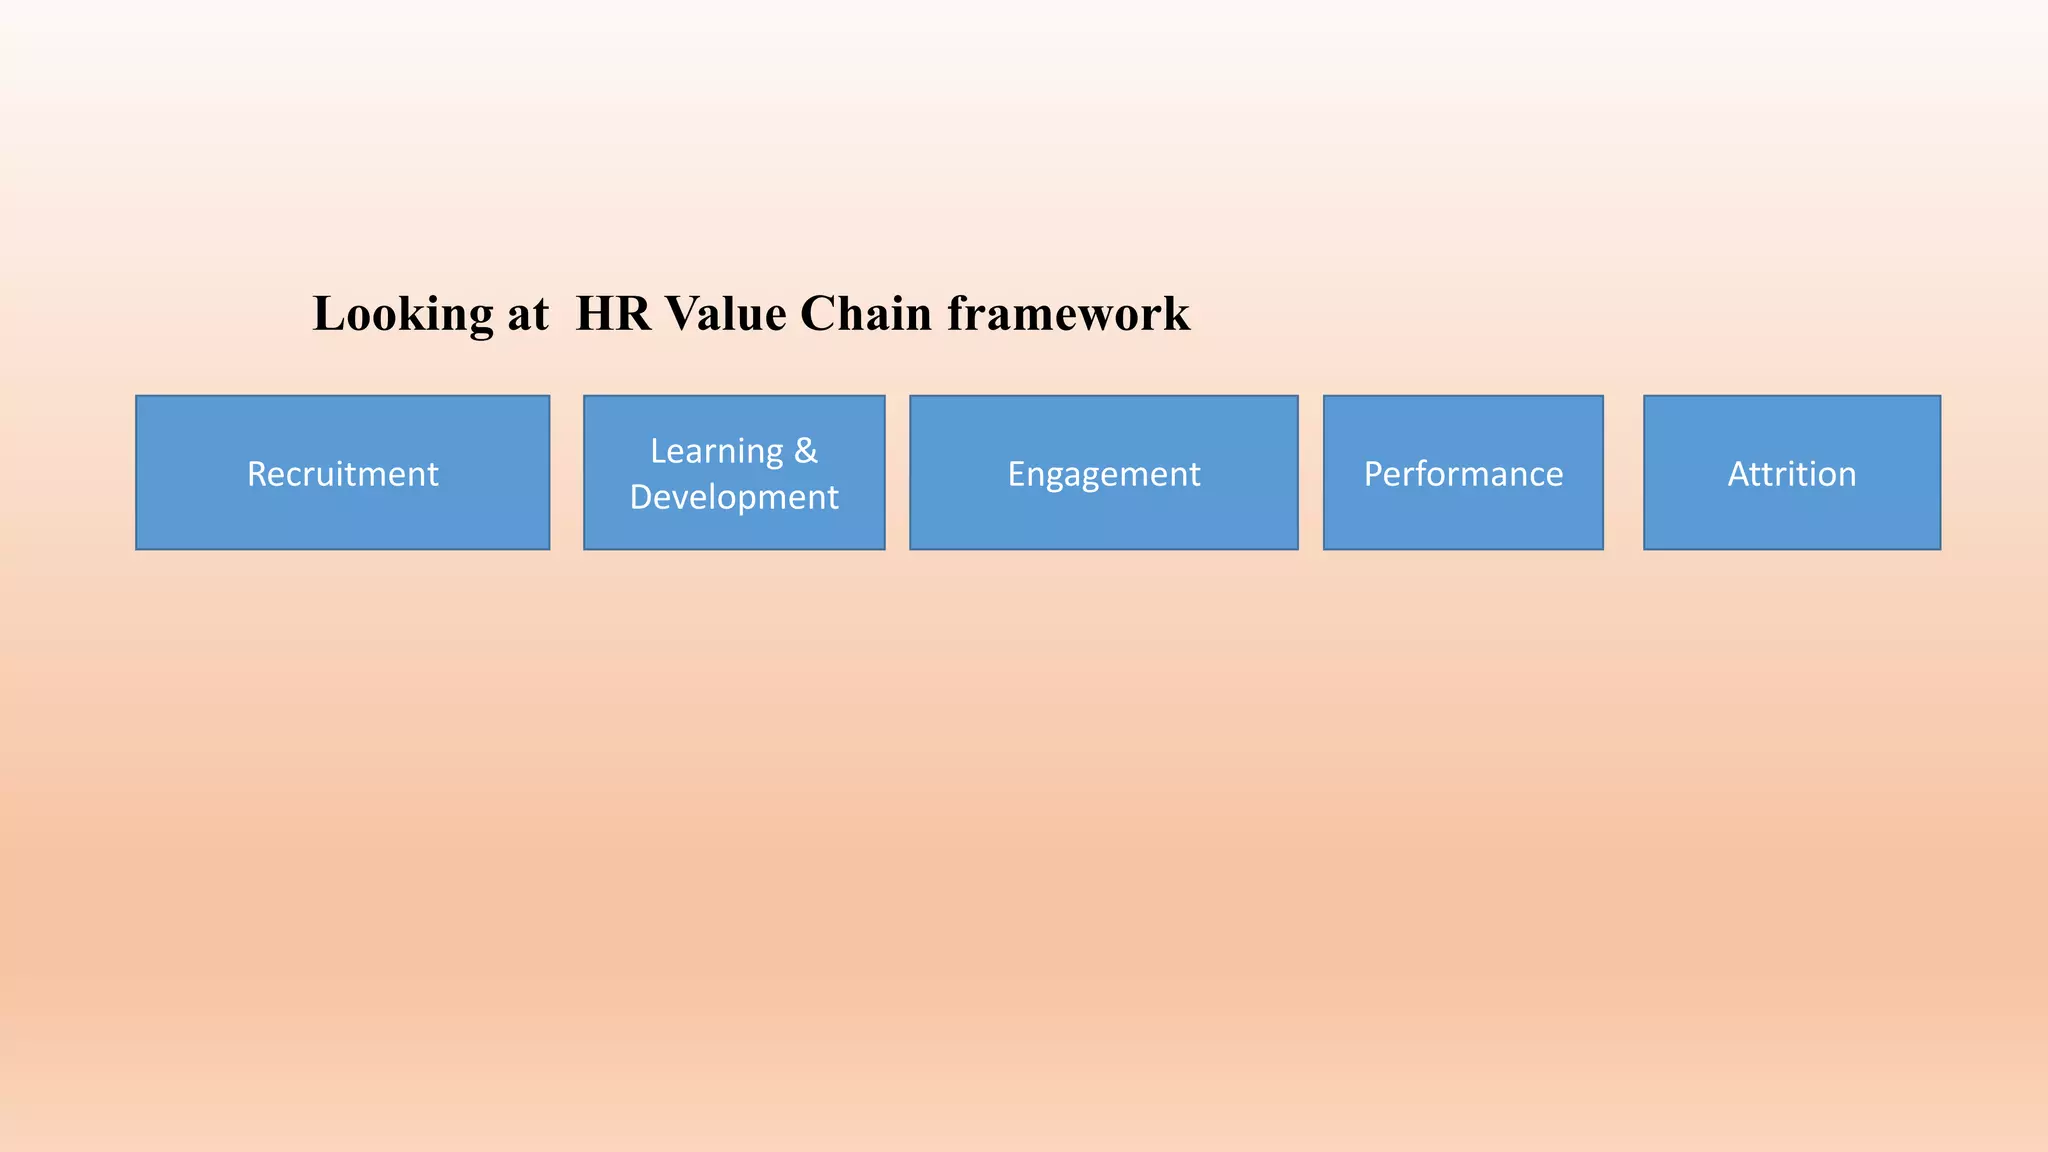
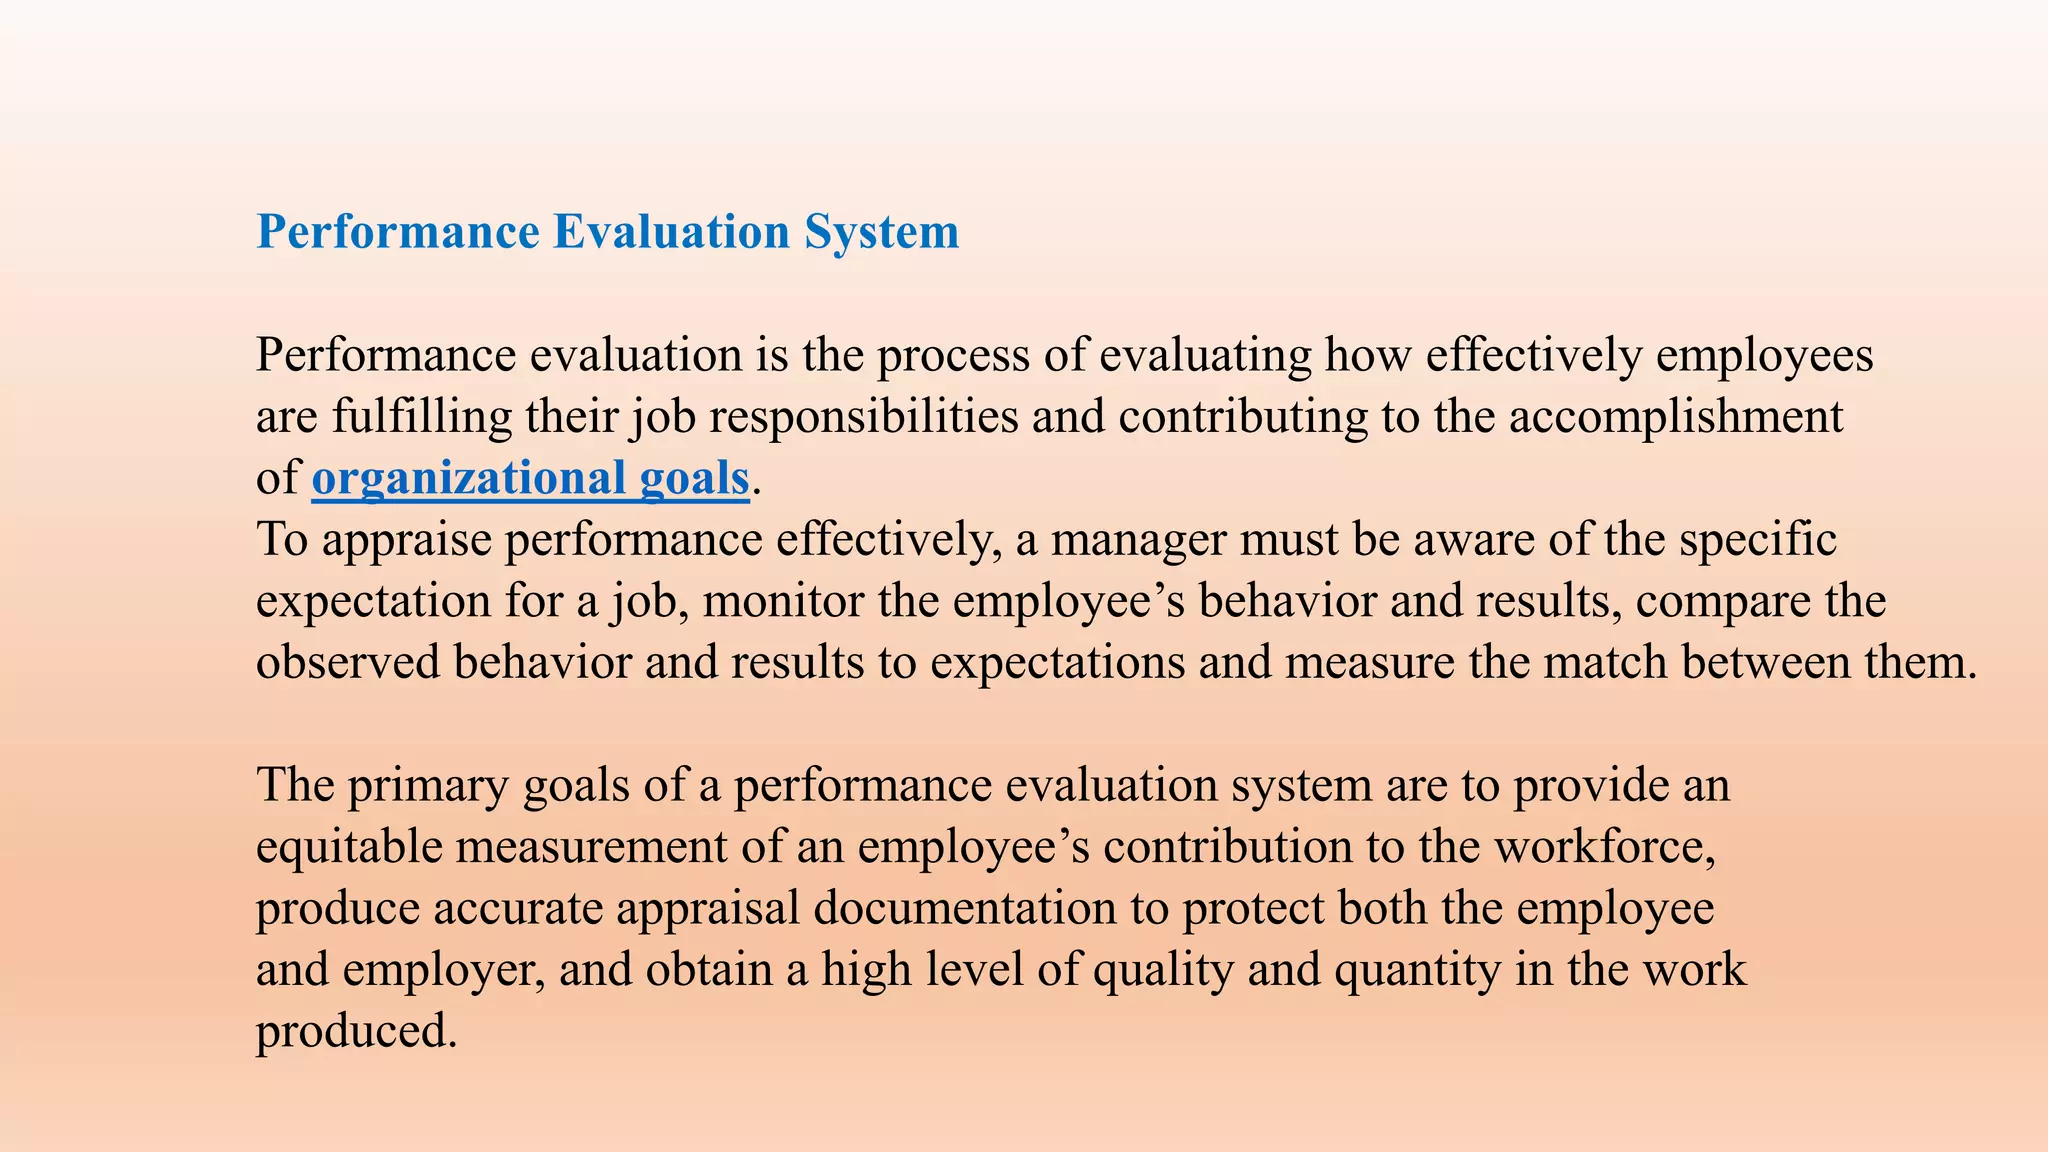
The document discusses HR analytics and its importance in organizations. It provides definitions of HR analytics as a multidisciplinary approach that uses quantitative methods to improve HR decision making and organizational performance. It discusses how HR analytics can be applied across the HR lifecycle including recruitment, learning and development, engagement, retention and other areas. Analytical models that can be used include skills gap analysis, principal component analysis, cluster analysis, and Kirkpatrick model for evaluating training impact. Measuring employee engagement and calculating an engagement score is also discussed as a way to assess organizational performance and drive business outcomes.
Predictive Analytics in HR 4 Use Cases, Benefits & Tips.pdfRosalie Lauren
An array of methods are employed in predictive analytics in HR to examine data and forecast future outcomes. It reduces the impact of biases and subjective evaluations on critical HR processes like hiring and performance reviews. You've come to the correct spot if you're seeking for strategies to keep up in the highly competitive world of human resources.
IDC believes it is the responsibility of HR to address and deliver key elements of digital transformation, as well as transforming the HR function itself. To aid organizations in this process, IDC has identified five key trends and actions that support digital transformation and the development of HR. This tool enables HR professionals to understand the delivery roadmaps for realizing these key transformation
In-depth discussion of HR Key Performance Indicators - selecting, measuring them, and designing tracking and decision processes to enable a strong, sustaining competitive advantage in your business... This deck was presented on 4-7-2015 as part of a BLR sponsored Webinar .
Analytics is the discovery, interpretation & communication of meaningful patterns in data.
HR analytics is a methodology for creating insights on how investments in human capital assets contribute to the success of four principal outcomes.
HR analytics focuses primarily on the HR function and is not – as is largely believed.
The terms HR Analytics, People Analytics, Workforce Analytics are often used interchangeably.
#HR #HRAnalytics #TypesofHR #Analytics #Sourcing #Workforce #PeopleAnalytics #SocialNetworkAnalytics #TimetoHire
Literature ReviewThe role of a Human Resource department is ev.docxSHIVA101531
Literature Review
The role of a Human Resource department is ever changing in today’s volatile business environment. Over the years HR have become a strong strategic partner within an organization by providing functions such as recruitment, training and development and retention. Human Resources in order to be strategic works directly with all levels of management in an effort to help with strategy and the growth of the company to meet their vision. One very important aspect is talent acquisition. Having the right people in key roles within the company is vital to the success and growth. Performing this function includes preparing a job description, recruiting, and then setting compensation. Then a crucial tool used by many HR departments is the process of job evaluations and performance reviews.
Method of Job Analysis
When a new job is created or a vacancy occurs, it is the role of a HR representative to fill that void. In order to perform this function they need to first understand what role they are trying fill and what skills and responsibilities this new role would require. By conducting a job analysis they are able to further define an important elements of any job and then search for the person or people that are a good fit for the company. As important as it is to perform a job analysis before looking for that new candidate, it is equally as important to select the correct job analysis method. Some popular job analysis methods are Observation, Individual Interview and Structured Questionnaires. Organizations choose methods based on various guidelines that are all link to the job responsibilities, company culture and size of the organization. Each organization must select which methods are the best match for their candidate search. The Observation method includes studying someone while they perform their job in an effort to better understand the tasks and duties necessary to this particular job. The advantages are, the observer can obtain first hand knowledge and information about the job being analyzed. This can provide an accurate picture of the candidate ability to do the job at hand. Other Job Analysis methods such as the interview or questionnaire only allow HR to indirectly obtain this information. With other methods there is a risk of omissions or exaggerations are introduced either by the incumbent being interviewed or by items on the questionnaire.
The next method is the Interview method; this method involves conducting interviews of the person leaving this position to gain insights into what duties they perform. Interviews can also be conducted on other employees performing the same job but in most cases start with the HR manager. The advantages are that it allows the incumbent to describe tasks and duties that are not observable. The disadvantage is the candidate can exaggerate or omit tasks and duties. The interviewer must be skilled and ask the proper questions.
The Structured Questionnaire method uses a standardized ...
Workforce Analytics in India - A state-of-evolution report 2018Nitin Dheer
This study is based on a survey conducted by Inqubex Consulting (www.inqubex.com) where we asked HR leaders on their perception of importance of Workforce Analytics as well as the current state of deployment of measurement/ analytics in their HR functions
HR Metrics Consulting provides non-traditional HR solutions to optimize employees as well as organizational performance. It is pioneer in introducing evidence based management frameworks for workforce management in Pakistan and its indigenously developed programs have been approved by Human Resource Certification Institute USA www.hrci.org for continuous professional development and recertification of HR professionals worldwide. This is an unprecedented honor for an HR consulting firm in the history of Pakistan.
Levelwise PageRank with Loop-Based Dead End Handling Strategy : SHORT REPORT ...Subhajit Sahu
Abstract — Levelwise PageRank is an alternative method of PageRank computation which decomposes the input graph into a directed acyclic block-graph of strongly connected components, and processes them in topological order, one level at a time. This enables calculation for ranks in a distributed fashion without per-iteration communication, unlike the standard method where all vertices are processed in each iteration. It however comes with a precondition of the absence of dead ends in the input graph. Here, the native non-distributed performance of Levelwise PageRank was compared against Monolithic PageRank on a CPU as well as a GPU. To ensure a fair comparison, Monolithic PageRank was also performed on a graph where vertices were split by components. Results indicate that Levelwise PageRank is about as fast as Monolithic PageRank on the CPU, but quite a bit slower on the GPU. Slowdown on the GPU is likely caused by a large submission of small workloads, and expected to be non-issue when the computation is performed on massive graphs.
Show drafts
volume_up
Empowering the Data Analytics Ecosystem: A Laser Focus on Value
The data analytics ecosystem thrives when every component functions at its peak, unlocking the true potential of data. Here's a laser focus on key areas for an empowered ecosystem:
1. Democratize Access, Not Data:
Granular Access Controls: Provide users with self-service tools tailored to their specific needs, preventing data overload and misuse.
Data Catalogs: Implement robust data catalogs for easy discovery and understanding of available data sources.
2. Foster Collaboration with Clear Roles:
Data Mesh Architecture: Break down data silos by creating a distributed data ownership model with clear ownership and responsibilities.
Collaborative Workspaces: Utilize interactive platforms where data scientists, analysts, and domain experts can work seamlessly together.
3. Leverage Advanced Analytics Strategically:
AI-powered Automation: Automate repetitive tasks like data cleaning and feature engineering, freeing up data talent for higher-level analysis.
Right-Tool Selection: Strategically choose the most effective advanced analytics techniques (e.g., AI, ML) based on specific business problems.
4. Prioritize Data Quality with Automation:
Automated Data Validation: Implement automated data quality checks to identify and rectify errors at the source, minimizing downstream issues.
Data Lineage Tracking: Track the flow of data throughout the ecosystem, ensuring transparency and facilitating root cause analysis for errors.
5. Cultivate a Data-Driven Mindset:
Metrics-Driven Performance Management: Align KPIs and performance metrics with data-driven insights to ensure actionable decision making.
Data Storytelling Workshops: Equip stakeholders with the skills to translate complex data findings into compelling narratives that drive action.
Benefits of a Precise Ecosystem:
Sharpened Focus: Precise access and clear roles ensure everyone works with the most relevant data, maximizing efficiency.
Actionable Insights: Strategic analytics and automated quality checks lead to more reliable and actionable data insights.
Continuous Improvement: Data-driven performance management fosters a culture of learning and continuous improvement.
Sustainable Growth: Empowered by data, organizations can make informed decisions to drive sustainable growth and innovation.
By focusing on these precise actions, organizations can create an empowered data analytics ecosystem that delivers real value by driving data-driven decisions and maximizing the return on their data investment.
Chatty Kathy - UNC Bootcamp Final Project Presentation - Final Version - 5.23...John Andrews
SlideShare Description for "Chatty Kathy - UNC Bootcamp Final Project Presentation"
Title: Chatty Kathy: Enhancing Physical Activity Among Older Adults
Description:
Discover how Chatty Kathy, an innovative project developed at the UNC Bootcamp, aims to tackle the challenge of low physical activity among older adults. Our AI-driven solution uses peer interaction to boost and sustain exercise levels, significantly improving health outcomes. This presentation covers our problem statement, the rationale behind Chatty Kathy, synthetic data and persona creation, model performance metrics, a visual demonstration of the project, and potential future developments. Join us for an insightful Q&A session to explore the potential of this groundbreaking project.
Project Team: Jay Requarth, Jana Avery, John Andrews, Dr. Dick Davis II, Nee Buntoum, Nam Yeongjin & Mat Nicholas
Explore our comprehensive data analysis project presentation on predicting product ad campaign performance. Learn how data-driven insights can optimize your marketing strategies and enhance campaign effectiveness. Perfect for professionals and students looking to understand the power of data analysis in advertising. for more details visit: https://bostoninstituteofanalytics.org/data-science-and-artificial-intelligence/
Predicting Product Ad Campaign Performance: A Data Analysis Project Presentation
HRAnalyticsstarting2october262021.pptx
1. HR analytics
…… enables an organization to measure the impact of a range of HR metrics
on overall business performance and make decisions based on data.
…… provides data-backed insight on what is working well
in human capital assets and what is not… so that organizations can make
improvements and plan more effectively for the future. To me HR Analytics
is of great importance in an organization because it enhances employee
well being and helps keep them happy and motivated in their work.
Professor Purba H. Rao.
Email : purba@iima.ac.in
2. Defining HR Analytics.
HR Analytics is a multidisciplinary approach to
integrate analytical and quantitative methodology into HR
decision making.
The objective is to improve the quality of people-related decisions,
in order to improve individual and organizational performance.
HR analytics plays a role in every aspect of the HR function,
including recruiting, learning/training and development, engagement,
retention, compensation, attrition and benefits.
3. Evolution:
The evolution of HR analytics has come a long way since it was introduced.
Organizations today have the ability to track all kinds of metrics to ensure
that their people analytics, talent analytics, and workforce analytics are
effective and accurate. Traditionally organizations made use of:
• HR Metrics: Specific measures of HR practices used in the past , which led to..
• HR Analytics: An evidence-based approach to making HR
decisions on the basis of analytical tools and models which are predictive
and futuristic. The analytical tools are now used in the context of Machine
learning too.
5. So, from the metrics- way we have now come to applying HR Analytics,
which comprises :
• A methodology for developing innovative insights
• Linking HR data, survey data, and business or organization
data (financial, client, operational…)
• Applying analytical and machine language techniques
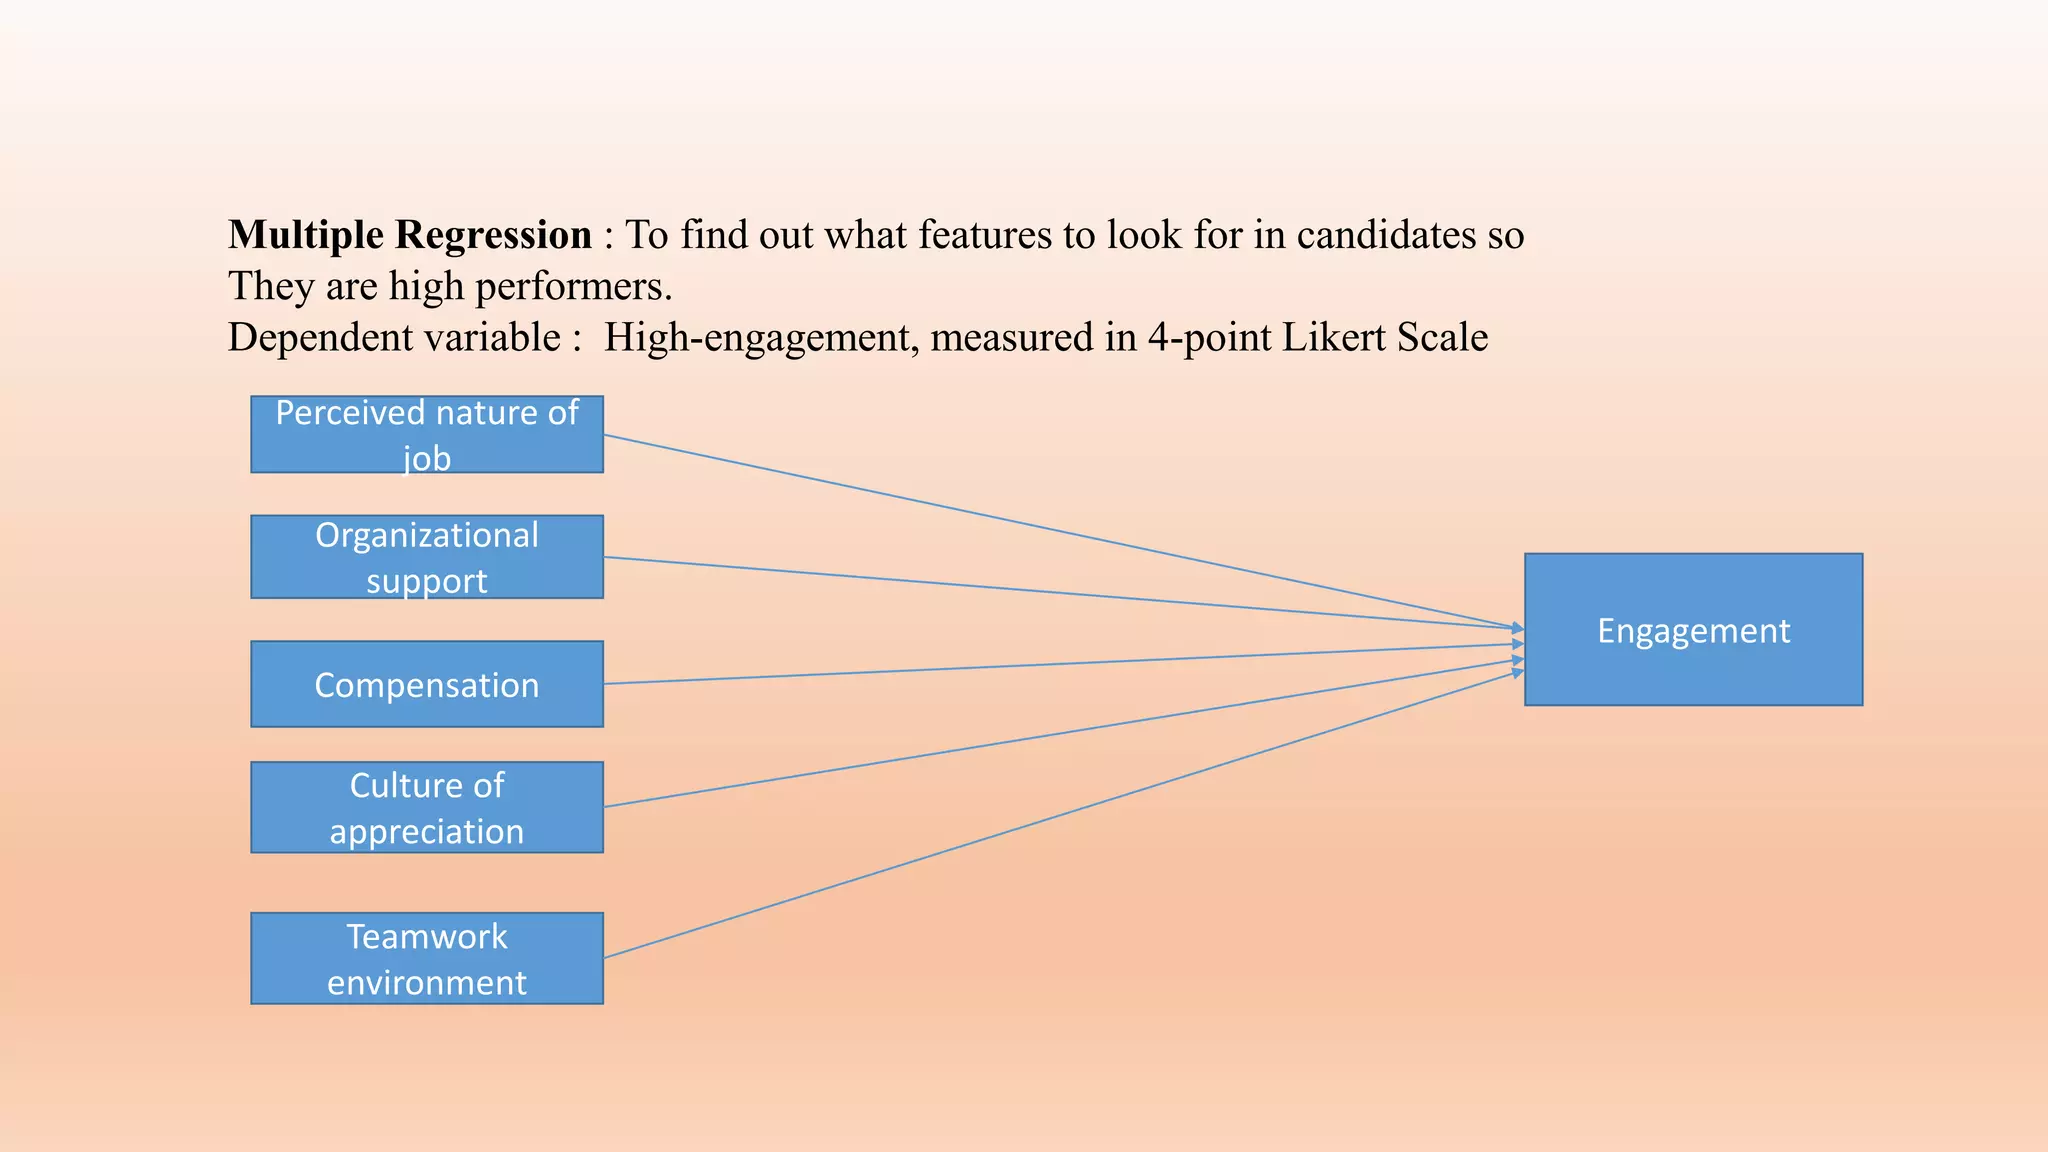
( Factor and Cluster analysis, correlations, regression,
Logistic regression, Classification trees modeling, using
natural language programming, text mining, word
clouds…);
• Quantifying (or identifying) the impact of investments in
human capital on the business or organization’.
[4 points Definition (the emphasis is on Impact)]
6. In today’s world advancement of technologies has combined with predictive
analytics and has exponentially enhanced HR purposes in every HR aspect.
HRPA ( HR Predictive Analytics) generates insights that cannot be achieved
through traditional Benchmarking as the traditional analytics is reactive
whereas HRPA is proactive and helps to predict the future using statistical,
machine learning and data mining modeling systems.
The benefits of HR analytics are many including,
improved ROI, improved retention rates, and improved
business processes.
7. Specifying Benefits of HR analytics today
HR analytics, thanks to the advances in technology, have come a
long way since they were first introduced. From being able to only
evaluate goals and KPIs on data-gathering, thanks to the
evolution of HR analytics, HR professionals can do so much more
with their data-driven metrics.
Advances in technology would mean
data collection and storing facilities,
computer capabilities to analyze data
softwares available to apply on the data.
8. Examples for Benefits of HR Analytics:
Recruiting employees who will be high performers.
Organizations have a huge amount of data about their employees: their
personal details, education, family background and so on.
They also have data about employees’ performance and behaviors.
Hence, they can correlate all these dimensions to determine
the typical profile of an employee who is likely to be successful with them.
That’s the power of predictive analytics!”
Employees Leaving the Company
One of the many benefits of HR analytics today is the ability to properly determine
the likelihood of any employee leaving the company. This HR metric is
predictive based on specific variables and can save the company a lot of money
when it comes to retention and recruitment efforts.
9. Examples of Benefits of HR Analytics
Employee Engagement
Employee engagement has become a very important HR metric for
organizations today as more and more businesses begin to realize
the impact engaged employees have on their bottom line.
Measuring employee engagement allows employers to know the extent to
which employees are involved in different projects, allows employees to
identify with the corporate image or brand and believe in the organization,
as well as allows employers and employees to align with the strategy
of the business. The benefit of this new HR metric is
improved engagement, retention and reduced turnover rates.
10. Benefits of HR Analytics:
Performance Prediction
Another benefit of HR analytics today is being able to hire employees based
on what they can bring to the company, rather than what their
background is. Many employers today have
begun to realize that having a degree doesn’t necessarily make a candidate a
better match for an open position and in some cases, their experience and soft skills
such as attitude towards work ethics and ability to operate in teams, are
much more important. Thanks to the evolution of HR analytics, companies
today can ensure that they’re hiring the best employees to fill any open positions,
based on the expected performance they would bring to the table.
11. From being able to only gather data but not do much with it, to being able to
determine the likelihood of an employee staying with your company for an
extended period of time, the evolution of HR analytics is
still an ongoing process but continues to improve HR processes at all
types of organizations.
Without proper HR Analytics implemented at your organization, you will
be able to experience the massive amount of benefits of HR analytics today.
Source:
Evolution of HR Analytics: Everything You Need To Know
https://www.techfunnel.com/hr-tech/evolution-of-hr-analytics-everything-you-need-to-know/
By Emily Pribanic - Last Updated on February 17, 2020
13. Recruitment Phase.
Recruitment refers to the overall process of identifying, attracting, screening,
shortlisting, and interviewing suitable candidates for jobs
(either permanent or temporary) within an organization.
Traditionally, recruitment and selection used to define the process when
people would apply for jobs using traditional paper applications and resumes,
compared to people who apply online. Companies used traditional interviewing
and hiring techniques and make a selection for candidates who would
be expected to do well in the organization. In fact the selected
candidates would be expected to bring significant value to the company.
14. Traditional recruitment methods have and are still being utilized by employers
across the globe. The simplicity and familiarity of using these methods such as;
paper-based job postings, internal hiring, referrals and word-of-mouth, are
what make these still popular choices amongst lots of hiring
professionals today. However, these techniques within hiring and recruitment are
simply not enough to acquire top talent in a technological era. Instead, a
more modern (& slightly updated) approach means hiring teams can make
more effective and efficient hiring decisions with the assistance of technology.
15. Analytical Models we use in Recruitment:
For Recruitment phase :
We could use a simple approach to scoring of candidates, where
Score can be a weighted average of skills which are required. The weights
Can be determined by importances attached to the different skills,
as obtained from the managers and supervisors.
This could be carried out with use of Analysis of Variance as well as Multiple Linear
Regression to determine what factors lead to possible high performance.
Many softwares including excel and R- Studio can do this.
16. Learning and development
Learning and development is a systematic process to enhance an
employee’s skills, knowledge, and competency, resulting in better
performance in a work setting. Specifically, learning is
concerned with the acquisition of knowledge, skills, and attitudes.
Development is the broadening and deepening of knowledge in line with
one’s development goals.
Learning, training, and development are often used interchangeably.
However, there are subtle differences between these concepts:
17.
18. Analytical Models we may use in the L&D phase:
Skills Gap Analysis.
An effective learning and development strategy relies on a process in which
one continually moves through learning, attaining competencies and then
Move to organizational capabilities.
An essential part of this process is to determine the competencies/skills
which are required in the organization and the level of these competencies
already in existence with the employees.
This is the Skills Gap Analysis as applied to the Learning & Development phase.
19. To give an example: Consider a list of competencies required in employees.
When an organization looks at competencies required in employees, it often considers
the following skills :
Communication skill, written and spoken
Business Acumen. Business Acumen is keenness and quickness in understanding
and dealing with a business situation in a manner that is likely to
lead to a good outcome
Planning & Organization, refers to the skill of steps to be taken, prioritize tasks
and time management
Problem solving skills , This refers to defining a problem; determining the cause
of the problem; identifying, prioritizing, selecting alternatives for a solution;
implementing a solution.
Future Developments, process that helps the company establish and maintain
relationships with future prospects, learn about changing markets,
supply chain alterations and changing macro economic environments
20. Changing Business Landscapes : responding to the new global challenges , changing supply chains,
changing labor standards, human rights, climate change, market place
Process and performance indicators, specifically focus on business processes measuring and
monitoring operations, HR, Marketing and supply chain processes
Identify Resource Requirements, to provide services, reach markets, maintain relationships
with clients and earn revenue.
Supply chain management (SCM) is management of the flow of goods, data, and
finances related to a product or service, from the procurement of raw materials to
the delivery of the product at its final destination
Market knowledge :to know about the potential consumers behaviour which is directly and
indirectly connected to the products and services
21. One can apply skills gap analysis in the L& D phase to identify which skills
Need to be enhanced by training ( L&D)
-2
0
2
4
6
8
10
communication
businessacumen
planning&organization
problemsolvngskill
futuredev
changing business landscape
processes and performance
indicators
identify resource requirements
supplychain
market
Skills Gap Analysis
reqd exist
22. Analytical Models we can apply L&D phase:
Principal Component Analysis:
To determine inherent dimensions in the skills required in the employees
To determine inherent dimensions existing in the employee skill set.
K-means Cluster Analysis to determine groups of employees having homogenous skills.
23. Factor Analysis in HR context:
Principal Component Analysis
Assume there are many variables under
consideration many of which are interrelated.
So there are groups of inter correlated variables.
Each of these groups is represented by a
Factor or Dimension, F1, F2 …
Factors are linear combinations of variables
so that
F1 = a11V1+a12V2+…
F2 = a21V1+a22V2+…
24. Consider an example in Factor Analysis:
Consider a database having 6 competencies on which
Employees have been rated.
So there are 6 variables:
V1= competency on business acumen
V2= competency on planning & development
V3= competency on problem solving skill
V4= understanding future development
V5= understanding on changing lanscape
V6= competency on communication
25. The six variables have the following correlation martrix between them:
v1 v2 v3 v4 v5 v6
-------------------------------------------------------------------------------------------
V1 1 .8 .9 .1 .06 .08
V2 1 .85 .08 .1 .04
V3 1 .02 .05 .04
V4 1 .9 .08
V5 1 .02
V6 1
-------------------------------------------------------------------------------------------
There is very high correlation between v1,v2 and v3.
Also very high correlation between v4 and v5. v6 is on its own.
This result indicates that there are three factors,F1,F2 , F3 ;
F1 representing v1,v2 and v3. F2 representing v4 and v5. F3=v6
F1 measures a dimension which is common to v1,v2,v3.
F2 measures another dimension, common to v4,v5 and
F3 measuringv6.
26. F1: can be labelled knowledge of business sense
F2: changing business scenario
F3: communication
Rotation of factors :
To help clearer identification of factors we make use of varimax rotation.
Other approaches are quartimax, equamax.
Save factor scores for further analysis
27. Concepts of cluster analysis in HR
Typically, Cluster Analysis applications
are observed in market segmentation
studies. This multivariate approach
identifies homogeneous groups, called
Clusters of respondents in a way that
the members in any cluster are similar
to each other but different from the
respondents in the other clusters.
In our HR context we often apply Cluster analysis to
identify groups of employees with homogeneous
skills.
28. In the Learning & Development phase, an organization often needs to conduct a
Training Evaluation process:
The Kirkpatrick Model is a globally recognized method of evaluating the
results of training and learning programs. It assesses both formal and informal training methods
and rates them against four levels of criteria: reaction, learning, behavior, and results.
29. Level 1: Reaction
The first level of criteria is “reaction,” which measures whether learners find the
training engaging, favorable, and relevant to their jobs. This level is most commonly assessed by
an after-training survey (often referred to as a “smile sheet”) that asks students to rate their experience.
Level 2: Learning
Level 2 gauges the learning of each participant based on whether learners acquire the intended
knowledge, skills, attitude, confidence and commitment to the training. Methods of assessment
include exams or interview-style evaluations. A defined, clear scoring process must be
determined in advance to reduce inconsistencies.
Level 3: Behavior
One of the most crucial steps in the Kirkpatrick Model, Level 3 measures whether participants
were truly impacted by the learning and if they’re applying what they learn. Assessing behavioral
changes makes it possible to know not only whether the skills were understood, but if it's
logistically possible to use the skills in the workplace.
Level 4: Results
The final level, Level 4, is dedicated to measuring direct results. Level Four measures the
learning against an organization's business outcomes— the Key Performance Indicators that were
established before learning was initiated. Common KPI’s include higher return on investments,
less workplace accidents, and larger quantity of sales.
https://www.ardentlearning.com/blog/what-is-the-kirkpatrick-model
30. Level 5 in Kirkpatrick Model
Level 5 isn’t featured in the original Kirkpatrick Model but is an additional level of
evaluation created by Jack Phillips that uses cost-benefit analysis to determine
the value of training programs. In other words, it helps companies calculate
whether the money they spent on training produced measurable business results.
The standard formula for measuring the ROI Of training is as follows:
ROI (percentage) = ((Monetary benefits – Training costs)/Training Costs) x 100.
32. Engagement:
Employee engagement can be explained as a positive employees’
emotional attachment and Commitment to the organization.
Robinson et al. (2004) define employee engagement as
“a positive attitude held by the employee towards the organization
and its value.
An engaged employee is aware of business context, and works
with colleagues to improve performance within the job for the
benefit of the organization.
33. Engagement is about passion and commitment-the willingness to invest
oneself and expand one’s discretionary effort to help the employer succeed,
which is beyond simple satisfaction with the employment arrangement or
basic loyalty to the employer
(BlessingWhite, 2008; Erickson, 2005; Macey and Schnieder ,2008).
There are four key drivers of engagement:
Job
Manager
People
Organization
Employees can become disengaged where there’s an imbalance or misalignment
in any of these areas.
34. Employee Engagement is key to success in any organization . There is a clear link
between engaged employees and the level of customer service that company
can provide and bottom line.
Lack of employee engagement leads to organization culture being detrimental
to physical and mental health of employees.
Substandard nature of the job, discontented personal factors, uncongenial
organizational support, dispirited perceptual factors and hostile organizational
culture are the main determinants of lack of engagement and attrition in the organization.
35. The Employee Engagement Score – A Simple Way to Calculate Engagement
The most common measure of Employee Engagement is to create a Employee
Engagement Score through an engagement survey.
This can be supplemented by other indicators that are proxies for engagement.
This includes absence and attrition rates, as well as indirect factors such as Employee
Satisfaction (ESAT) or Net Promoter Score, NPS (measures employee experience
and predicts business growth) .
In addition, there is no substitute for walking round the company and talking
with people.
Good leaders will instinctively have a good feel for the mood of the company
and how engaged everyone is
36. Engagement is the state of emotional and intellectual involvement an employee has to
an organization. Organization encourages employees to say, stay and strive.
The third phase: Engagement
Strive Harder
and
Contribute
Encourages
employees Stay
Committed and Loyal
Encourages employees to be Brand
Ambassadors
■Create positive environment
■Attract and retain
■ Talent
■ Customers
■ Business Partners
■Employee retention
■Continuity and consistency
■Engaged Employees drive growth
■ Engage Customers
■ Improve Productiivity
■Provide sustainable competitive advantage
1
Say
Say
1
Say
Say
Stay
Stay
2
Stay
Stay
2
3
Strive
Strive
3
Strive
Strive
37. Employee engagement score:
I would not hesitate to recommend this company to a friend seeking employment
Given the opportunity, I tell others great things about working here
It would take a lot to get me to leave this company
I rarely think about leaving this company to work somewhere else
This company inspires me to do my best work every day
People here are always willing to give effort beyond requirements to help the
organization succeed
SAY
STAY
STRIVE
India Best
Employers
82 %
91 %
86 %
88 %
79 %
91 %
Company
Scores
71 %
78 %
69 %
68%
57 %
84 %
• High “SAY” scores reflective of a strong employer brand
• STAY scores lower than 60% would be an indication of talent risk
• “STRIVE” scores reflective of a workforce willing to go “beyond the brief”
The Employee Engagement score was determined by responses to the
following questions:
38. Engagement Survey :
Employee Engagement is often measured in terms of different attributes which have
been identified with a lot of research. These are:
Perceived value of job
The employee should see the following attributes in his/her job:
*High Perceived Value of job content
• presence of Equality
• presence of Advancement Opportunities
• No Incompatible Policies
Teamwork environment Organizational Culture
*Do not see Power and Politics
• satisfied with Colleagues and teamwork
*culture of promoting/supporting teamwork
39. Compensation Personal Factors
• Satisfied with compensation
• Compensation comparable with other organizations
• OK with leave and working hours
Positive Nature of Job
• Presence of Skill Variety among colleagues
• Interesting Nature of Job
• Presence of Challenge
.Organizational Support
• Regular Working Hours
• Emphasis on quality as well quantity
• Effective Supervision
40. Self-Fulfillment Factors
* Lack of Partiality
• Achievement always recognized
* Good Mentoring
• Sure of career growth
Engagement
I feel fully engaged on my job in my company:
NA SomewhatA A stronglyagree
41. Multiple Regression : To find out what features to look for in candidates so
They are high performers.
Dependent variable : High-engagement, measured in 4-point Likert Scale
Engagement
Perceived nature of
job
Organizational
support
Teamwork
environment
Compensation
Culture of
appreciation
42. Performance Evaluation System
Performance evaluation is the process of evaluating how effectively employees
are fulfilling their job responsibilities and contributing to the accomplishment
of organizational goals.
To appraise performance effectively, a manager must be aware of the specific
expectation for a job, monitor the employee’s behavior and results, compare the
observed behavior and results to expectations and measure the match between them.
The primary goals of a performance evaluation system are to provide an
equitable measurement of an employee’s contribution to the workforce,
produce accurate appraisal documentation to protect both the employee
and employer, and obtain a high level of quality and quantity in the work
produced.
43. Consider a performance evaluation being carried out over several departments in
an organization.
First it is necessary to determine the specific items on which the
employees will be evaluated.
Planning & organization
Quality & accuracy
Analytical aptitude
Oral & written communication
Productivity
Client orientation
Innovation as demonstrated
Leadership exhibited
44. We consider next an analytical model: to determine
attributes in Performance leading to “ promotion”. This
could be conducted by Logistic Regression or
Decision trees.
Here we consider a binary categorical dependent variable
called “promote”. In the database promote is = 1, if
employee did get promoted, 0 otherwise.
This is also called Target variable.
The predictor variables comprise : several demographic
variables,
communication exhibited,
leadership exhibited,
Variety of skills exhibited,
Client orientation exhibited,
Initiative exhibited…
45. A Machine Learning Approach… Decision Trees
Decision Tree approach, which is a combination of heuristic and statistical modeling, includes
many algorithms which work efficiently in organizations having extensive data bases. Of these
recursive partitioning algorithms, or decision trees, are a versatile tool for finding out trends,
patterns or relationships in the data.
There are many algorithms under the decision tree approach which contain procedures capable of
combing through a large set of predictor variables , successively splitting a data set into subgroups to
improve the prediction of the target dependent variable . Usually, decision tree approaches work very
well when there are too many predictor variables.
The algorithm starts with a target variable usually taking up values of 1 or 0 . It starts with a base
node called root node. The root node gives the response rate as well as the total size of the sample
being considered in the data base.
46. Classification Trees, CART: Classification and Regression Trees
Here the dependent variable, also called target variable, is “promote”
Predictor variables :
Demographic variables such as age, income, edu…
Performance in Planning and Organizing Work, etc.
The tree has circles and rectangles where rectangles are terminal
variables, which only has branches coming in.
The tree starts with most significant variable on top.
The tree grows by Recursive Partitioning Steps.
47. Case: Determine attributes in Performance leading to “ promotion”
Consider a large employee database in a company containing demographic variables
And performance related attributes such as :
Performance in planning and organization
Performance related to Quality & Accuracy
Communication demonstrated
Leadership demonstrated
Variety of skills demonstrated
Client orientation demonstrated
Initiative exhibited.
These are the predictor variables.
In the employee database there is also a column “promote” =1, if employee got
Promoted in last 5 years, 0 otherwise. This is the Target variable. Also called root node.
50. Employee Attrition
Employee retention is a key objective for most HR organizations, and employee
turnover is the single most concern in most prevalent HR metric. However,
knowing your turnover rate does little to support strategic business plans.
To achieve true insight, a more in-depth analysis of what’s causing turnover in
different parts of the organization is required.
In order to reduce employee turnover, HR needs to become more data-driven, looking past
simple descriptive analytics and towards more exploratory analytics, and (even better)
predictive analytics.
If the organization gets to know which employees are high risk for attrition,
preventive initiatives can be taken to address the concerns of the employee who is leaving.
HR Analytics helps to determine the probability that a certain employee may like leave.
51. Predictive Attrition Model – Logistic Regression
Through predictive algorithms, companies gain better understanding and can undertake
preventive measures for employee attrition.
On a basic level, the model works by classifying employee profiles based on various
attributes such as age, sex, marital status, education level, work experience, distance from
hometown, etc. and generates various levels of risk of attrition.
Occasionally, other parameters like performance over the years, pay raise,
work batch, educational institution are also taken into consideration.
However, the accuracy of the model is directly proportional to the selection of
parameters, which in turn, leads to the generation of the ‘type’ of predictive model
most suitable for the organization.
52. Creating the Model
Various statistical and machine learning algorithms are designed to construct
the predictive models to determine factors leading to attrition.
We can use the Logistic Regression model which gives the ‘probability of attrition’
when the outcomes are dichotomous, stay or leave.
Consider an employee database where employee demographic variables are
available, academic background, previous experience, if workplace is far from
home, state of health ( self assessed), size of previous company worked,
if previous company was MNC , perceived growth opportunities in the current
Company, perceived culture of appreciation in the current company,
level/amount of training received in the company, salary benefit and whether
the employee stayed or left.
53. Analyzing employee feedback :
When unexpected attrition happens the company must find a way not just to see
how many people were leaving but to understand why they were leaving,
if employees would continue to leave, and how to adapt the workforce
strategy to prevent employees leaving.
One method would be to take exit feedback.
This could be in terms of a quantitative survey similar to previous case.
Or in terms of qualitative feedback, in terms of document, word file for example.
We have discussed how to analyze quantitative survey.
Now we discuss how to analyze documents… with the help of text mining.
54. Text Mining Process
Text Mining has wide applications in:
Customer relationship Management, analyzing customer complaints
customer preferences, Market Analysis,
E-Commerce, analyzing online buying behavior, and
Natural Language Processing, NLP, an application in Artificial Intelligence, relating
to interaction between computers and languages used by humans
Text mining deals with converting :
Unstructured data ( not in tables) to numeric data to be used for analysis, using
frequency tables, association analysis and Word Clouds.
55. Text Mining process:
Step 1 : read file, usually in Plain Text format
Step 2 : Build Corpus, A corpus is a collection of texts, written or spoken,
usually stored in a computer database.
Step 3: Clean text, remove punctuations, uppercase letters, common English words.
Step 4, Create Term Document Matrix, TDM, Matrix for words and frequency.
Step 5: Create tables, frequency distributions, Correlations, Word Clouds
Step 6: Interpret findings and derive patterns and insights.
56. Create a Word Cloud : Attrition is mostly related to credit ( or lack of it)
given to employees’work in the organization.