Download to read offline


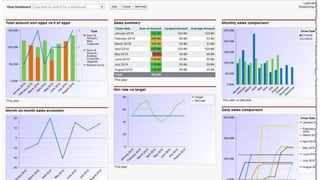


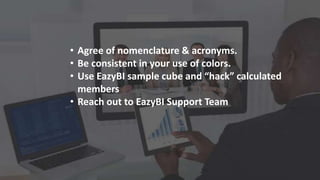

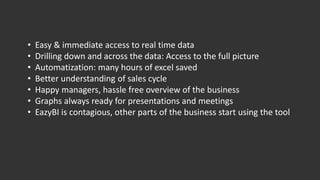


The document outlines the benefits of using eazyBI for visualizing and acting on sales data, emphasizing the importance of consistent terminology and color usage. Key outcomes include real-time data access, improved understanding of the sales cycle, and time savings through automation, leading to increased satisfaction among managers. The document encourages reaching out to the eazyBI support team for further assistance.