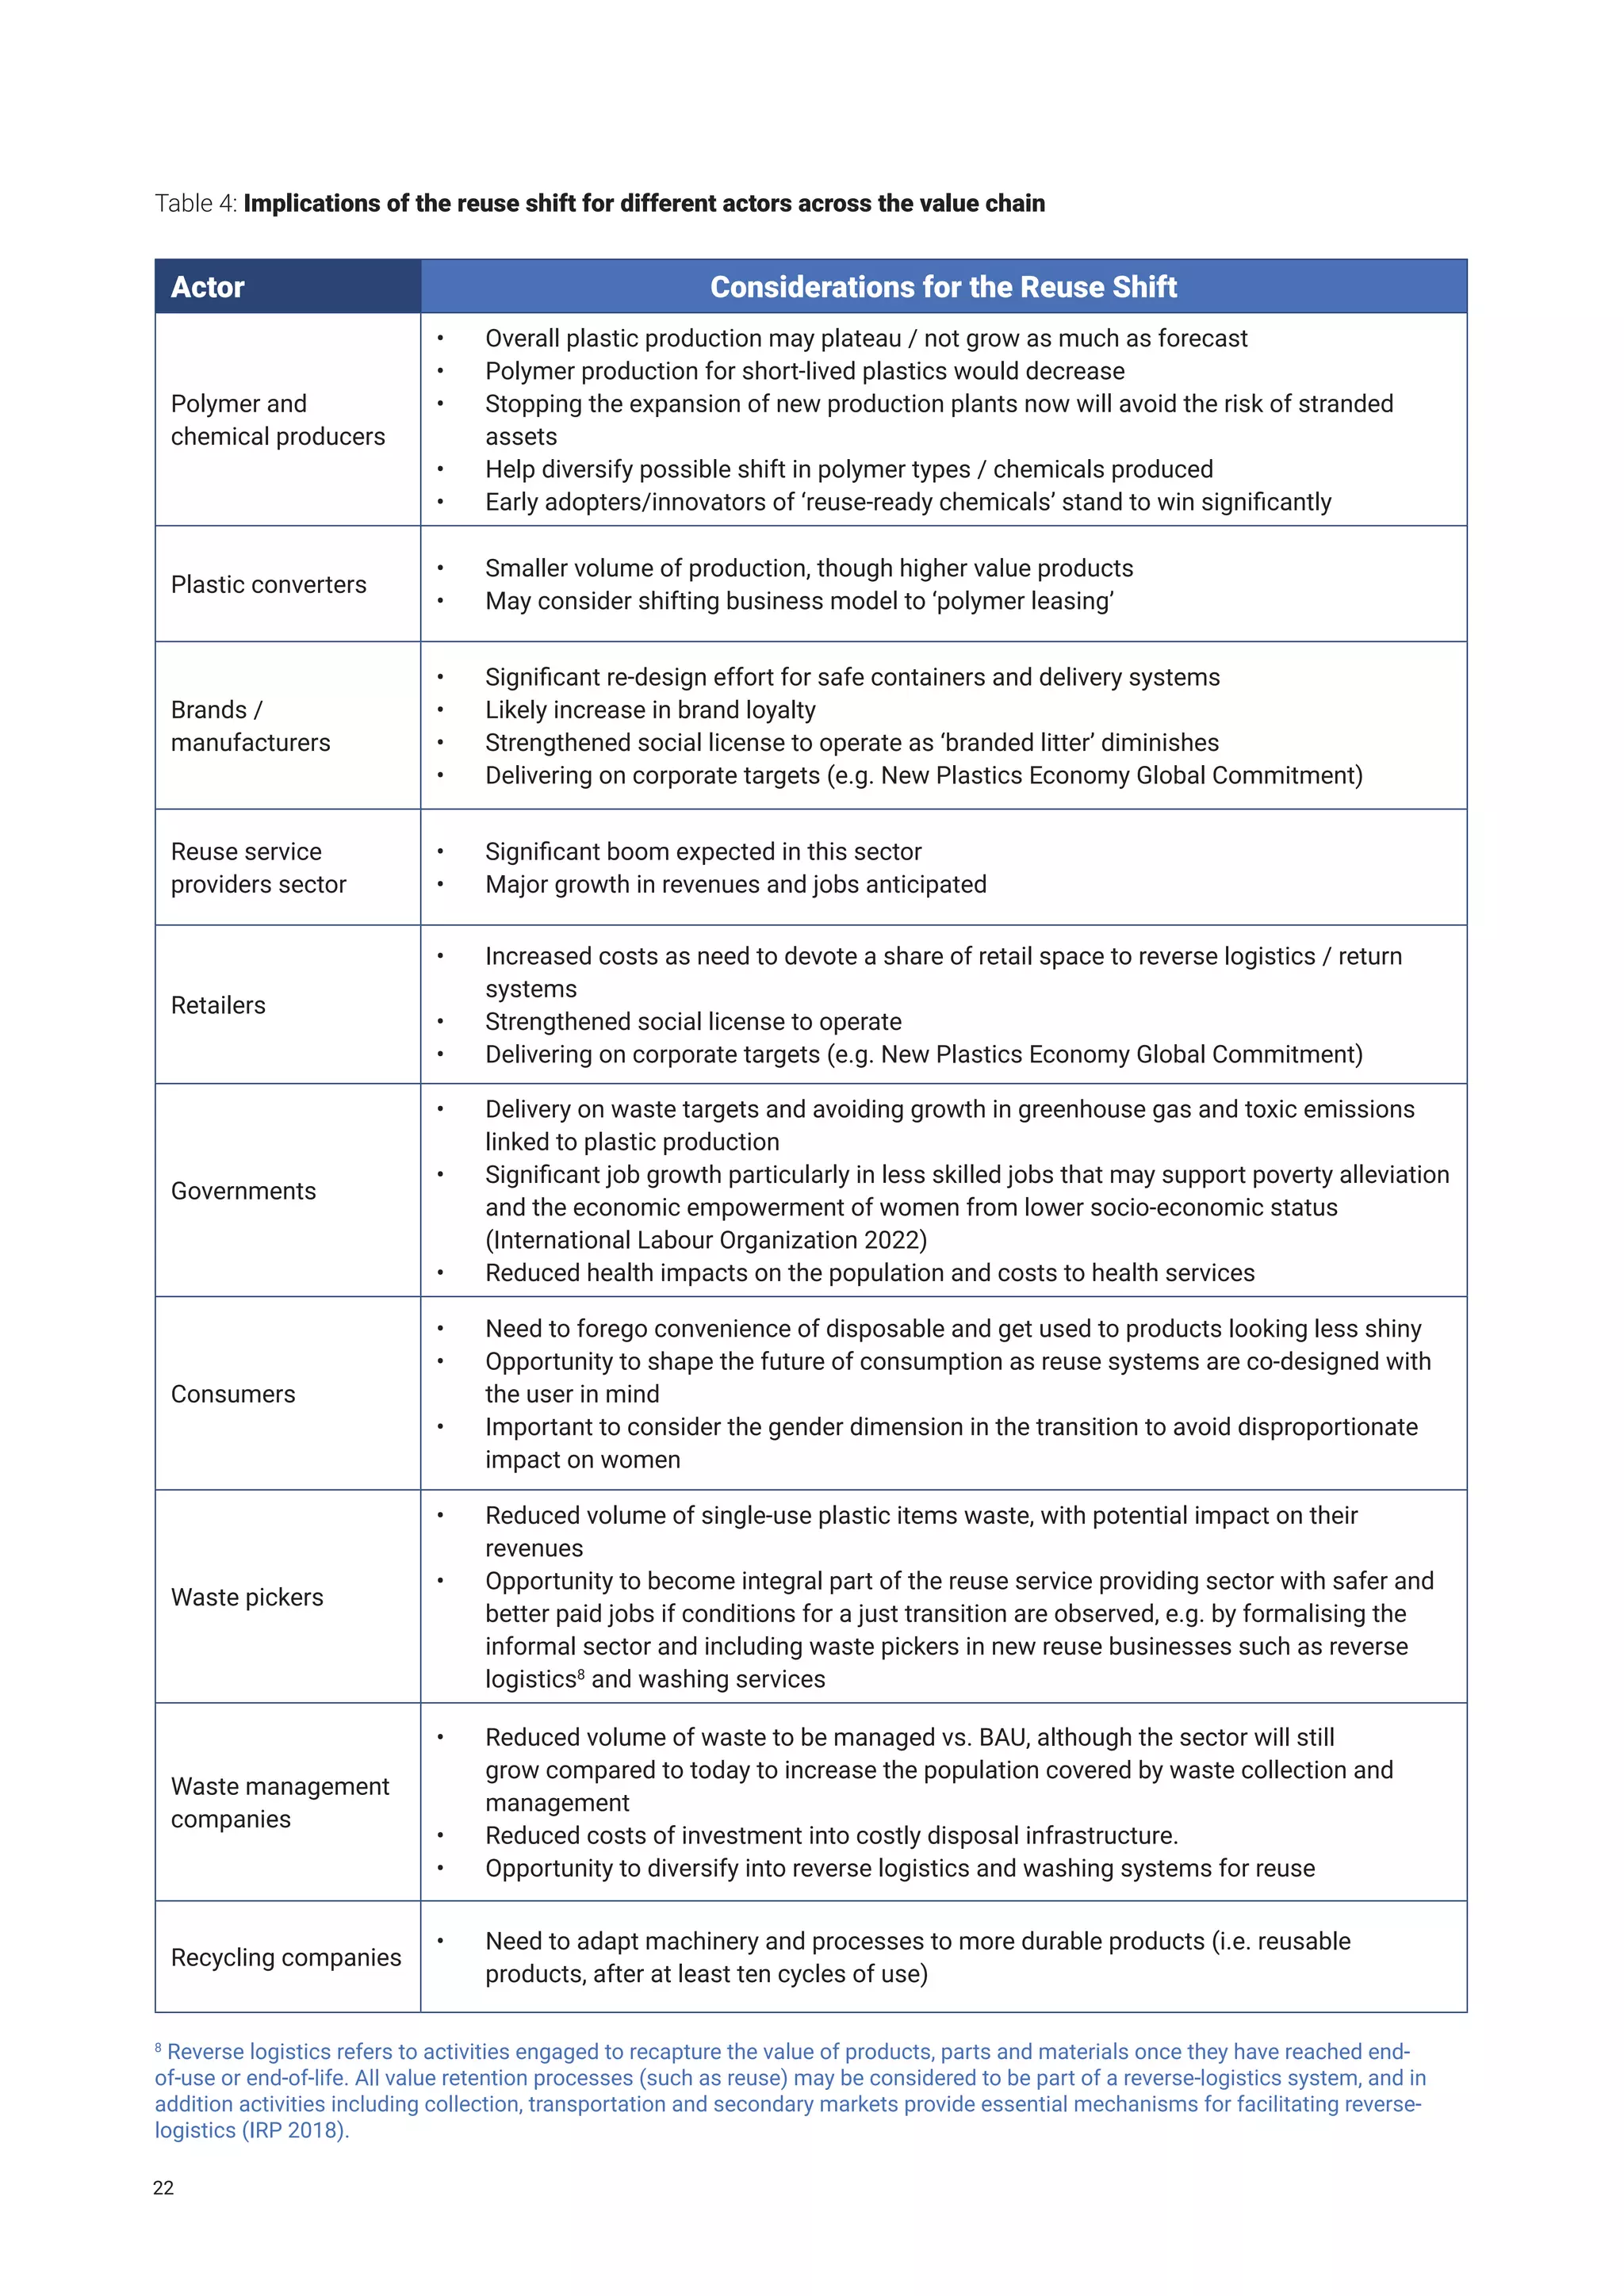
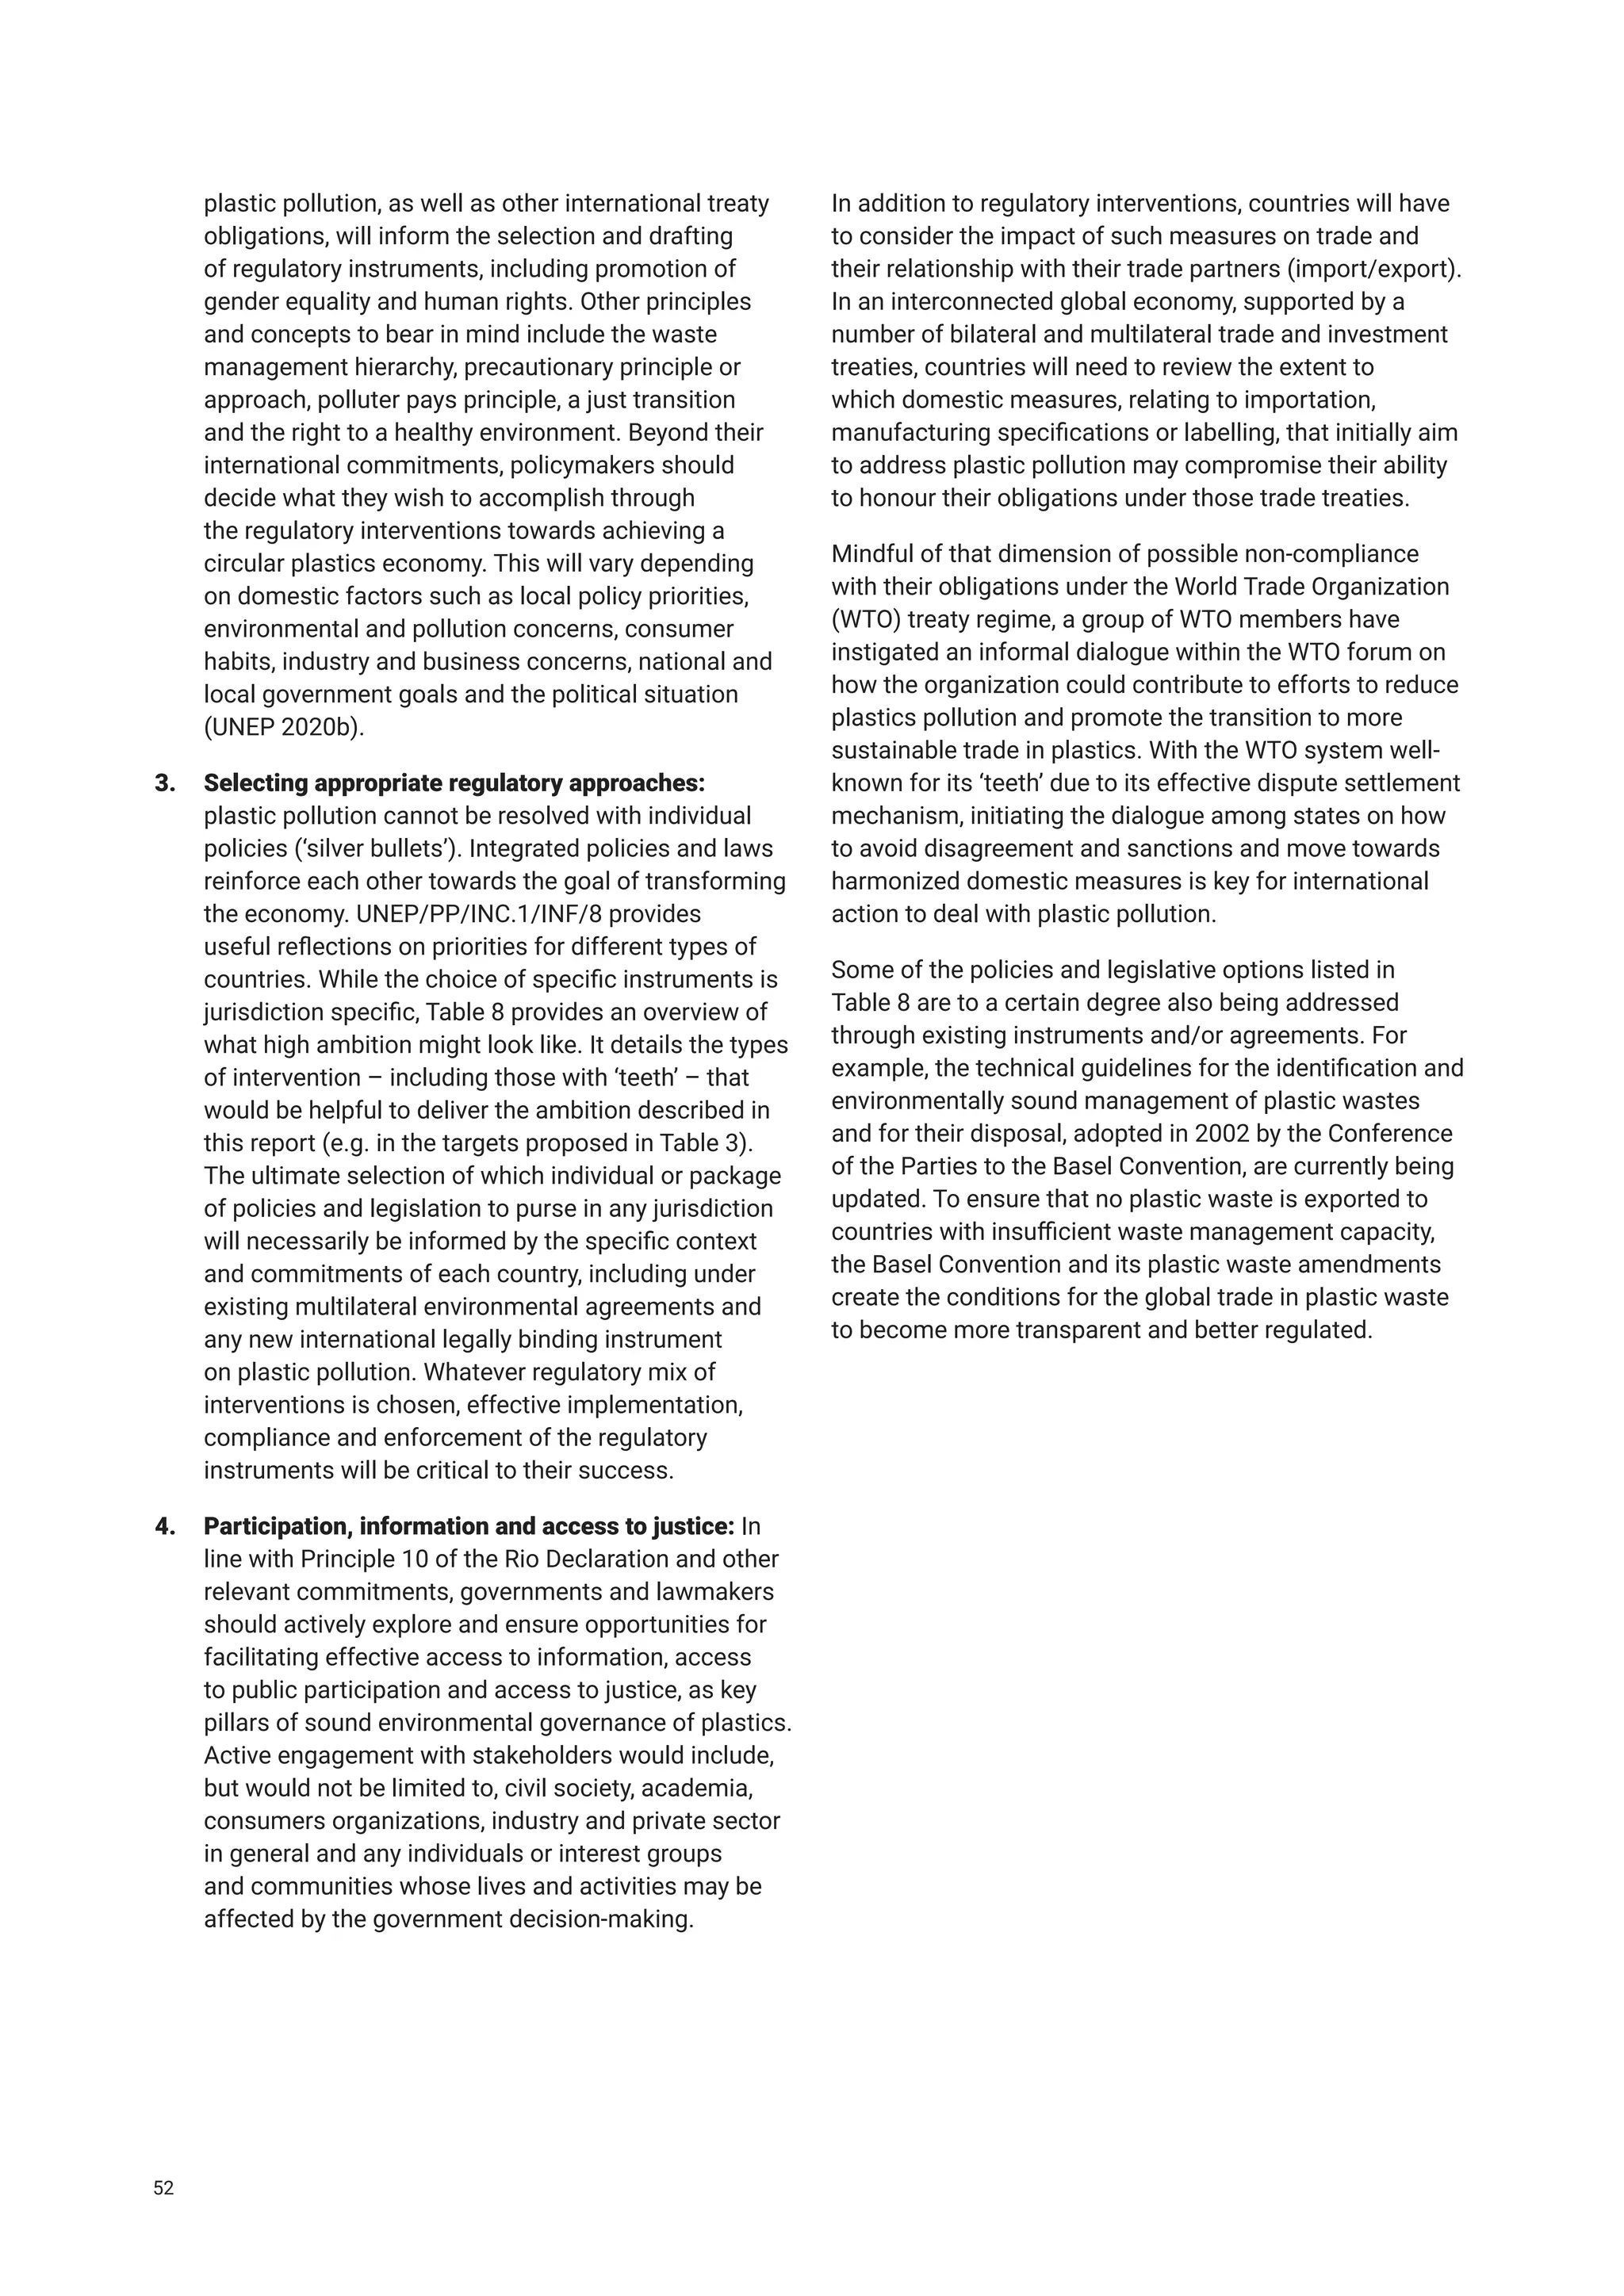
Download to read offline
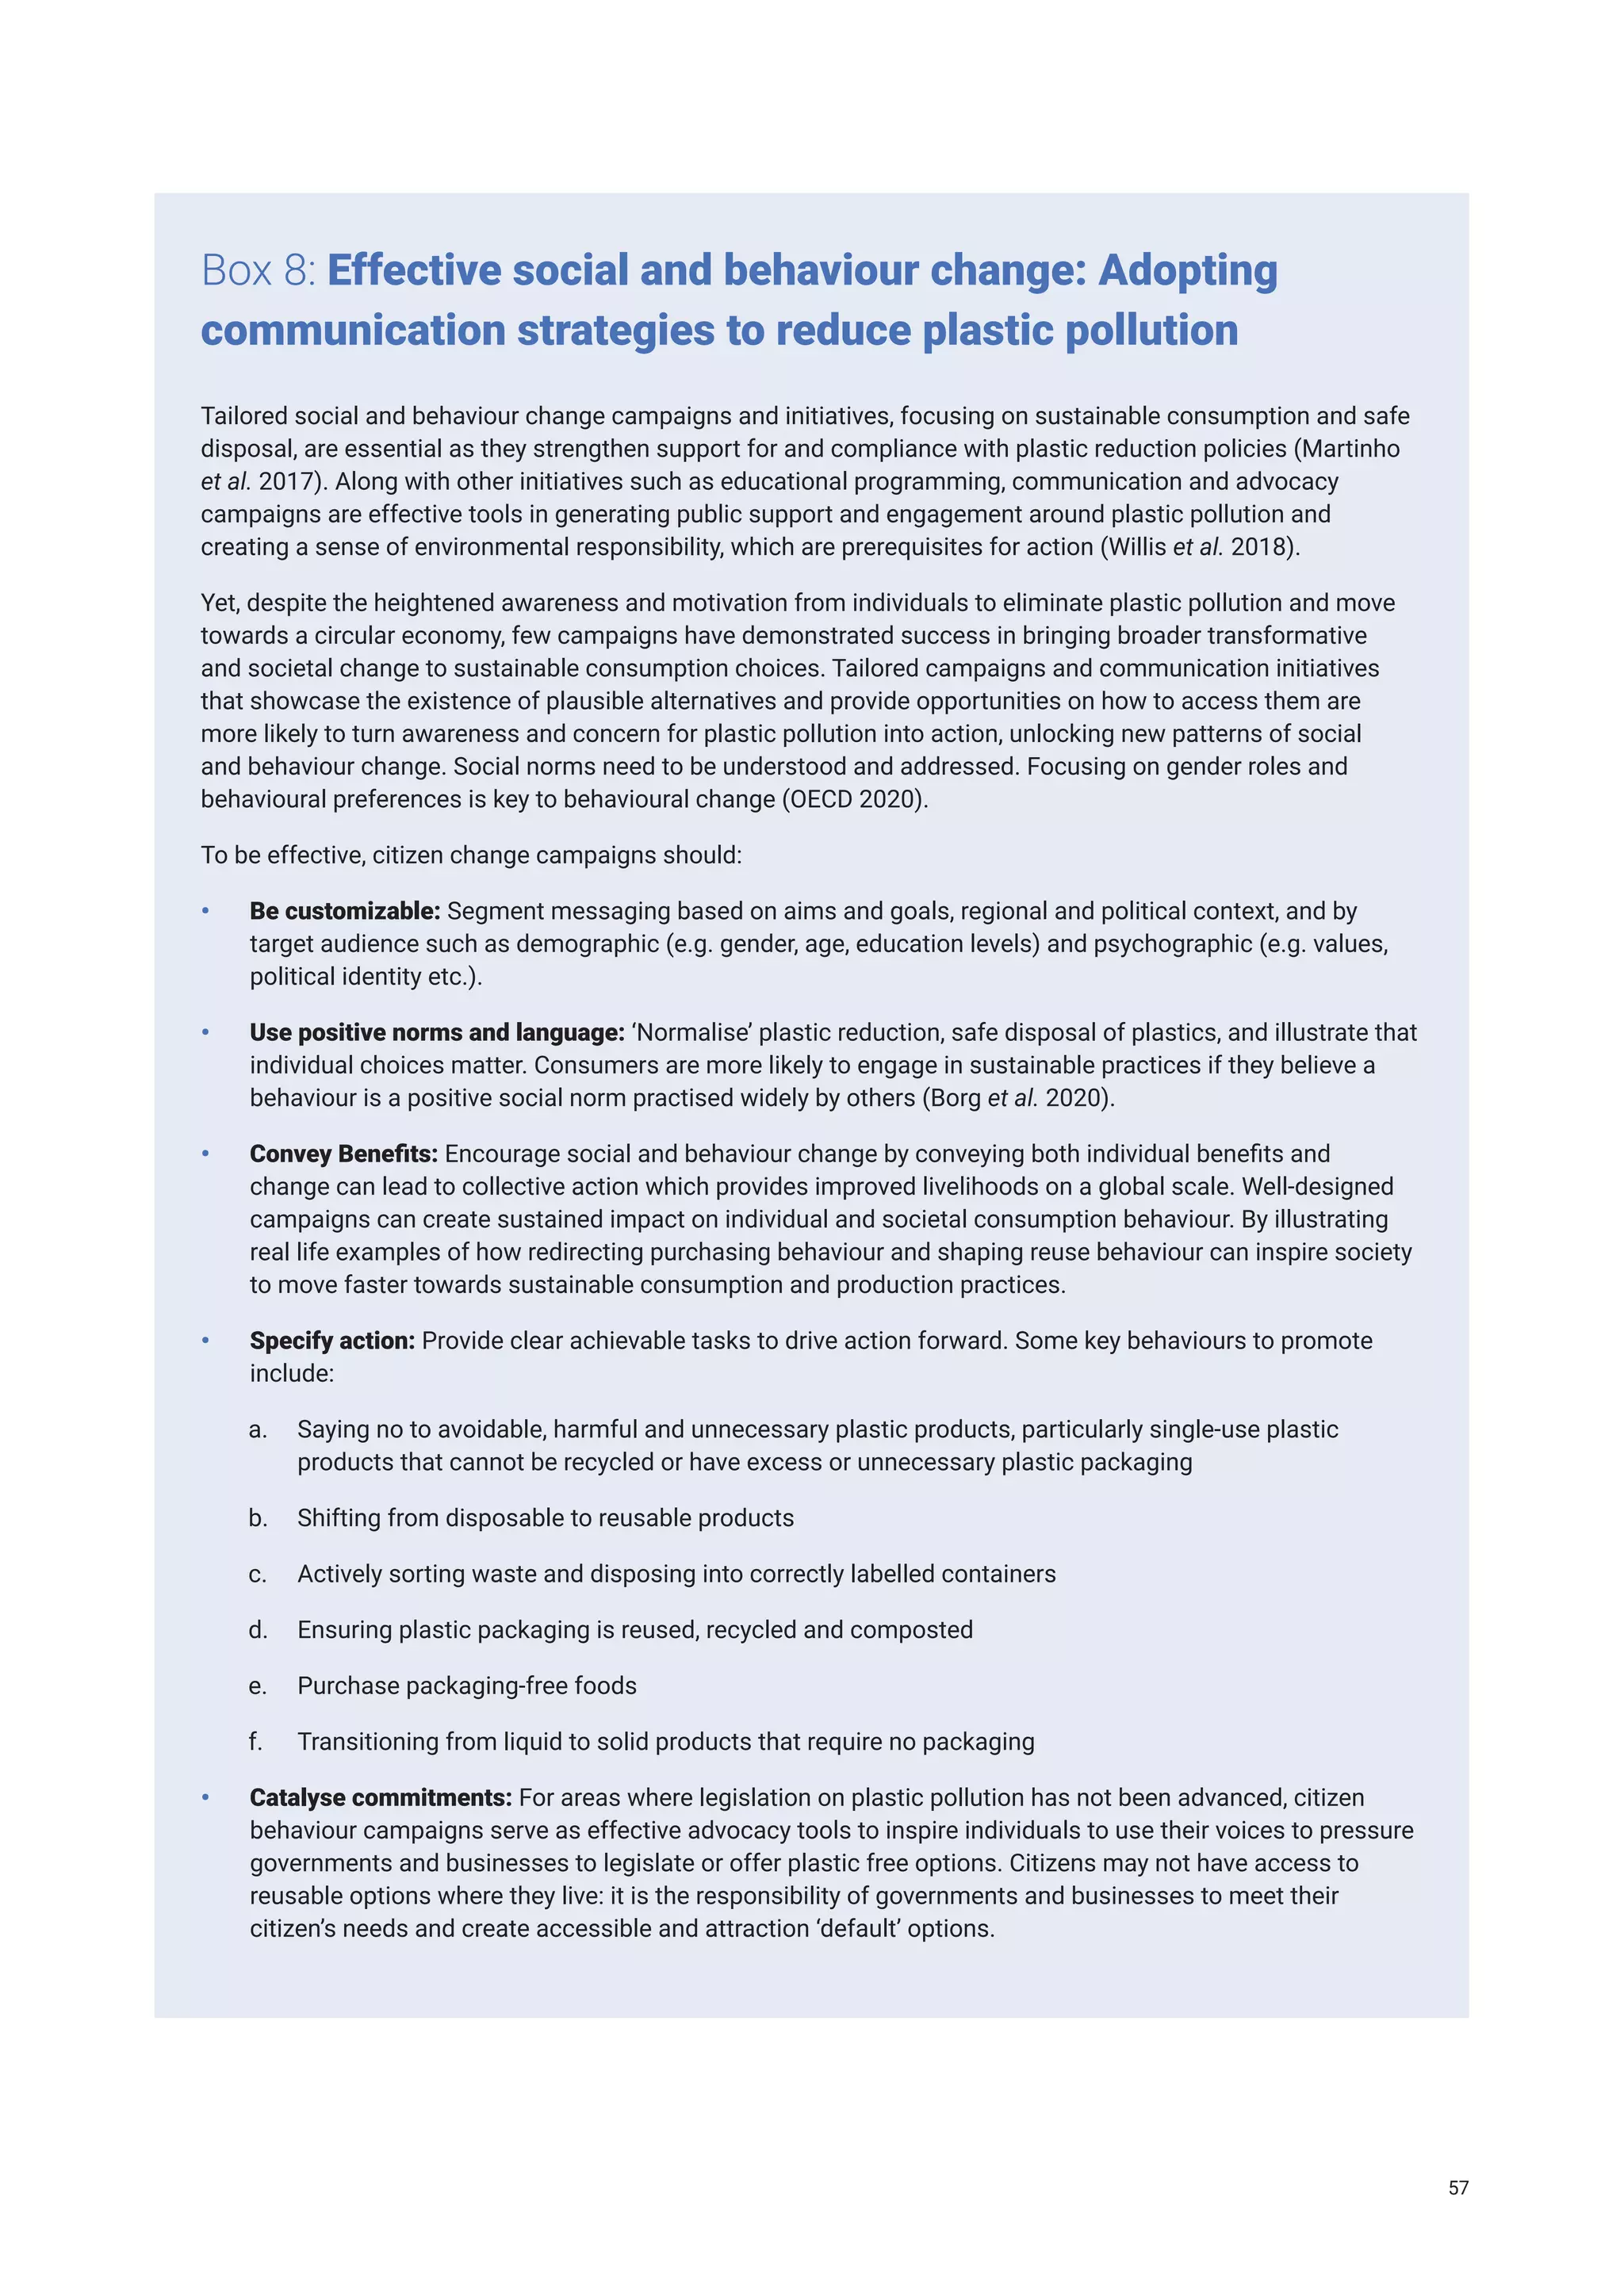
![Figure ES 1: The systems change towards a new circular plastics economy.
Ending Plastic Pollution
REDUCE
the size
of the
problem
RECYCLE
R
E
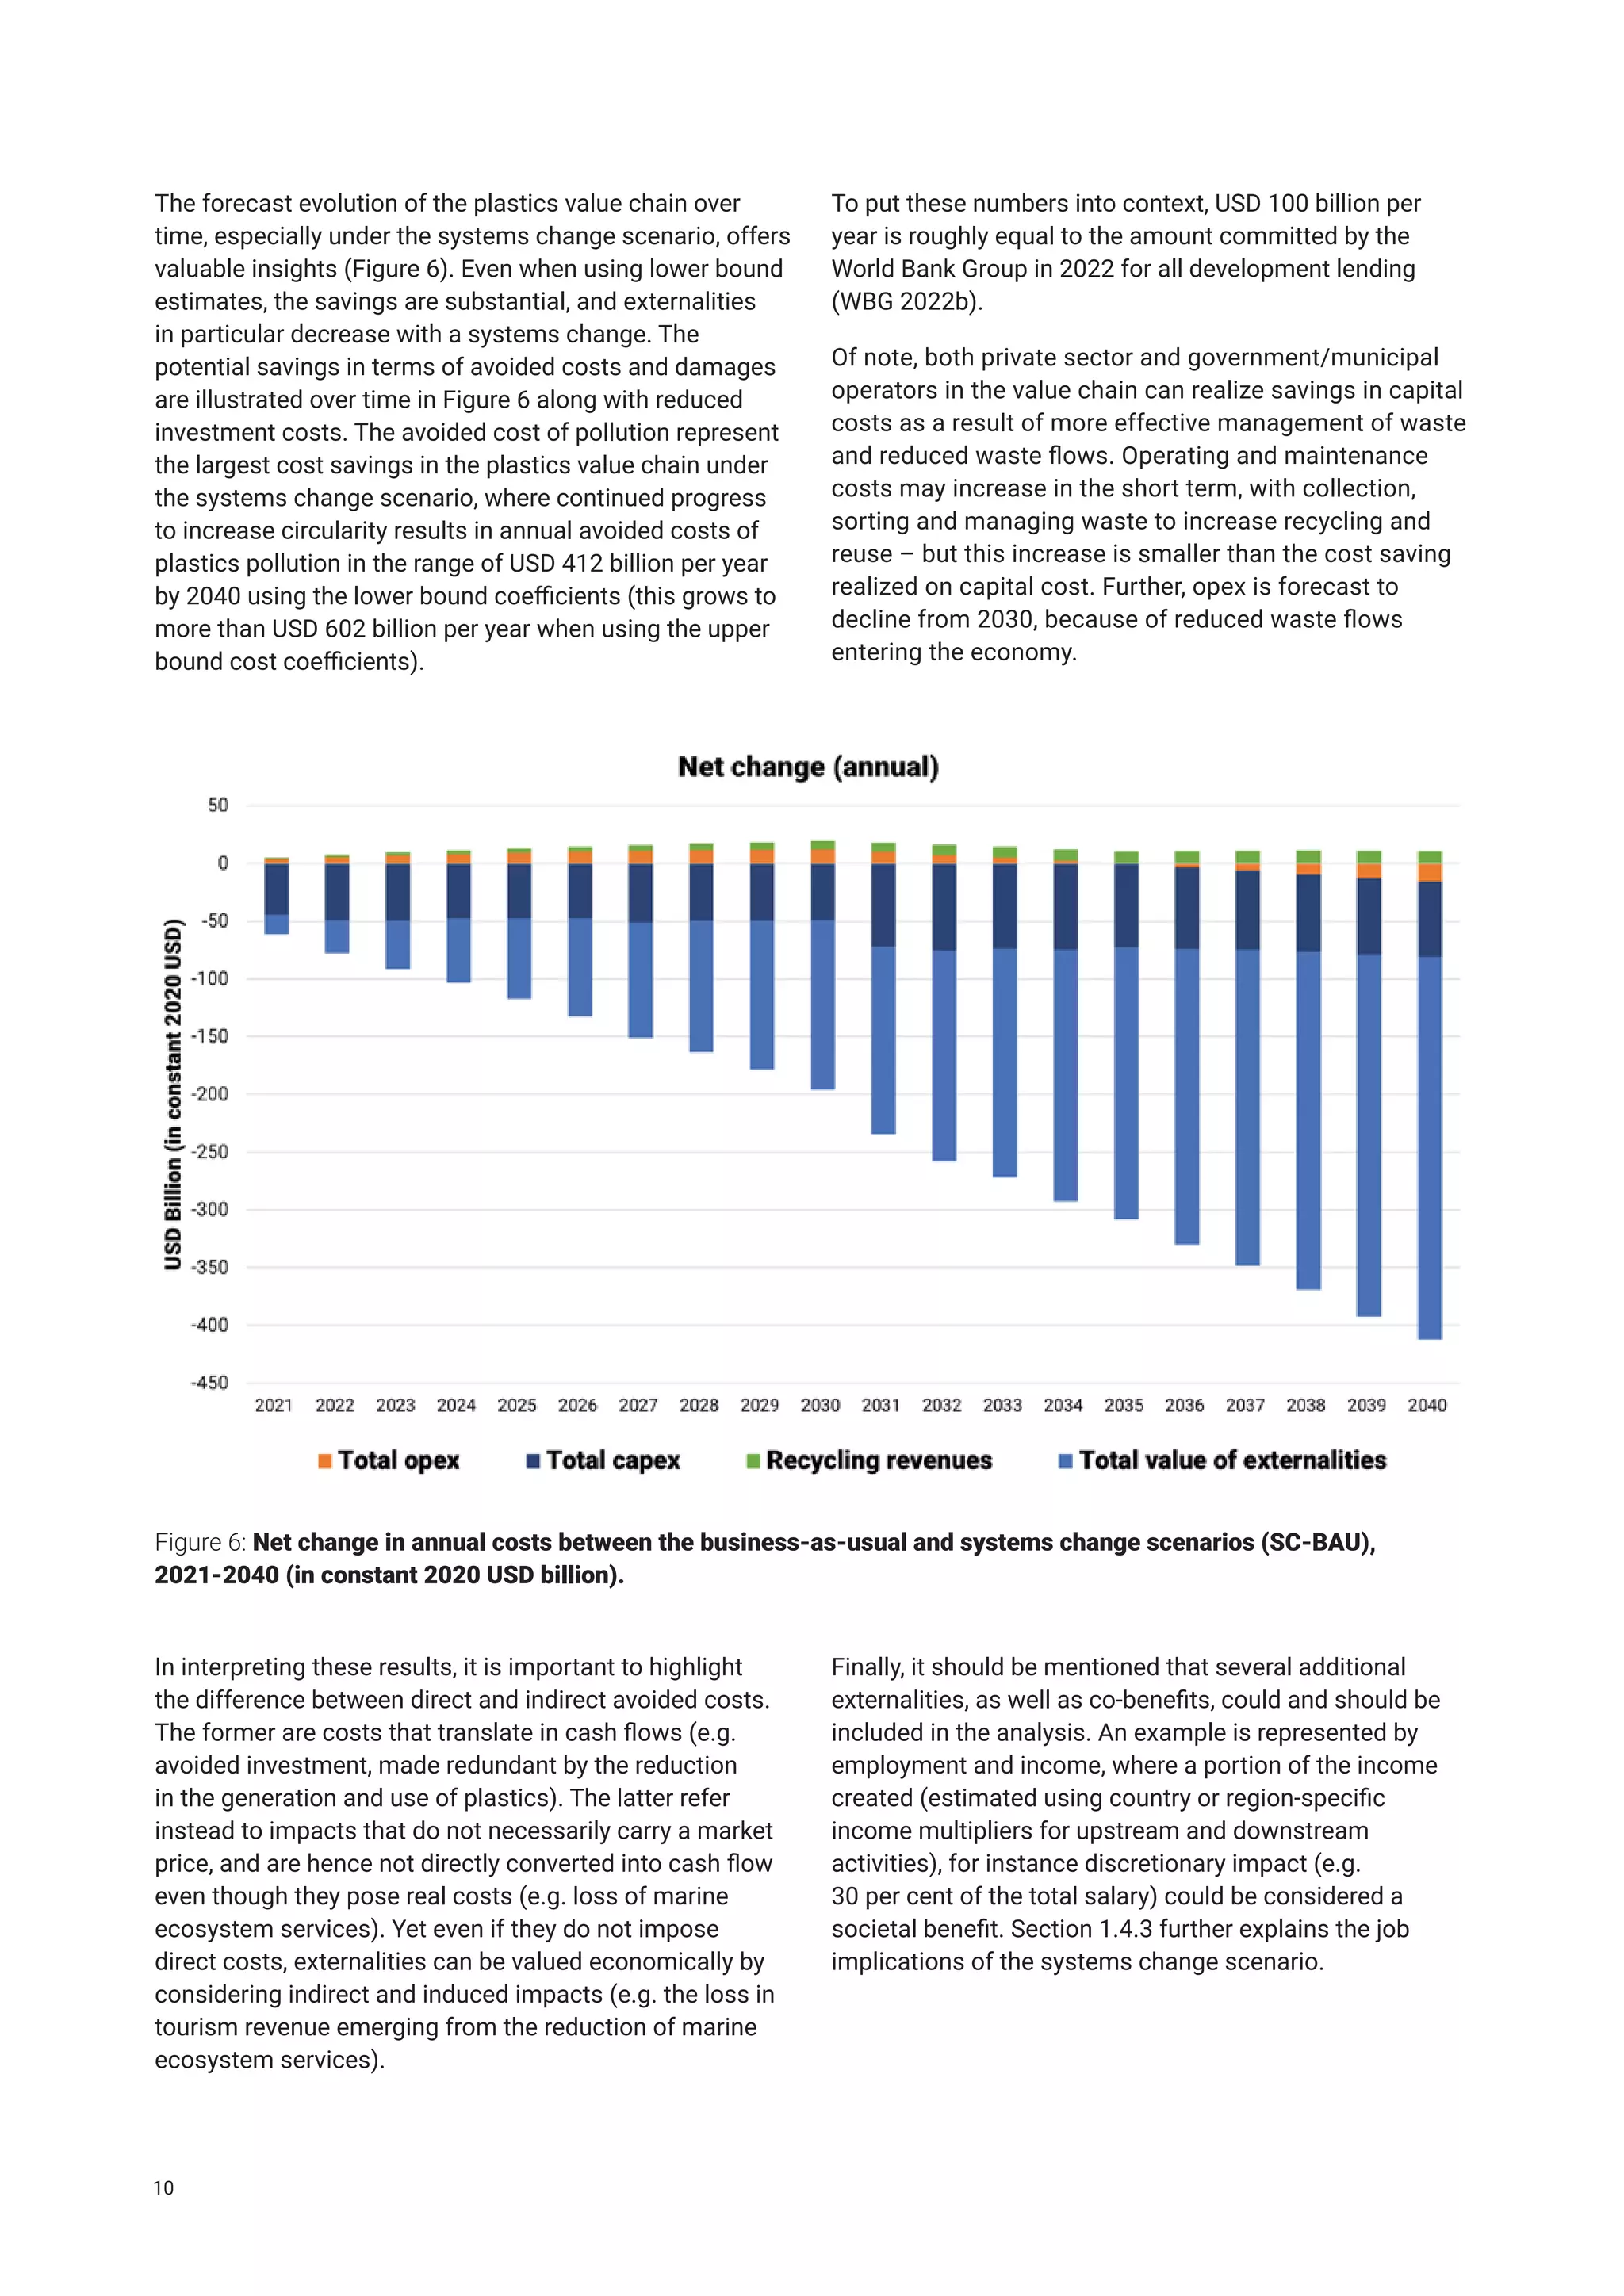
O
R
IENT & DIVER
S
I
F
Y
REUSE
Deal
with the
LEGACY
Market transformation to circularity through
3 MARKET SHIFTS
Policies and Regulatory Framework
Shift 1: Reuse
Accelerating the market for reusable products, to
transform the throwaway economy to a reuse society, by
creating the enabling environment to ensure the reuse
market has a stronger business case than the single-use
plastics market. Studies show that reuse systems provide
the highest opportunity to reduce plastic pollution (a
reduction of 30 per cent by 2040) by replacing some of the
most problematic and unnecessary products (The Pew
Charitable Trusts and Systemiq 2020).
Shift 2: Recycle
Accelerating the market for plastics recycling by ensuring
recycling becomes a more stable and profitable venture
could reduce the amount of plastic pollution by an
additional 20 per cent by 2040 (The Pew Charitable
Trusts and Systemiq 2020). This will require an adequate
availability of feedstock that can be recycled and that
recycled materials can compete on a level playing field
with virgin materials.
Shift 3: Reorient and Diversify
Shaping the market for plastic alternatives to enable
sustainable substitutions, thus avoiding replacing plastic
products with alternatives that displace rather than reduce
impacts. Sustainable alternatives could reduce pollution
by 17 per cent by 2040 (The Pew Charitable Trusts and
Systemiq 2020), but struggle to compete in markets with
products made of virgin fossil fuel-based polymers owing
to a number of challenges: cost of product, consumer
demand and lack of appropriate regulations.
Even with the market transformation approach, a
significant volume of plastics cannot be made circular
in the next 10 to 20 years and will require disposal
solutions to prevent pollution. This refers to collecting
and responsibly disposing of plastics that cannot be
reused or recycled, including plastics that are already in
the environment as existing pollution, or are stocked or
will enter in the economy e.g. in short-lived or durable
products designed without considering their circularity or
long-term use in the economy. It also refers to new ways
of financing collection and disposal of legacy plastics and
preventing microplastics from entering the economy and
the environment.
Global plastic production and use has grown exponentially
since the 1950s, with around nine million people employed
globally in polymer production and plastic processing
industries (United Nations Industrial Development
Organization (UNIDO) Data Portal - ISIC codes 2013 and
2220). Light, strong and seemingly inexpensive plastics
have permeated our lives, our societies and our economies
– but at a pace that has escalated into significant costs to
the environment, human health and the economy. Currently,
the world produces 430 million metric tons of plastics
each year (Organisation for Economic Co-operation and
Development [OECD] 2022), of which over two-thirds are
short-lived products which soon become waste, and a
growing amount (139 million metric tons in 2021 [Minderoo
2021]) after one single use. Plastic production is set to
triple by 2060 if ‘business-as-usual’ continues (OECD 2022).
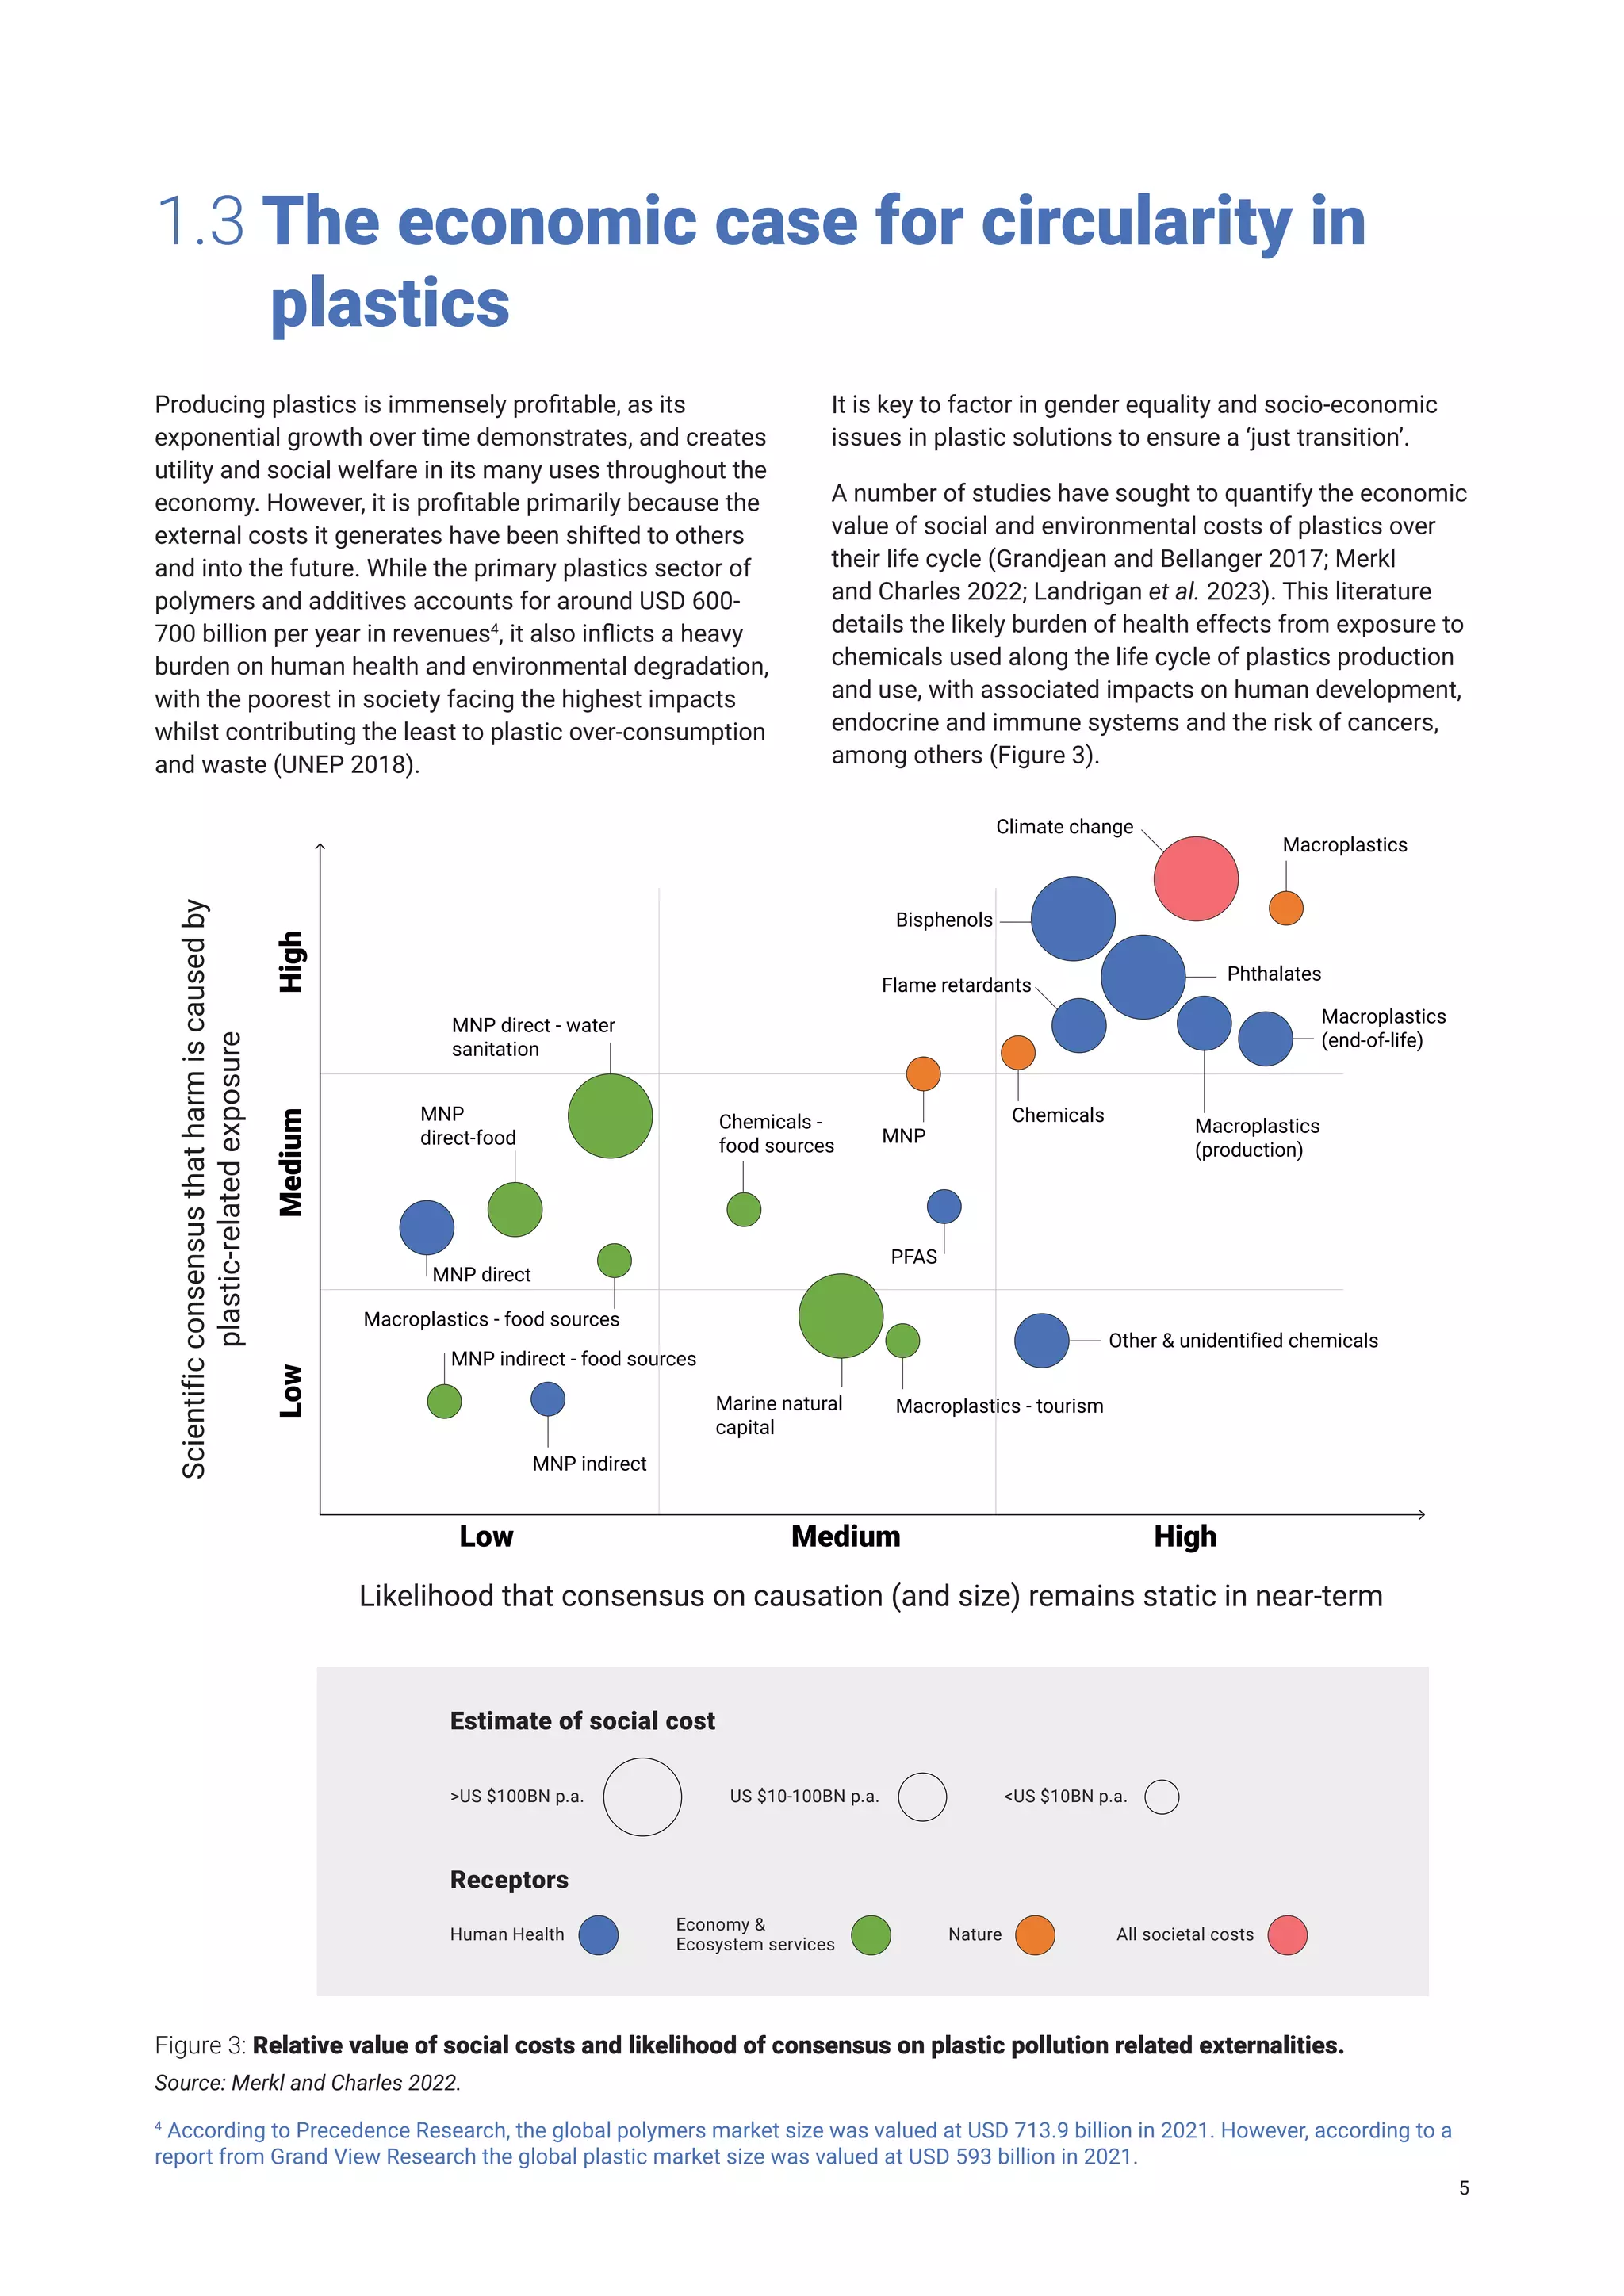
A growing number of researchers are quantifying the social,
economic and environmental costs of plastic pollution.
Scientific literature is linking chemicals in plastic and
xiv](https://image.slidesharecdn.com/howtheworldcanendplasticpollutionandcreateacirculareconomy-230601004717-772ebcb4/75/How-the-world-can-end-plastic-pollution-and-create-a-circular-economy-16-2048.jpg)
![This report is designed to inform decision-makers and
stakeholders across the whole value chain of plastics about
the necessary actions - including market shifts and the
associated policies - that could be taken to achieve their
stated ambition to turn off the tap and end plastic pollution.
Grounded in science and economic analysis, the report
aims to strengthen an understanding of the magnitude
and nature of the change required in the plastics economy
to achieve this goal. Ultimately this report provides
stakeholders a compass to implement change.
Building on previous analyses (Ellen MacArthur
Foundation [EMF] et al. 2016; The Pew Charitable
Trusts and Systemiq 2020; United Nations Environment
Programme [UNEP] 2021c; International Resource Panel
[IRP] 2021; Organization for Economic Cooperation and
Development [OECD] 2022; World Bank Group [WBG]
2022a; UNEP 2022a; Economist Impact 2023), as well
as consultations with leading international experts, the
problems with the current plastics economy are identified
(Box 1) and what is needed to transition to a circular
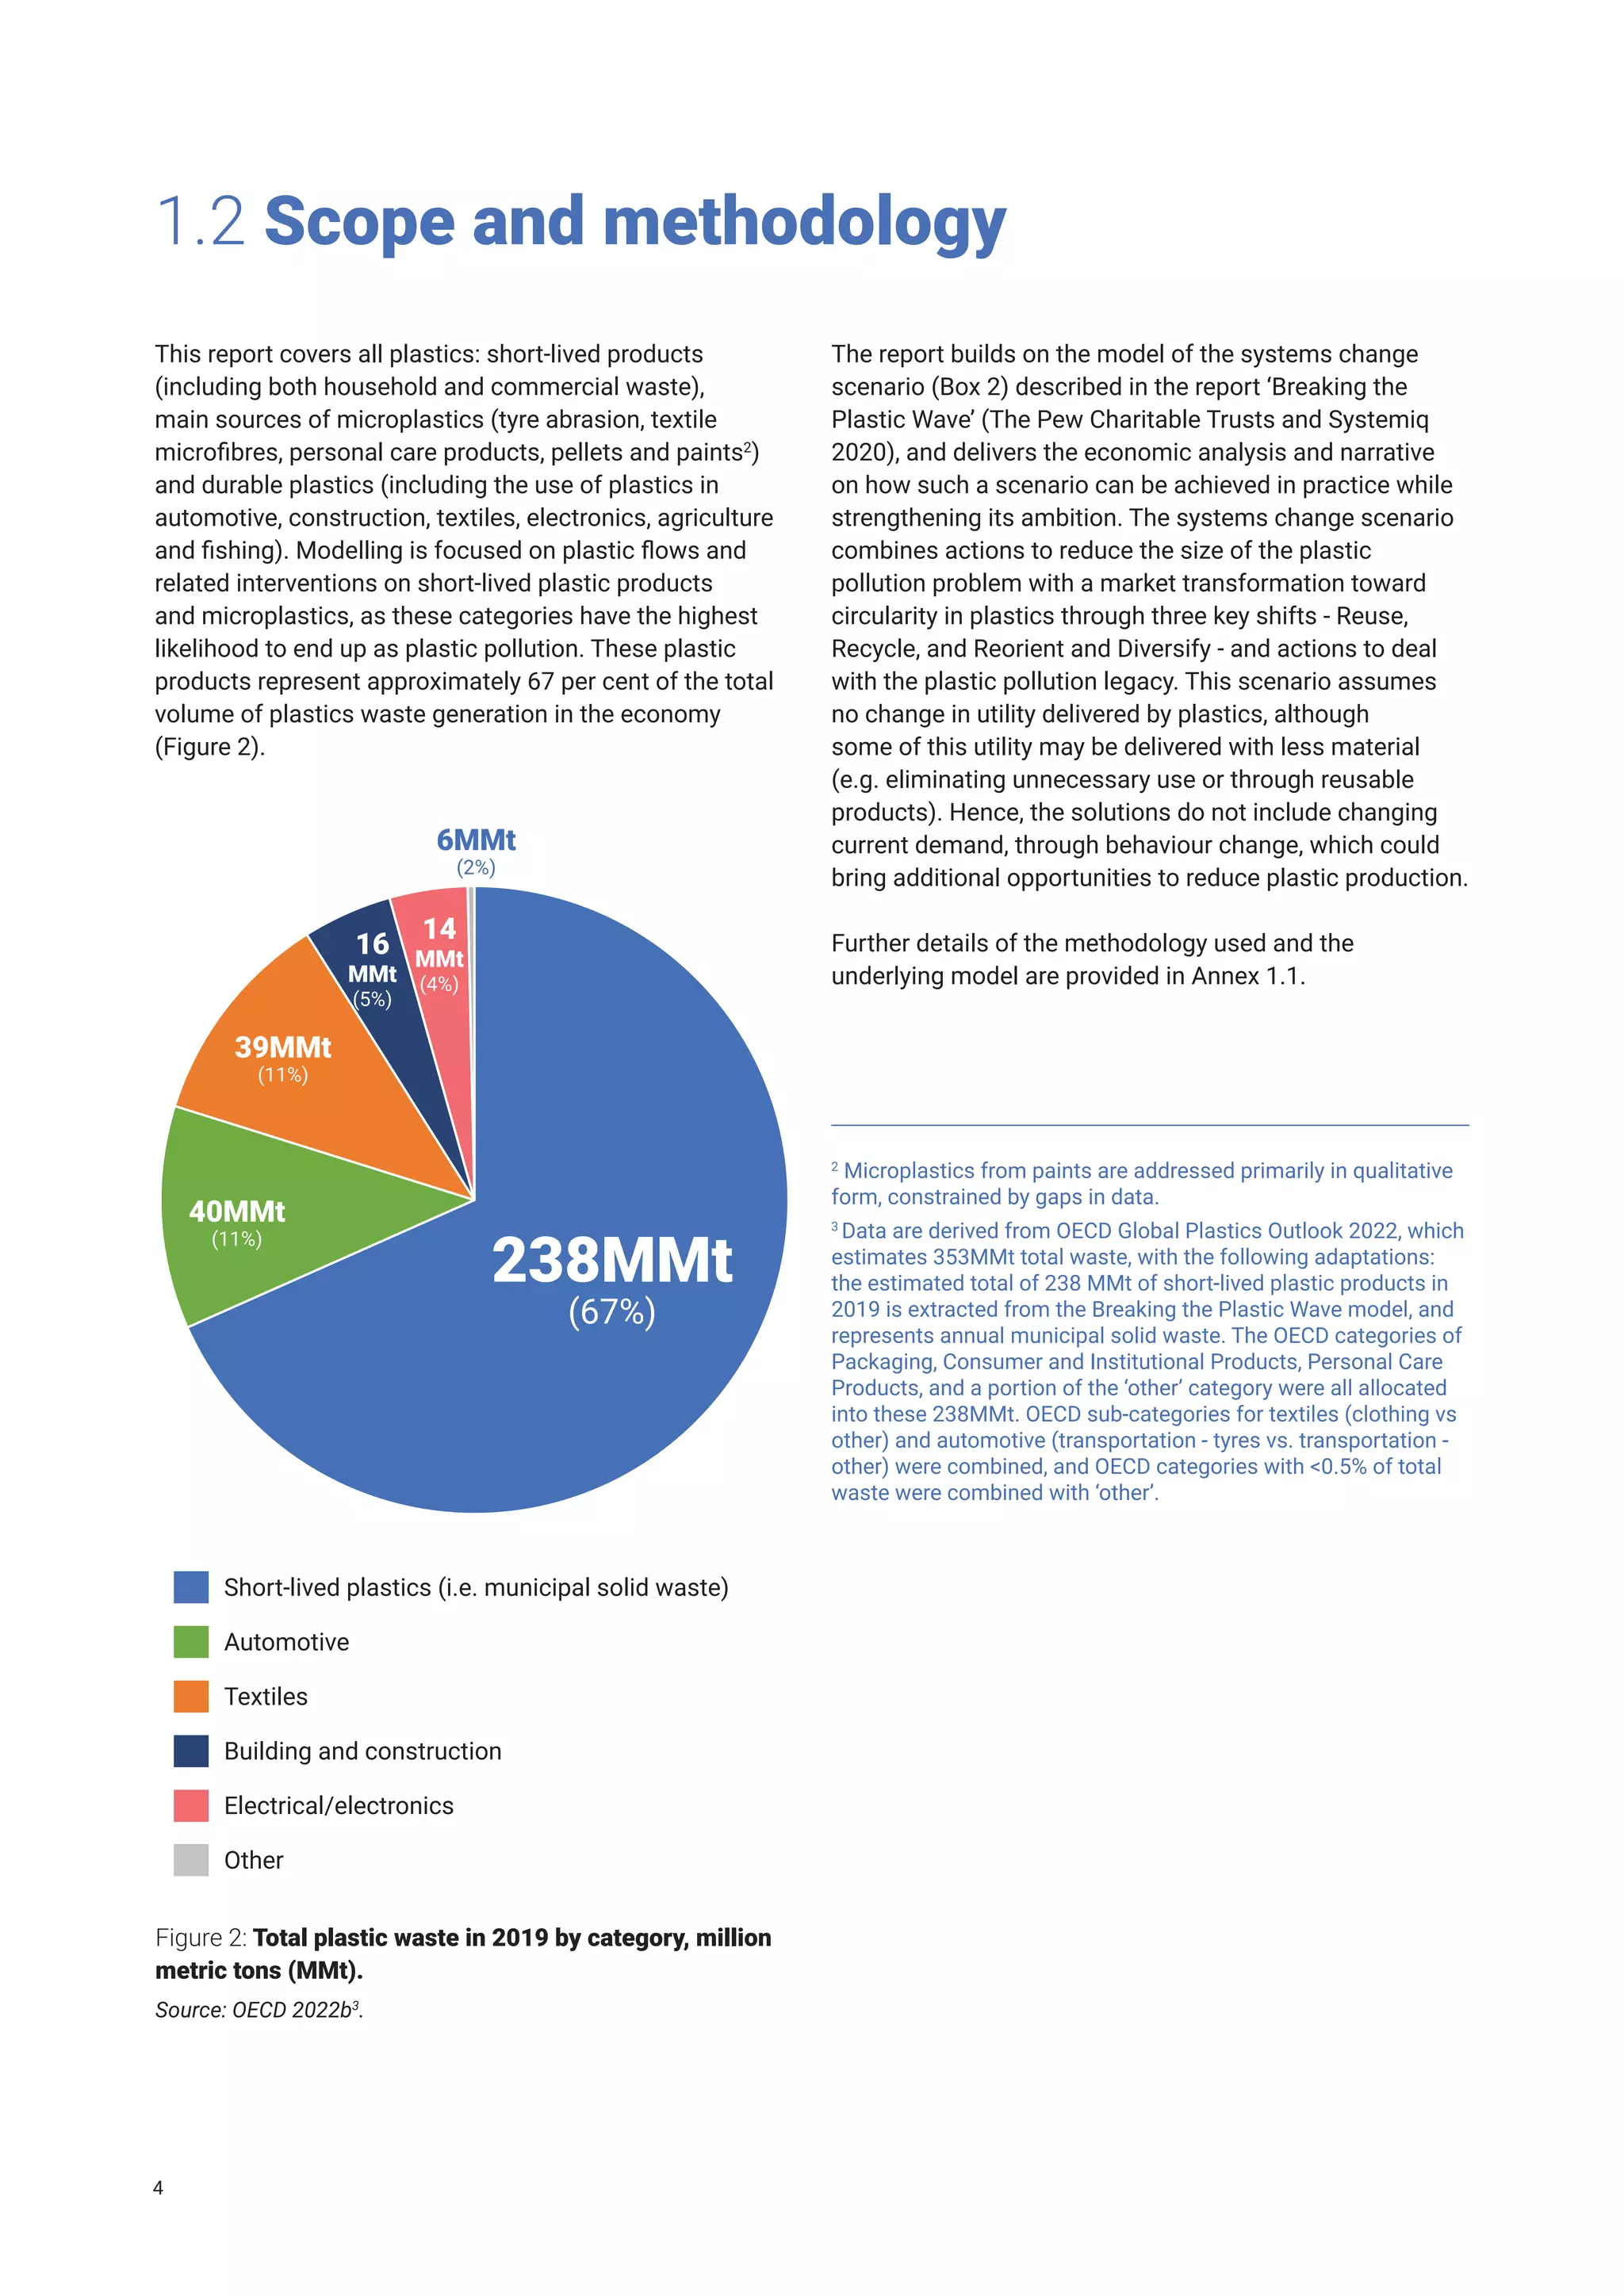
1.1 Purpose of this report
plastics economy globally is outlined (Box 2). An analysis
is provided of this systemic change and how it can be
implemented: the regulatory and fiscal policy changes,
the incentives to drive new more comprehensive business
models and the practical approaches to manage the job
transition, among others.
Crucially, the economic analysis used in this report shows
that delivering the systems change scenario – addressing
the causes of plastic pollution, rather than just the
symptoms - could save 10.3 per cent of the direct costs
of the plastics life cycle, a value that increases to 20.3 per
cent when including indirect costs as well as addressing
the benefit to the environment and health.
The report is complemented by topic sheets on a range
of issues including design guidelines, chemical recycling,
extended producer responsibility, material and products
substitutes, reuse, ensuring an inclusive transition to a
circular economy and implementation in local settings.
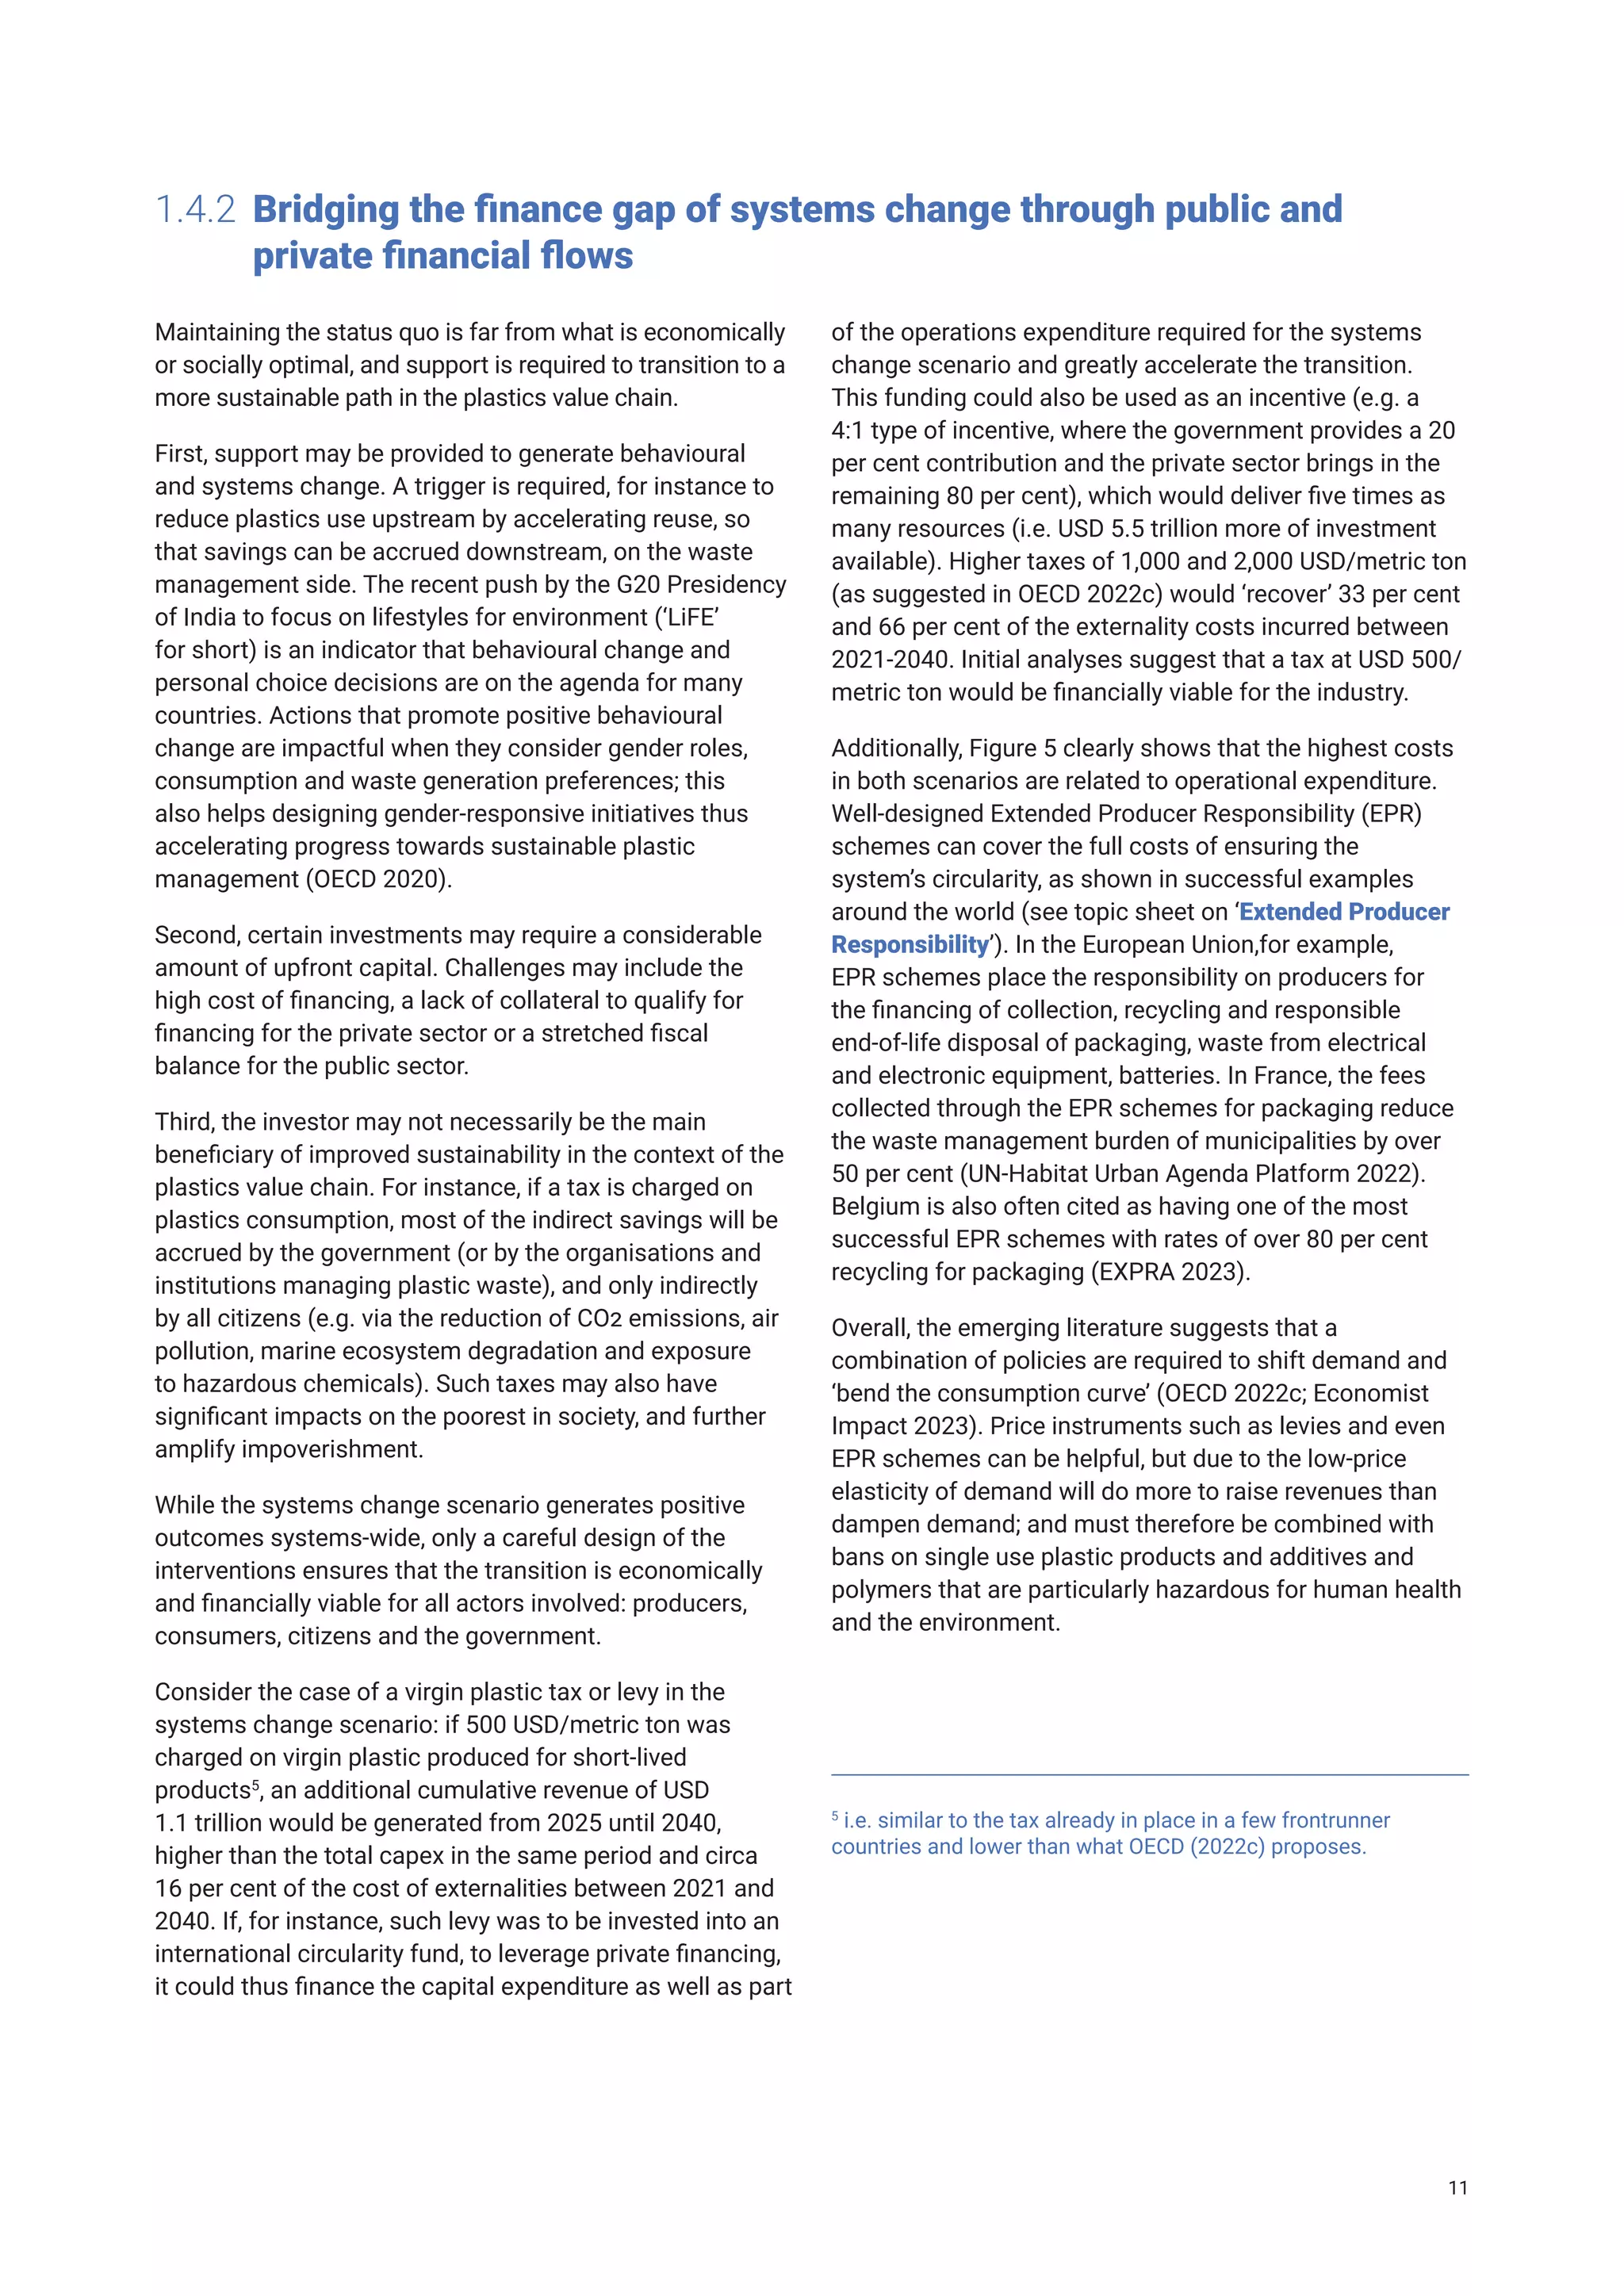
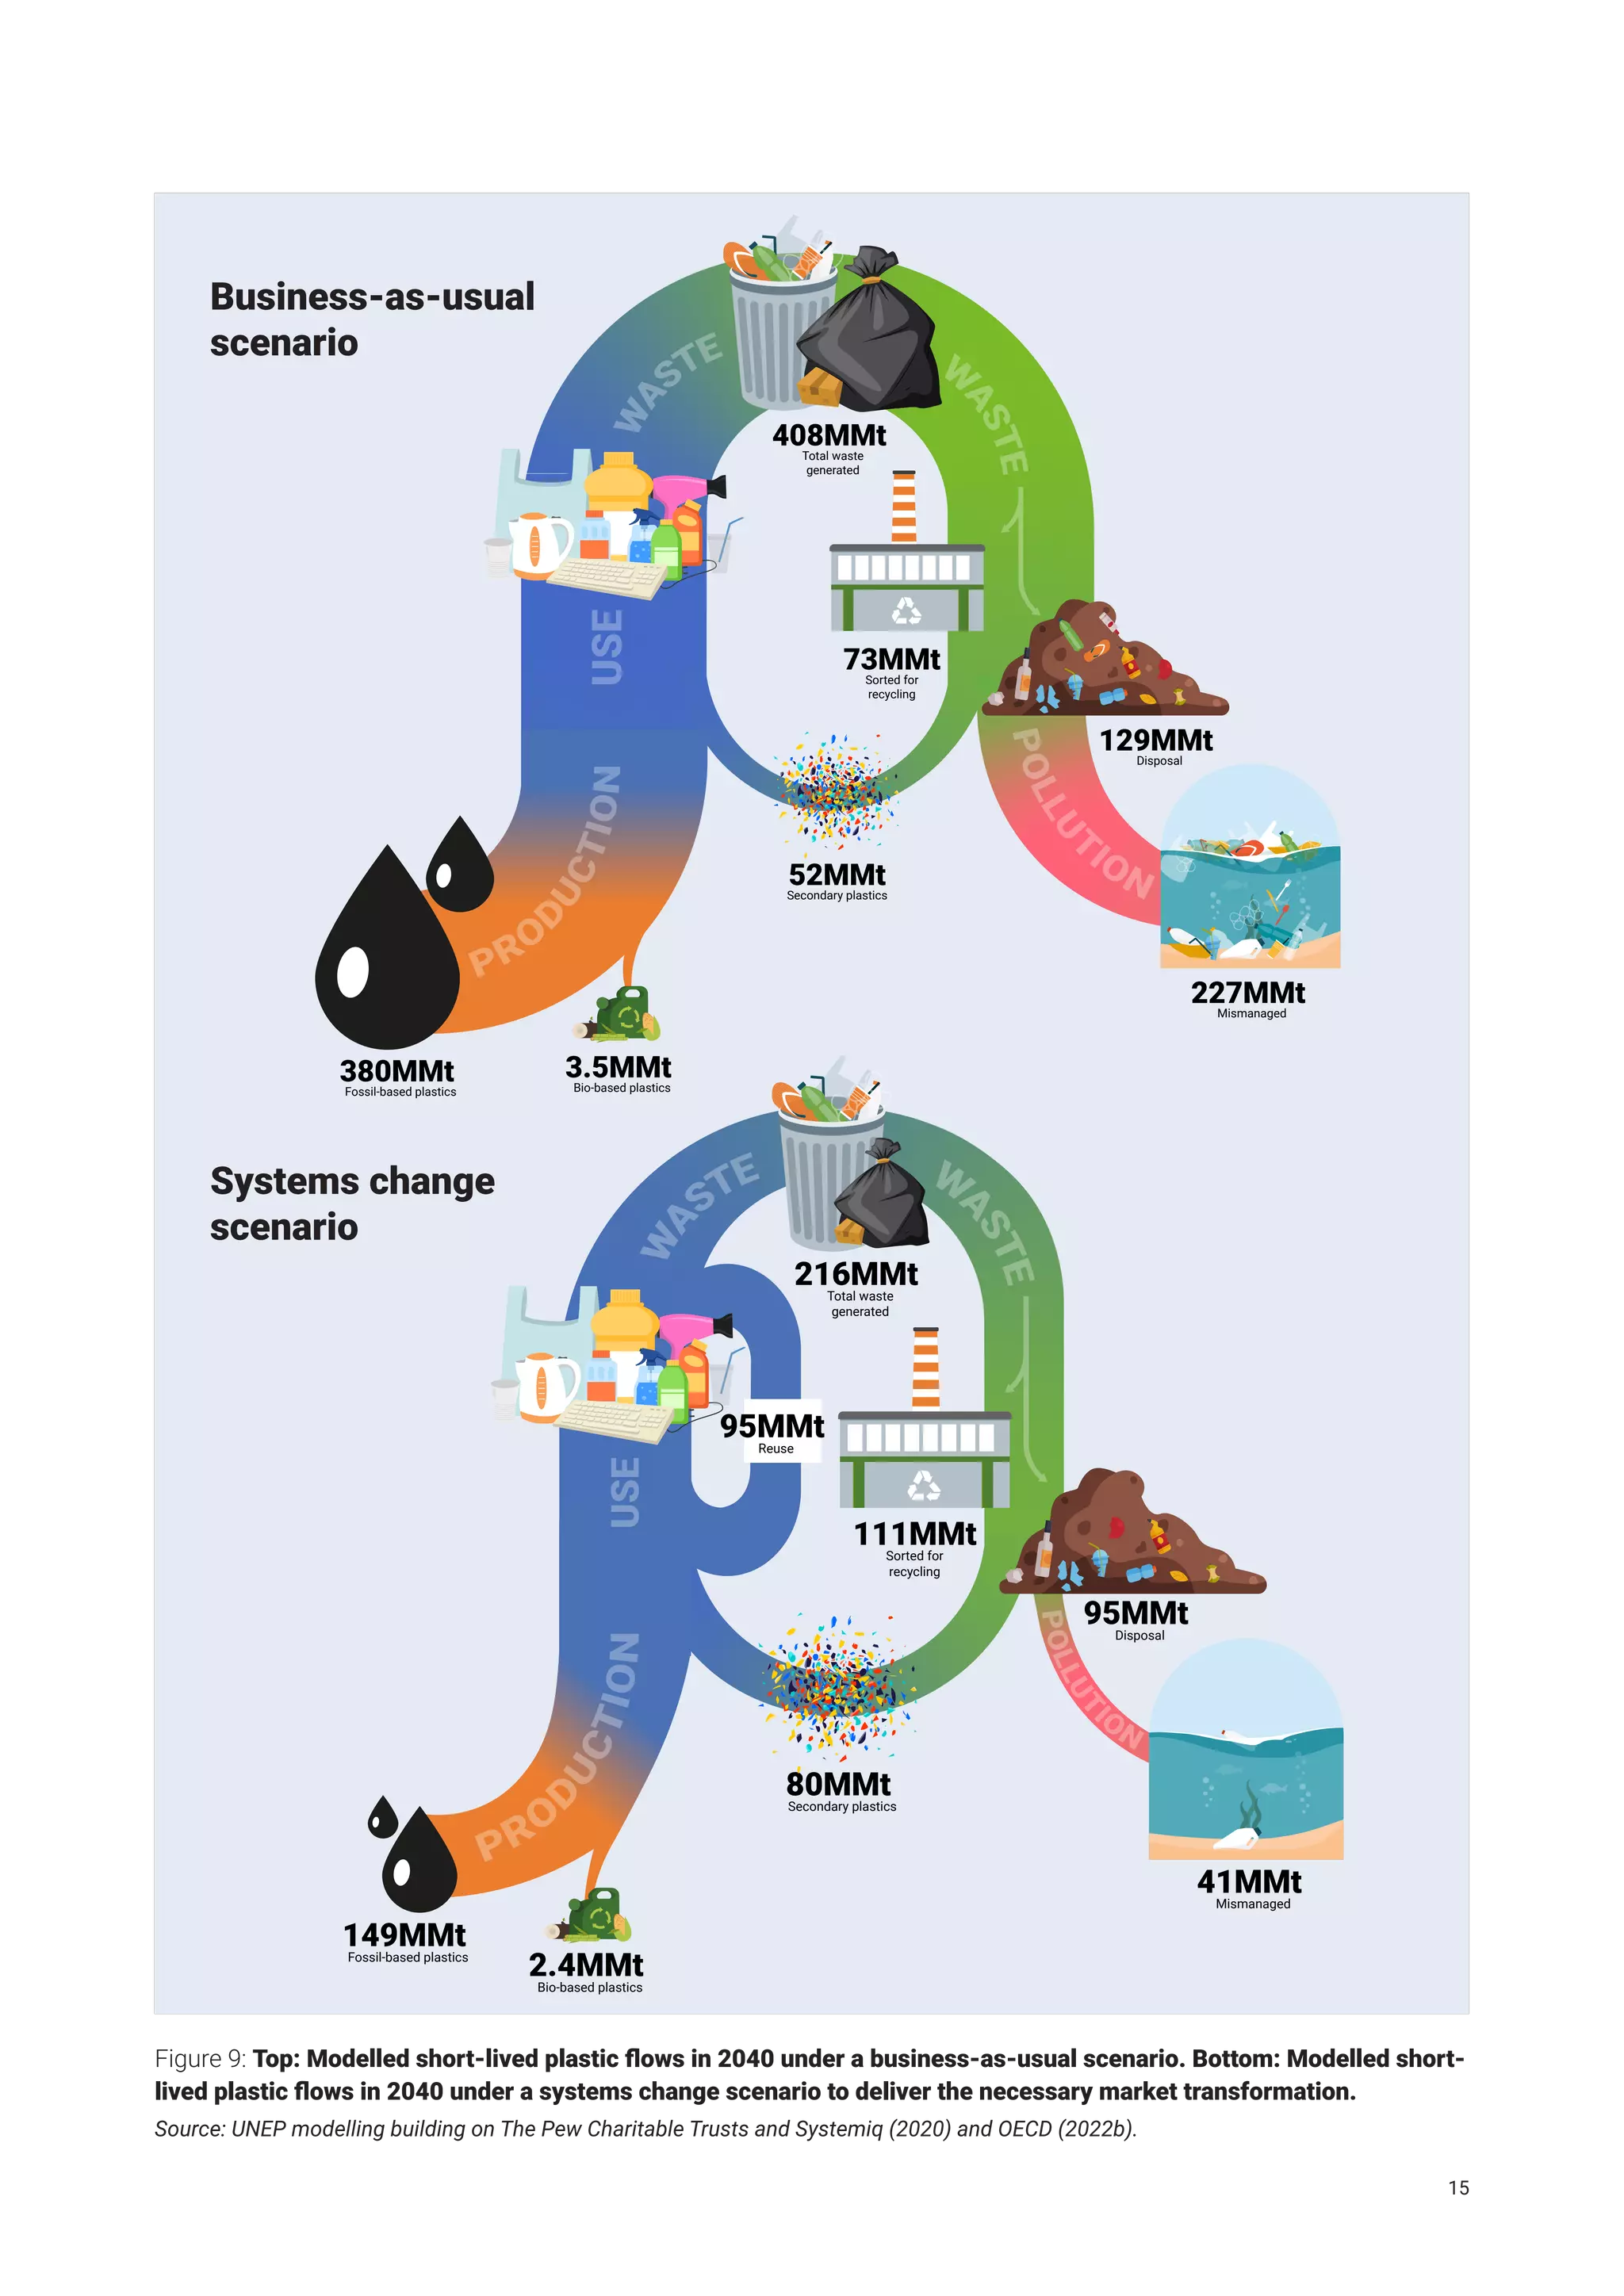
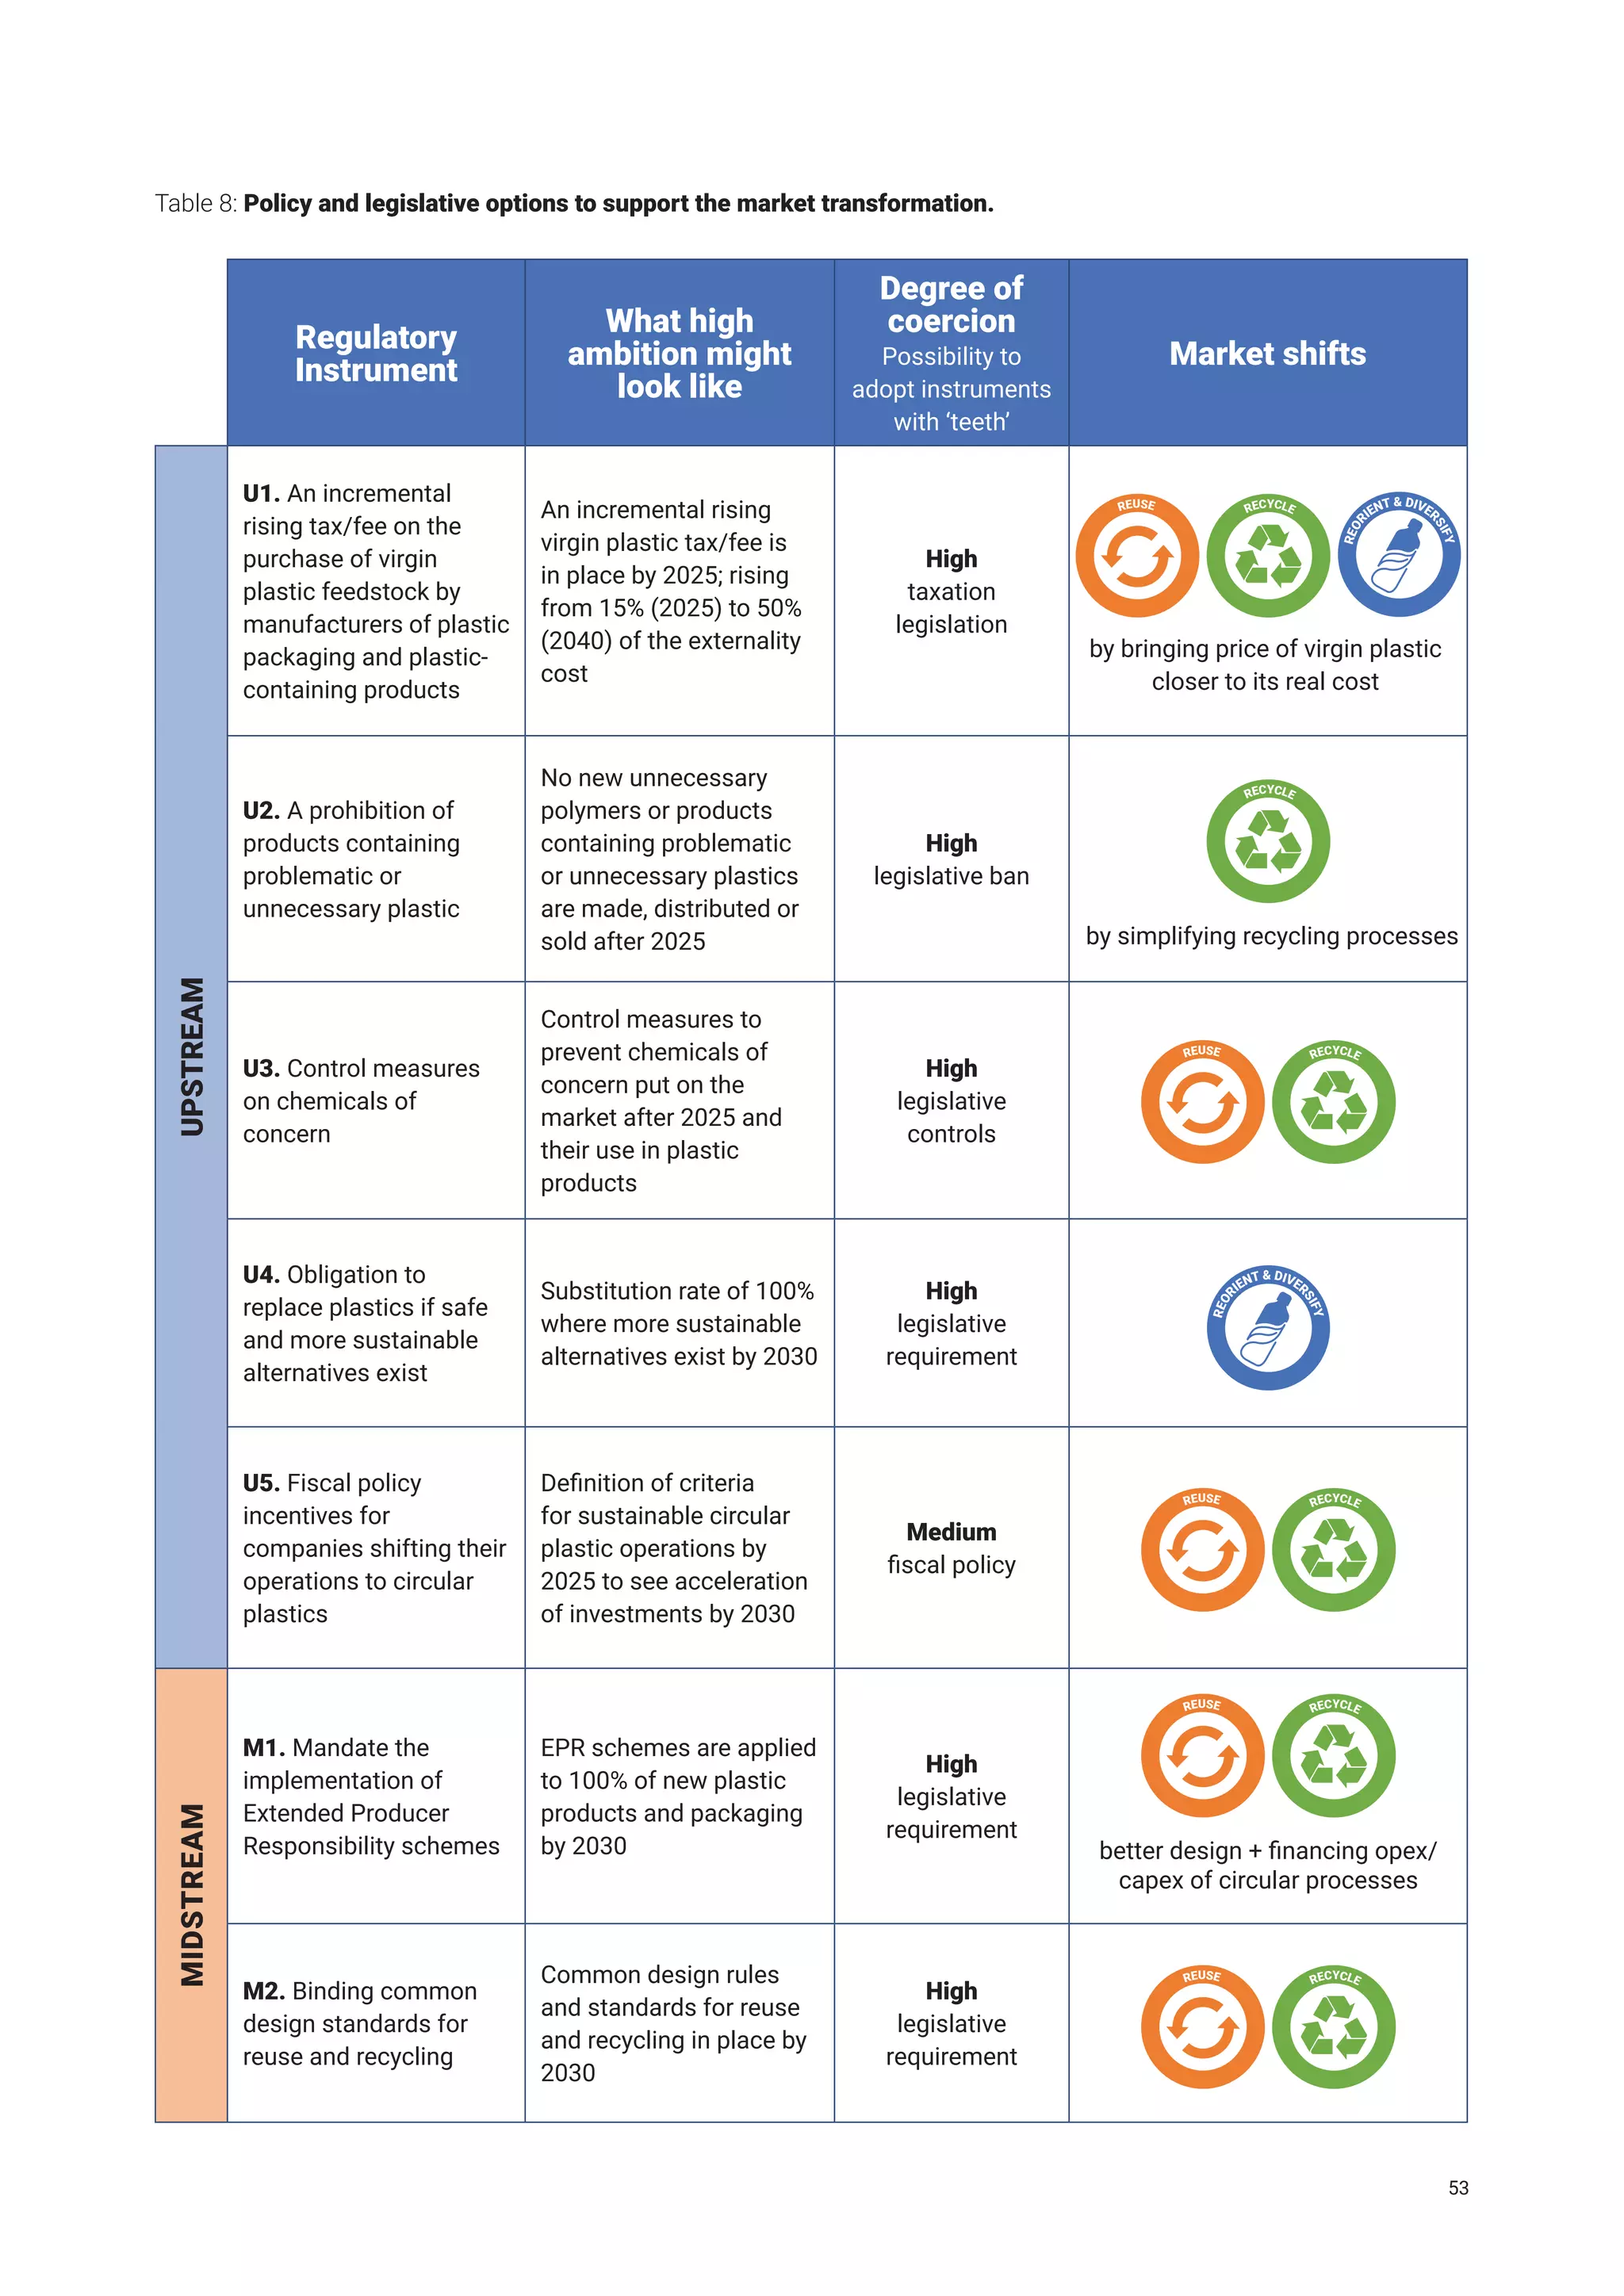
33MMt
Secondary plastics
238MMt
Total waste
generated
46MMt
Sorted for
recycling
98MMt
Disposal
2MMt
Bio-based plastics
USE
219MMt
Fossil-based plastics
107MMt
Mismanaged
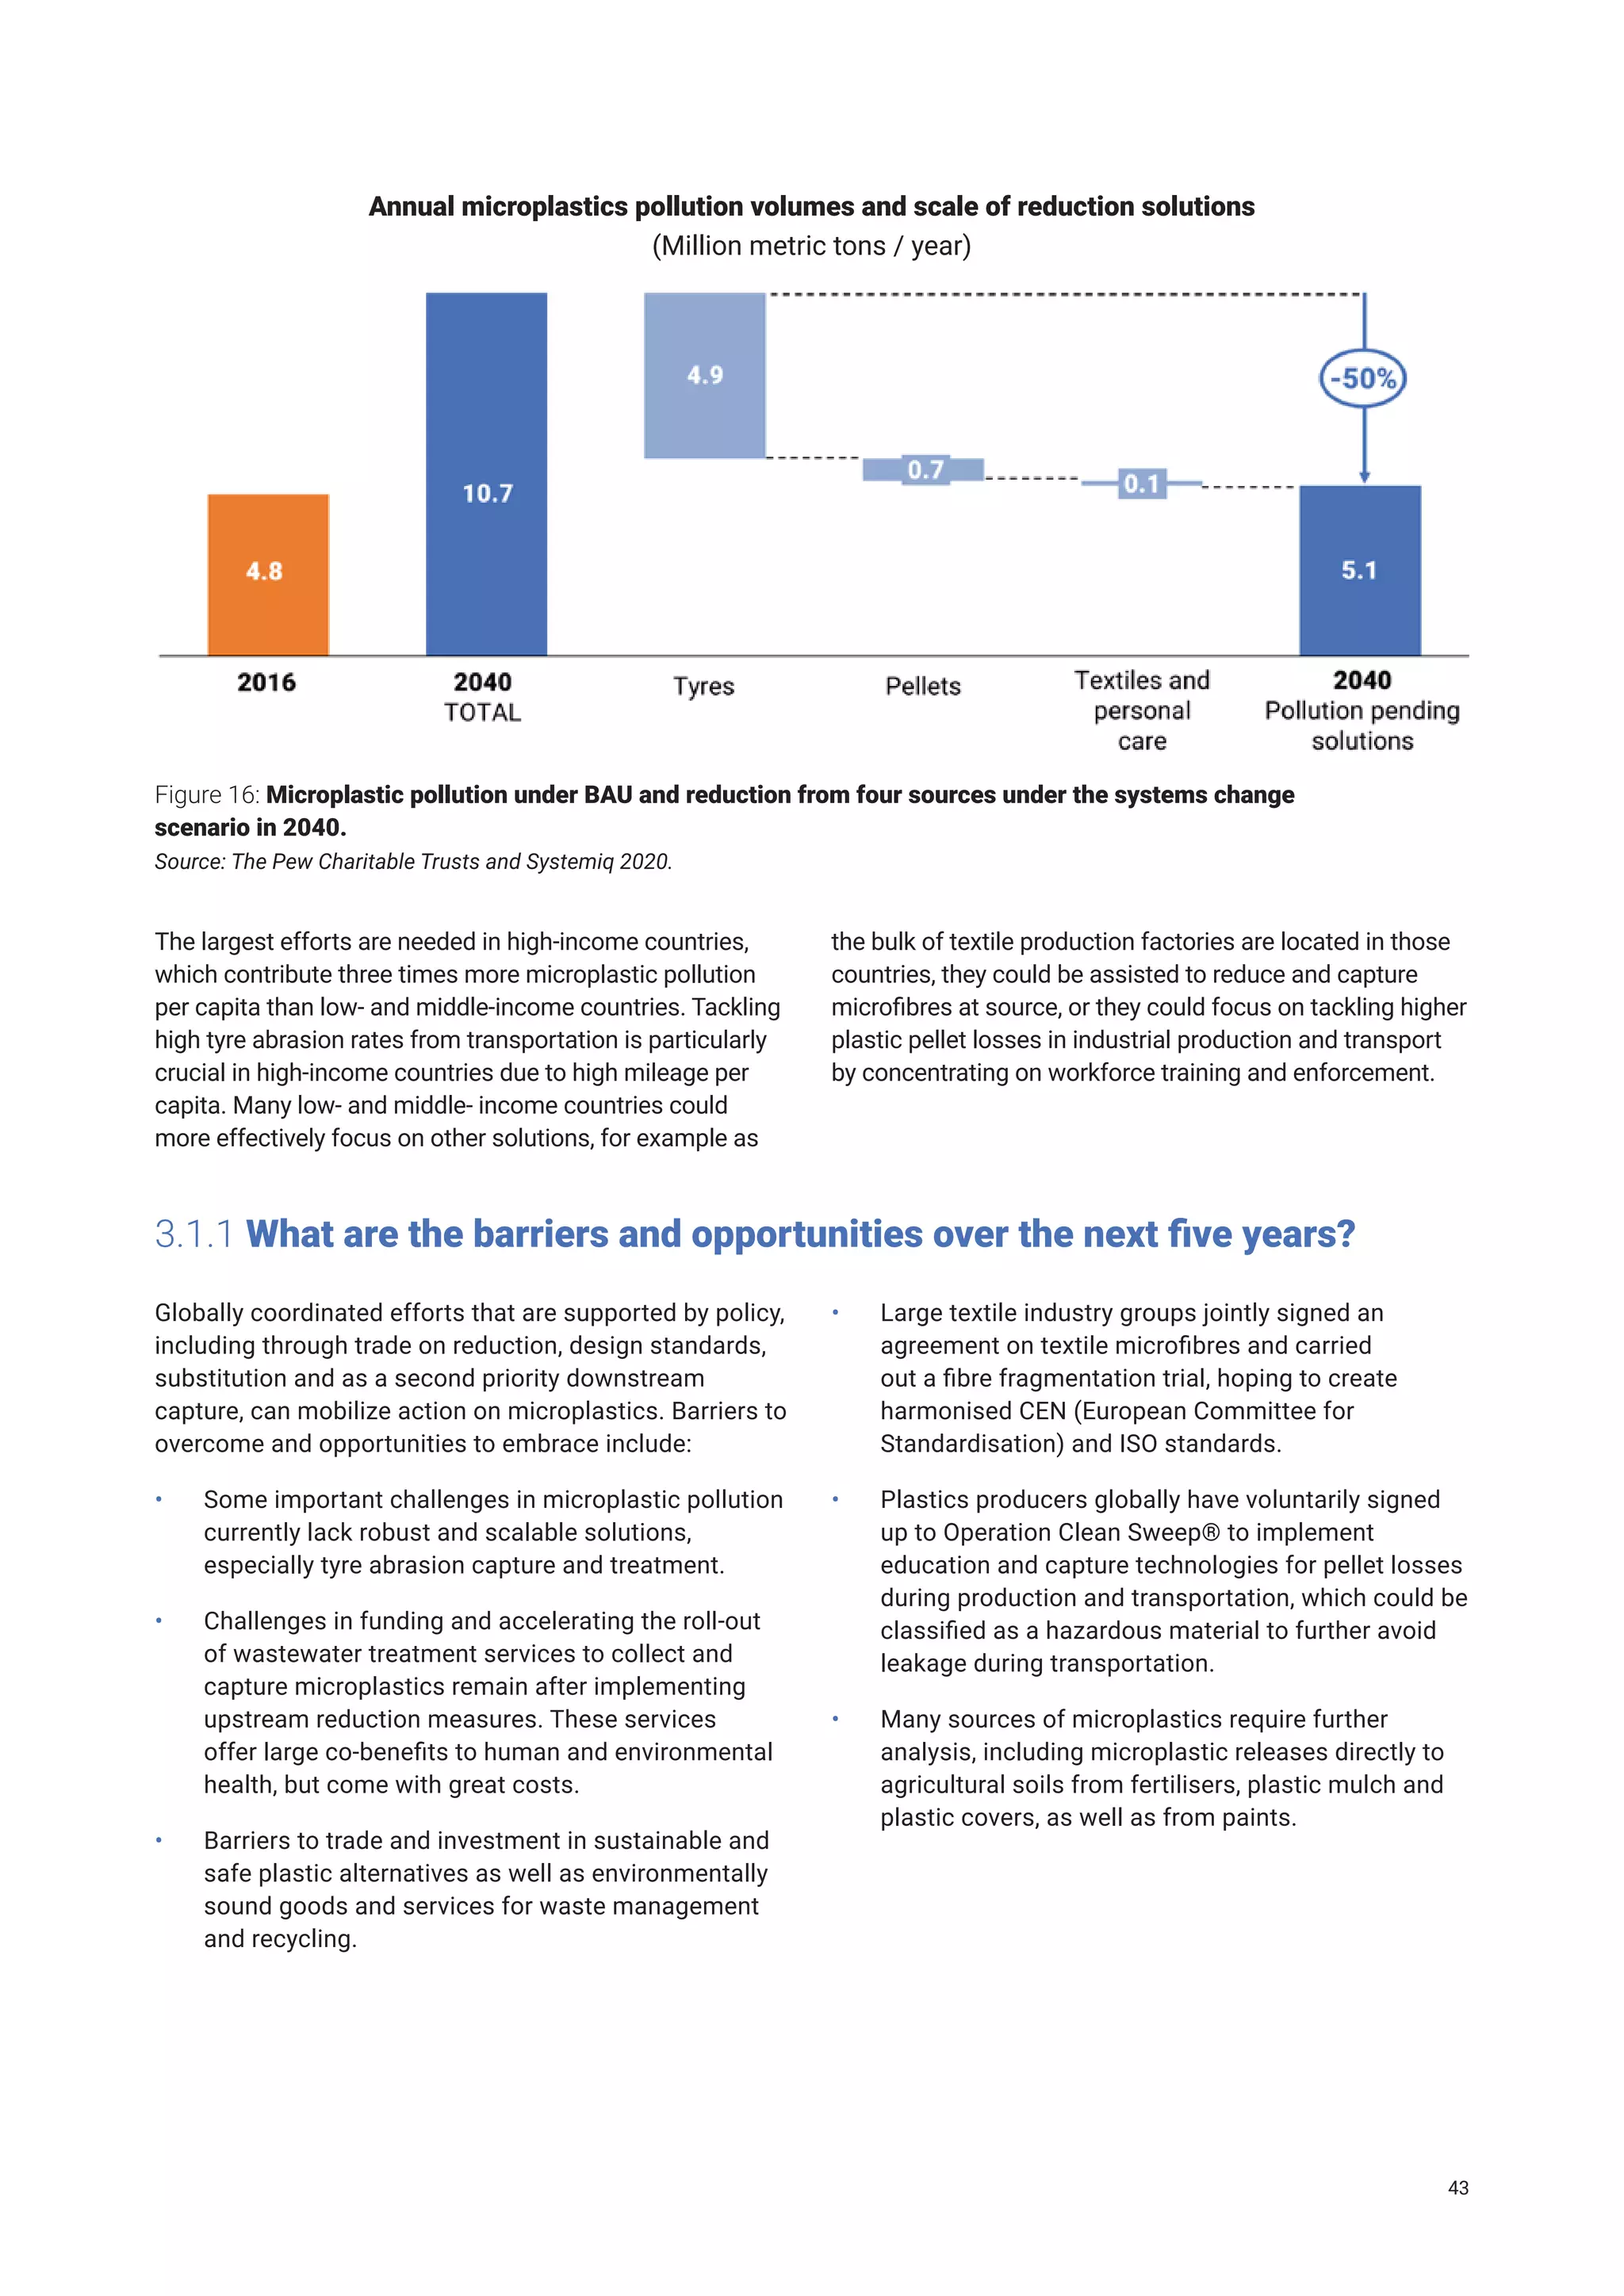
Figure 1: Short-lived plastic flows in 2020.
Source: UNEP modelling building on The Pew Charitable Trusts and Systemiq (2020) and OECD (2022).
2](https://image.slidesharecdn.com/howtheworldcanendplasticpollutionandcreateacirculareconomy-230601004717-772ebcb4/75/How-the-world-can-end-plastic-pollution-and-create-a-circular-economy-20-2048.jpg)
![The current use of plastic is a linear economy because material is extracted, produced and used only once
before being disposed or ending in the environment; a very small circular flow of plastic is cycled back into new
uses (Figure 1). Problems with the current plastics economy include:
• structural flaws: For example, 95 per cent1
of the aggregate value of plastic packaging is lost to the
economy after a single use cycle. In addition, many plastic products are placed in markets that lack
the capacity to collect and safely dispose of them. A systemic approach can lead to a fundamental
transformation of the global plastics economy.
• weak waste management systems: Capacities for the control of transboundary movements,
environmentally sound management of plastic waste, including the necessary infrastructure, are often
lacking and have not kept pace with the sharp rise in plastic consumption, particularly in low- and middle-
income countries (UNEP and International Solid Waste Association [ISWA] 2015). Collection of waste is
chronically underfunded and, despite often being the single highest item in the budgets of municipalities,
formal collection coverage remains patchy (UNEP and ISWA 2015). A significant share of plastic waste
collection is carried out by the informal recycling sector, involving exposure to undignified labour
conditions and significant health risks (UN-Habitat and Norwegian Institute for Water Research [NIVA]
2022). Scaling this as plastic consumption grows is difficult as the informal sector typically only collects
high-value plastics. Even when collection is effective (e.g. in many high-income countries) the rate of
plastic waste being recycled back into the economy is very low (approximately 15 per cent for plastics
in short-lived products or 10 per cent for all plastics [UNEP 2021c]). Gender-related aspects of waste
management within value chains also needs to be addressed because when jobs become formalised
they are often taken up by men thus leaving local women without a source of income (UNEP 2015a;
International Environmental Technology Centre [IETC] 2015).
• a lack of incentives to encourage the adoption of new solutions: Today’s markets are structured around
the ubiquitous use of plastic products, particularly in packaging. New business models that meet overall
needs with less environmental impacts have proven effective (UNEP 2021a) but have not reached the
scale of impact needed. There are currently few policy incentives for new business models or to promote
the adoption of safe and sustainable alternative materials, or new delivery models such as reusable or
refillable packaging (Potočnik and Teixeira 2022).
• design and packaging choices that do not account for local infrastructure: Many plastic products are
designed for a global market, with marketing and sales as primary drivers of product design. Globalised
supply chains of consumer goods fail to account for the realities of the local waste management
infrastructure available to deal with them, which can vary greatly from one municipality to another. Fast
innovation cycles in product design outpace slower innovation downstream (waste infrastructure), which
exacerbates the problem further (The Pew Charitable Trusts and Systemiq 2020).
• insufficient data and reporting: Consistent definitions and standards for plastic data and metrics are
lacking, and there is insufficient transparency regarding the plastic being placed on the global market,
including its composition (polymers, chemicals and additives), demand and what drives it, trade flows, waste
production, consumption, post-use patterns and impacts on human health and marine life. This lack of data
and transparency currently limits effective and safe management of plastics throughout their life cycle. In
addition, there is a lack of field data measuring plastic stocks and flows throughout the value chain, and
many parameters have high uncertainty (The Pew Charitable Trusts and Systemiq 2020).
Box 1: Characteristics of the current global plastics economy
1
Share of actual closed loop recycling for plastic in short-lived products is ~5 per cent
3](https://image.slidesharecdn.com/howtheworldcanendplasticpollutionandcreateacirculareconomy-230601004717-772ebcb4/75/How-the-world-can-end-plastic-pollution-and-create-a-circular-economy-21-2048.jpg)
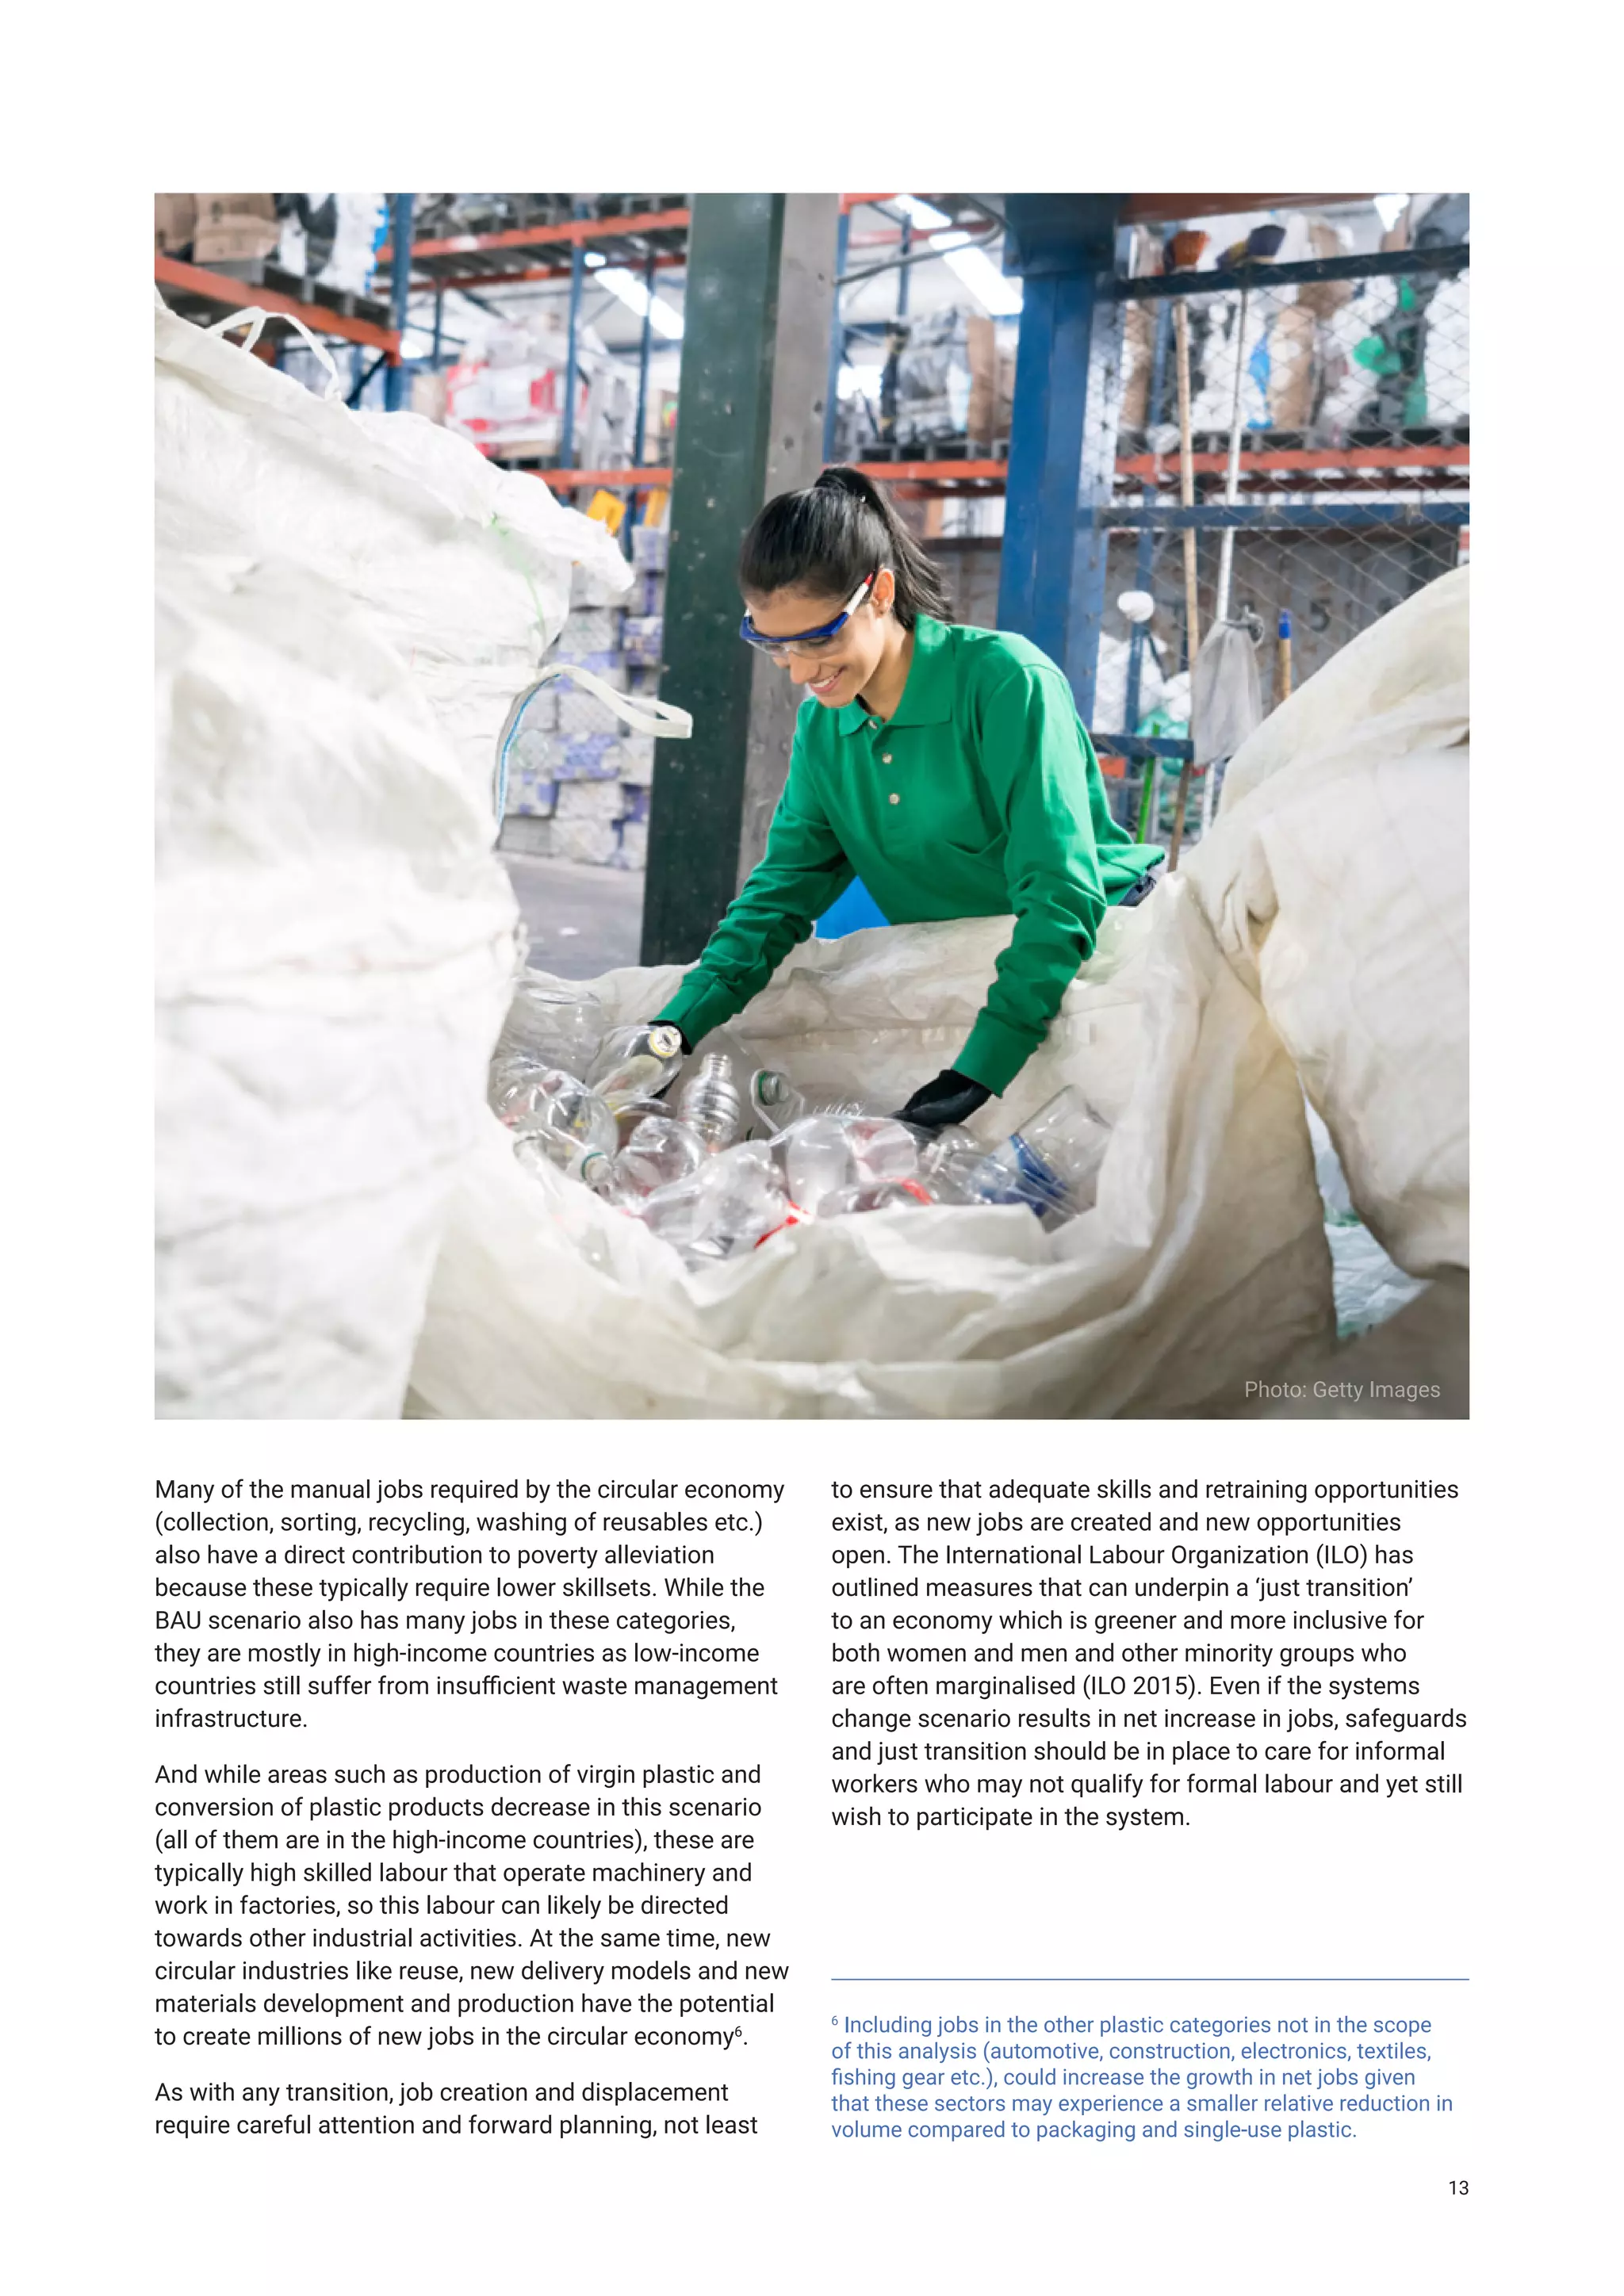
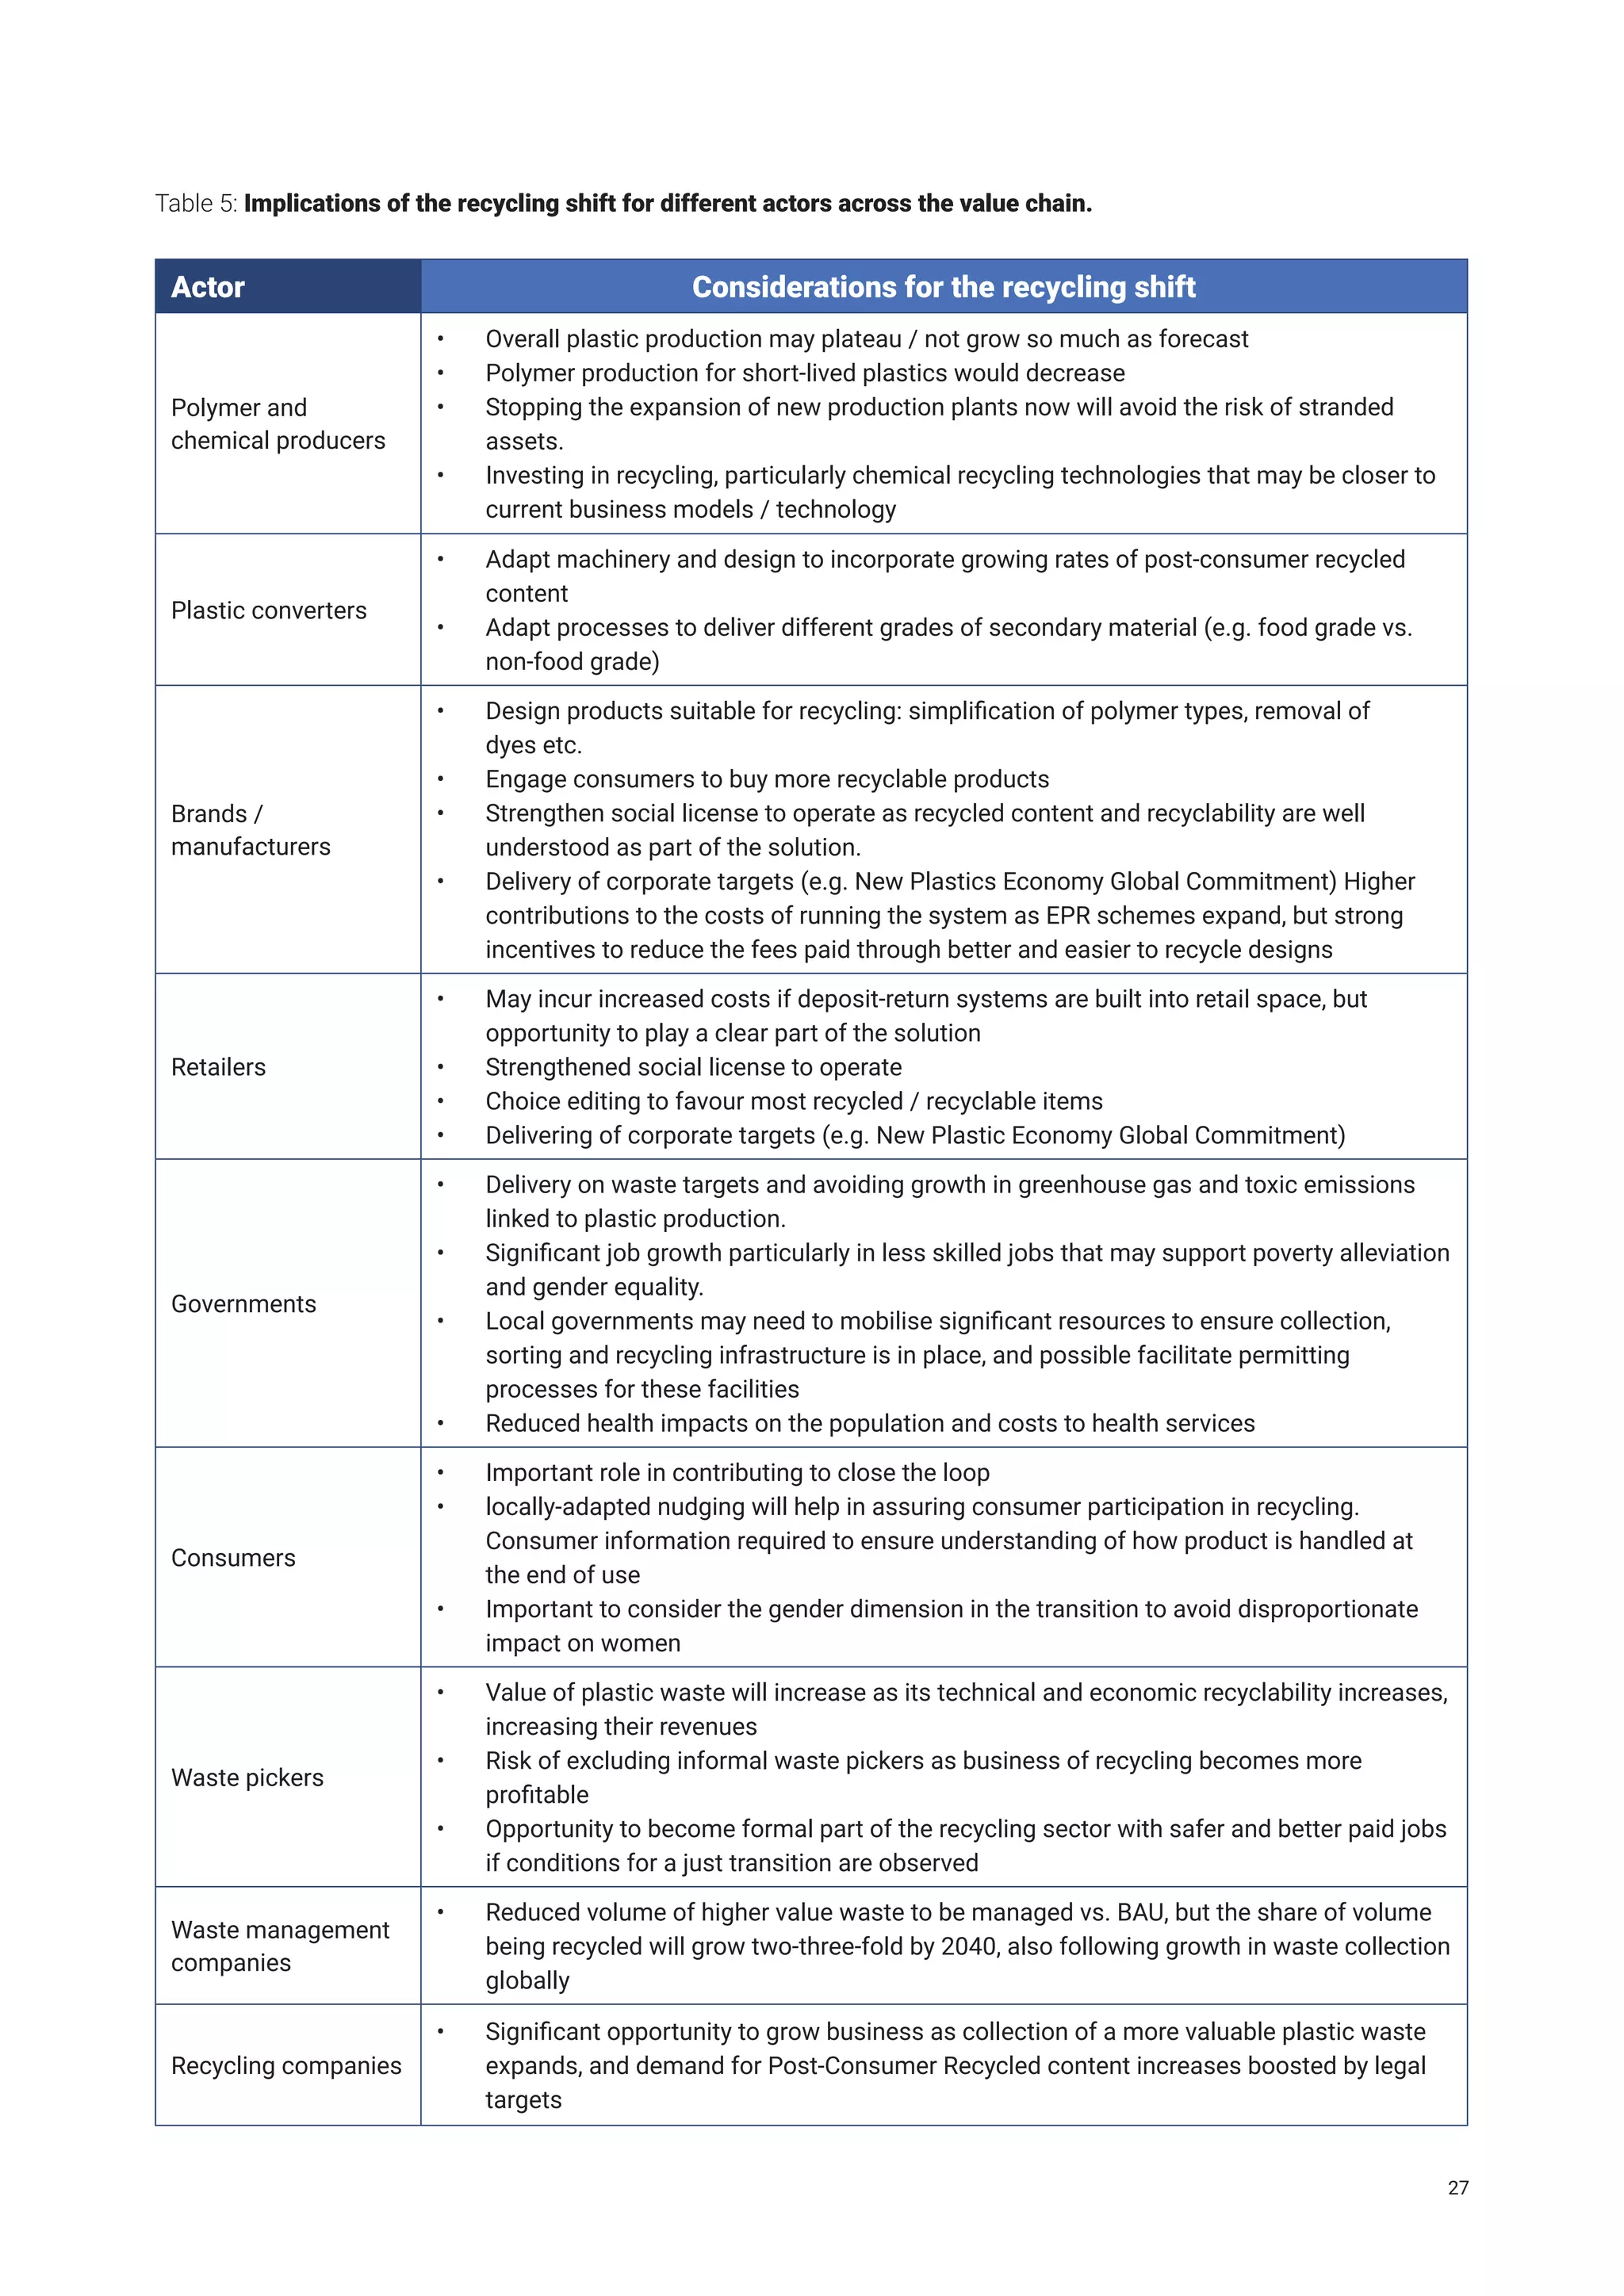
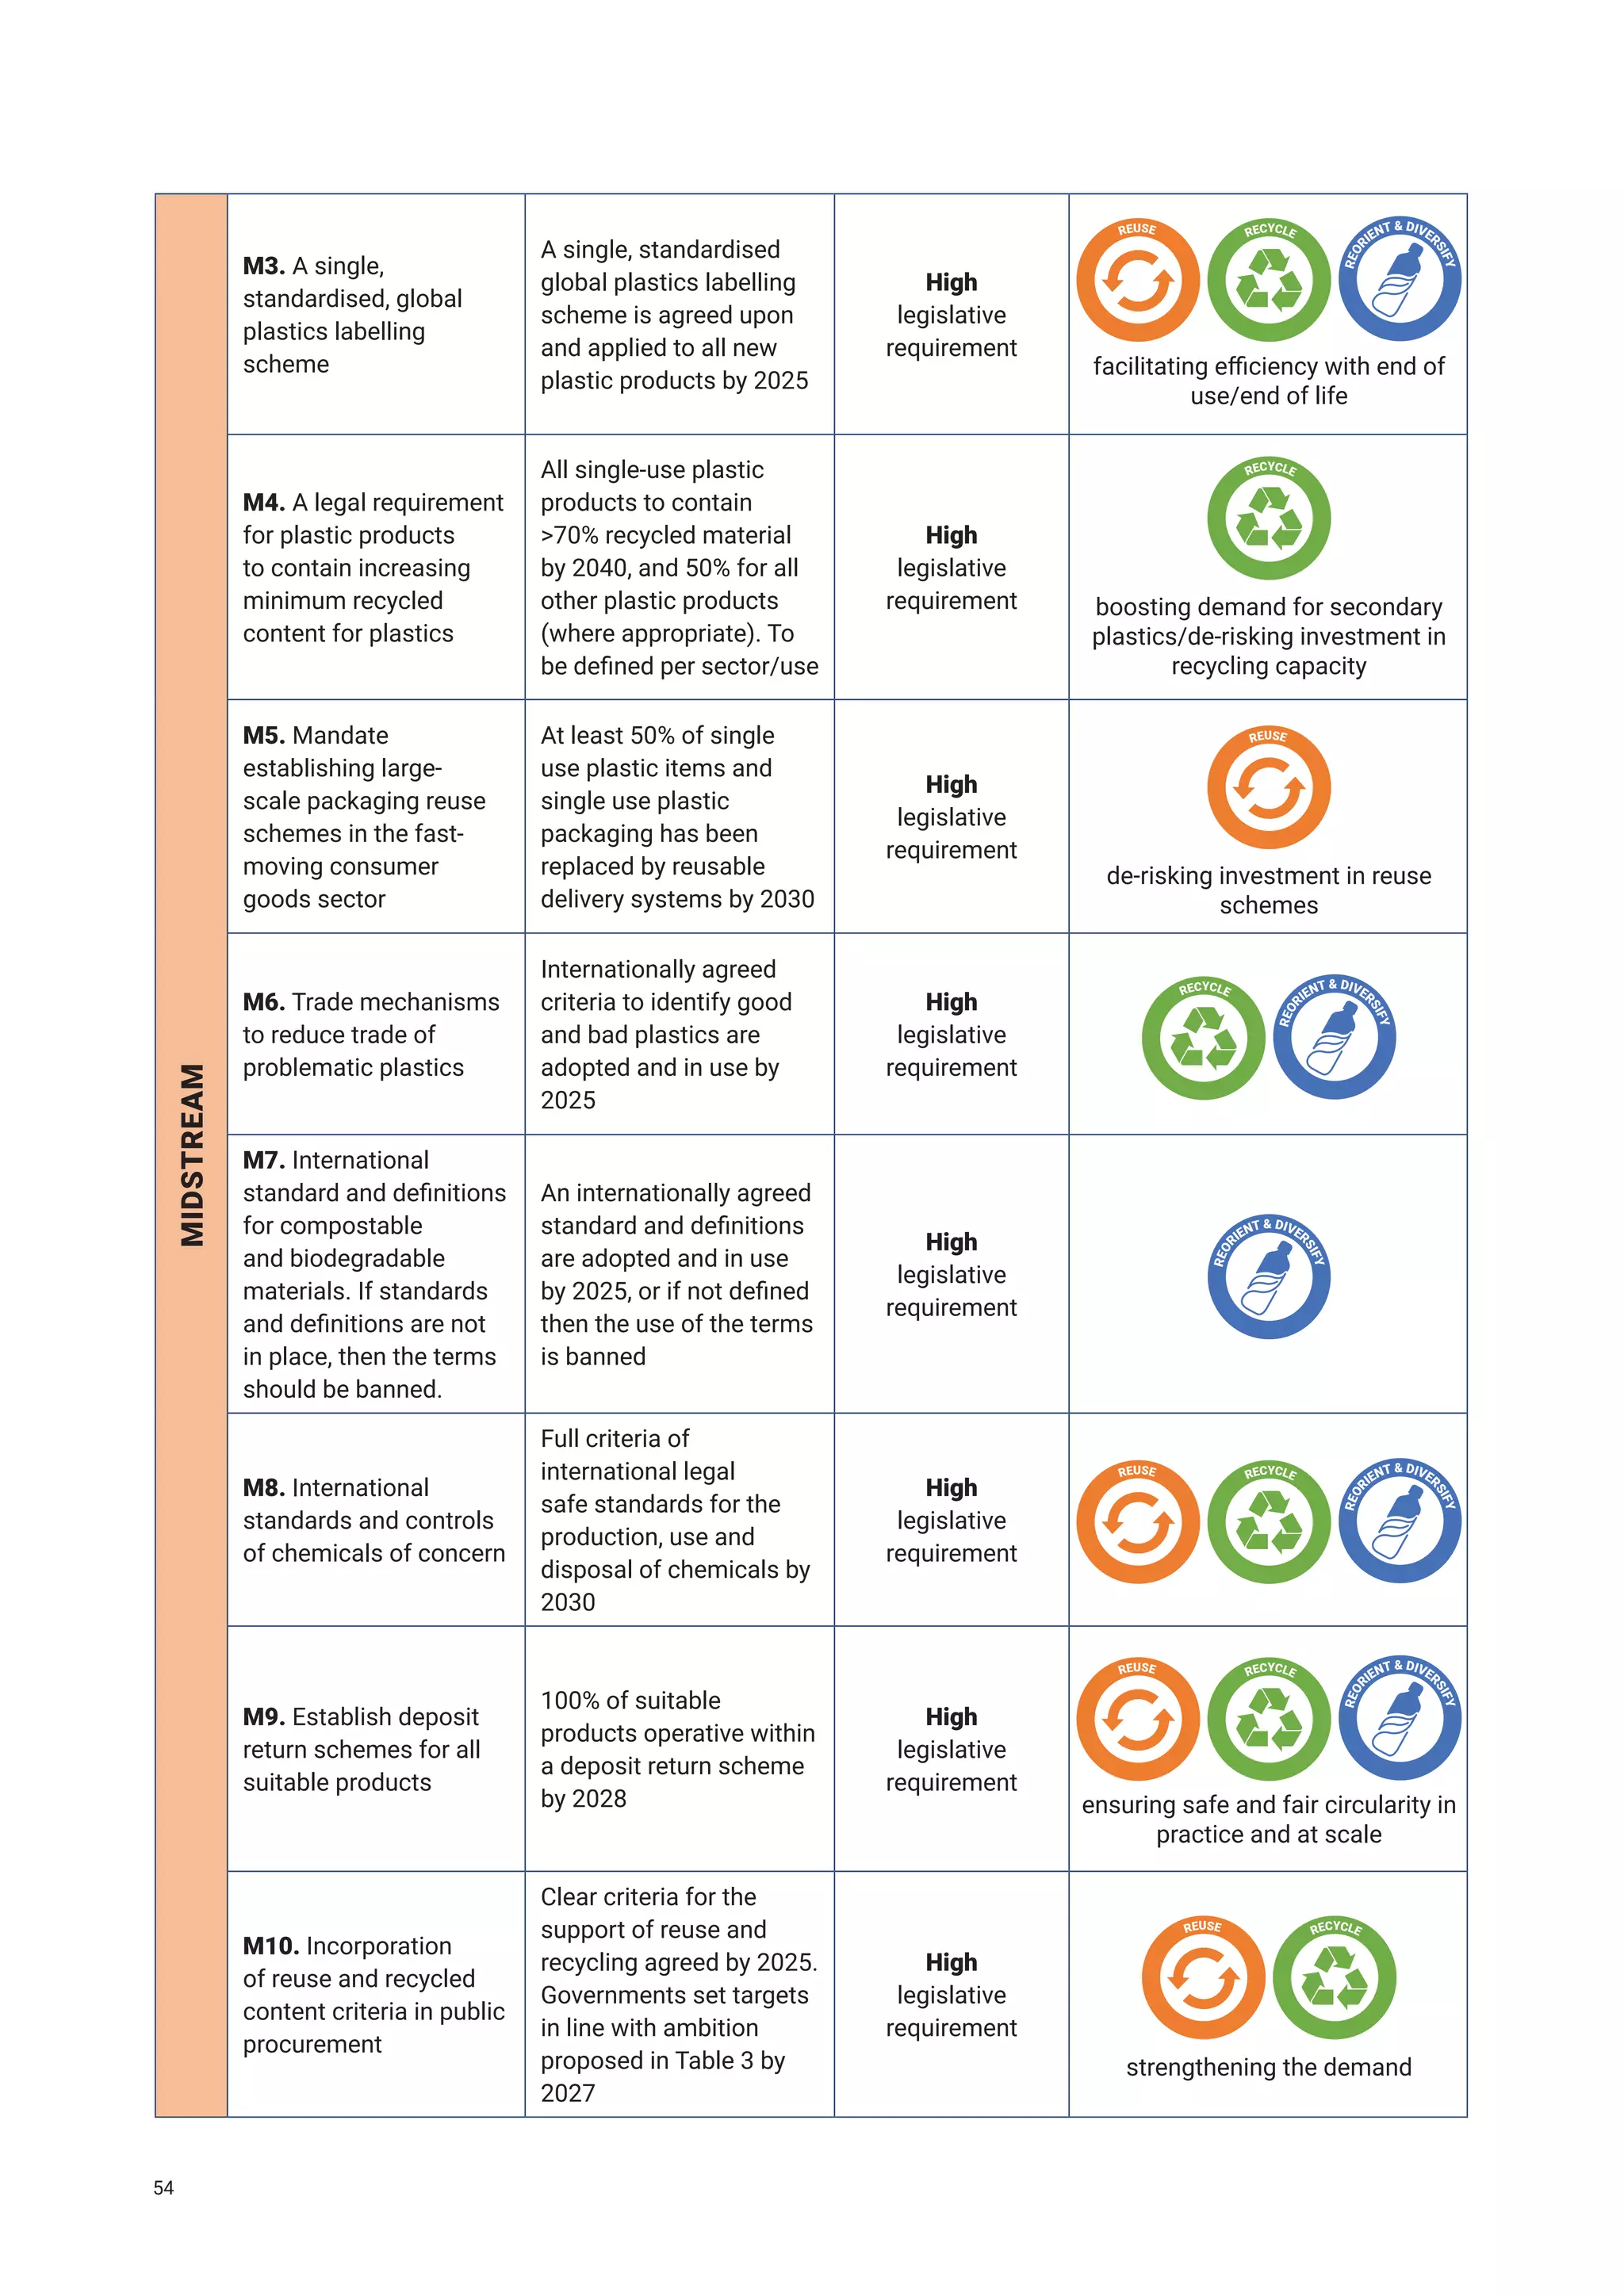
![1.4.3 The job implications of systems change
As shown in Figure 7, a detailed analysis of direct
employment and livelihood impacts shows that the
systems change scenario is good for the jobs market. By
2040, relative to the BAU scenario, the systems change
scenario would result in 700,000 more jobs directly
associated with short-lived plastics; there is a net growth
of 970,000 jobs in developing countries and a net loss of
270,000 jobs in developed countries (but still a net growth
of 150,000 jobs in the Global North relative to today).
Further details of the job implications of systems change
are shown in Annex 1.1.
This growth is due to the systems change scenario
expanding collection and sorting across developing
countries, which would support more livelihoods.
Additionally, the circular economy is typically more labour
intensive than the linear economy because it shifts
much of the production activity (which relies mainly on
machines) to services which require humans (recycling,
reverse logistics and reuse). The considerations of gender
equality in job creation is crucial to ensure a just transition,
more so in developing countries (International Labour
Organization [ILO] 2022).
WASTE
1.9
Million
3.2
Million
1.5
Million
Virgin plastic
production
1.2
Million
2.1
Million
1.1
Million
Plastic
conversion
3.1
Million
Reorient -
new materials
1.4
Million
Reuse and New
delivery models
4.0
Million
5.9
Million
4.8
Million
Formal and
informal
collection
and sorting
10.5
Thousand
13
Thousand
9
Thousand
Thermal treatment
and landfills
Recycling
(mechanical and
chemical)
TOTAL JOBS
101
Thousand
167
Thousand
250
Thousand
7.2
Million
11.3
Million
12.0
Million
2020 Current
2040 Business-as-usual
2040 Systems change scenario
Figure 7: Total jobs in different parts of the short-lived plastics value chain in the current market, and under business-
as-usual and systems change scenarios.
Source: The Pew Charitable Trusts and Systemiq 2020
12](https://image.slidesharecdn.com/howtheworldcanendplasticpollutionandcreateacirculareconomy-230601004717-772ebcb4/75/How-the-world-can-end-plastic-pollution-and-create-a-circular-economy-30-2048.jpg)
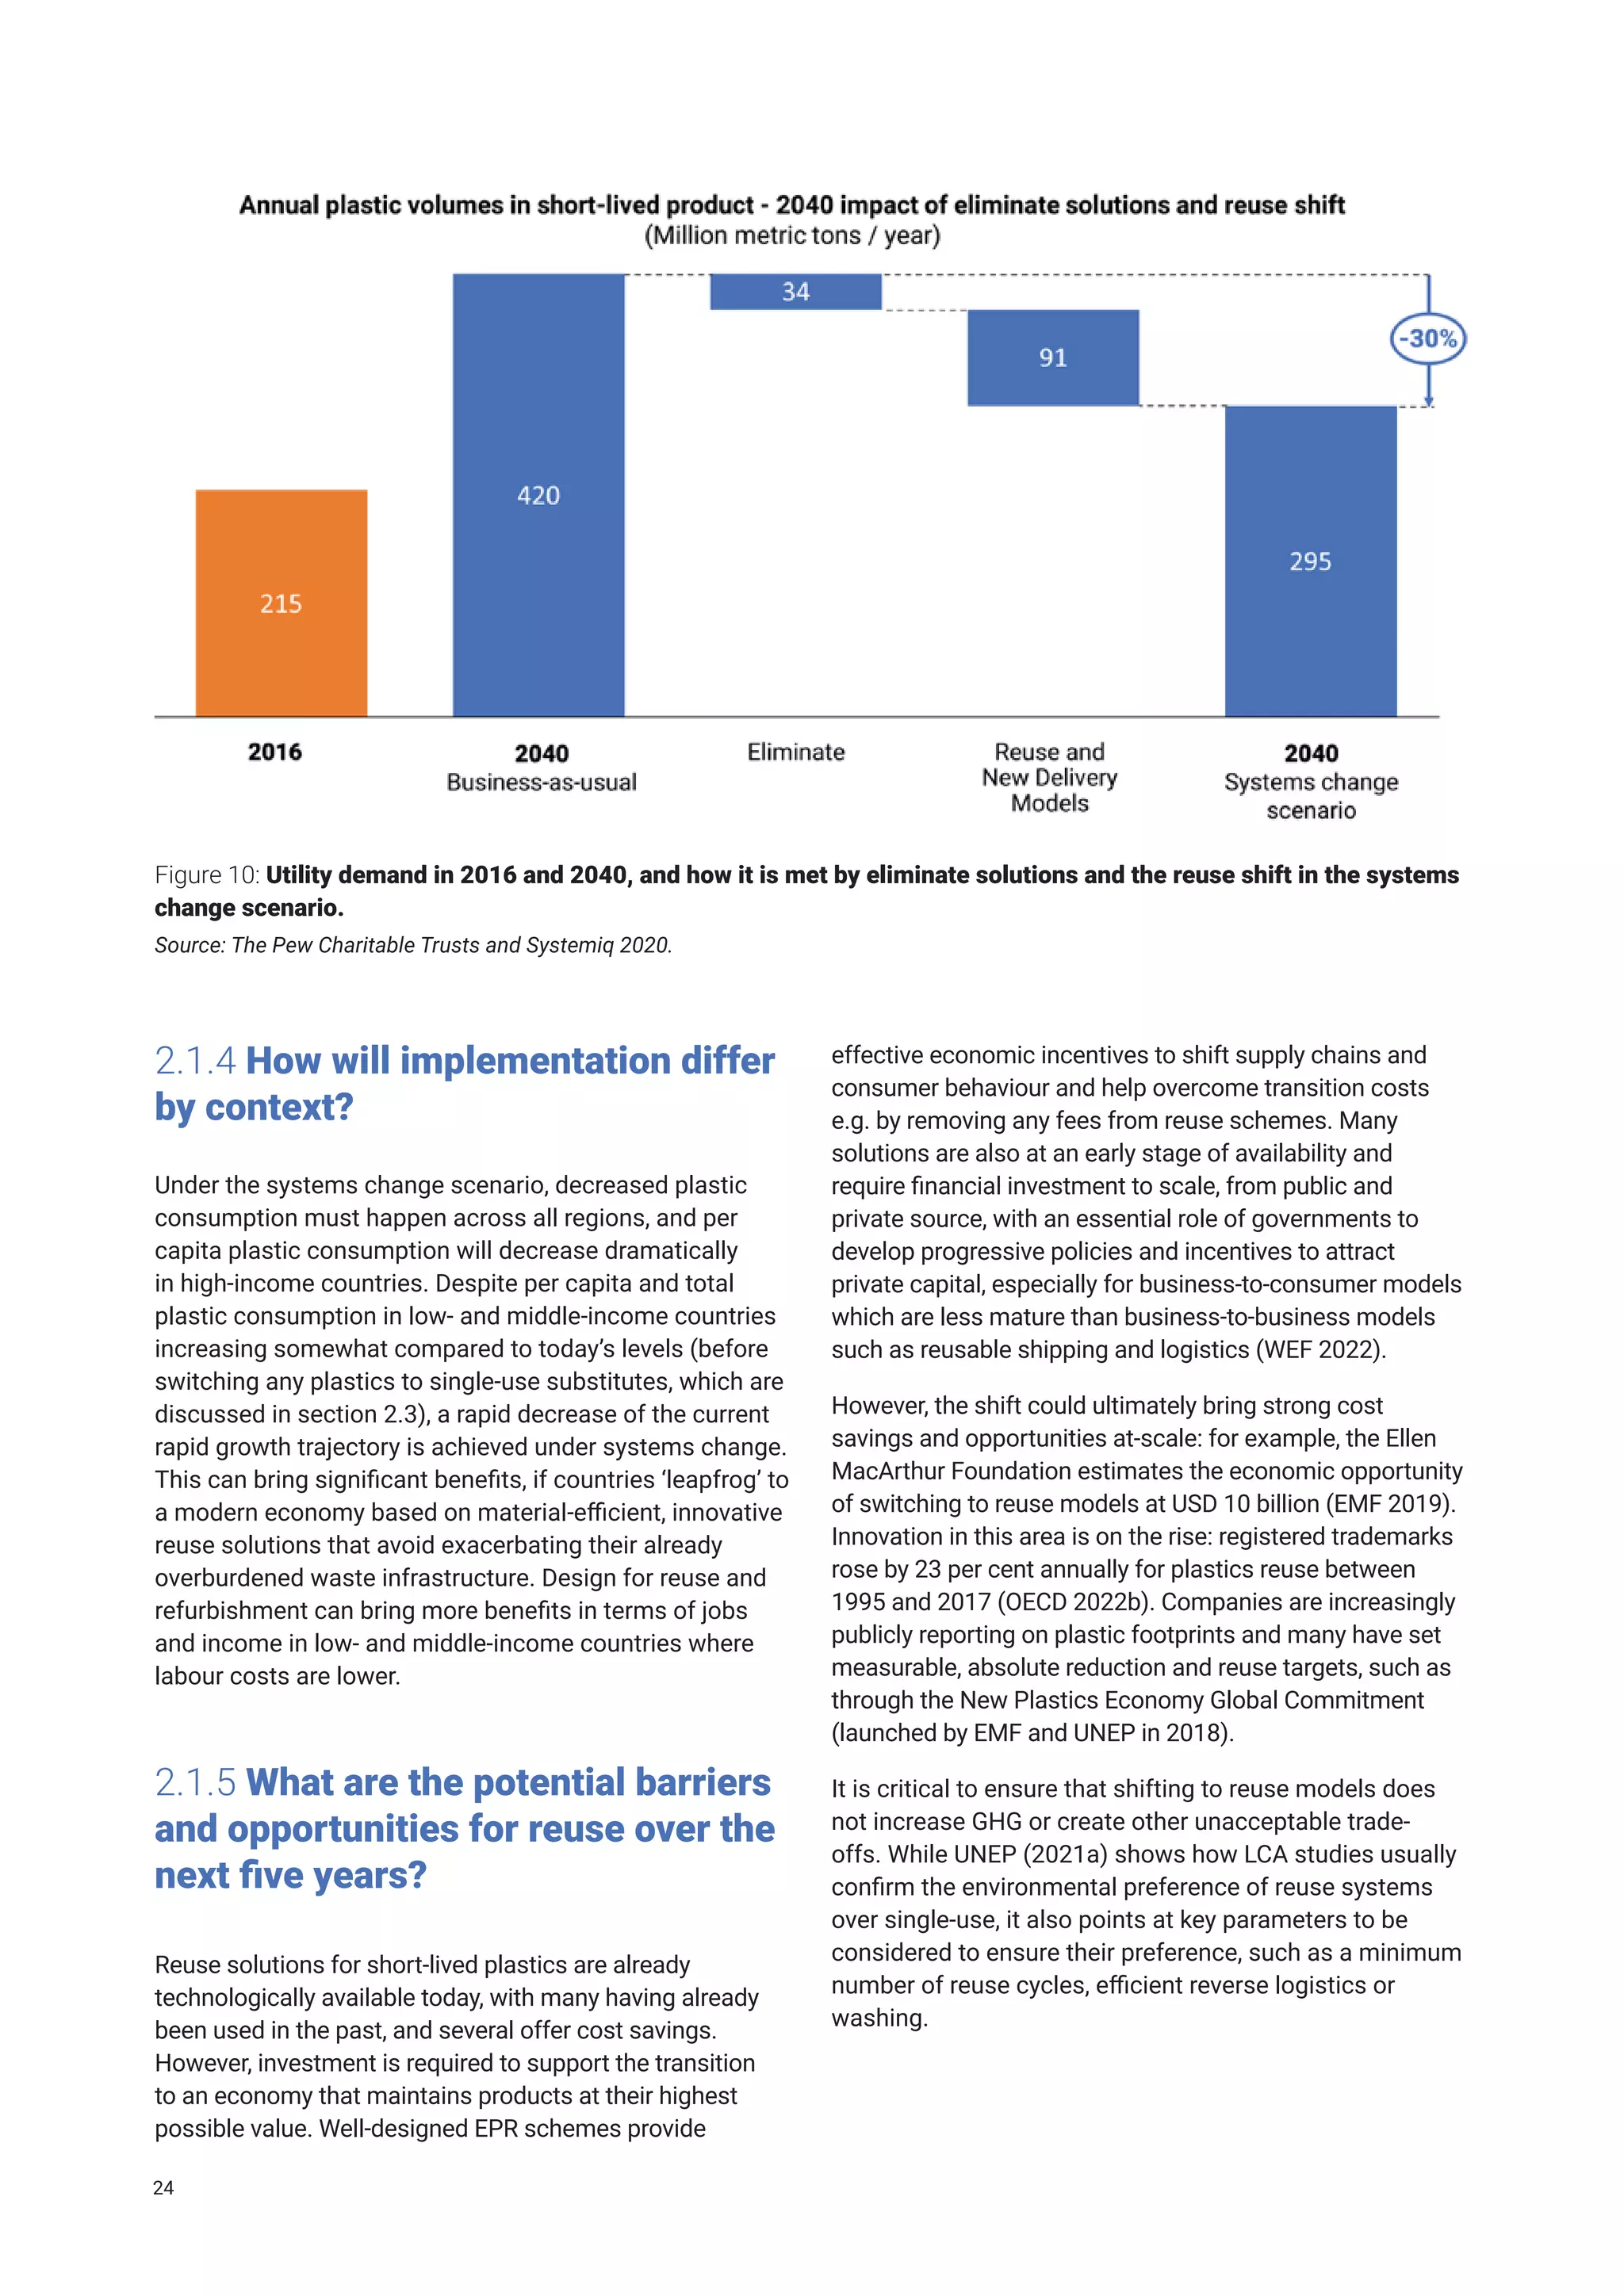
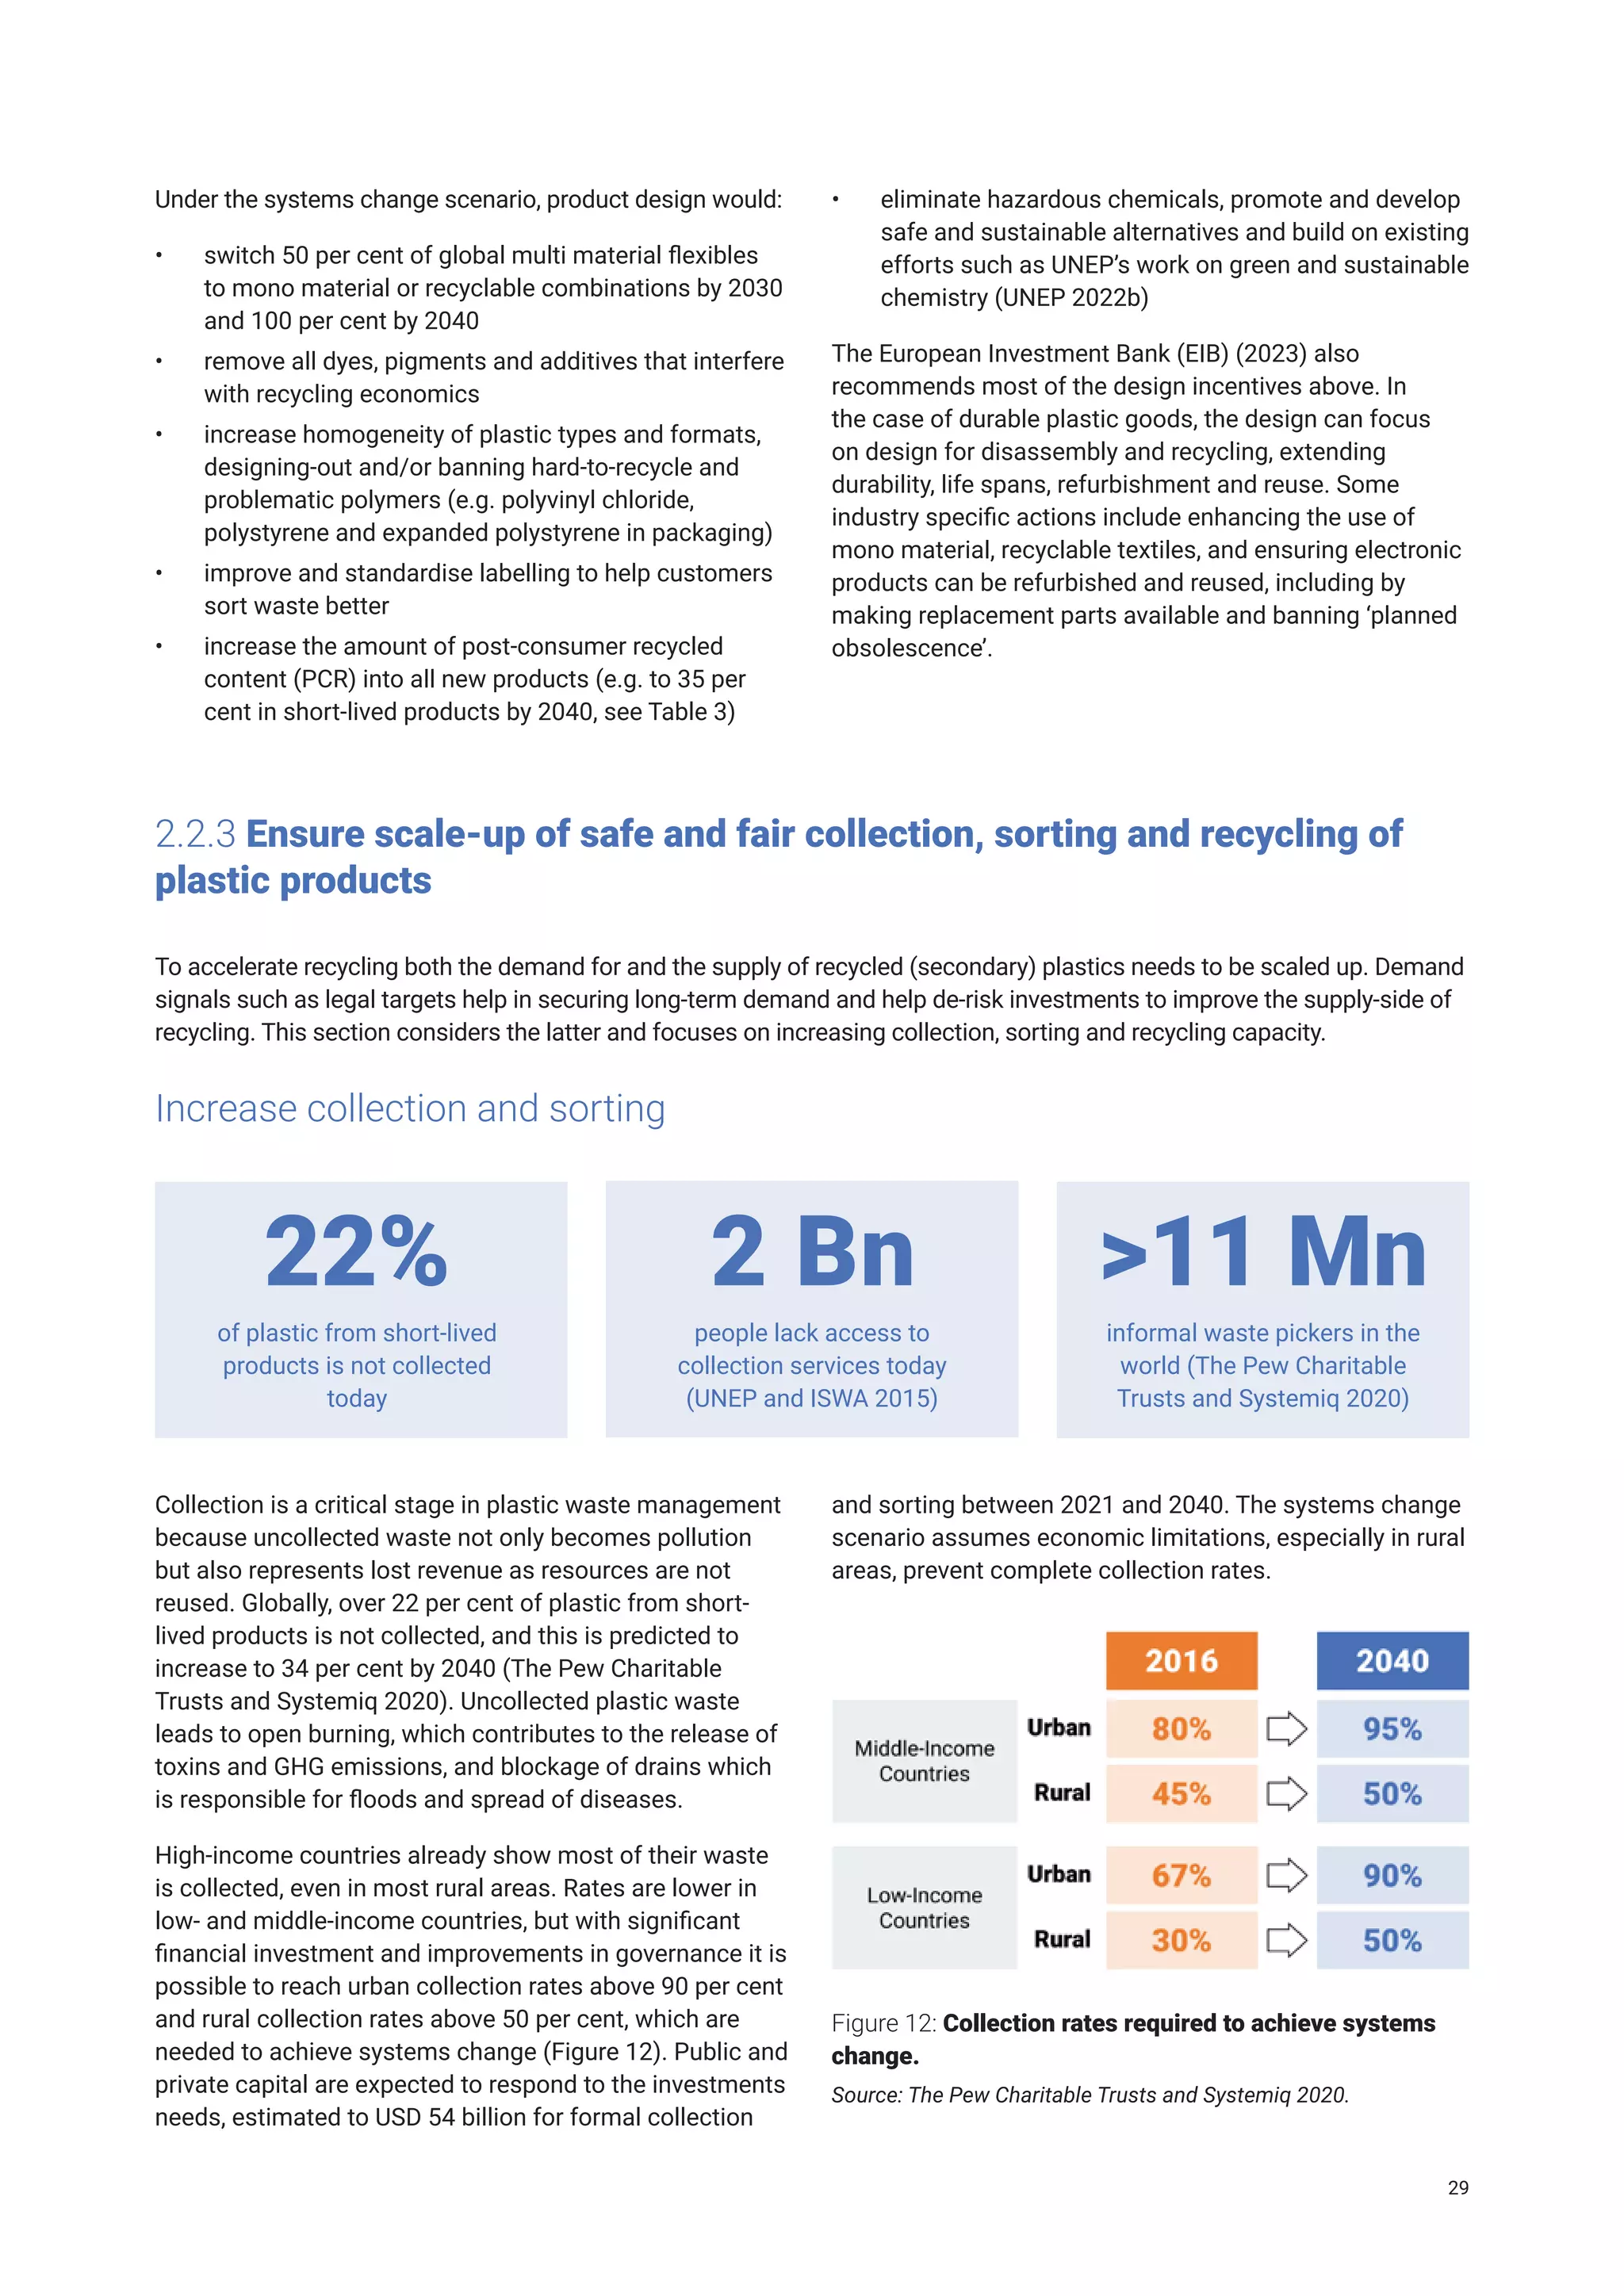
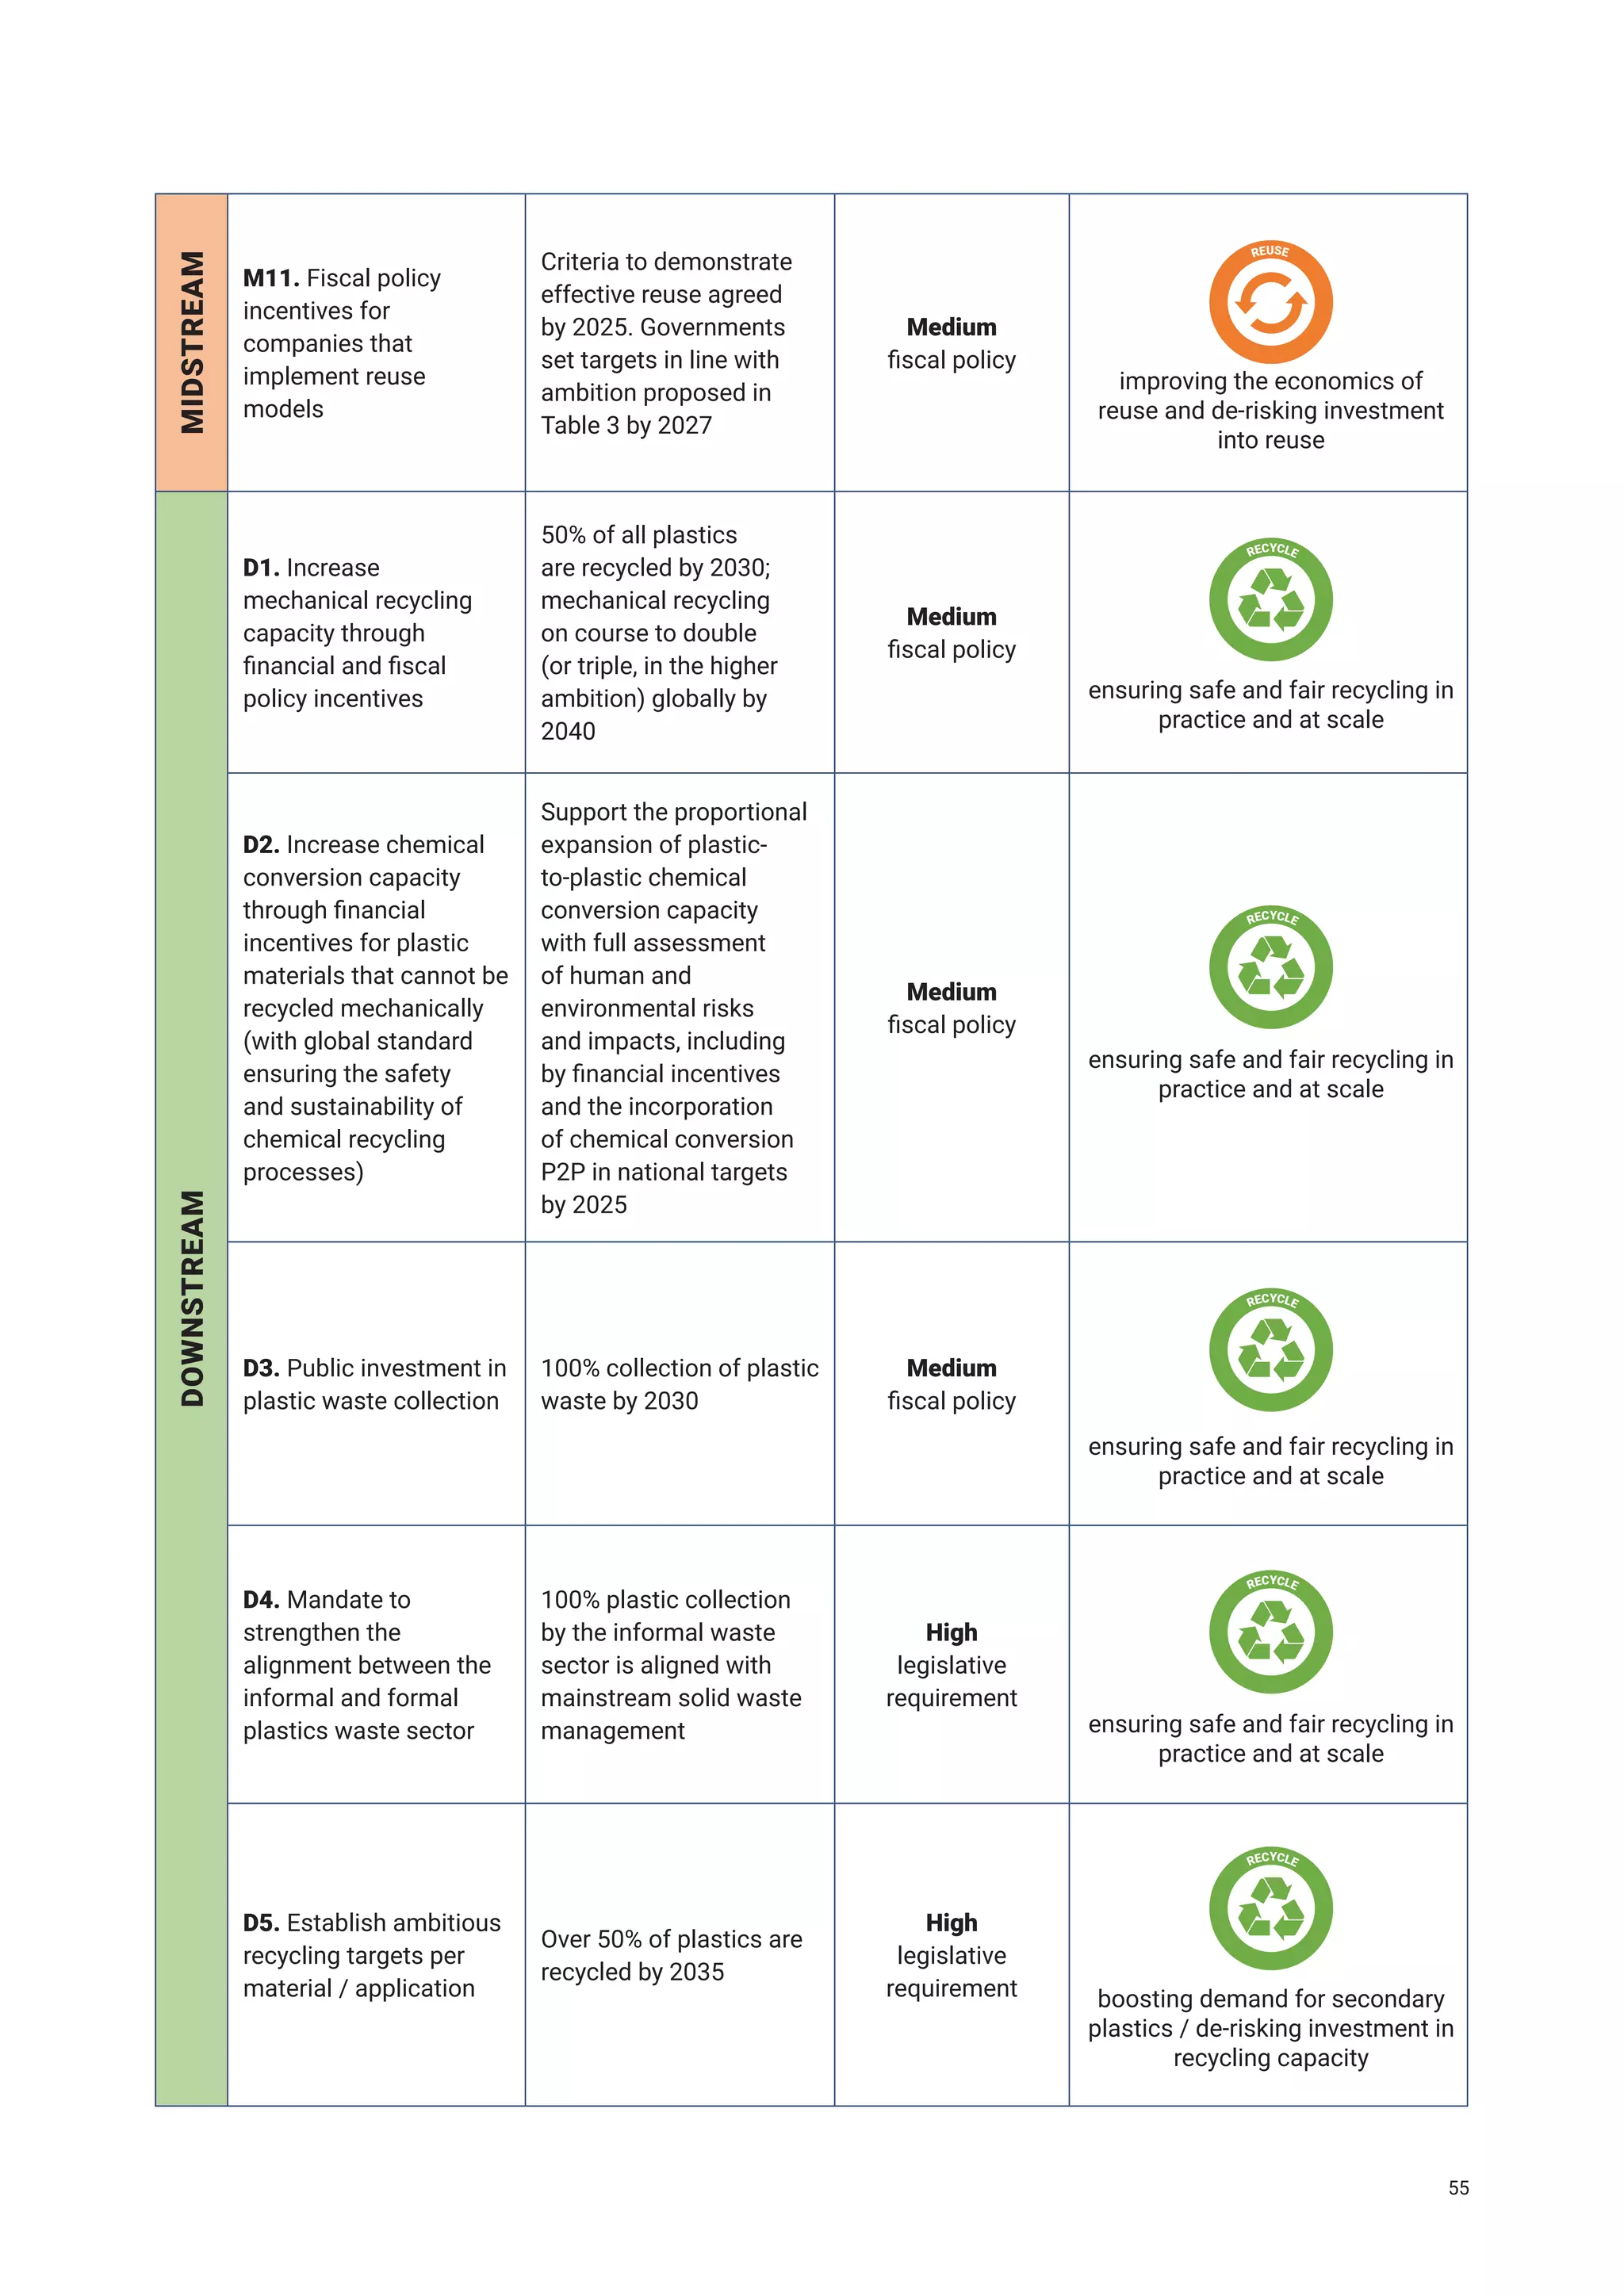
![1.5.4 Wasting time will lead to more pollution
The next three to five years present a critical window for
action to set the world on the path towards implementing
the systems change scenario by 2040. If it takes longer to
apply these same solutions, the model used indicates that
an additional 80 million metric tons of plastic pollution will
be entering the environment (The Pew Charitable Trusts
and Systemiq 2020).
To deliver the targets set out in Table 3, and ultimately a
better plastics future, it is crucial to align all financial flows
with the goals of the market transformation by 2040 (all
values are in net present value [NPV]).
This includes:
• Reducing by USD 2.2 trillion all financial flows towards
virgin plastic production
• Mobilising at least USD 600 billion from all sources to
reuse and new delivery models
• Increasing by USD 230 billion financial flows to formal
collection and formal sorting in middle income and
low-income countries, and by USD 70 billion financial
flows to improve recycling technologies and increase
recycling capacity
• Mobilising at least USD 1.7 trillion from all sources
to production of sustainable substitute materials and
end of life management facilities and technologies
Required scale of change in the next
five years
Required outcomes and scale of change by
20407
Reduce the
size of the
problem and
Accelerate
reuse
Reduce 10% (25 MMt) of short-lived plastics
versus BAU including at least 20% via reuse
and new delivery models for all bottled
products and beverage cups
Reduce growth in short-lived plastic consumption
to avoid ~30% of 2040 projected plastic waste
generation via elimination, reuse and new delivery
models, including at least 50% via reuse and
new delivery models for bottled products and
beverage cups
Accelerate
recycling
Re-designing 25% of multi material and
multi-layer globally into mono material
formats (13 MMt)
Design products to expand the share of
economically recyclable plastics, e.g. switching
100% of multi-material flexibles to mono-material
Increase the amount of post-consumer
recycled content in all new products from
circa 6% in 2020 to 14% globally (i.e. 69
MMt)
Increase the amount of post-consumer recycled
content in new products to 35% of new short-
lived plastic products (i.e. 80 MMt) and 6% of
durable plastic products (i.e. 19 MMt)
Achieving 70% collection rates (vs. 50%
in 2016) in low-income urban areas, while
supporting livelihoods of informal waste
pickers
Expand waste collection rates in middle and low-
income countries to 90% in urban areas and
50% in rural, supporting the informal collection
sector
Increasing the global mechanical recycling
capacity by 50% versus 2016, from ~43
MMt to ~65 MMt (equivalent to growing
mechanical recycling rate of short-lived
plastics from 14% in 2016 to 20% in 2028)
DOUBLE annual mechanical recycling capacity
globally from 43 MMt to 86 MMt (equivalent to
growing mechanical recycling rate of short-lived
plastics to 35% globally). Enhanced ambition
could TRIPLE mechanical recycling capacity to
129 MMt*
Develop sustainable plastic-to-plastic conversion,
potentially to a global capacity of 13 MMt per
year
Table 3: The systems change scenario outcomes and scale of change in the next 5 years and by 2040.
MMt = million metric tons.
7
Building from Breaking the Plastic Wave - The Pew Charitable Trusts and Systemiq 2020.
* It is important to note that while feasible financially (the necessary investment could pay for itself as the economics of recycling are
favourable and would be more favourable with the integrated actions), this recycling target can only be achieved and can only make
sense with very ambitious design for recycling, collection and sorting requirements ensuring that virtually all plastic otherwise going to
landfill will be recyclable and recycled.
16](https://image.slidesharecdn.com/howtheworldcanendplasticpollutionandcreateacirculareconomy-230601004717-772ebcb4/75/How-the-world-can-end-plastic-pollution-and-create-a-circular-economy-34-2048.jpg)
![Plastic reuse and new delivery models, together with
elimination of problematic and unnecessary plastics, are
highly effective interventions because they can reduce
waste at source. Reuse schemes (also referred to as reuse
systems or models), refers broadly to new delivery models
in which a single product (e.g. a package) achieves
multiple trips, rotations or uses for the same purpose for
which it was originally used (International Organization for
Standardization [ISO] 2013). This can range from simple
bulk dispensers in-store to more complex schemes with
deposits and packaging take-back, washing and repair.
These include the shift to reusable water bottles, food
containers and bags, new delivery models such as refill
from dispensers and bulk systems in retail, low-packaging
subscription services, concentrated product capsules, and
take-back services with reverse vending machines, deposit
refund schemes and washing pooling systems (EMF 2019;
Environmental Investigation Agency [EIA] 2022).
2.1 Market shift one: Accelerate reuse
These solutions also decrease risk of exposure to
hazardous chemicals in plastics and our dependence
on fossil fuel-based plastics, vital in the face of oil and
gas price volatility, geopolitical risks, and the urgent
need to tackle climate change. Reusable alternatives
are environmentally preferable according to Life Cycle
Assessment (LCA) meta-studies (UNEP 2021a). See topic
sheet on ‘Reuse schemes’ for further details.
This market shift can be unlocked by improving the
economics of reuse (which is in turn supported by
aligning design and sharing of reuse elements to enable
economies of scale); as well as aligning regulation of
chemicals, material and waste flows to reuse.
Photo: Getty Images
Plastic consumption expected
to double by 2040 globally under
BAU versus 2016
of plastics from short-lived
products are avoidable and can
be reduced
of plastic reduction could
come from reuse, refill and new
delivery models
2X 30% ~70%
20](https://image.slidesharecdn.com/howtheworldcanendplasticpollutionandcreateacirculareconomy-230601004717-772ebcb4/75/How-the-world-can-end-plastic-pollution-and-create-a-circular-economy-38-2048.jpg)
![2.1.1 Improve the economics of reuse
Once established, reuse schemes keep resources at a
higher value in the economy and thus avoid losing the
economic value of the manufactured goods after a single
use. Reuse and new delivery models are the most economic
schemes to put in place, after plastic elimination, and are
estimated to generate net savings to the system (USD 1,289
per ton of plastic for reuse schemes and USD 516 per ton
of plastic for new delivery models) (Annex 1.1; The Pew
Charitable Trusts and Systemiq 2020).
However, the costs of shifting to reuse schemes should not
be underestimated: private costs of reuse models (reuse
and new delivery models) are estimated at circa USD 609
billion between 2021 and 2040 (The Pew Charitable Trusts
and Systemiq 2020). Sharing elements of the reuse system
(such as return systems and containers in the case of
reusable packaging) can enable economies of scale thus
improving the economics of reuse. The topic sheet on
‘Design guidelines for circularity’ provides more details on
what can be achieved.
Circular systems tend to be more labour intensive than
linear systems, which are resource intensive; therefore,
shifting the fiscal burden from labour to resources
improves the economics of reuse (and other circular
solutions such as recycling). Several studies (OECD
2022c; World Bank Group 2022a; Economist Impact
2023) have suggested the introduction of a virgin plastic
tax to reduce or reverse the price gap between virgin
single-use products and those that reduce the amount of
virgin plastic demand (such as reuse systems and also
recycled products).
Reuse systems require services and infrastructure, which
were eliminated a few decades ago when disposability
became the norm. Fiscal incentives could support the
transition until reuse becomes commonplace again,
acknowledging that reuse will also deliver favourable
outcomes in terms of jobs, economic benefits and
reduced environmental impacts.
Targets embedded in legislation (such as in France’s
Anti-Waste Law: Government of France 2021) provide
assurance in the market by de-risking the investments
needed from the private sector to shift from the current
single-use models to reuse e.g. through a fund for
change within the EPR such as 5 per cent of the global
EPR fee, eco-modulation with specific one shot bonus to
help brand owners to shift from single use to reusable
products and standards to scale up the reuse and refill
systems. Policies, which also encourage consumers’
behaviour change and increase the demand for reuse,
are a key driver of increased investment in reuse models
since 2015.
Funds raised for reuse schemes between 2015 and 2021
are estimated over USD 1 billion, mostly in the United
States of America, Canada and Europe (where the 2019
directive on single use plastic products has created
the ground for the development of new reuse models).
Policies and incentives will be crucial to unlock financing
in emerging countries and for novel reuse models (World
Economic Forum [WEF] 2022).
When only a few front-running countries/value chains
incentivise reuse, economies of scale are not achieved,
and businesses may have to multiply their delivery
systems to accommodate reuse and disposable systems.
In the extreme this may even result in systems being
incompatible at two ends of the same business, such as
with the aviation industry, confronted with reuse systems
being favoured in one end of the journey and illegal at the
other end (International Civil Aviation Organization [ICAO]
2022). Specifically, reuse systems require the following
elements to run effectively: collection points, return
incentives (to ensure high enough return rates), reverse
logistics (including washing and sanitation), labelling and
communication, consumer awareness, among others.
Like with all transitions, it is crucial to assess and address
any potential negative trade-offs from the market shift to
reuse e.g. on vulnerable groups (such as waste pickers
currently living off streams of single-use plastic products)
or gender impacts e.g. because women are often central
in managing plastic in terms of domestic purchasing
decisions, recycling and disposing (UNEP 2021a).
Overall, improving the economics of reuse requires
addressing the tensions between the economic actors
that may perceive themselves as ‘winning’ or ‘losing’ with
the transition (Table 4).
21](https://image.slidesharecdn.com/howtheworldcanendplasticpollutionandcreateacirculareconomy-230601004717-772ebcb4/75/How-the-world-can-end-plastic-pollution-and-create-a-circular-economy-39-2048.jpg)

![An estimated 12.5 MMt of plastic products are used
annually in plant and animal production, and plastic use in
greenhouses, mulching etc. is projected to increase 50 per
cent by 2030 (FAO 2021). For both agricultural and fishing
plastics, upstream measures spanning plastic reduction,
waste collection, recycling and pollution prevention are
likely to be more impactful, and require less labour and
capital investment, than remedial clean-up measures.
Industry-specific actions for source-reduction of fishing
related and agricultural plastic waste include (UNEP
2021d; EIA 2022a):
• Education and economic incentives (such as
Extended Producer Responsibility) supporting fishers
to maintain, repair and prevent loss of nets and gear
(International Union for the Conservation of Nature
[IUCN] 2022).
• Design standards and innovation for fishing gear with
lower loss rates.
• Standards and best practice frameworks for
managing fishing gear (Global Ghost Gear Initiative
2021), and the removal of regulatory barriers.
• Elimination of the most polluting plastic products in
agriculture, including plastic films, polymer coated
fertilisers, seeds and pesticides (FAO 2021; Center for
International Environmental Law [CIEL] 2022), putting
in place incentives for reusable plastics and transition
towards a regenerative agri-food system with fewer
material inputs.
• International voluntary code of conduct for
agricultural plastics.
• Collection and recycling of the remaining plastics.
Photo: Getty Images
40](https://image.slidesharecdn.com/howtheworldcanendplasticpollutionandcreateacirculareconomy-230601004717-772ebcb4/75/How-the-world-can-end-plastic-pollution-and-create-a-circular-economy-58-2048.jpg)

![Al-Sid-Cheikh, M., Rowland, S. J., Stevenson, K.,
Rouleau, C., Henry, T. B. and Thompson, R. C. (2018).
Uptake, Whole-Body Distribution, and Depuration
of Nanoplastics by the Scallop Pecten maximus at
Environmentally Realistic Concentrations. Environmental
Science and Technology 52(24), 14480–14486. https://
doi.org/10.1021/acs.est.8b05266.
Aurisano, N., Huang, L., Milà i Canals, L., Jolliet, O.
and Fantke, P. (2021). Chemicals of concern in plastic
toys. Environment International 146, 106194. https://doi.
org/10.1016/j.envint.2020.106194.
Australian Government. (2021). National Plastics
Plan 2021. Department of Agriculture, Water and the
Environment. https://www.agriculture.gov.au/sites/
default/files/documents/national-plastics-plan-2021.pdf.
Barnes, S.J. 2019. Out of sight, out of mind: Plastic waste
exports, psychological distance and consumer plastic
purchasing. Global Environmental Change 58, 101943.
https://doi.org/10.1016/j.gloenvcha.2019.101943.
Belgian Government. (2021). Nationaal Plan Voor Herstel
En Veerkracht België. Cabinet of the State Secretary for
Recovery and Strategic Investments, responsible for
Science Policy. https://dermine.belgium.be/sites/default/
files/articles/NL%20-%20Nationaal%20plan%20voor%20
herstel%20een%20veerkracht_1.pdf.
Bond, K., Benham, H., Vaughan, E. and Chau, L. (2020).
The Future’s Not in Plastics - Why Plastics demand won’t
rescue the oil sector. Carbon Tracker Initiative. https://
carbontracker.org/reports/the-futures-not-in-plastics.
Borg, K., Curtis, J. and Lindsay, J. (2020). Social norms
and plastic avoidance: Testing the theory of normative
social behaviour on an environmental behaviour. Journal
of Consumer Behaviour 19(6), 594-607.
Bouwmeester, H., Hollman, P. C. H. and Peters, R. J. B.
(2015). Potential Health Impact of Environmentally
Released Micro- and Nanoplastics in the Human Food
Production Chain: Experiences from Nanotoxicology.
Environmental Science and Technology 49(15), 8932–
8947. https://doi.org/10.1021/acs.est.5b01090.
Braun, T., Ehrlich, L., Henrich, W., Koeppel, S., Lomako,
I., Schwabl, P. et al. (2021). Detection of Microplastic
in Human Placenta and Meconium in a Clinical Setting.
Pharmaceutics 13(7), 921. https://doi.org/10.3390/
pharmaceutics13070921.
Breivik, K., Gioia, R., Chakraborty, P., Zhang, G. and
Jones, K. C. (2011). Are Reductions in Industrial Organic
Contaminants Emissions in Rich Countries Achieved Partly
by Export of Toxic Wastes? Environmental Science and
Technology 45(21), 9154–9160. https://doi.org/10.1021/
es202320c.
California State. (2020). AB-2287 Solid waste. An act to
amend Sections 42005.5, 42356, 42357, 42649.1, 42649.2,
42649.8, and 42649.81 of the Public Resources Code,
relating to solid waste. https://leginfo.legislature.ca.gov/
faces/billTextClient.xhtml?bill_id=201920200AB2287.
California State. (2022). AB-2787 Microplastics
in products. https://leginfo.legislature.
ca.gov/faces/billCompareClient.xhtml?bill_
id=202120220AB2787&showamends=false.
CDP. https://www.cdp.net/en/plastics.
Center for International Environmental Law (CIEL).
(2022). Sowing a Plastic Planet: How Microplastics
in Agrochemicals Are Affecting Our Soils, Our Food,
and Our Future. https://www.ciel.org/wp-content/
uploads/2022/12/Sowing-a-Plastic-Planet_1dec22.pdf.
Circular for Resource and Waste Professionals
[CIRCULAR]. (2020, October 22). Designing a ‘world-
leading’ deposit return scheme. Circular Online. https://
www.circularonline.co.uk/opinions/designing-a-world-
leading-deposit-return-scheme/.
Closed Loop Partners. (2021). Transitioning to a Circular
System for Plastics: Assessing Molecular Recycling
Technologies in the United States and Canada. Center for
the Circular Economy. https://www.closedlooppartners.
com/research/transitioning-to-a-circular-system-for-
plastics-assessing-molecular-recycling-technologies-in-
the-united-states-and-canada-2/.
Consumer Goods Forum. (2020). Building a Circular
Economy for Packaging: A View from the Consumer
Goods Industry on Optimal Extended Producer
Responsibility. https://www.theconsumergoodsforum.
com/environmental-sustainability/plastic-waste/.
Consumer Goods Forum. (2022). Guiding Principles
for the Ecomodulation of EPR Fees for Packaging.
https://www.theconsumergoodsforum.com/wp-
content/uploads/2022/02/Guiding-Principles-for-the-
Ecomodulation-of-EPR-Fees-February-2022.pdf.
Consumer Goods Forum’s Plastic Waste Coalition
of Action. (2021). The Golden Design Rules. https://
www.theconsumergoodsforum.com/wp-content/
uploads/2022/03/CGF-PWCoA_Golden-Design-Rules-Fact-
Pack-March-2022.pdf.
Deloitte. (2019). The price tag of plastic pollution: An
economic assessment of river plastic. Deloitte The
Netherlands. https://www2.deloitte.com/content/dam/
Deloitte/nl/Documents/strategy-analytics-and-ma/
deloitte-nl-strategy-analytics-and-ma-the-price-tag-of-
plastic-pollution.pdf.
Diana, Z., Vegh, T., Karasik, R., Bering, J., D. Llano
Caldas, J., Pickle, A. et al. (2022). The evolving global
plastics policy landscape: An inventory and effectiveness
review. Environmental Science and Policy 134, 34–45.
https://doi.org/10.1016/j.envsci.2022.03.028.
63](https://image.slidesharecdn.com/howtheworldcanendplasticpollutionandcreateacirculareconomy-230601004717-772ebcb4/75/How-the-world-can-end-plastic-pollution-and-create-a-circular-economy-81-2048.jpg)
![Duncan, E. M., Broderick, A. C., Fuller, W. J., Galloway, T.
S., Godfrey, M. H., Hamann, M. et al. (2018). Microplastic
ingestion ubiquitous in marine turtles. Global Change
Biology 25(2), 744–752. https://doi.org/10.1111/
gcb.14519.
Economist Impact. (2023). Peak Plastics: Bending the
Consumption Curve. Evaluating the effectiveness of policy
mechanisms to reduce plastic use.
Ellen MacArthur Foundation [EMF], World Economic
Forum and McKinsey & Company. (2016). The New
Plastics Economy: Rethinking the future of plastics.
https://ellenmacarthurfoundation.org/the-new-plastics-
economy-rethinking-the-future-of-plastics.
Ellen MacArthur Foundation [EMF]. (2020). New Plastics
Economy Global Commitment: Commitments, Vision and
Definitions. https://emf.thirdlight.com/link/pq2algvgnv1n-
uitck8/@/preview/1?o.%20Note:%20criteria%20
originally%20crafted%20to%20refer%20to%20plastic%20
packaging.
Ellen MacArthur Foundation [EMF]. (2021). Extended
Producer Responsibility: A necessary part of the solution
to packaging waste and pollution. https://emf.thirdlight.
com/link/cp8djae8ittk-xo55up/@/preview/1.
Ellen MacArthur Foundation [EMF]. (2023). https://
ellenmacarthurfoundation.org/topics/plastics/overview.
Ellen MacArthur Foundation [EMF]. (2019). Reuse
- Rethinking Packaging; https://emf.thirdlight.com/
file/24/_A-BkCs_aXeX02_Am1z_J7vzLt/Reuse%20
%E2%80%93%20rethinking%20packaging.pdf.
Environmental Investigation Agency [EIA]. (2022a).
Convention on Plastic Pollution Essential Elements:
Fishing Gear. https://eia-international.org/wp-content/
uploads/Essential-Elements-Fishing-Gear.pdf.
Environmental Investigation Agency [EIA]. (2022b).
Convention on Plastic Pollution Essential Elements. In
Reporting and Monitoring. https://eia-international.org/wp-
content/uploads/2022-Convention-on-Plastic-Pollution-
Essential-Elements-Reporting-and-Monitoring_SINGLE-
PAGES.pdf.
Environmental Justice Foundation. (2021). Net Free Seas
Handbook 2021. https://ejfoundation.org/resources/
downloads/2021-Net-Free-handbook-EN-lowres.pdf.
European Commission [COMM]. (2018a). Report from the
Commission to the European Parliament and the Council
on the impact of the use of oxo-degradable plastic,
including oxo-degradable plastic carrier bags, on the
environment. https://ec.europa.eu/environment/circular-
economy/pdf/oxo-plastics.pdf.
European Commission [COMM]. (2018b). A European
Strategy for Plastics in a Circular Economy. https://www.
europarc.org/wp-content/uploads/2018/01/Eu-plastics-
strategy-brochure.pdf.
European Commission [COMM]. (2022). Commission
Staff Working Document. In Restrictions Roadmap
Under the Chemicals Strategy for Sustainability. https://
ec.europa.eu/docsroom/documents/49734.
European Investment Bank [EIB]. (2023). Cutting
plastics pollution — Financial measures for a more
circular value chain. https://www.eib.org/attachments/
lucalli/20220248_cutting_plastics_pollution_en.pdf.
European Union [EU]. (1999). Council Directive 1999/31/
EC of 26 April 1999 on the landfill of waste. http://data.
europa.eu/eli/dir/1999/31/2018-07-04.
European Union [EU]. (2019). Directive (EU) 2019/904 of
the European parliament and of the council of 5 June 2019
on the reduction of the impact of certain plastic products
on the environment. Official Journal of the European
Union. https://eur-lex.europa.eu/eli/dir/2019/904/oj.
European Union [EU]. (2020). REGULATION (EU) 2020/740
of the European Parliament and of the Council of 25
May 2020 on the labelling of tyres with respect to fuel
efficiency and other parameters, amending Regulation
(EU) 2017/1369 and repealing Regulation (EC) No
1222/2009. Official Journal of the European Union. https://
eur-lex.europa.eu/eli/reg/2020/740/oj.
Expra. https://www.expra.eu.
Fantke, P., Ernstoff, A. S., Huang, L., Csiszar, S. A. and
Jolliet, O. (2016). Coupled near-field and far-field exposure
assessment framework for chemicals in consumer
products. Environment International 94, 508–518. https://
doi.org/10.1016/j.envint.2016.06.010.
Food and Agriculture Organization of the United States
[FAO]. (2021). Assessment of agricultural plastics and
their sustainability: A call for action. Policy Support and
Governance Gateway. https://doi.org/10.4060/cb7856en.
Garcia-Gutierrez, P., Amadei, A.M., Klenert, D., Nessi,
S., Tonini, D., Tosches, D. et al. (2023). Environmental
and economic assessment of plastic waste recycling A
comparison of mechanical, physical, chemical recycling
and energy recovery of plastic waste, Publications Office
of the European Union, Luxembourg, 2023, https://doi.
org/10.2760/0472. JRC132067.
Garnett, K. and Van Calster, G. (2021). The Concept of
Essential Use: A Novel Approach to Regulating Chemicals
in the European Union. Transnational Environmental
Law 10(1), 159–187. https://doi.org/10.1017/
s2047102521000042.
Gaveau, D. L., Locatelli, B., Salim, M. A., Yaen, H.,
Pacheco, P. and Sheil, D. (2018). Rise and fall of forest
loss and industrial plantations in Borneo (2000–2017).
Conservation Letters 12(3). https://doi.org/10.1111/
conl.12622.
GESAMP. (2019). Guidelines or the monitoring and
assessment of plastic litter and microplastics in the ocean
64](https://image.slidesharecdn.com/howtheworldcanendplasticpollutionandcreateacirculareconomy-230601004717-772ebcb4/75/How-the-world-can-end-plastic-pollution-and-create-a-circular-economy-82-2048.jpg)
![(Kershaw P.J., Turra A. and Galgani F. editors), (IMO/FAO/
UNESCO-IOC/UNIDO/WMO/IAEA/UN/UNEP/UNDP/ISA
Joint Group of Experts on the Scientific Aspects of Marine
Environmental Protection). Rep. Stud. GESAMP No. 99,
130p. (ISSN: 1020-4873). United Nations Environment
Programme (UNEP). http://www.gesamp.org/site/assets/
files/2002/rs99e.pdf.
Geyer, R., Jambeck, J. R. and Law, K. L. (2017). Production,
use, and fate of all plastics ever made. Science Advances
3(7). https://doi.org/10.1126/sciadv.1700782.
GIZ-LafargeHolcim. (2020). Guidelines on Pre- and Co-
processing of Waste in Cement Production – Use of waste
as alternative fuel and raw material. https://www.giz.de/en/
downloads/giz-2020_en_guidelines-pre-coprocessing.pdf.
GIZ. (2010). The Waste Experts: Enabling Conditions for
Informal Sector Integration in Solid Waste Management:
Lessons learned from Brazil, Egypt and India. https://
www.slideshare.net/ACORNInternational/informal-sector-
entwurf-100312.
Global Ghost Gear Initiative. (2021). Best Practice
Framework for the Management of Fishing Gear:
June 2021 Update. Prepared by Huntington, T. of
Poseidon Aquatic Resources Management Ltd. Page
94 and appendices. https://static1.squarespace.com/
static/5b987b8689c172e29293593f/t/6377ce76417732
58453cb834/1668796037597/GGGI+Best+Practice+Fra
mework+for+the+Management+of+Fishing+Gear+%28C-
BPF%29+2021+Update+-+FINAL.pdf.
Global Plastics Policy Centre. (2022). A global review of
plastics policies to support improved decision making
and public accountability. March, A., Salam, S., Evans, T.,
Hilton, J., and Fletcher, S. Revolution Plastics, University of
Portsmouth. https://plasticspolicy.port.ac.uk/wp-content/
uploads/2022/10/GPPC-Report.pdf.
Government of France. (2021). LOI n° 2020-105 du 10
février 2020 relative à la lutte contre le gaspillage et à
l’économie circulaire. https://www.legifrance.gouv.fr/loda/
id/JORFTEXT000041553759/.
Government of India. (2023). https://www.india.gov.in/
spotlight/group-twenty-g20.
Guo, W., Xi, B., Huang, C., Li, J., Tang, Z., Li, W. et al.
(2021). Solid waste management in China: Policy and
driving factors in 2004–2019. Resources, Conservation
and Recycling 173, 105727. https://doi.org/10.1016/j.
resconrec.2021.105727.
Harris, P.T., Maes, T., Raubenheimer, K. and Walsh, J.P.
(2023). A marine plastic cloud - Global mass balance
assessment of oceanic plastic pollution. Continental
Shelf Research 255 (2023). https://doi.org/10.1016/j.
csr.2023.104947.
Hennøen, H.C. (2016). A material flow analysis of
recycling of gillnets from Norwegian fisheries.
Horvatits, T., Tamminga, M., Liu, B., Sebode, M.,
Carambia, A., Fischer, L. et al. (2022). Microplastics
detected in cirrhotic liver tissue. EBioMedicine 82, 104147.
https://doi.org/10.1016/j.ebiom.2022.104147.
International Civil Aviation Organisation [ICAO]. (2022).
A41-WP/71. Improving Cabin Waste Reuse and Recycling
Performance. https://www.icao.int/Meetings/a41/
Documents/WP/wp_071_en.pdf.
International Environmental Technology Centre [IETC]
(2015). Gender and Waste Management. Did you know…?
https://www.ctc-n.org/sites/www.ctc-n.org/files/
resources/gender_and_waste_management.pdf.
International Environmental Technology Centre [IETC]
& GRID-Arendal. (2019). Gender and waste nexus:
experiences from Bhutan, Mongolia and Nepal. https://
wedocs.unep.org/bitstream/handle/20.500.11822/29821/
GaWN.pdf?sequence=1&isAllowed=y.
International Labour Organization [ILO]. (1990).
Chemicals Convention (No. 170). https://www.ilo.org/dyn/
normlex/en/f?p=NORMLEXPUB:12100:0::NO::P12100_
INSTRUMENT_ID:312315.
International Labour Organization [ILO]. (2015). https://
www.ilo.org/wcmsp5/groups/public/@ed_emp/@emp_
ent/documents/publication/wcms_432859.pdf.
International Labour Organization [ILO]. (2022). Just
Transition Policy Brief. https://www.ilo.org/wcmsp5/
groups/public/---ed_emp/---emp_ent/documents/
publication/wcms_860569.pdf.
International Organization for Standardization [ISO].
(2013). ISO 18603:2013 Packaging and the environment
— Reuse
International Resource Panel [IRP]. (2018). Re-defining
Value – The Manufacturing Revolution. Remanufacturing,
Refurbishment, Repair and Direct Reuse in the Circular
Economy. A Report of the International Resource Panel.
United Nations Environment Programme, Nairobi, Kenya.
https://www.resourcepanel.org/reports/re-defining-value-
manufacturing-revolution.
International Resource Panel [IRP]. (2021). Policy options
to eliminate additional marine plastic litter: By 2050
under the G20 Osaka Blue Ocean Vision. United Nations
Environment Programme. https://wedocs.unep.org/
bitstream/handle/20.500.11822/36440/POEAMPL.pdf.
International Union for Conservation of Nature [IUCN].
(2022, June 27). Position paper: Advocating Extended
Producer Responsibility for fishing gear. https://www.
iucn.org/news/marine-and-polar/202110/position-paper-
advocating-extended-producer-responsibility-fishing-gear.
Jambeck J.R., Geyer R., Wilcox C., Siegler T.R., Perryman
M., Andrady A. et al. (2015). Plastic waste inputs from
land into the ocean. Science 347 (6223), 768-771. http://
doi.org/10.1126/science.1260352.
65](https://image.slidesharecdn.com/howtheworldcanendplasticpollutionandcreateacirculareconomy-230601004717-772ebcb4/75/How-the-world-can-end-plastic-pollution-and-create-a-circular-economy-83-2048.jpg)
![Jaramillo, P., Kahn Ribeiro, S., Newman, P., Dhar,
S., Diemuodeke, O.E., Kajino, T. et al. (2022) In IPCC
2022: Climate Change 2022: Mitigation of Climate
Change. Contribution of Working Group III to the Sixth
Assessment Report of the Intergovernmental Panel on
Climate Change [P.R. Shukla, J. Skea, R. Slade, A. Al
Khourdajie, R. van Diemen, D. McCollum, M. Pathak, S.
Some, P. Vyas, R. Fradera, M. Belkacemi, A. Hasija, G.
Lisboa, S. Luz, J. Malley, (eds.)]. Cambridge University
Press, Cambridge, UK and New York, NY, USA. https://doi.
org/10.1017/9781009157926.012.
Jenner, L. C., Rotchell, J. M., Bennett, R. J., Cowen, M.
E., Tentzeris, V. and Sadofsky, L. R. (2022). Detection
of microplastics in human lung tissue using μFTIR
spectroscopy. Science of the Total Environment 831,
154907. https://doi.org/10.1016/j.scitotenv.2022.154907.
Karstensen, K.H., Saha, P.K., Vigerust, E., Paulsen, A.A.,
Engelsen, C.J. and Ahmadi, M. (2020). ‘Ocean plastic:
an opportunity in the circular economy?’: International
Cement Review, October.
Kaza, S., Yao, L., Bhada-Tata, P. and Woerden, F. van.
(2018). What a Waste 2.0: What a Waste 2.0 (Urban
Development). The World Bank. https://openknowledge.
worldbank.org/handle/10986/30317.
Knott, B. C., Erickson, E., Allen, M. D., Gado, J. E.,
Graham, R., Kearns, F. L. et al. (2020). Characterization
and engineering of a two-enzyme system for plastics
depolymerization. Proceedings of the National Academy
of Sciences 117(41), 25476–25485. https://doi.
org/10.1073/pnas.2006753117.
Lammel, G., Heil, A., Stemmler, I., Dvorská, A. and
Klánová, J. (2013). On the Contribution of Biomass Burning
to POPs (PAHs and PCDDs) in Air in Africa. Environmental
Science and Technology 47(20), 11616–11624.
Landrigan, P.J., Raps, H., Cropper, M., Bald, C., Brunner,
M., Canonizado, E.M. et al. (2023). The Minderoo-Monaco
Commission on Plastics and Human Health. Annals of
Global Health 89:3.
Lau, W. W. Y., Shiran, Y., Bailey, R. M., Cook, E., Stuchtey,
M. R., Koskella, J. et al. (2020). Evaluating scenarios
toward zero plastic pollution. Science 369(6510),
1455‑1461. https://doi.org/10.1126/science.aba9475.
Law, K. L., Starr, N., Siegler, T. R., Jambeck, J. R., Mallos,
N. J. and Leonard, G. H. (2020). The United States’
contribution of plastic waste to land and ocean. Science
advances 6(44). https://www.science.org/doi/10.1126/
sciadv.abd0288.
Li, W. C., Tse, H. F. and Fok, L. (2016). Plastic waste in the
marine environment: A review of sources, occurrence and
effects. Science of the Total Environment 566, 333-349.
March, A., Salam, S., Evans, T., Hilton, J. and Fletcher, S.
(2022). A global review of plastics policies to support
improved decision making and public accountability.
Global Plastics Policy Centre. University of Portsmouth.
Martinez-Sanchez, V., Levis, J. W., Damgaard, A.,
DeCarolis, J. F., Barlaz, M. A. and Astrup, T. F. (2017).
Evaluation of externality costs in life-cycle optimization
of municipal solid waste management systems.
Environmental Science Technology 51, 3119–3127.
https://doi.org/10.1021/acs.est.6b06125.
Martinho, G., Balaia, N. and Pires, A. (2017). The
Portuguese plastic carrier bag tax: The effects on
consumers’ behaviour. Waste management 61, 3-12.
Meadows, D. (1999). Leverage points: Places to intervene
in a system. https://donellameadows.org/wp-content/
userfiles/Leverage_Points.pdf.
Meijer, L. J. J., van Emmerik, T., van der Ent, R., Schmidt,
C. and Lebreton, L. (2022). More than 1000 rivers account
for 80% of global riverine plastic emissions into the ocean.
Science Advances 7(18). https://doi.org/10.1126/sciadv.
aaz5803.
Merkl, A. and Charles, D. (2022). The Price of Plastic
Pollution: Social Costs and Corporate Liabilities, Minderoo
Foundation.
Ministry of Environment Japan. (2020). Guidelines for
harmonizing ocean surface microplastic monitoring
methods. https://www.env.go.jp/content/900453438.pdf.
Mogomotsi, P. K., Mogomotsi, G. E. and Phonchi, N. D.
(2018). Plastic bag usage in a taxed environment:
Investigation on the deterrent nature of plastic levy in
Maun, Botswana. Waste Management and Research 37(1),
20–25. https://doi.org/10.1177/0734242x18801495.
Nyberg B., Harris P. T., Kane I. and Maes, T. (2023).
Leaving a plastic legacy: Current and future scenarios
for mismanaged plastic waste in rivers. Science of The
Total Environment 869, 161821. https://doi.org/10.1016/j.
scitotenv.2023.161821.
Organization for Economic Cooperation and Development
[OECD]. (2020), Gender-specific consumption patterns,
behavioural insights, and circular economy. https://www.
oecd.org/env/GFE-Gender-Issues-Note-Session-5.pdf.
Organization for Economic Cooperation and Development
[OECD]. (2022a). Deposit refund schemes. https://
www.oecd.org/stories/ocean/deposit-refund-schemes-
58baff8c/.
Organization for Economic Cooperation and Development
[OECD]. (2022b). Global Plastics Outlook: Economic
Drivers, Environmental Impacts and Policy Options.
https://www.oecd-ilibrary.org/environment/global-plastics-
outlook_de747aef-en.
Organization for Economic Cooperation and Development
[OECD]. (2022c). Global Plastics Outlook: Policy Scenarios
66](https://image.slidesharecdn.com/howtheworldcanendplasticpollutionandcreateacirculareconomy-230601004717-772ebcb4/75/How-the-world-can-end-plastic-pollution-and-create-a-circular-economy-84-2048.jpg)
![to 2060. https://www.oecd.org/publications/global-
plastics-outlook-aa1edf33-en.htm.
The Pew Charitable Trusts and Systemiq. (2020).
Breaking the plastic wave: A comprehensive assessment
of pathways towards stopping plastic pollution. https://
www.systemiq.earth/breakingtheplasticwave/.
Philippines Government. (2019). The ecological solid
waste management act, RA9003 and the Philippine
action plan for sustainable consumption and production
(PAP4SCP). The National Economic and Development
Authority (NEDA). https://sdg.neda.gov.ph/philippine-
action-plan-for-sustainable-consumption-and-production-
pap4scp/.
Potočnik, J. and Teixeira, I. (2022). Making Climate
Targets Achievable: Improving Wellbeing through
Reduced Absolute Resource Use. An opinion piece of
the International Resource Panel Co-Chairs. https://
www.resourcepanel.org/reports/making-climate-targets-
achievable.
Ragusa, A., Svelato, A., Santacroce, C., Catalano, P.,
Sabbatini, S., Carnevali, O. et al. (2021). Plasticenta: First
evidence of microplastics in human placenta. Environment
International 146, 106274.
Royer, S-J., Ferrón, S., Wilson, S.T. and Karl, D.M. (2018)
Production of methane and ethylene from plastic in the
environment. PLoS ONE 13(8): e0200574. https://doi.
org/10.1371/journal.pone.0200574.
Science Advice for Policy by European Academies
[SAPEA]. (2019). A scientific perspective on microplastics
in nature and society. https://www.sapea.info/wp-content/
uploads/report.pdf.
Science Advice for Policy by European Academies
[SAPEA]. (2020). Biodegradability of plastics in the open
environment. https://sapea.info/topic/biodegradability-of-
plastics/.
Sharma, Aloysius and Visvanathan. (2019). Recovery of
plastics from dumpsites and landfills to prevent marine
plastic pollution in Thailand. Zhejiang University Press
Sherrington, C., Darrah, C., Hann, S., Cordle, M. and
Cole, G. (2016). Study to Support the Development of
Measures to Combat a Range of Marine Litter Sources:
Report for the European Commission’s DG Environment.
https://www.eunomia.co.uk/reports-tools/study-to-
support-the-development-of-measures-to-combat-a-
range-of-marine-litter-sources/.
Smeaton, C. (2021) Augmentation of global marine
sedimentary carbon storage in the age of plastic.
Limnology and Oceanography Letters 6(3). https://doi.
org/10.1002/lol2.10187.
Systemiq. (2021). Achieving circularity. In A Zero-waste
Circular Plastic Economy in Norway.
https://www.systemiq.earth/wp-content/
uploads/2021/06/AchievingCircularity-MainReport-
June2021.pdf.
Systemiq. (2022). Reshaping plastics. In Pathways to
a Circular, Climate Neutral System in Europe. https://
plasticseurope.org/reshaping-plastics/.
The European Chemicals Agency [ECHA]. (2020).
Chemical Recycling of Polymeric Materials from Waste in
the Circular Economy. ECHA/2020/571.
United Kingdom [UK]. (2021). Introduction of plastic
packaging tax from April 2022. Policy Paper. https://www.
gov.uk/government/publications/introduction-of-plastic-
packaging-tax-from-april-2022/introduction-of-plastic-
packaging-tax-2021.
United Kingdom [UK]. (2022). Microplastic filters (washing
machines) bill. Private Members’ Bill (under the Ten-
Minute Rule). https://bills.parliament.uk/bills/3077.
United Nations [UN]. (2021). Our Common Agenda –
Report of the Secretary-General. Published by the United
Nations New York, USA.
United Nations Entity for Gender Equality and the
Empowerment of Women [UN Women] and United Nations
Human Settlements Programme [UN-Habitat]. (2020).
Spotlight on Goal 11, Harsh Realities: Marginalised
Women in Cities of the Developing World. https://www.
unwomen.org/en/digital-library/publications/2020/02/
harsh-realities-marginalized-women-in-cities-of-the-
developing-world.
United Nations Environment Programme [UNEP]. (2015a).
Global Waste Management Outlook. Nairobi.
United Nations Environment Programme [UNEP]. (2015b).
Biodegradable Plastics & Marine Litter: Misconceptions,
Concerns and Impacts on Marine Environments. Nairobi.
United Nations Environment Programme [UNEP].
(2016). A framework for shaping sustainable
lifestyles: determinants and strategies. https://www.
oneplanetnetwork.org/sites/default/files/a_framework_
for_shaping_sustainable_lifestyles_determinants_and_
strategies_0.pdf.
United Nations Environment Programme [UNEP]. (2012).
Toolkit for Identification and Quantification of Releases
of Dioxins, Furans and Other Unintentional POPs
under Article 5 of the Stockholm Convention. Geneva,
Switzerland.
United Nations Environment Programme [UNEP]. (2016).
Fostering and communicating sustainable lifestyles.
https://www.oneplanetnetwork.org/sites/default/
files/20170209_un_communicating_sust_lifestyles_
fullreport_lores_2016.pdf.
67](https://image.slidesharecdn.com/howtheworldcanendplasticpollutionandcreateacirculareconomy-230601004717-772ebcb4/75/How-the-world-can-end-plastic-pollution-and-create-a-circular-economy-85-2048.jpg)
![United Nations Environment Programme [UNEP]. (2018).
Global Gender and Environment Outlook (GGEO). https://
www.unep.org/resources/report/global-gender-and-
environment-outlook-ggeo.
United Nations Environment Programme [UNEP]. (2019a).
Plastic’s toxic additives and the circular economy: The
role of the Basel and Stockholm Conventions. Addendum
Report on the activities of the Basel and Stockholm
conventions regional centres.
United Nations Environment Programme [UNEP]. (2019b).
Unwrapping the risks of plastic pollution to the insurance
industry. The First Global Insurance Industry Study on
Managing the Risks Associated With Plastic Pollution,
Marine Plastic Litter and Microplastics. https://www.unepfi.
org/psi/wp-content/uploads/2019/11/PSI-unwrapping-the-
risks-of-plastic-pollution-to-the-insurance-industry.pdf.
United Nations Environment Programme [UNEP]. (2019c).
Waste to energy. Considerations for Informed Decision-
making. https://www.unep.org/ietc/resources/publication/
waste-energy-considerations-informed-decision-making.
United Nations Environment Programme [UNEP].
(2020a). National guidance for plastic pollution
hotspotting and shaping action. https://wedocs.unep.
org/bitstream/handle/20.500.11822/33166/NGP.
pdf?sequence=1&isAllowed=y.
United Nations Environment Programme [UNEP]. (2020b).
Tackling plastic pollution. Legislative Guide for the
Regulation of Single-use Plastic Products. https://www.
unep.org/resources/toolkits-manuals-and-guides/tackling-
plastic-pollution-legislative-guide-regulation.
United Nations Environment Programme [UNEP]. (2021a).
Addressing Single-Use plastic products pollution using
a life cycle approach. https://www.unep.org/resources/
publication/addressing-single-use-plastic-products-
pollution-using-life-cycle-approach.
United Nations Environment Programme [UNEP]. (2021b).
Advancing the 10 objectives and guiding considerations
for green and sustainable chemistry. https://wedocs.unep.
org/bitstream/handle/20.500.11822/37340/AOGCGSC.
pdf?sequence=3&isAllowed=y.
United Nations Environment Programme [UNEP]. (2021c).
From pollution to solution: A global assessment of
marine litter and plastic pollution. https://www.unep.org/
resources/pollution-solution-global-assessment-marine-
litter-and-plastic-pollution.
United Nations Environment Programme [UNEP]. (2021d).
Plastics in agriculture: Sources and impacts - working
paper. https://wedocs.unep.org/20.500.11822/37681.
United Nations Environment Programme [UNEP]. (2022a).
UNEP/PP/INC.1/7. Plastics science. https://wedocs.
unep.org/bitstream/handle/20.500.11822/41263/Plastic_
Science_E.pdf.
United Nations Environment Programme [UNEP]. (2022b).
Green and Sustainable Chemistry. https://www.unep.org/
explore-topics/chemicals-waste/what-we-do/policy-and-
governance/green-and-sustainable-chemistry.
United Nations Environment Programme [UNEP]. (2023).
Chemicals in plastics: a technical report. United Nations
Environment Programme and Secretariat of the Basel,
Rotterdam and Stockholm Conventions. https://www.
unep.org/resources/report/chemicals-plastics-technical-
report.
United Nations Environment Programme [UNEP] and
Convention on Biological Diversity. (2016). Marine debris:
Understanding, preventing and mitigating significant
adverse impacts on marine and coastal biodiversity.
UNEP/CBD/SBSTTA/20/INF/9. https://www.cbd.int/kb/
record/meetingDocument/107999?Event=SBSTTA-20.
United Nations Environment Programme [UNEP] and
International Solid Waste Association [ISWA]. (2015).
Global Waste Management Outlook. https://www.unep.
org/resources/report/global-waste-management-outlook.
United Nations Human Settlements Programme [UN-
Habitat]. https://www.urbanagendaplatform.org/best-
practice/packaging-material-fees.
United Nations Human Settlements Programme [UN-
Habitat] and Norwegian Institute for Water Research
[NIVA]. (2022) Leaving no one behind. How a global
instrument to end plastic pollution can enable a just
transition for the people informally collecting and
recovering waste. https://unhabitat.org/leaving-no-one-
behind-how-a-global-instrument-to-end-plastic-pollution-
can-enable-a-just-transition.
United States Environmental Protection Agency [USEPA].
(2020). Best practices for solid waste management: A
guide for Decision-Makers in developing countries. Office
of Resource Conservation and Recovery. https://www.
epa.gov/sites/default/files/2020-10/documents/master_
swmg_10-20-20_0.pdf.
van Emmerik T., Mellink Y., Hauk R., Waldschläger K.
and Schreyers L. (2022). Rivers as plastic reservoirs.
Frontiers in Water 3, 786936. https://doi.org/10.3389/
frwa.2021.786936.
Walker, T. R. (2023) The Maldives Should Not Become the
World’s Garbage Dump by Importing Plastic Waste. SSRN
http://dx.doi.org/10.2139/ssrn.4332420.
Wang, C., Zhao, L., Lim, M. K., Chen, W. Q. and
Sutherland, J. W. (2020). Structure of the global plastic
waste trade network and the impact of China’s import Ban.
Resources, Conservation and Recycling 153, 104591.
Watkins, E., Schweitzer, J. P., Leinala, E. and Börkey, P.
(2019). Policy approaches to incentivise sustainable
plastic design. OECD Environment Working Papers.
https://doi.org/10.1787/233ac351-en.
68](https://image.slidesharecdn.com/howtheworldcanendplasticpollutionandcreateacirculareconomy-230601004717-772ebcb4/75/How-the-world-can-end-plastic-pollution-and-create-a-circular-economy-86-2048.jpg)
![Wiesinger, H., Wang, Z. and Hellweg, S. (2021). Deep Dive
into Plastic Monomers, Additives, and Processing Aids.
Environmental Science and Technology 55(13), 9339–
9351. https://doi.org/10.1021/acs.est.1c00976.
Williams, M., Gower, R. and Green, J. (2019). No time
to waste. Tackling the Plastic Pollution Crisis Before It’s
Too Late. Tearfund, Fauna and Flora International (FFI),
WasteAid and The Institute of Development Studies (IDS).
https://learn.tearfund.org/en/resources/policy-reports/no-
time-to-waste.
Willis, K., Maureaud, C., Wilcox, C. and Hardesty, B. D.
(2018). How successful are waste abatement campaigns
and government policies at reducing plastic waste into the
marine environment? Marine Policy 96, 243-249.
Wilts, H. (2016). Germany on the Road to a Circular
Economy. Friedrich Ebert Stiftung. https://library.fes.de/
pdf-files/wiso/12622.pdf.
World Animal Protection. (2014). Fishing’s phantom
menace: How ghost fishing gear is endangering our sea
life. https://www.worldanimalprotection.org/sites/default/
files/media/int_files/sea-change-campaign-tacklingghost-
fishing-gear_0.pdf.
World Bank Group [WBG]. (2021). Market study for the
Philippines: Plastics circularity opportunities and barriers.
East Asia and Pacific Region Marine Plastics Series. World
Bank, Washington, DC. © World Bank. http://hdl.handle.
net/10986/35295.
World Bank Group [WBG]. (2022)a. Where is the value in
the chain?: Pathways out of plastic pollution. Washington,
DC. ©World Bank. http://hdl.handle.net/10986/37285.
World Bank Group [WBG]. (2022b). Fiscal Year Data.
https://www.worldbank.org/en/about/annual-report/fiscal-
year-data.
World Business Council for Sustainable Development
[WBCSD]. (2022). SPHERE: The packaging sustainability
framework. https://www.wbcsd.org/contentwbc/
download/14021/202395/1.
World Economic Forum [WEF]. (2022). Unlocking
the Plastics Circular Economy: Case Studies on
Investment. World Economic Forum – GPAP. https://
www.thecirculateinitiative.org/_files/ugd/77554d_
e2bbec97047f40e5891d346a82d24fcc.pdf?index=true.
World Wide Fund for Nature [WWF]. (2000). Plastics:
The costs of society, the environment and the economy.
Dalberg Advisors. https://wwflac.awsassets.panda.org/
downloads/wwf_pctsee_report_english.pdf.
World Wide Fund for Nature [WWF]. (2020). Stop Ghost
Gear. The Most Deadly Form of Marine Plastic Debris.
https://files.worldwildlife.org/wwfcmsprod/files/
Publication/file/3c1g4qur2t_ADVOCACY_REPORT_singles.
pdf?_ga=2.216641302.1449930867.1665414123-
384548275.1665414122.
World Wide Fund for Nature [WWF]. (2022). Chemical
Recycling Implementation principles. https://www.
worldwildlife.org/publications/wwf-position-chemical-
recycling-implementation-principles.
WRAP. (2022). Modelling the impact of selling products
loose or in packaging. https://wrap.org.uk/resources/
report/helping-people-reduce-fresh-produce-waste.
Zhang, M., Buekens, A. and Li, X. (2017). Open burning
as a source of dioxins. Critical Reviews in Environmental
Science and Technology 47(8), 543-620. https://doi.org/10
.1080/10643389.2017.1320154.
Zhang, D., Huang, G., Xu, Y. and Gong, Q. (2015). Waste-
to-Energy in China: Key Challenges and Opportunities.
Energies 8(12), 14182–14196. https://doi.org/10.3390/
en81212422.
Zhang, D., Ling Ng, E., Hu, W., Wang, H., Galaviz, P., Hang,
H. et al. (2020). Plastic pollution in croplands threatens
long‐term food security, Global Change Biology 26(6),
3356–3367.
Zhang, T., Fiedler, H., Yu, G., Ochoa, G. S., Carroll, W.
F., Gullett, B. K. et al. (2011). Emissions of unintentional
persistent organic pollutants from open burning of
municipal solid waste from developing countries.
Chemosphere 84(7), 994–1001.
69](https://image.slidesharecdn.com/howtheworldcanendplasticpollutionandcreateacirculareconomy-230601004717-772ebcb4/75/How-the-world-can-end-plastic-pollution-and-create-a-circular-economy-87-2048.jpg)


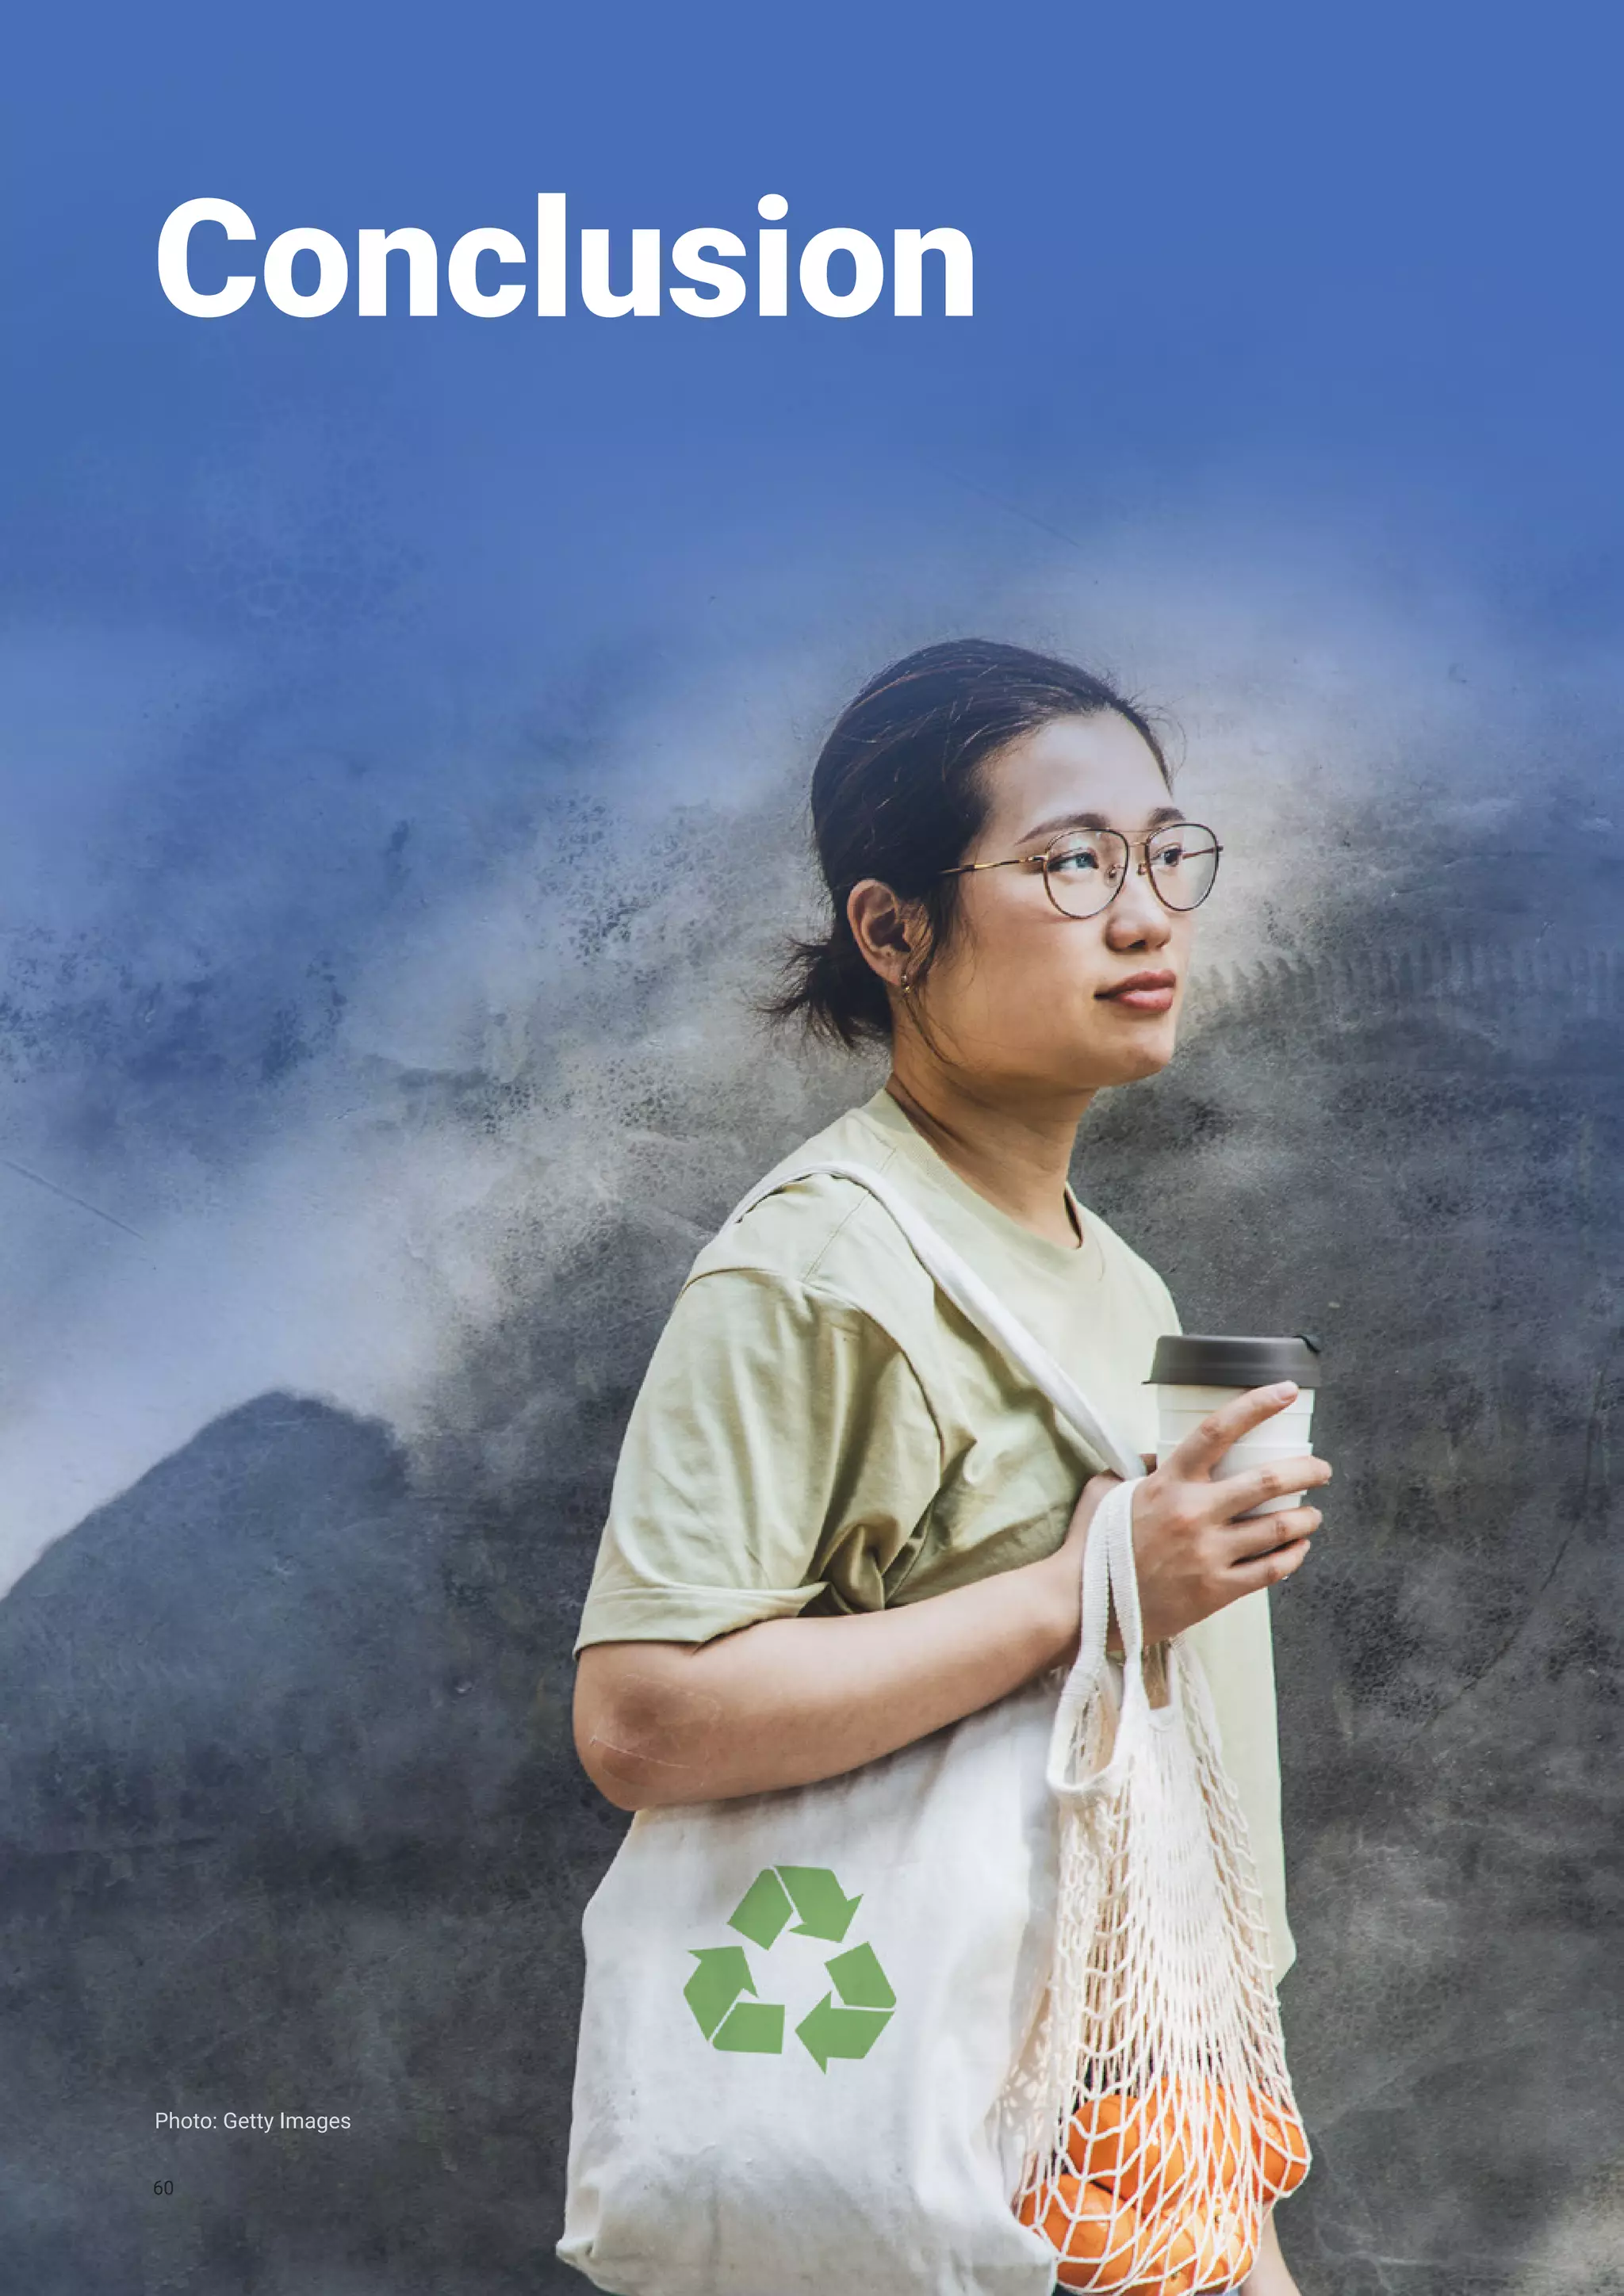
The document outlines strategies to combat plastic pollution and promote a circular economy, emphasizing the need for an international legally binding agreement following the United Nations Environment Assembly in 2022. It credits the contributions of various authors, institutions, and governments while providing a comprehensive glossary of terms related to plastic waste management and environmental sustainability. The publication serves as a resource for educational and non-profit purposes, encouraging responsible use and acknowledgment of its content.


![WED 2023 [Auto-saved] 2.pptx](https://cdn.slidesharecdn.com/ss_thumbnails/wed2023auto-saved2-230729054849-0611a6c7-thumbnail.jpg?width=640&height=640&fit=bounds)


