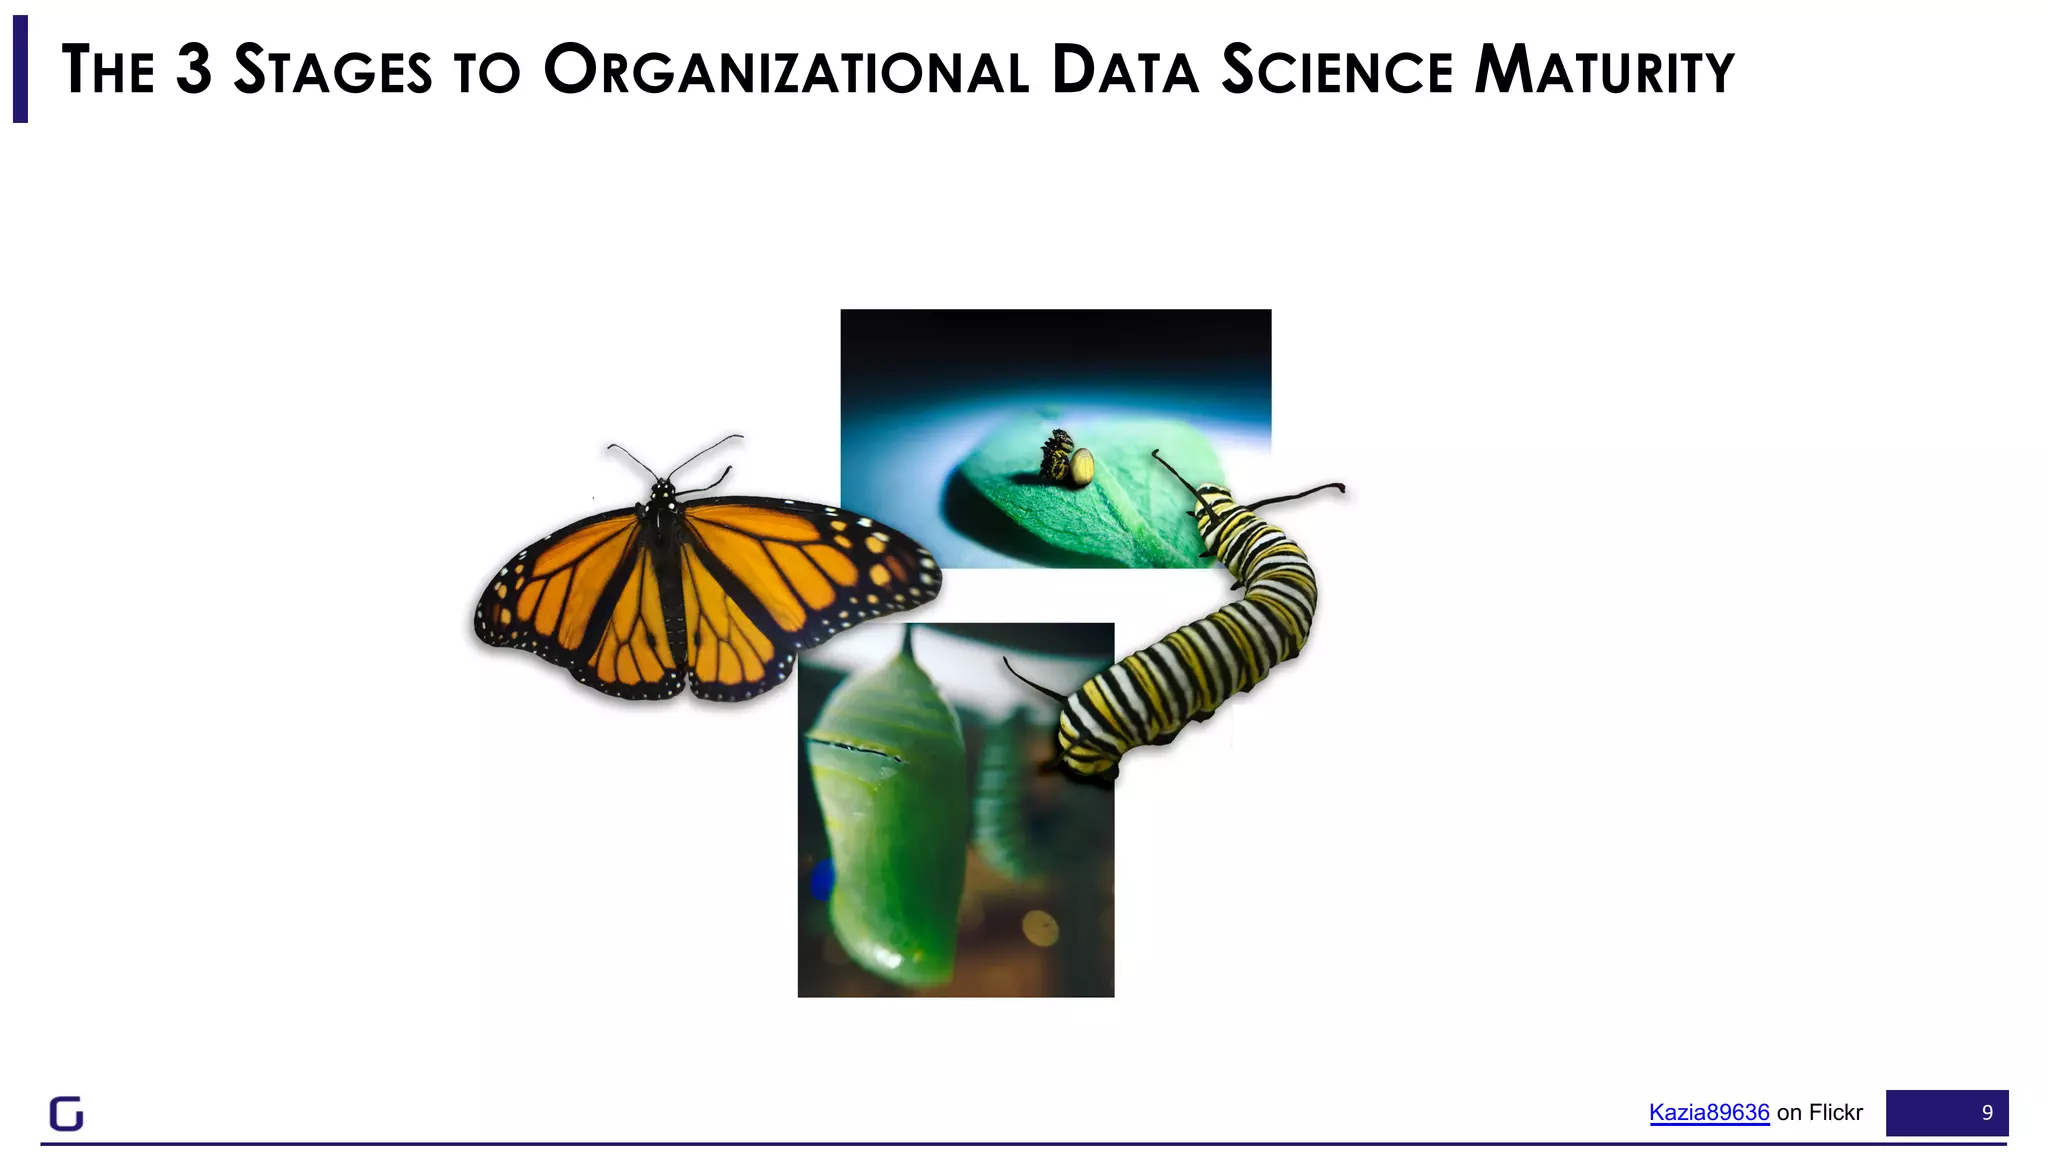
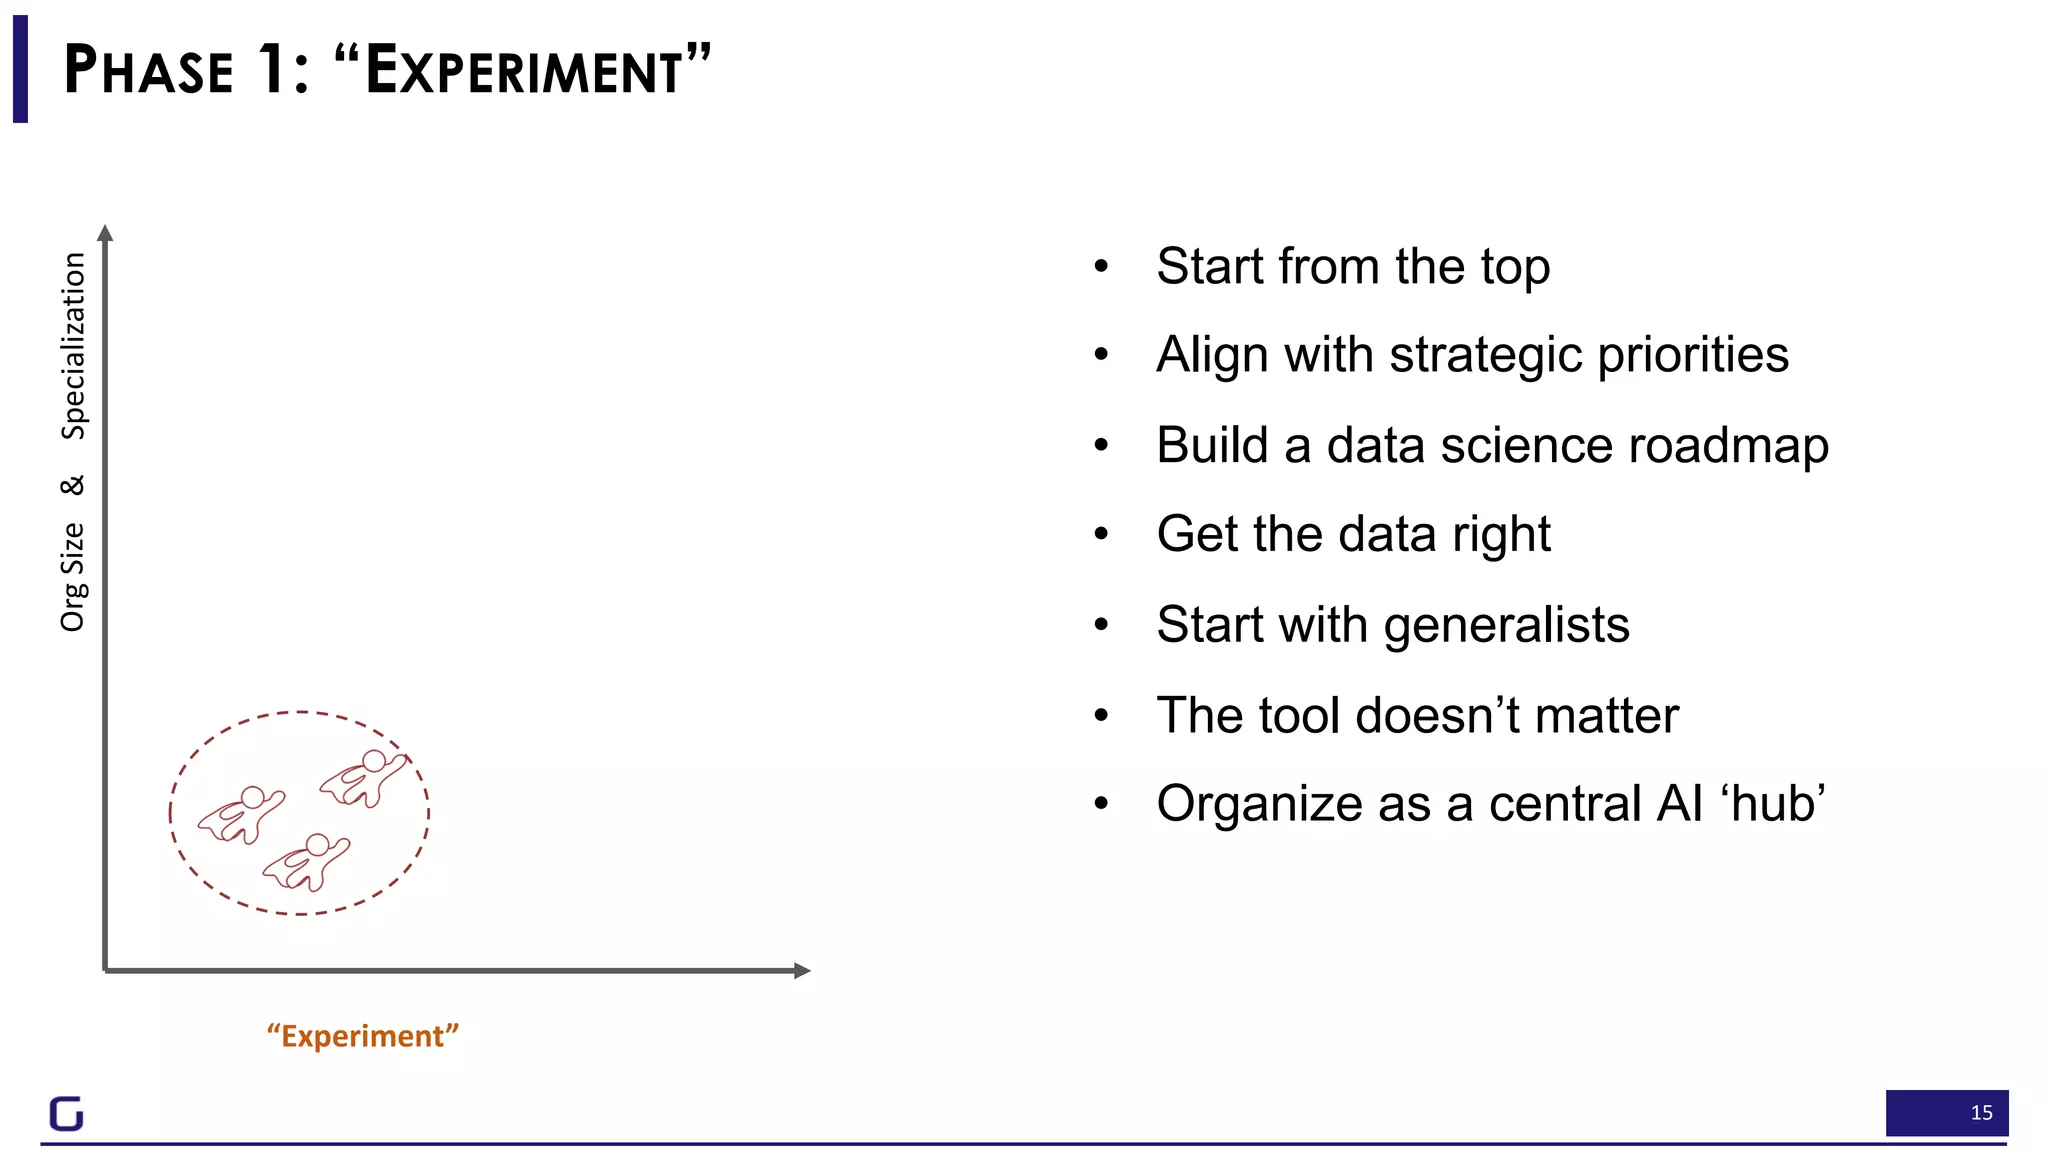
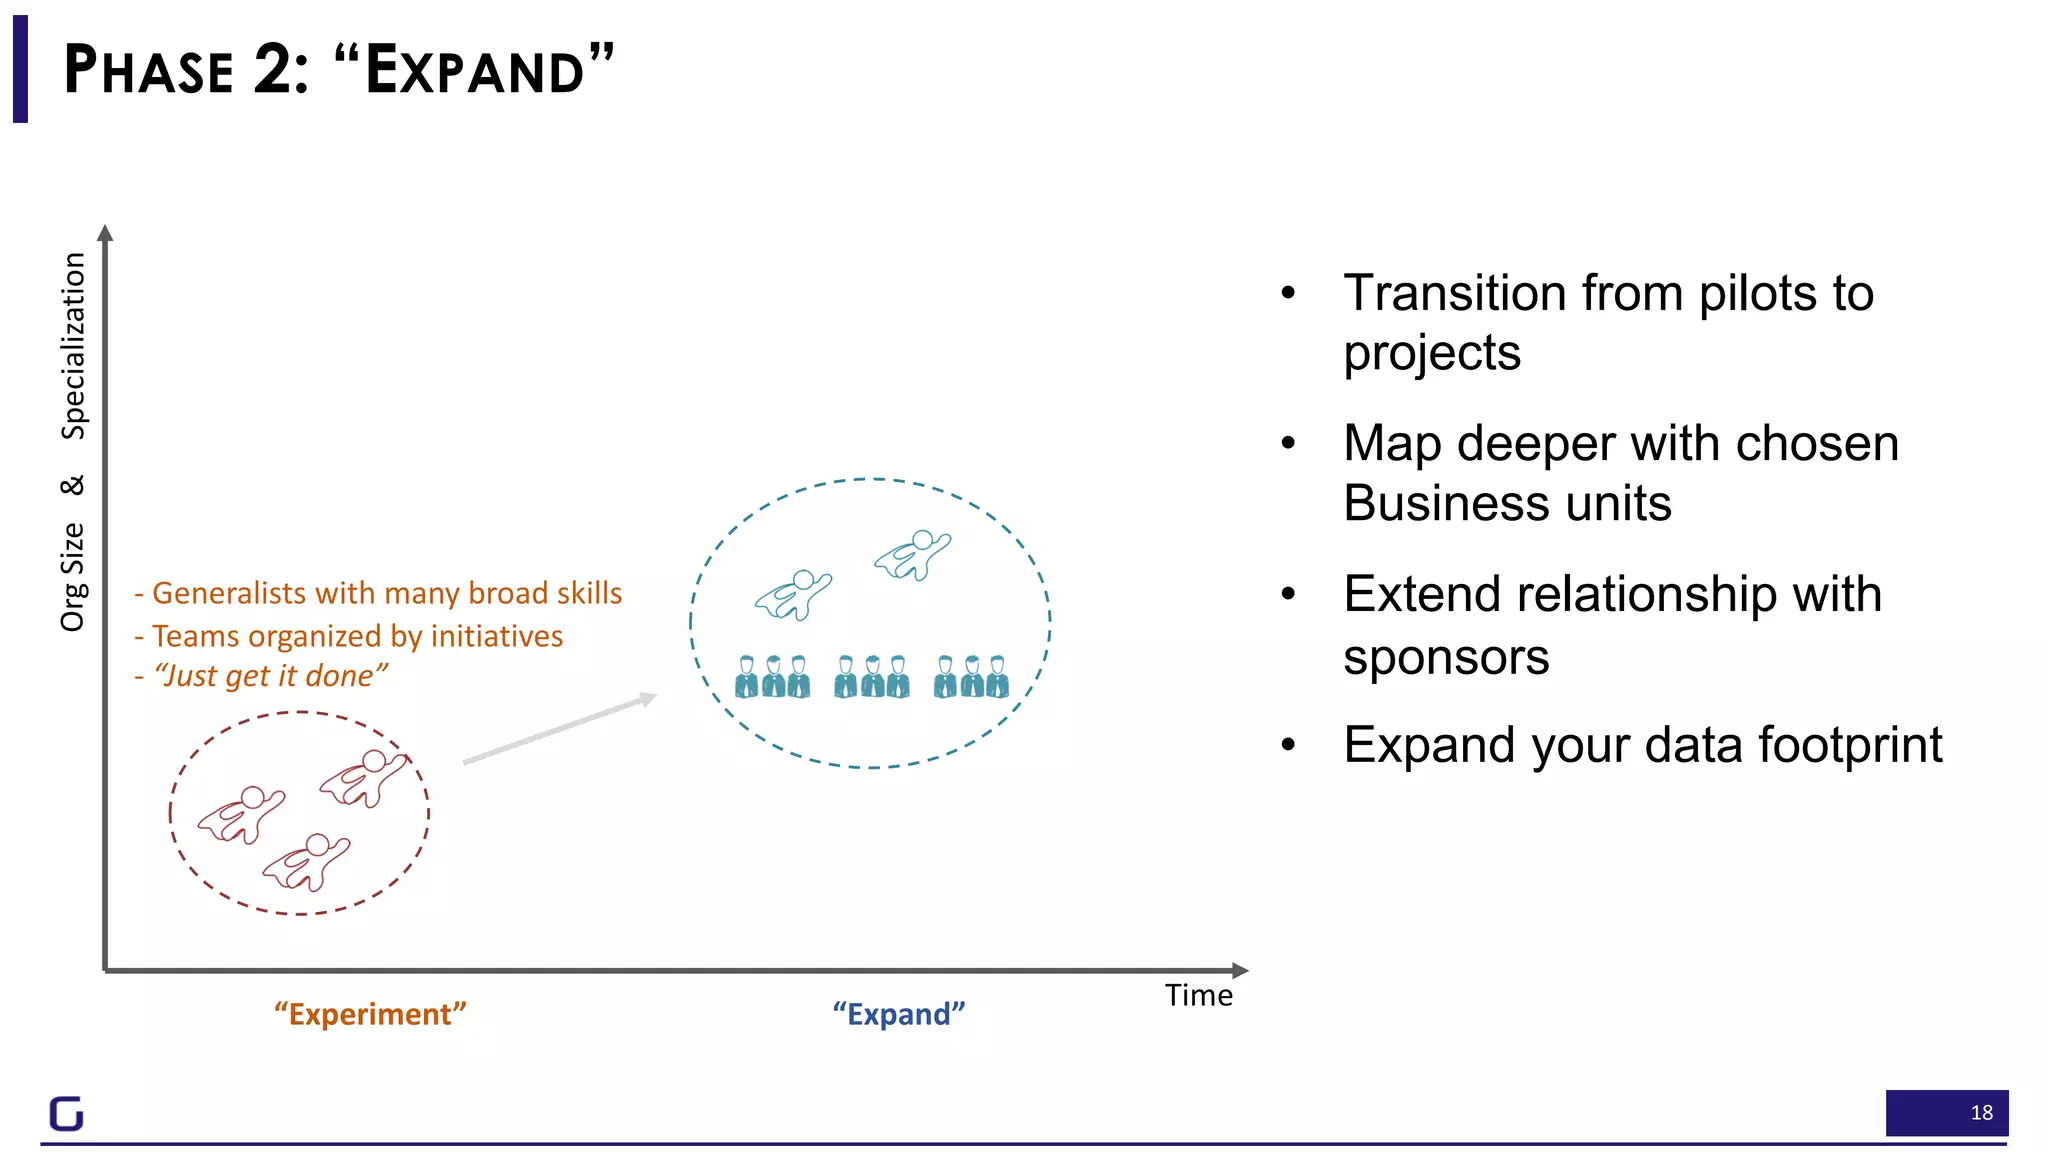
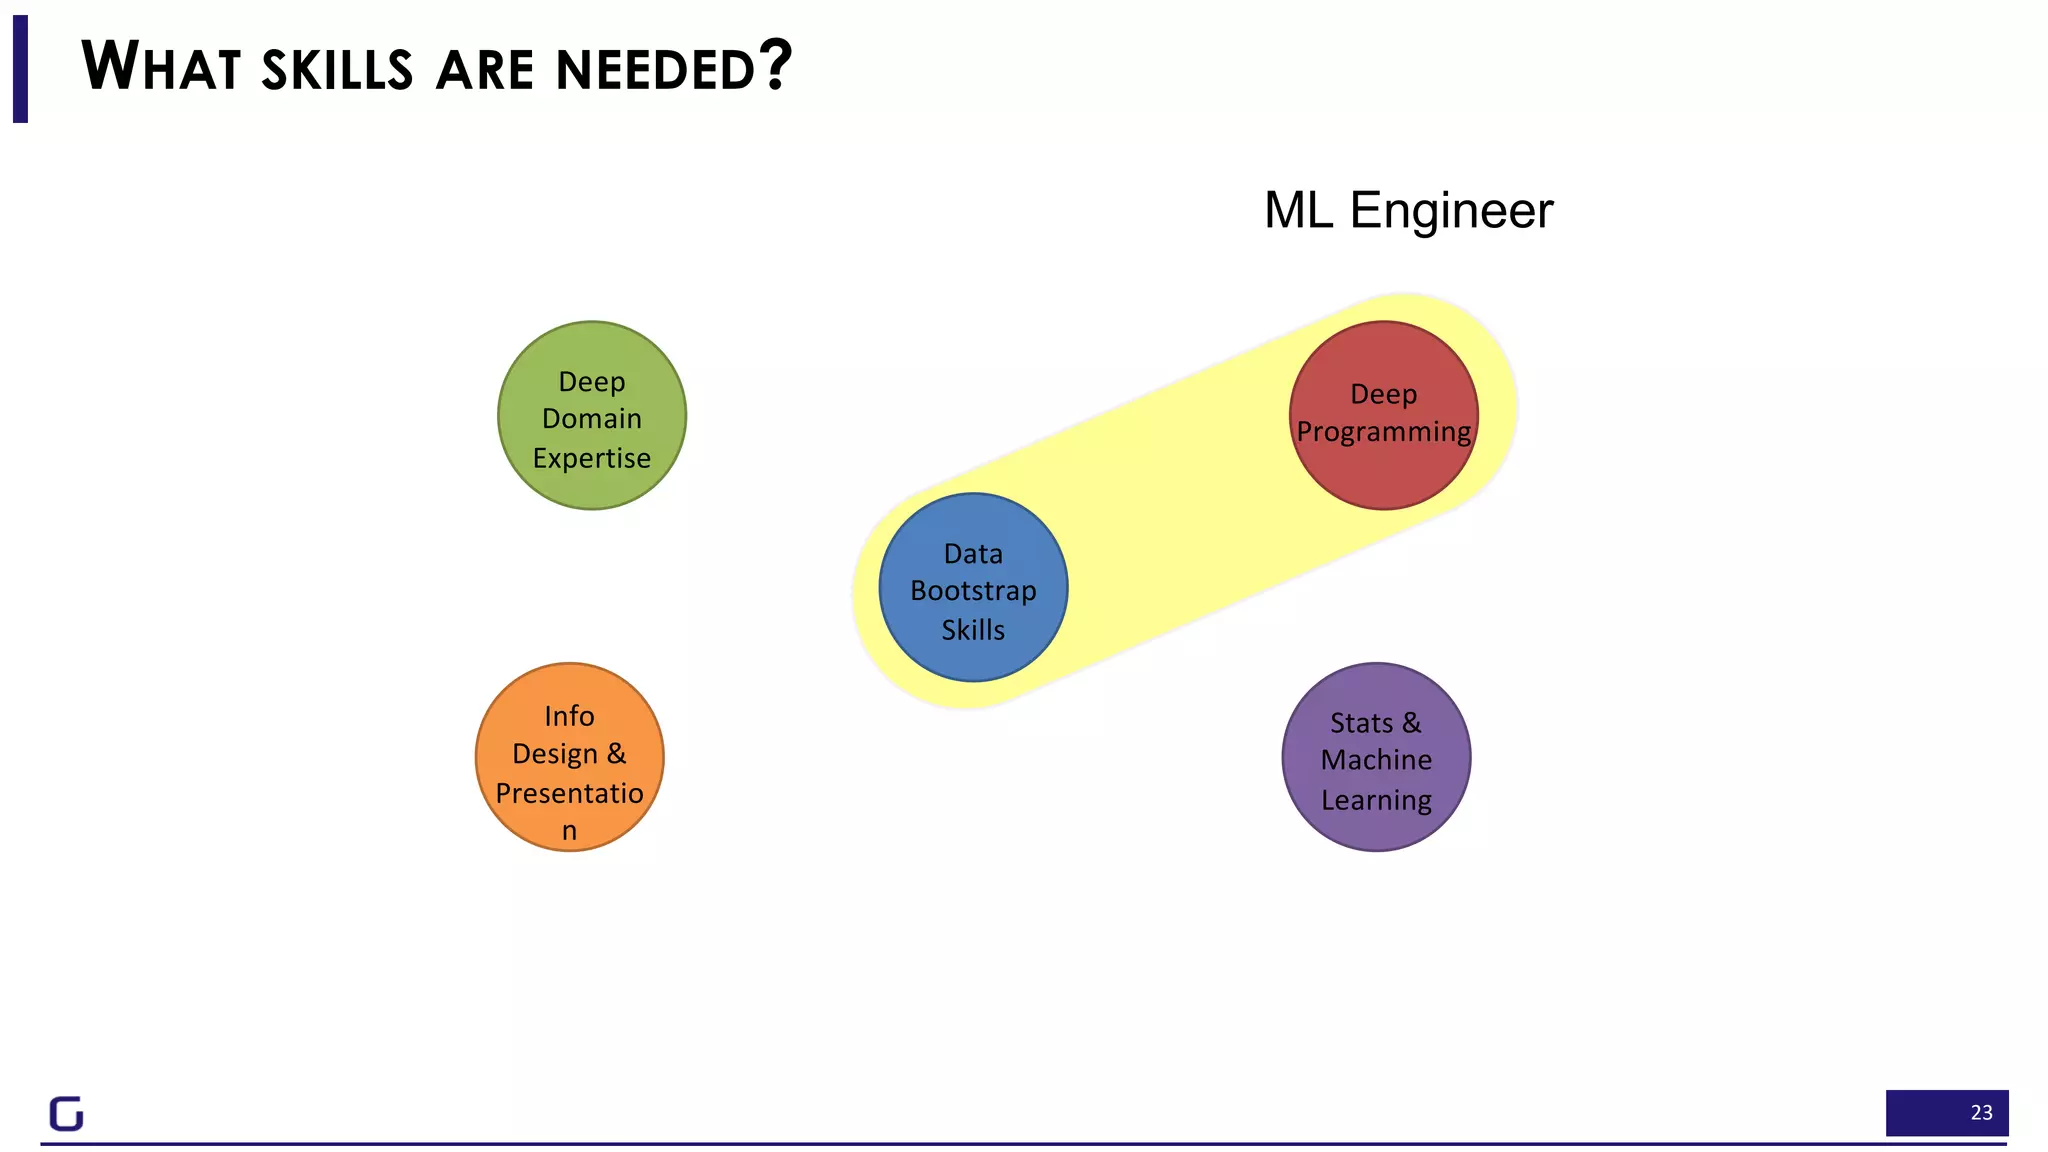
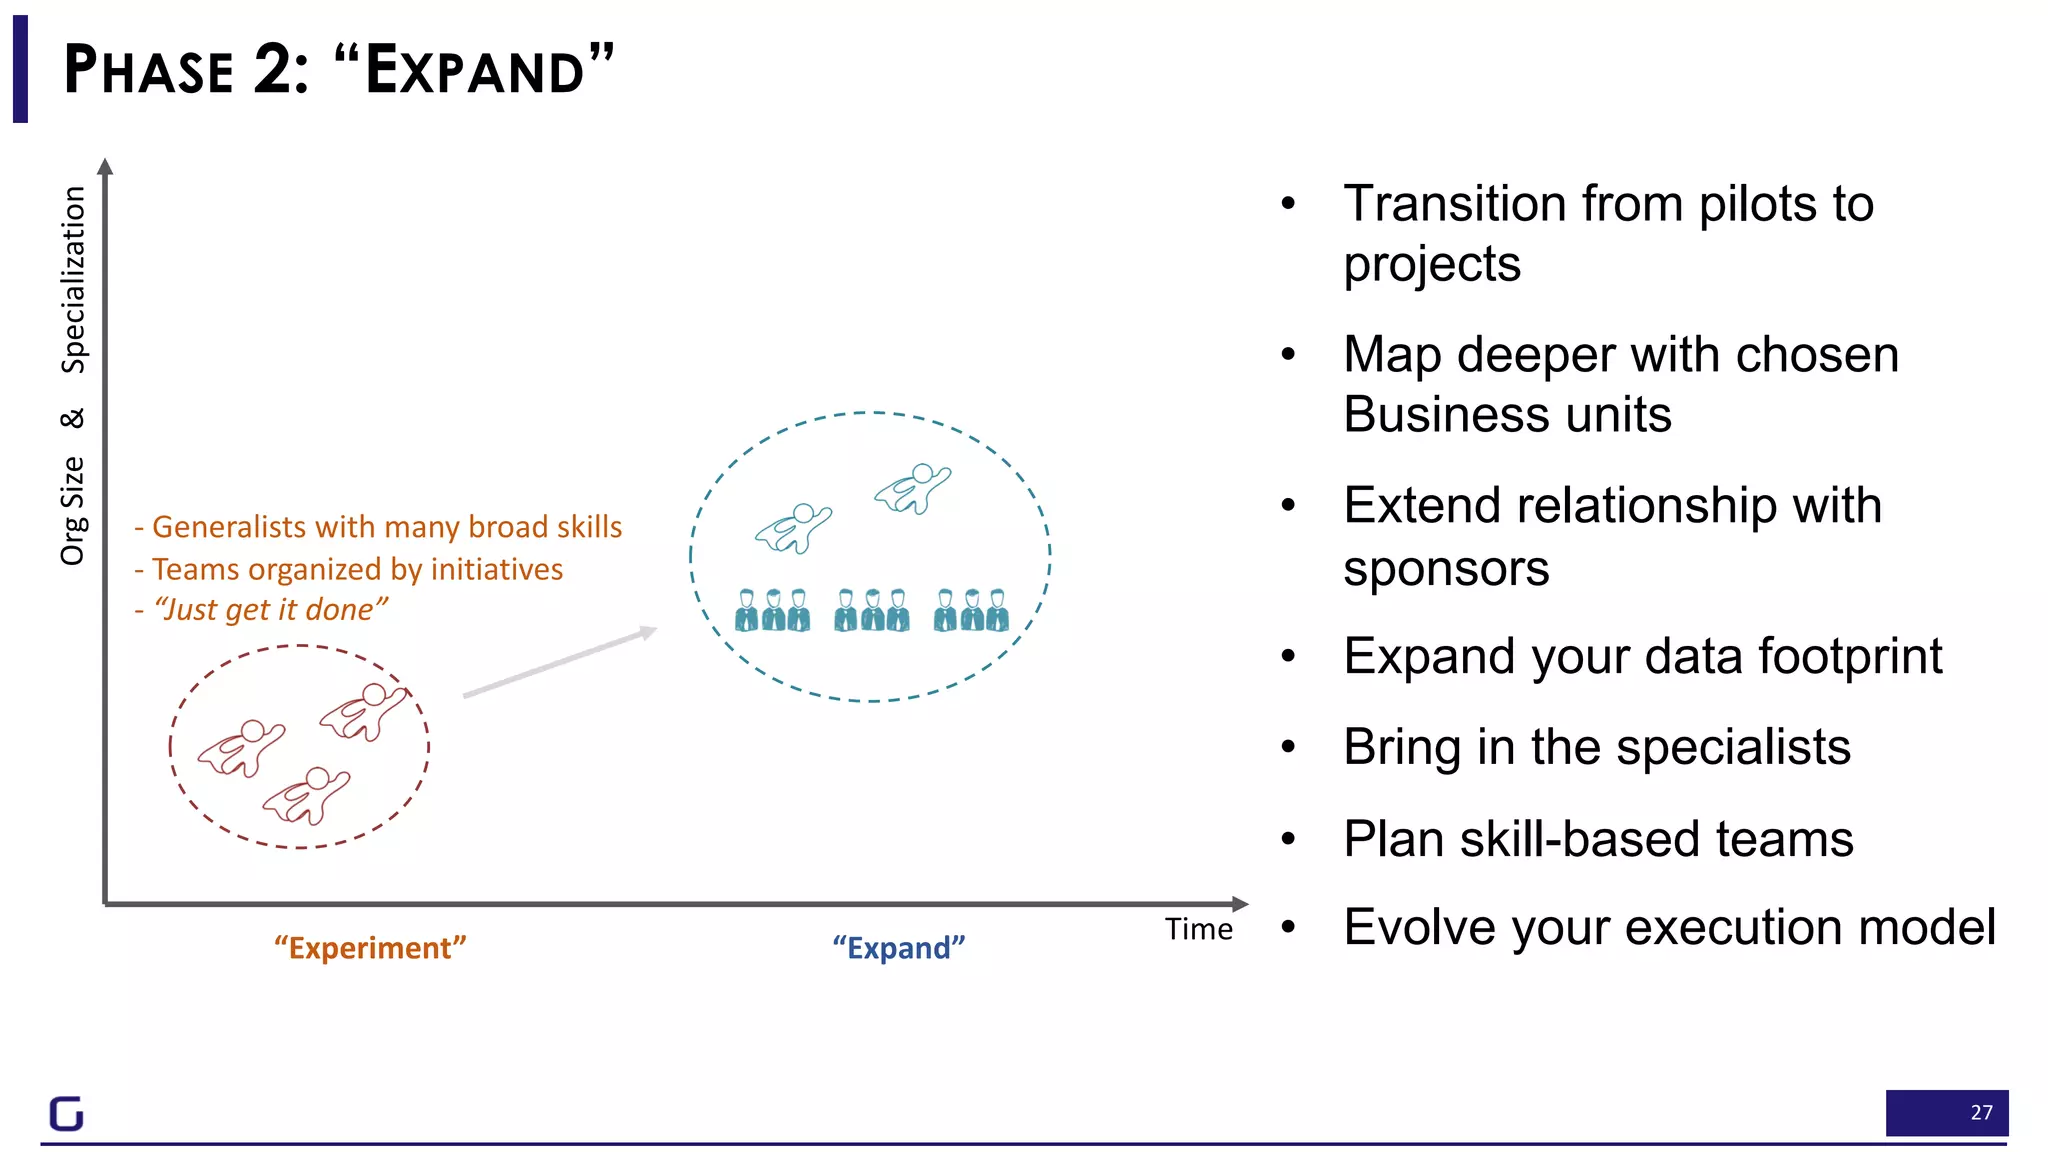
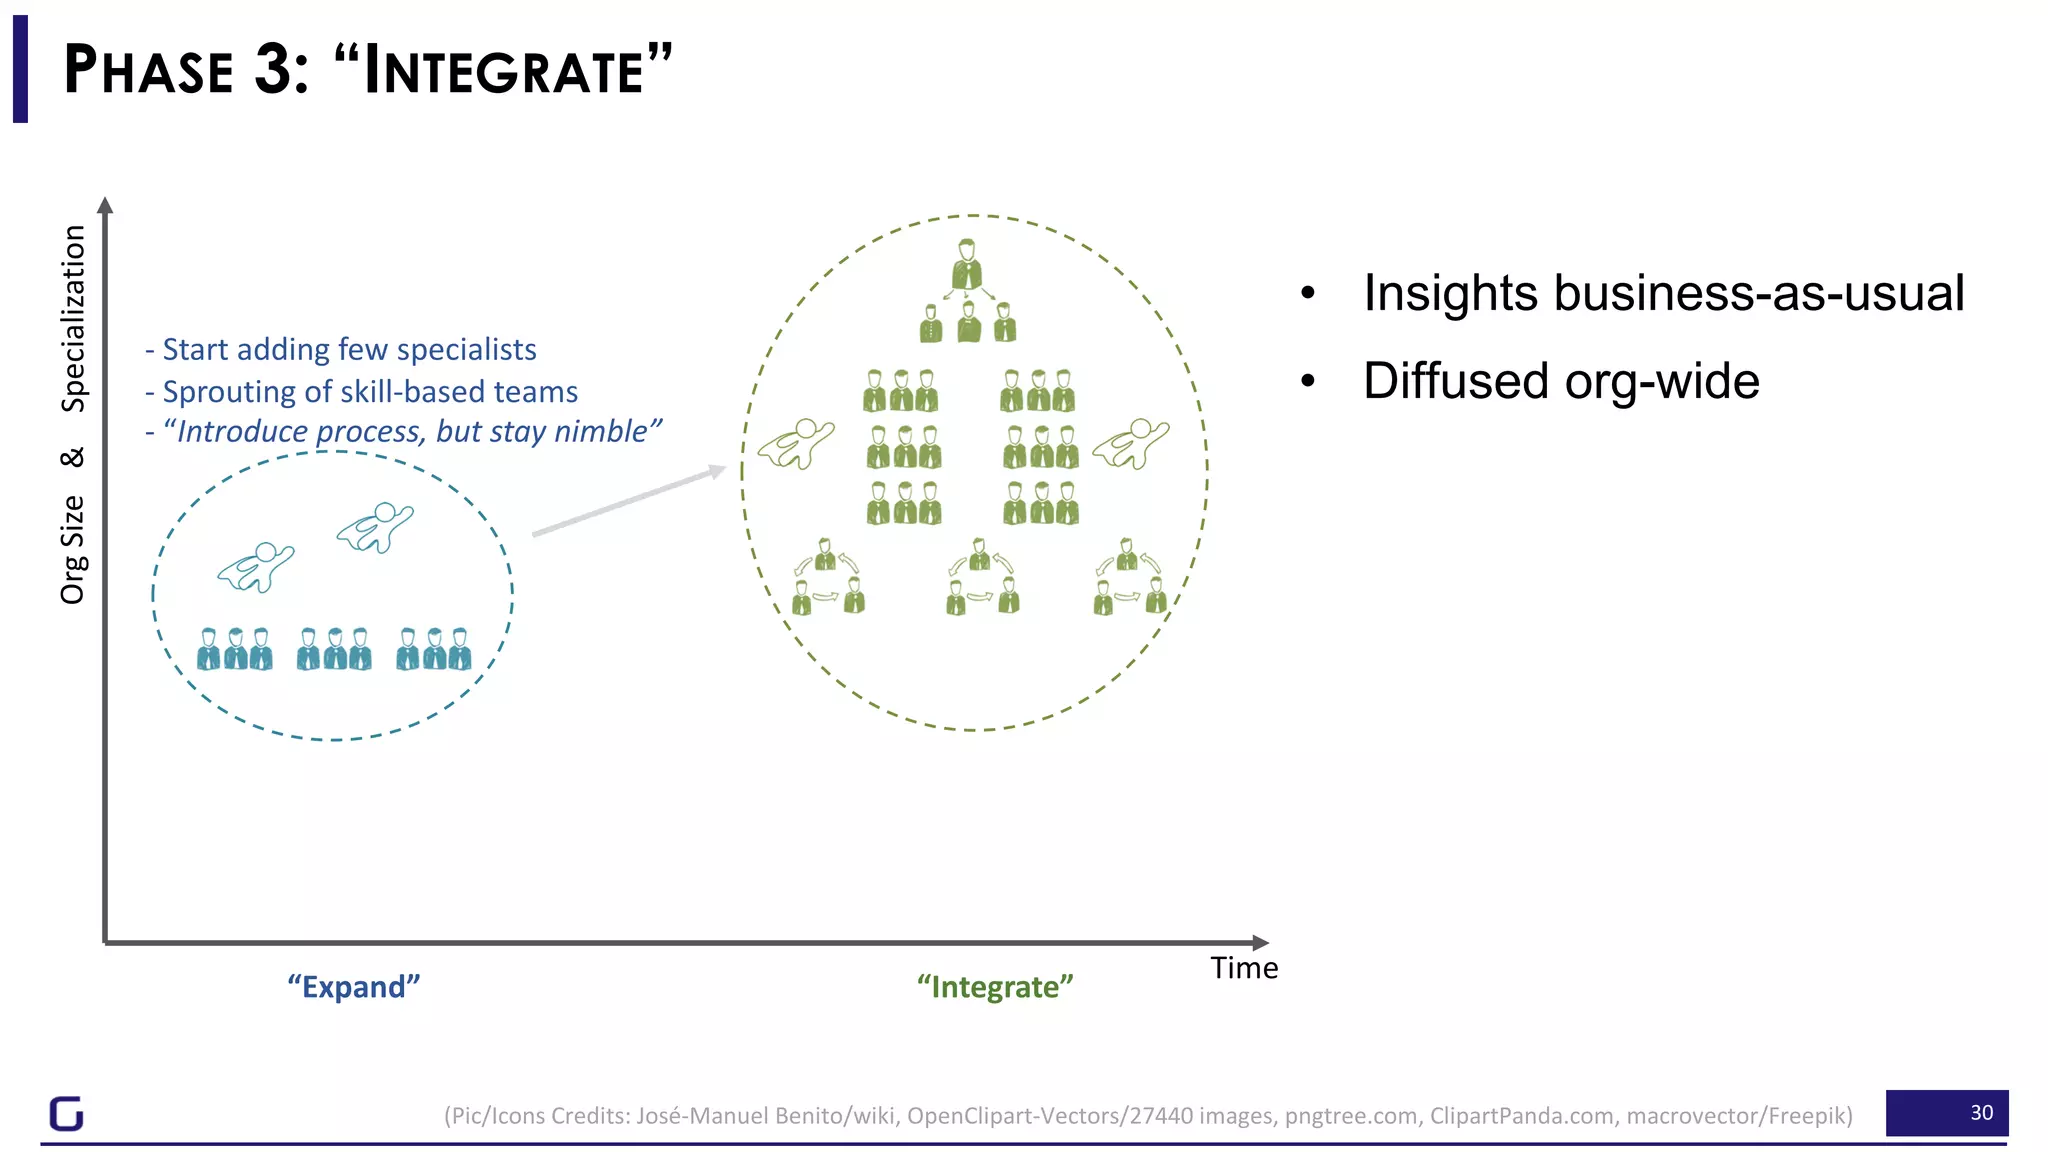
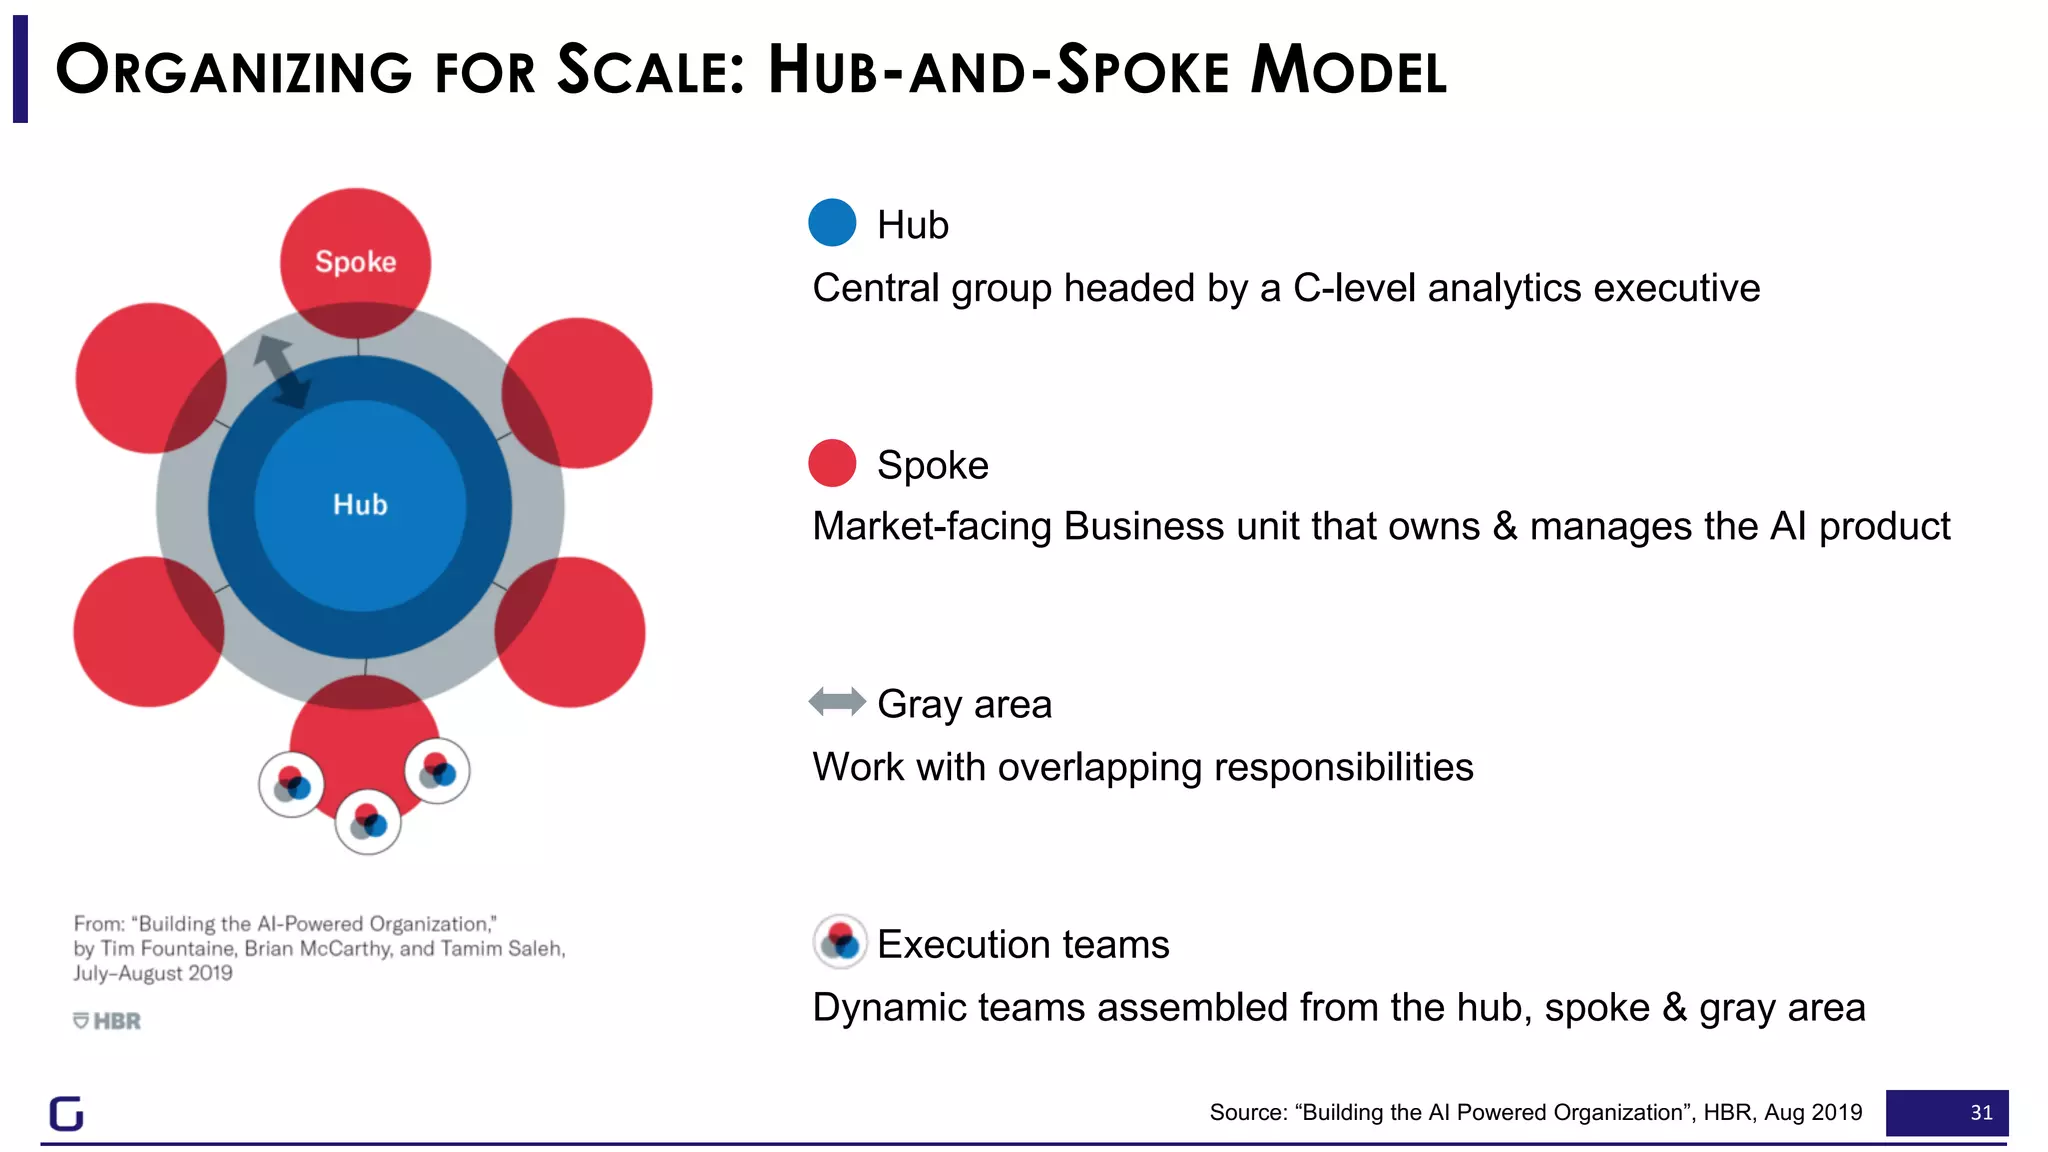
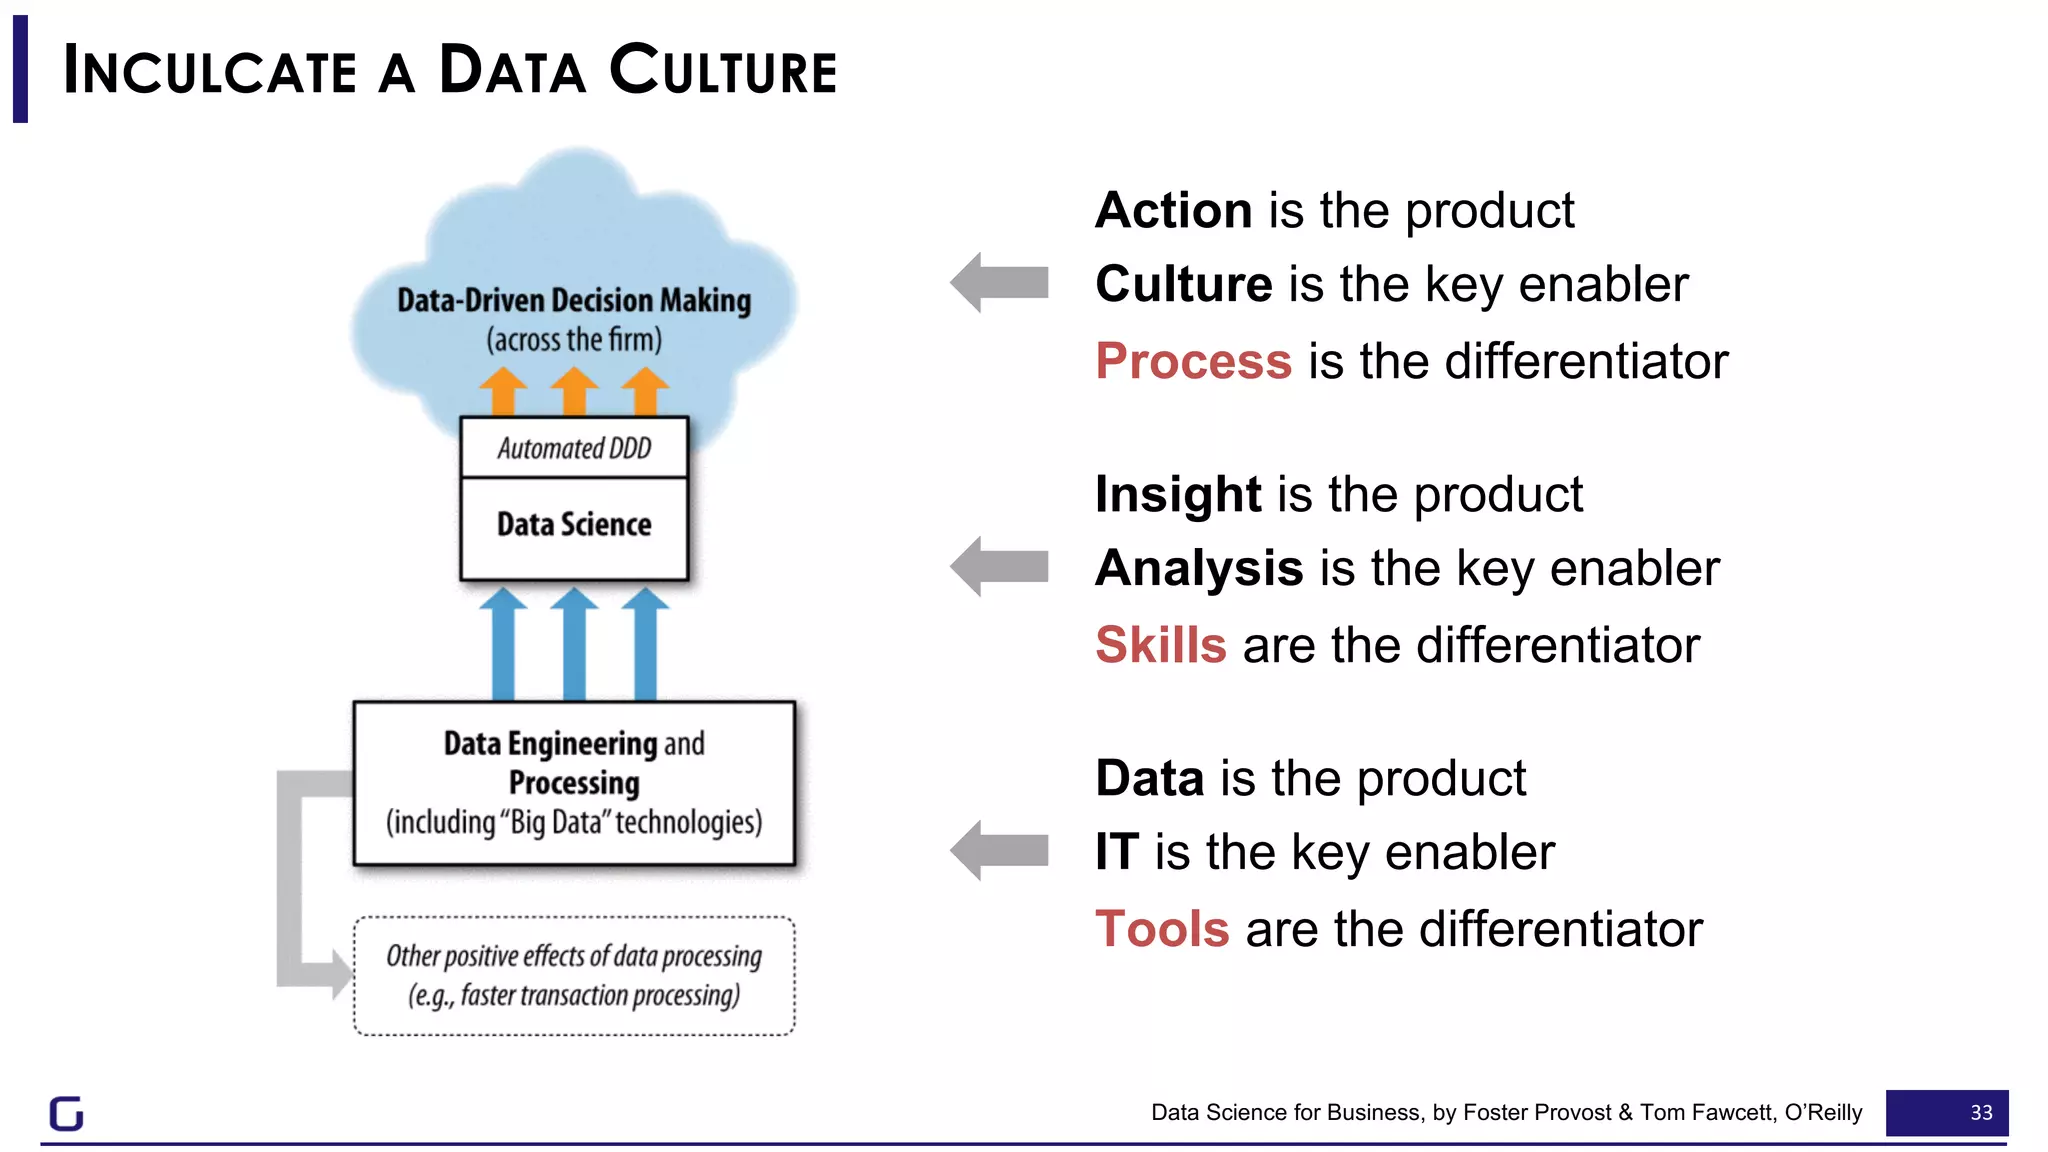
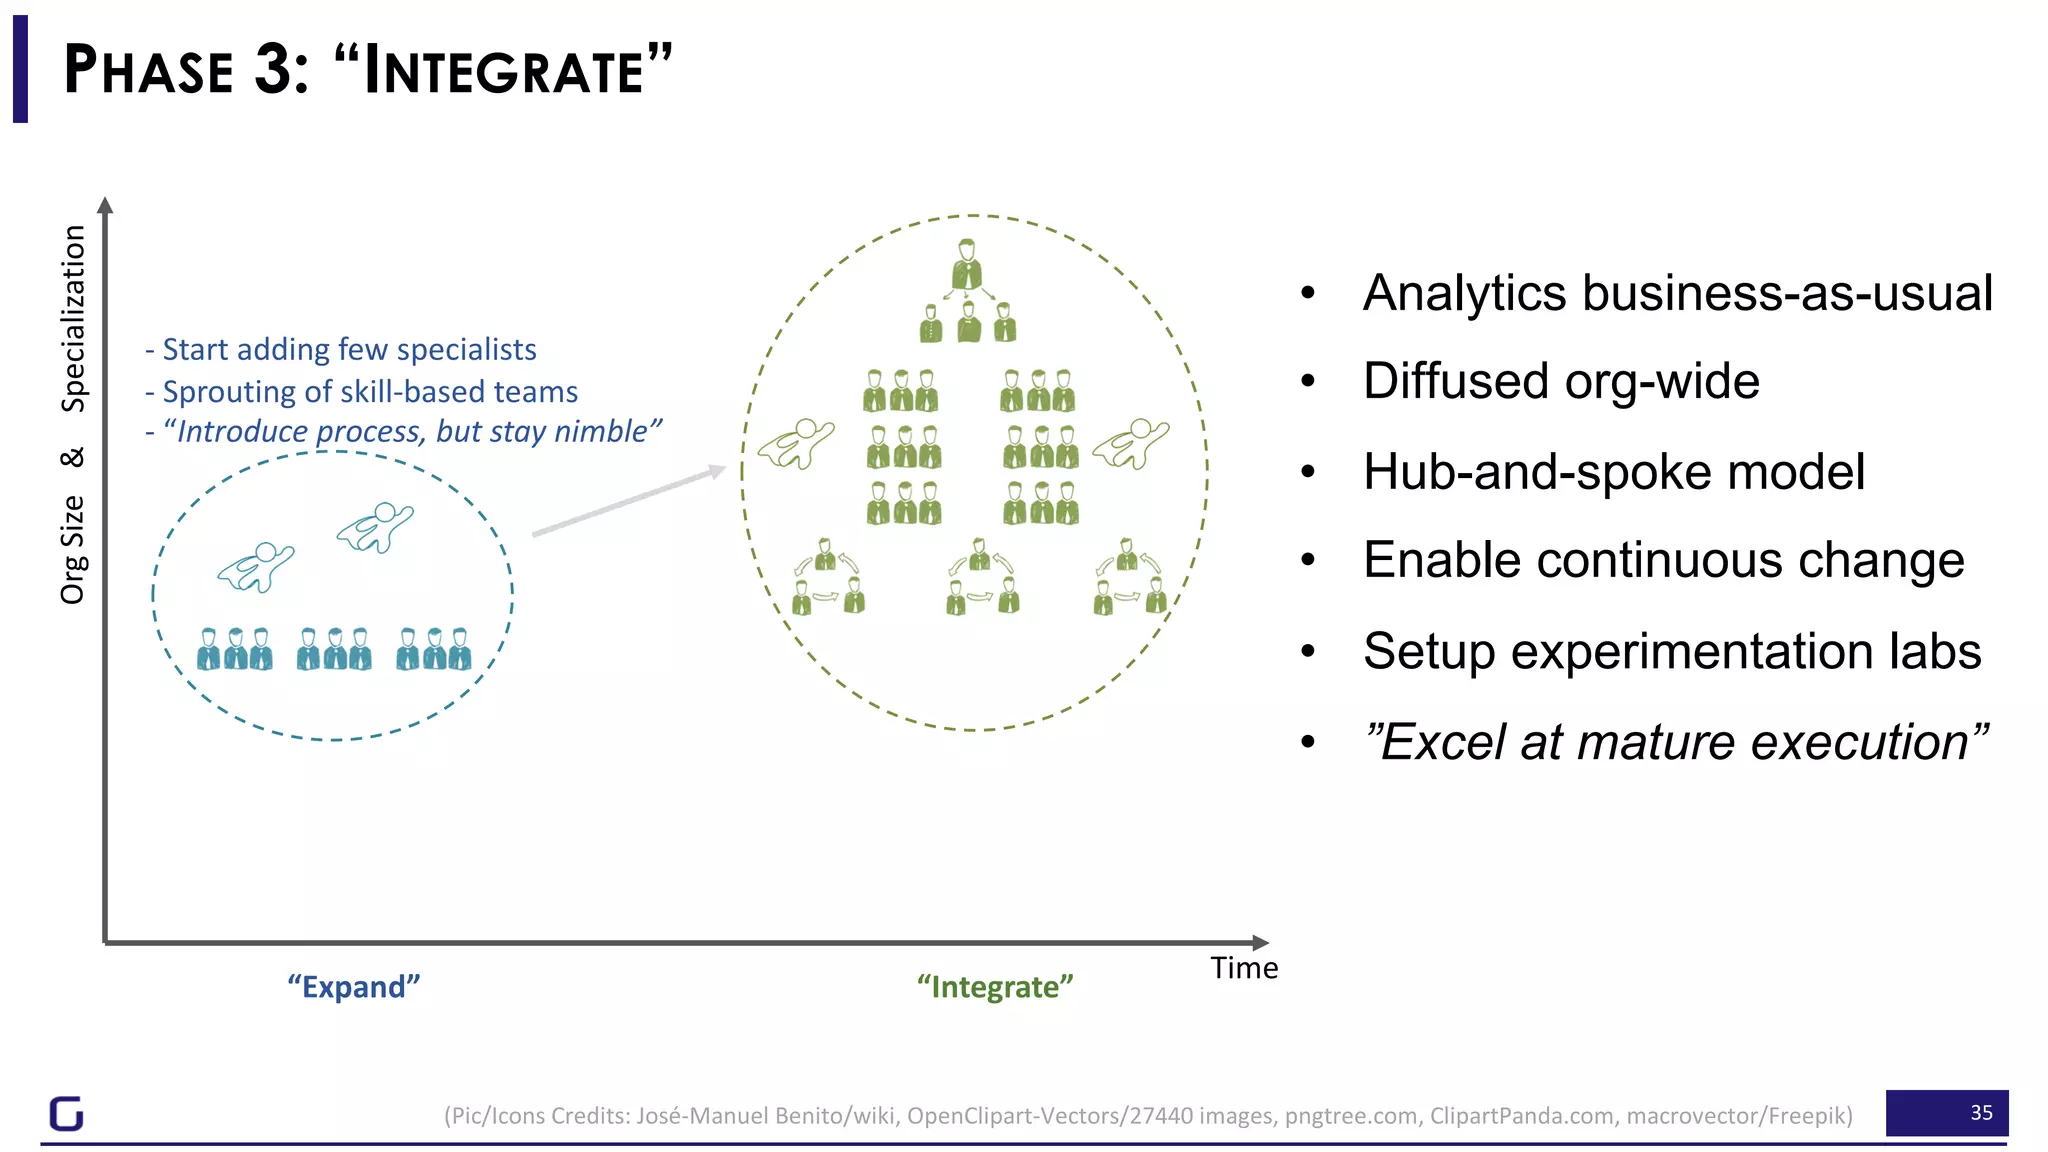
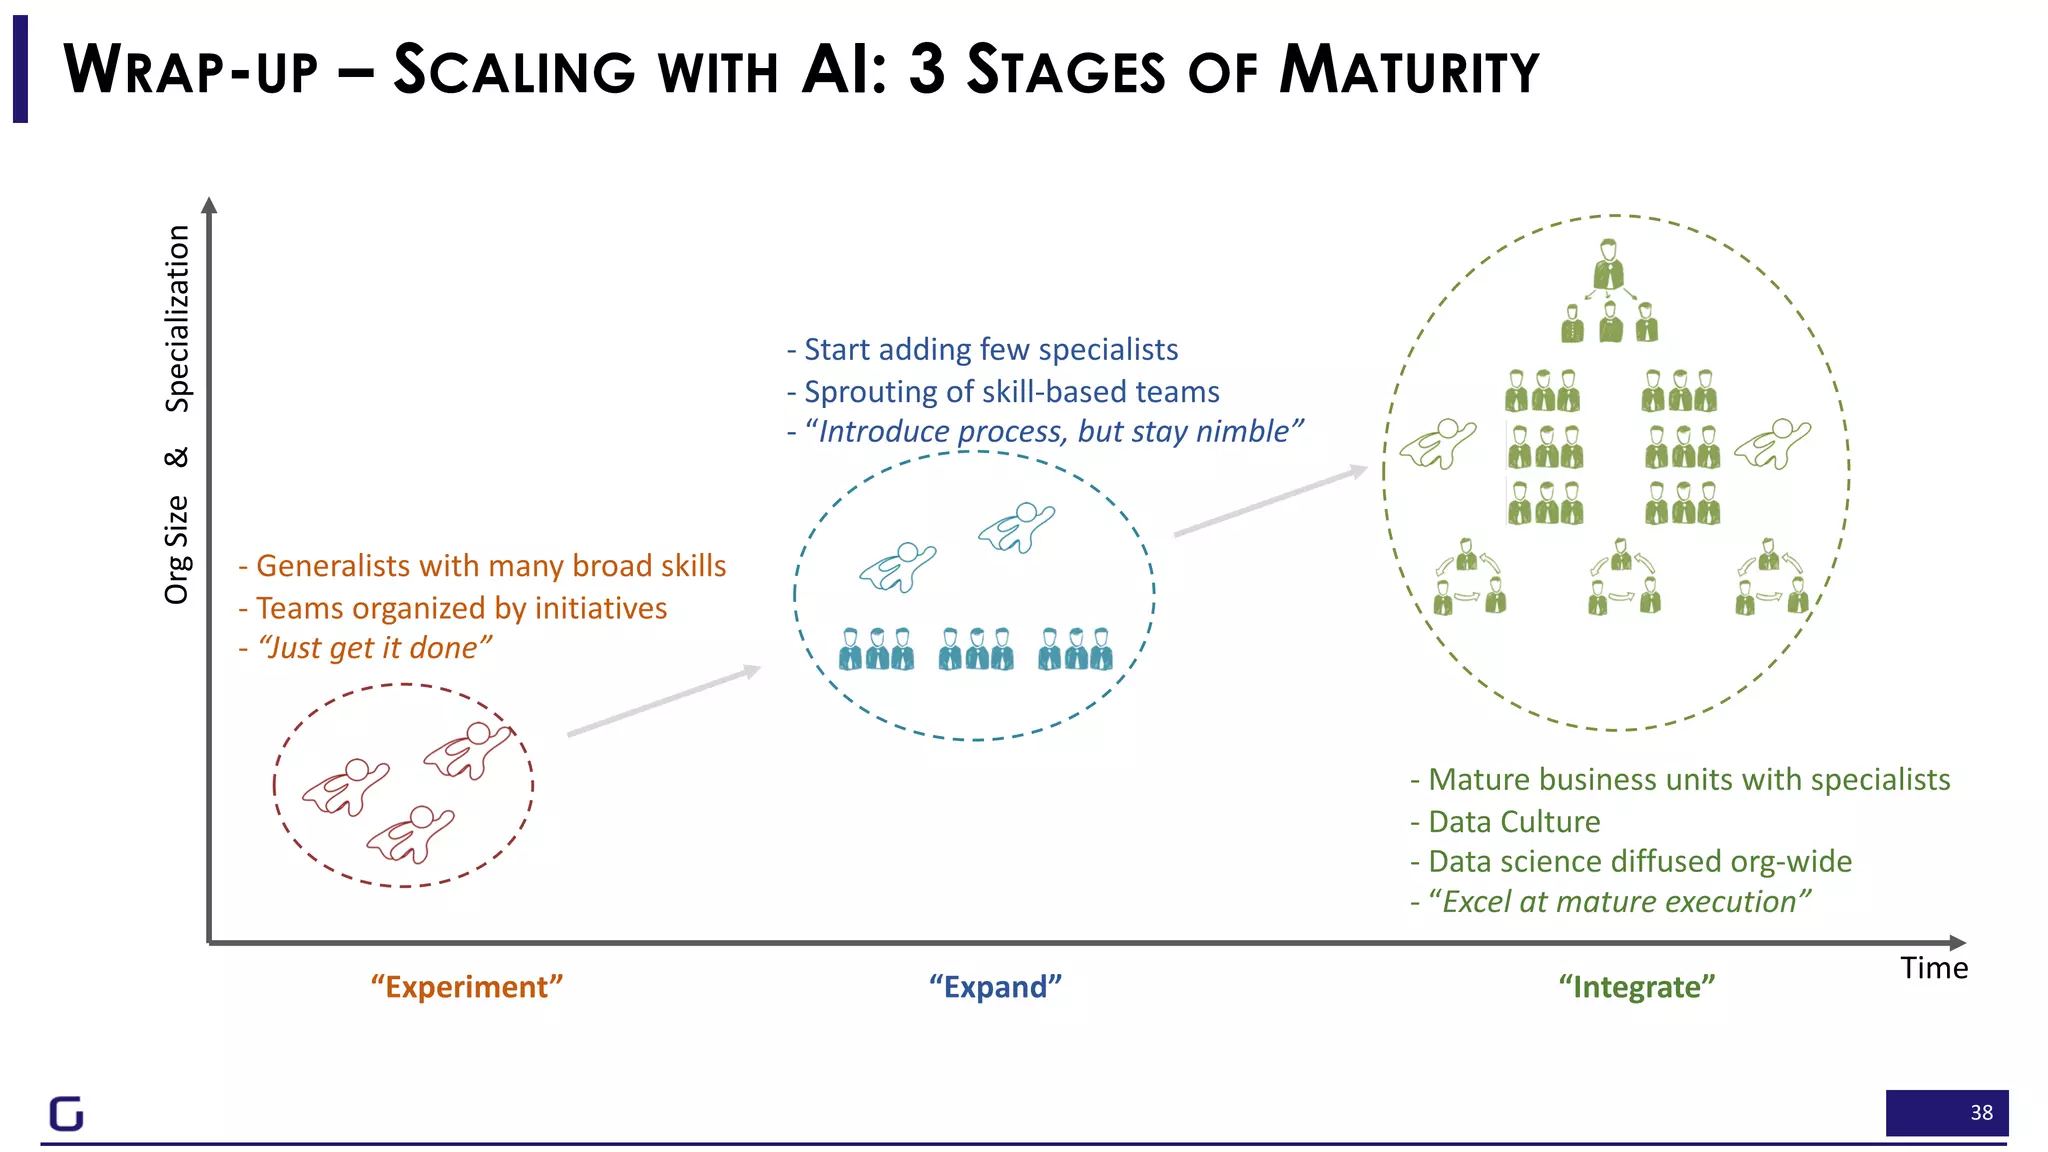
Knowledge Graphs for a Connected World - AI, Deep & Machine Learning MeetupBenjamin Nussbaum
We live in an era where the world is more connected than ever before and the trajectory is such that data relationships will only continue to increase with no signs of slowing down. Connected data is the key to your business succeeding and growing in today’s connected world. Leading enterprises will be the ones that utilize relationship-centric technologies to leverage connections from their internal operations and supply chain to their customer and user interactions. This ability to utilize connected data to understand all the nuanced relationships within their organization will propel them forward as they act on more holistic insights.
Every organization needs a knowledge graph because connected data is an essential foundation to advancing business. Additional reading on connected can be found here: https://www.graphgrid.com/why-connected-data-is-more-useful/
How to use your data science team: Becoming a data-driven organizationYael Garten
Talk given at Strata Hadoop World conference March 2016.
http://conferences.oreilly.com/strata/hadoop-big-data-ca/public/schedule/detail/48305
In this talk we review the culture, process and tools needed for a data driven organization. We review an example of how companies like LinkedIn use data to make business decisions, and then walk through the culture, process, and tools needed to foster this. We review the spectrum of data science used within an organization and explore organizational needs, such as the democratization of data via self-serve data platforms for experimentation, monitoring, and data exploration, as well as the challenges that come with such systems. Participants leave this session with the ability to identify opportunities for data scientists to contribute within their organization and with an understanding of what investments are needed to drive transformation into a data-driven organization.
Disrupting technologies like Data Science and Knowledge Automation are projected to have an economic impact of trillions of dollars in the next decade.
This presentation was given at the Dallas Tableau User Group on Oct 29, 2103 and
Is big data handicapped by "design"? Seven design principles for communicatin...Zach Gemignani
Is big data handicapped by "design"? This presentation shares the seven design principles for effective data communication. Good and bad examples for data visualizations highlight the choices designers make in helping non-analytical audiences understand the meaning in data.
Data-Ed Online Webinar: Data Architecture RequirementsDATAVERSITY
Data architecture is foundational to an information-based operational environment. It is data architecture that organizes data assets so they can be used in your business strategy to create real business value. Even though this is important, data architectures are still being used ineffectively. The various uses of data architecture are referenced to inform, clarify, understand, and resolve aspects of a variety of business problems commonly encountered in organizations. As opposed to showing how to architect data, your presenter Dr. Peter Aiken will show how to use data architecture to solve business problems. The goal is for you to be able to envision a number of uses for data architectures that will maximize your organization’s competitive advantage.
Takeaways:
•How to utilize data architecture to address a broad variety of organizational challenges and how to utilize data architectures in support of business strategy
•Understanding foundational data architecture concepts based on the DAMA DMBOK
•Data architecture guiding principles & best practices
An immersive workshop at General Assembly, SF. I typically teach this workshop at General Assembly, San Francisco. To see a list of my upcoming classes, visit https://generalassemb.ly/instructors/seth-familian/4813
I also teach this workshop as a private lunch-and-learn or half-day immersive session for corporate clients. To learn more about pricing and availability, please contact me at http://familian1.com
Data Visualization Resource Guide (September 2014)Amanda Makulec
A summary guide to data visualization design, including key design principles, great resources, and tools (listed by category with short explanations) that you can use to help design elegant, effective data visualizations that help share your message & promote the use of your information.
Note that the tools & resources highlighted are suggested, and inclusion should not be considered as an endorsement from JSI.
What's the Value of Data Science for Organizations: Tips for Invincibility in...Ganes Kesari
This session was delivered as an Open Colloquium on Apr 30th 2020 for the Master in Information program students. It was organized by the Rutgers School of Communication & Information.
The session covers 3 themes:
- How do enterprises and not-for-profit organizations gain value from data science?
- What are the biggest challenges in data science that professionals are unaware of? How can students translate that into learnings, to make themselves indispensable in the industry
- What's the impact of COVID-19 and the recession on data science industry? How will the data jobs be impacted?
Building Fast Growth Into Your Products Using Data-Informed DesignAtlassian
There's a thing called "time to value": how long it takes a team to uncover and realize value from a product. Atlassian learned this the hard way, discovering that more than half of new customers tried its products for less than 30 minutes – far too short a time to fully unlock their value. We approached and solved this problem using data-informed design – a combination of growth hacking, user research, data analytics, and A/B testing at scale – to dramatically increase customer engagement with our products. Come hear lead designer Alastair Simpson describe the variety of approaches we started with and how we learned which ones to pursue and which ones to discard. You'll learn how to design and centralise improved onboarding experiences that can be spread across all your products.
Visualisation & Storytelling in Data Science & AnalyticsFelipe Rego
This is a presentation I put together for a talk I gave a while back on data visualisation and storytelling in the context of data science and analytics. The content was a produced from a mix of my own experience in industry and teaching at various schools and also from the work of Edward Tufte, Nathan Yau, Angela Zoss, Peter Beshai, Mike Bostock, among others. I wanted to highlight some basic concepts of what data visualisation is and what are some of the fundamental steps I believe are important in creating analytical dashboards and visualisations. It also contains a bunch of visualisation examples that I find interesting in telling a story with data.
Slides from a webinar on February 19th, 2015 to the European SharePoint community (http://www.sharepointeurope.com/) as part of their Training Week. Much of this content duplicates my keynote from SharePoint Connect 2014 in Amsterdam last November, but my examples and the recording are updated and worth a view. Slides can only show you so much -- go watch the recording.
In that session we will discuss about Data Governance, mainly around that fantastic platform Power BI (but also around on-prem concerns).
How to avoid dataset-hell ? What are the best practices for sharing queries ? Who is the famous Data Steward and what is its role in a department or in the whole company ? How do you choose the right person ?
Keywords : Power Query, Data Management Gateway, Power BI Admin Center, Datastewardship, SharePoint 2013, eDiscovery
Level 200
A brief overview of the Rady School of Management at UC San Diego and how are developing ethical leaders for innovation-driven organizations. Find out if the Rady School is the MBA or Master of Finance program for you.
Slides: How AI Makes Analytics More HumanDATAVERSITY
People think AI makes analytics less human, replacing human decision making. But the truth is, AI actually makes analytics more human. Augmented analytics are helping organizations finally break through the low levels of adoption and limitations typical of 2nd generation visualization tools.
Most business problems cannot be solved purely by algorithms or machine learning — they require human interaction and perspective. Uniting precedent-based machine learning systems with natural human intuition and curiosity is the foundation of 3rd generation BI and democratizing data across an enterprise.
It is a natural flow to enhance your data eco-system by deploying a platform with augmented intelligence to work alongside users in the pursuit of surfacing new insights, automating tasks, and supporting natural language interaction. All work as accelerators for achieving active intelligence and Data Literacy.
Data architecture is foundational to an information-based operational environment. It is your data architecture that organizes your data assets so they can be leveraged in your business strategy to create real business value. Even though this is important, not all data architectures are used effectively. This webinar describes the use of data architecture as a basic analysis method. Various uses of data architecture to inform, clarify, understand, and resolve aspects of a variety of business problems will be demonstrated. As opposed to showing how to architect data, your presenter Dr. Peter Aiken will show how to use data architecting to solve business problems. The goal is for you to be able to envision a number of uses for data architectures that will raise the perceived utility of this analysis method in the eyes of the business.
Find out more: http://www.datablueprint.com/resource-center/webinar-schedule/
How Data Science Builds Better Products - Data Science Pop-up SeattleDomino Data Lab
Data Science and Big Data are ushering in a new era in adaptive applications that learn from large and varied datasets and adjust their features based on the changing environment. This talk will look at how Data Science can be successfully bridged with Big Data Architectures and Agile Software Delivery to create a new class of software that answers the demands of today's rapidly-changing enterprises. Practical techniques and real-world case studies will highlight the approaches required to successfully build these exciting new enterprise tools. Presented by Sean McClure, Ph.D. Data Scientist, Senior Consultant at ThoughtWorks.
Great Data Delivery: A model-based approachZach Taylor
Great data strategies focus on delivery. The presentation will discuss:
- The importance of how data is delivered to driving user adoption of data-driven behavior
- Strategies for creating data driven organizations
- A model-based approach to supporting self-service analytics and ending "data breadlines"
- User experience design for data teams creating a data product for their organizations
Why is it difficult to achieve strategic differentiation using AIGanes Kesari
This deck was presented at ICC 2019, the ISACA Chennai Conference, by Ganes Kesari.
Session Abstract:
Today, every organization is trying to make their business AI-ready. However, industry reports claim that “80% of data science projects will not deliver value”. While the destination is clear, the path to be taken isn’t obvious.
Companies struggle with several questions: How to lay out a robust data science roadmap? What skills do you need to hire for? How do AI models translate to business value? How to sustain a culture of innovation and insight?
This session will answer these questions and show how organizations can apply AI at scale. It achieves the following learning objectives:
* How to align data science with the organization’s strategic objectives?
* How to setup and scale teams?
* What organizational structures help deliver business value with AI?
These are slides from Ellen Wagner\'s featured theme presentation Making Learning Analytics Matter in the Educational Enterprise from Blackboard World 2012, New Orleasn, LA, July 12, 2012
Opportunities and Pitfalls of Prototyping with Artificial Intelligence berl...DAIN Studios
How to build new products and services that respond intelligently to users and their contexts? When does it make sense to use AI in service design? DAIN Studios talks about Data Driven Design and the use of AI in design.
How the Analytics Translator can make your organisation more AI drivenSteven Nooijen
Today, about 80% of companies considers data as an essential part of their strategy. However, although most of these companies are taking models into production, they still have trouble turning their data and insights into valuable AI solutions. With businesses heavily invested in data and AI, what is it that actually makes the difference for being successful with AI?
In this talk, I will argue that the extent to which AI is embedded in the organisation is crucial to success. Furthermore, I will show why the Analytics Translator is the designated person to drive AI adoption by the business and what his or her tasks should look like. The insights shared come from our own experience as consultants as well as interviews with top Dutch enterprises about their AI maturity.
AI Maturity Levels and the Analytics TranslatorGoDataDriven
Buzzwords like Big Data, Cloud, and AI have been out there now for a couple of years. But today, businesses have a clear focus on the application of data use cases and the challenges around that such as metadata management, governance, security, and maintainability in general. Everybody seems to have some version of a data lake and wants to consolidate it into something (more) useful, or move from an on-premise version to the cloud. There is a general need to streamline current practices while also attempting to give multiple segments of users (data scientists, analysts, marketeers, business people, and HR) access in a way that is tailored to their needs and skills. In other words: businesses today are heavily invested in data and AI, but many have a hard time knowing how to mature it to the next level.
This is exactly where a "maturity model" comes into play. The goal of a maturity model is to help businesses in understanding their current and target competencies. This helps organisations in defining a roadmap for improving their competency. A maturity model is therefore one way of structuring progression, whether the company already embraces data science as a core competency, or, if it is just getting started.
In this presentation on maturity models, we answer the following questions:
1. What exactly is a maturity model and why would you need it? We address this by sharing GoDataDriven's maturity model and describing the different phases we have identified based on our experience in the field.
2. How can you use a maturity model to advance your organisation? Having a maturity model alone is not enough, in order for it to be valuable you need to act upon it. This paper provides concrete examples on how to do act based on practical stories and experiences from our clients and ourselves.
Course 8 : How to start your big data project by Eric Rodriguez Betacowork
For more info about our Big Data courses, check out our website ➡️ https://www.betacowork.com/big-data/
---------
"Data is the new oil" - Many companies and professionals do not know how to use their data or are not aware of the added value they could gain from it.
It is in response to these problems that the project “Brussels: The Beating Heart of Big Data” was born.
This project, financed by the Region of Brussels Capital and organised by Betacowork, offers 3 training cycles of 10 courses on big data, at both beginner and advanced levels. These 3 cycles will be followed by a Hackathon weekend.
No prerequisites are required to start these courses. The aim of these courses is to familiarize participants with the principles of Big Data.
------
For more info about our Big Data courses, check out our website ➡️ https://www.betacowork.com/big-data/
It’s Not About Big Data – It’s About Big Insights - SAP Webinar - 20 Aug 201...Edgar Alejandro Villegas
Presentation slides of:
It’s Not About Big Data – It’s About Big Insights - SAP Webinar - 20 Aug 2013 - PDF
Scott Mackenzie - Sr. Director, Platform & Analytics CoE
Michael Golzc - CIO for SAP Americas
Ken Demma - VP, Insight Driven Marketing
20 Aug 2013 - Webcast - http://goo.gl/T74WAL
Prepping the Analytics organization for Artificial Intelligence evolutionRamkumar Ravichandran
This is a discussion document to be used at the Big Data Spain at Madrid on Nov 18th, 2016. The key takeaway from the deck is that AI is reality and much closer than we realize. It will impact our Analytics Community in a very different way vs. an average Consumer. We can shape and guide the revolution if we start preparing for it now - right from our mindset, design thinking principles and productization of Analytics (API-zation). AI is a need to address the problems of scale, speed, precision in the world that is getting more and more complex around us - it is not humanly possible to answer all the questions ourselves and we will need machines to do it for us. The flow of the story line begins with a reality check on popular misconceptions and some background on AI. It then delves into all the ways it can optimize the current flow and ends with the "Managing Innovation Playbook" a set of three steps that should guide our innovation programs - Strategy, Execution & Transformation, i.e., the principles that tell us what we want to get out of it, how to get it done and finally how much the benefits permanent and consistently improving.
Would love to hear your feedback, thoughts and reactions.
Fixing data science & Accelerating Artificial Super Intelligence DevelopmentManojKumarR41
This presentation discusses Challenges, Problems, Issues, Measures, Mistakes, Opportunities, Ideas, Technologies, Research and Visions around Data Science
HashGraph, Data Mesh, Data Trajectories, Citrix HDX and Anonos BigPrivacy
Combination of these 5 and few other ideas will ultimately lead us to the VGB Platform. Will soon come up with other document explaining the vision and how exactly work on the vision to gradually develop this Platform, which fixes Data Science Efforts Globally.
Data Infused Product Design and Insights at LinkedInYael Garten
Presentation from a talk given at Boston Big Data Innovation Summit, September 2012.
Summary: The Data Science team at LinkedIn focuses on 3 main goals: (1) providing data-driven business and product insights, (2) creating data products, and (3) extracting interesting insights from our data such as analysis of the economic status of the country or identifying hot companies in a certain geographic region. In this talk I describe how we ensure that our products are data driven -- really data infused at the core -- and share interesting insights we uncover using LinkedIn's rich data. We discuss what makes a good data scientist, and what techniques and technologies LinkedIn data scientists use to convert our rich data into actionable product and business insights, to create data-driven products that truly serve our members.
Similar to How Organizations can gain Strategic Advantage when Everyone is applying AI (20)
Project Management Careers in Data ScienceGanes Kesari
This slide deck was used in the presentation made to the Project Management Institute (PMI) Metrolina Chapter on September 28, 2022.
Title:
Top Data Science Career Opportunities For Project Managers
- Art of the Possible with Data Science
- Industry case studies
Data & Analytics 101 for PMs: Key disciplines and terminologies
- Top roles in data analytics
- Project Management in Data Science
Takeaways:
- How managers influence D&A project outcomes
- Key responsibilities & tips for success
- Industry examples: Challenges and learnings
Penn State Guest Lecture: Business Forecasting in Real LifeGanes Kesari
This deck was used in the guest lecture conducted at the Penn State College of Information Sciences and Technology. The session was delivered by Thanoj Kattamanchi and Ganes Kesari on November 30th, 2021.
Session Abstract:
What are the most common applications of forecasting techniques? This talk will share several industry case studies on forecasting. It will dive into the details of how a large agricultural conglomerate adopted price forecasting to achieve a revenue uplift of 3.2%. The session will cover the step-by-step approach adopted by the client, from business problem definition, data identification, variable selection, model evaluation, to deployment. It will conclude by sharing the top lessons learned and guidelines for aspiring data scientists considering a career in building machine learning applications.
500 startups cognitive bias in decision making - ganes kesari - nov 2021 - finalGanes Kesari
What are the most common cognitive biases that impact leaders? How can early-stage startups lay a foundation for data-driven decisions?
In this fireside chat for 500 Startups, I addressed startup founders on how to champion good data stewardship, embed it in product development, and ensure organizational ROI from data.
The session was conducted on November 10th, 2021.
This deck was used in the guest lecture delivered by Ganes at the Rutgers Business School, New Jersey, on July 7th, 2021. These slides were supplemented with a live business case that was used for the class discussion.
5 Steps to Transform into a Data-Driven Organization - Ganes Kesari - Gramen...Ganes Kesari
This session was presented on May 27th, 2021, in a Webinar organized by Gramener.
https://info.gramener.com/5-steps-to-transform-into-data-driven-organization
Session Details:
Today, organizations struggle to get value from data despite significant investments. Did you know that there's one factor that influences the outcomes of all your data initiatives?
This webinar will highlight how an organization's data maturity influences its performance. It will show how you can assess your data maturity and plan the five steps for data-driven business transformation.
Pain points we would be discussing:
Most organizations stagnate midway in their data journey.
Gartner says that over 87% of organizations in the industry are at lower levels of data maturity (levels 1 and 2 on a scale of 5).
Just doing more data science projects will not improve your capabilities or outcomes. The fact is that the top challenges reported by CDOs fall into five common areas.
This webinar will show what they are and how you can tackle them.
Who should attend
- Executives, Chief Data/Analytics Officers, Technology leaders, Business heads, Managers
What Will You Learn?
- What is data science maturity, and why does it matter?
- How do you assess data science maturity and limitations of the assessment?
- How can data science maturity help your organization level up (explained with an example)?
How AI can help you make your Audience Sit up and take NoticeGanes Kesari
This session was delivered in the IABC World Conference 2020, on June 15.
https://wc.iabc.com/sessions/
Session Abstract:
How do you cut through the clutter and connect with your audience? Can data make your message more credible? Can analytics help you craft compelling content? How can AI help understand your audience’s response? Today there is an over-abundance of information and a paucity of meaningful communication. Data and analytics can be invaluable aids in communication.
Details:
This session will cover four ways to enable this:
Sourcing data to develop your idea: An idea becomes credible when backed by data. But where do you find the data? We’ll see how to get creative with public data sources.
Taking the help of AI to build your narrative: AI needn’t be terrifying. With the open tools available, it can be a powerful aid in discovering insights and building a narrative
Adopting storytelling to craft your message: A set of simple yet powerful principles can transform ordinary messages into powerful stories.
Using content analytics to establish a feedback loop: Analyze your content and audience response in the form of text, video, and audio to get vital clues for improvement.
This session will have live polls for audience feedback and there will be short exercises to absorb the content from each module.
You’ll learn:
How to find data to support your idea.
Which AI tools and techniques can help develop your idea.
How to establish a content analytics feedback loop to learn and improve.
'Recession-proofing' your Business with DataGanes Kesari
This session was presented on May 7th 2020, in a Webinar organized by Gramener.
https://info.gramener.com/recession-proofing-your-business-with-data
COVID-19 has disrupted every industry and precipitated a recession. With the virus still in the early stages of progression, the only certainty is that the pains to the global economy will be prolonged.
Is your business ready for the long haul? Data is your best ally to navigate the crisis and come out stronger. This webinar will show you how.
What will I learn?
Which areas of your business can benefit most with a data-driven response.
A framework to identify use cases that will deliver the biggest bang for the buck.
How to identify new market opportunities and customers through creative approaches with data.
AGENDA:
- Relevance of data in the current crisis
- How data science can help you stay prepared to navigate the recession
- Industry case studies from Gramener's work to help clients respond to COVID-19
How Brands can use AI for Actionable Customer IntelligenceGanes Kesari
This session was delivered on Apr 20th 2020 at the Rutgers Business School. This was a Guest Lecture for the "AI in Marketing" class.
Session Brief:
Today, customers interact with brands continuously, either intentionally or indirectly. They do so on a number of channels, and leave a variety of digital footprints. Unfortunately, enterprises miss out on this opportunity to understand and connect with the customers. This session will show how brands can leverage data and technology to understand their customers.
Brands can harvest both structured and unstructured data from diverse channels. With the help of data analytics, they can build an integrated view of the customer. By overlaying the content with context, they can map every conversation on the customer journey. By stitching all these insights together, brands can use storytelling to help drive the right business decisions.
Transform your Brand's Customer Experience by using AIGanes Kesari
This deck was used in the presentation at the Concentric 2020 conference, on Jan 24th, 2020.
SESSION BRIEF:
Most organizations struggle to understand their customers. In a digital world, the power of data and technology is not tapped into. So, customer advocacy initiatives are short-sighted, transactional and unscientific. This session will show how organizations can listen to customers better. It will introduce you to AI techniques that are revolutionizing customer intelligence.
With examples, you will understand how these insights can be translated into business decisions.
LEARNING OBJECTIVES:
1. You will learn creative ways to find what customers are looking for right now
2. You will be introduced to advanced analytics techniques and storytelling with data
3. You will understand how data science can be applied for business decisions
These are the slides from the Gramener webinar conducted on 16-Jan-2020.
- What skills & roles will help you deliver your analytics and data visualization projects?
- What skills do most teams miss to hire for?
In a Gartner survey, CIOs reported 'team skills' as their biggest barrier ⚠️ to data science. They have trouble deciding the skill mix ⚗️needed or in finding the right people for the job.
This webinar will show the skills and roles you must plan for. You will learn how to tailor this based on your organization's data maturity. It will help you decide whether to upskill teams or hire externally. The session will show you how and where to find talent.
Throughout the webinar you will learn:
- Critical skills & roles needed in your data science team?
- Tips for data science hiring. What aspirants should know about the jobs?
- Insights presented using real-world examples
How Data Science can help Understand your Customers BetterGanes Kesari
This was presented at the AT&T Retirees Quarterly ELATE Luncheon, on Sep 18th, 2019.
SESSION BRIEF:
Most organizations struggle to understand their customers. In a digital world, the power of data and technology is not tapped into. So, customer advocacy initiatives are short-sighted, transactional and unscientific. This session will show how organizations can listen to customers better. It will introduce you to AI techniques that are revolutionizing customer intelligence.
With examples, you will understand how these insights can be translated into business decisions.
LEARNING OBJECTIVES:
1. You will learn creative ways to find what customers are looking for right now
2. You will be introduced to advanced analytics techniques and storytelling with data
3. You will understand how data science can be applied for business decisions
Chatty Kathy - UNC Bootcamp Final Project Presentation - Final Version - 5.23...John Andrews
SlideShare Description for "Chatty Kathy - UNC Bootcamp Final Project Presentation"
Title: Chatty Kathy: Enhancing Physical Activity Among Older Adults
Description:
Discover how Chatty Kathy, an innovative project developed at the UNC Bootcamp, aims to tackle the challenge of low physical activity among older adults. Our AI-driven solution uses peer interaction to boost and sustain exercise levels, significantly improving health outcomes. This presentation covers our problem statement, the rationale behind Chatty Kathy, synthetic data and persona creation, model performance metrics, a visual demonstration of the project, and potential future developments. Join us for an insightful Q&A session to explore the potential of this groundbreaking project.
Project Team: Jay Requarth, Jana Avery, John Andrews, Dr. Dick Davis II, Nee Buntoum, Nam Yeongjin & Mat Nicholas
Adjusting primitives for graph : SHORT REPORT / NOTESSubhajit Sahu
Graph algorithms, like PageRank Compressed Sparse Row (CSR) is an adjacency-list based graph representation that is
Multiply with different modes (map)
1. Performance of sequential execution based vs OpenMP based vector multiply.
2. Comparing various launch configs for CUDA based vector multiply.
Sum with different storage types (reduce)
1. Performance of vector element sum using float vs bfloat16 as the storage type.
Sum with different modes (reduce)
1. Performance of sequential execution based vs OpenMP based vector element sum.
2. Performance of memcpy vs in-place based CUDA based vector element sum.
3. Comparing various launch configs for CUDA based vector element sum (memcpy).
4. Comparing various launch configs for CUDA based vector element sum (in-place).
Sum with in-place strategies of CUDA mode (reduce)
1. Comparing various launch configs for CUDA based vector element sum (in-place).
Opendatabay - Open Data Marketplace.pptxOpendatabay
Opendatabay.com unlocks the power of data for everyone. Open Data Marketplace fosters a collaborative hub for data enthusiasts to explore, share, and contribute to a vast collection of datasets.
First ever open hub for data enthusiasts to collaborate and innovate. A platform to explore, share, and contribute to a vast collection of datasets. Through robust quality control and innovative technologies like blockchain verification, opendatabay ensures the authenticity and reliability of datasets, empowering users to make data-driven decisions with confidence. Leverage cutting-edge AI technologies to enhance the data exploration, analysis, and discovery experience.
From intelligent search and recommendations to automated data productisation and quotation, Opendatabay AI-driven features streamline the data workflow. Finding the data you need shouldn't be a complex. Opendatabay simplifies the data acquisition process with an intuitive interface and robust search tools. Effortlessly explore, discover, and access the data you need, allowing you to focus on extracting valuable insights. Opendatabay breaks new ground with a dedicated, AI-generated, synthetic datasets.
Leverage these privacy-preserving datasets for training and testing AI models without compromising sensitive information. Opendatabay prioritizes transparency by providing detailed metadata, provenance information, and usage guidelines for each dataset, ensuring users have a comprehensive understanding of the data they're working with. By leveraging a powerful combination of distributed ledger technology and rigorous third-party audits Opendatabay ensures the authenticity and reliability of every dataset. Security is at the core of Opendatabay. Marketplace implements stringent security measures, including encryption, access controls, and regular vulnerability assessments, to safeguard your data and protect your privacy.
As Europe's leading economic powerhouse and the fourth-largest hashtag#economy globally, Germany stands at the forefront of innovation and industrial might. Renowned for its precision engineering and high-tech sectors, Germany's economic structure is heavily supported by a robust service industry, accounting for approximately 68% of its GDP. This economic clout and strategic geopolitical stance position Germany as a focal point in the global cyber threat landscape.
In the face of escalating global tensions, particularly those emanating from geopolitical disputes with nations like hashtag#Russia and hashtag#China, hashtag#Germany has witnessed a significant uptick in targeted cyber operations. Our analysis indicates a marked increase in hashtag#cyberattack sophistication aimed at critical infrastructure and key industrial sectors. These attacks range from ransomware campaigns to hashtag#AdvancedPersistentThreats (hashtag#APTs), threatening national security and business integrity.
🔑 Key findings include:
🔍 Increased frequency and complexity of cyber threats.
🔍 Escalation of state-sponsored and criminally motivated cyber operations.
🔍 Active dark web exchanges of malicious tools and tactics.
Our comprehensive report delves into these challenges, using a blend of open-source and proprietary data collection techniques. By monitoring activity on critical networks and analyzing attack patterns, our team provides a detailed overview of the threats facing German entities.
This report aims to equip stakeholders across public and private sectors with the knowledge to enhance their defensive strategies, reduce exposure to cyber risks, and reinforce Germany's resilience against cyber threats.
Techniques to optimize the pagerank algorithm usually fall in two categories. One is to try reducing the work per iteration, and the other is to try reducing the number of iterations. These goals are often at odds with one another. Skipping computation on vertices which have already converged has the potential to save iteration time. Skipping in-identical vertices, with the same in-links, helps reduce duplicate computations and thus could help reduce iteration time. Road networks often have chains which can be short-circuited before pagerank computation to improve performance. Final ranks of chain nodes can be easily calculated. This could reduce both the iteration time, and the number of iterations. If a graph has no dangling nodes, pagerank of each strongly connected component can be computed in topological order. This could help reduce the iteration time, no. of iterations, and also enable multi-iteration concurrency in pagerank computation. The combination of all of the above methods is the STICD algorithm. [sticd] For dynamic graphs, unchanged components whose ranks are unaffected can be skipped altogether.
3. 3
INTRODUCTION
Ganes Kesari
Co-founder & Head
of Analytics
“Simplify Data
Science for all”
100+ Clients
Insights as Stories
Help apply & adopt
Analytics
Our data science platform,
Gramex is now open-sourced!
4. 4
“ 80% of analytics insights will not deliver business
outcomes through 2022.
- Gartner, Jan 2019
TODAY, WE ARE IN THE AGE OF AI, BUT..
5. 5
HOW NOT TO START YOUR AI JOURNEY
Photo by Sean Patrick Murphy on Unsplash
9. 9
THE 3 STAGES TO ORGANIZATIONAL DATA SCIENCE MATURITY
Kazia89636 on Flickr
10. 10
• Start from the top
• Align with strategic priorities
• Build a data science roadmap
OrgSizeSpecialization&
“Experiment”
PHASE 1: “EXPERIMENT”
11. 11
ASK EXECUTIVES FOR THEIR TIME, NOT JUST THEIR BUDGET
Stakeholder
groups
Objectives Initiatives Questions Data
have a set of that can be met by which answer specific using
for that meet that can address suggests
Data driven approach
Impact
Revenue impact
Breadth of usage
Effort reduction
Prioritised initiatives
Business driven approach1
2
Feasibility
Data availability
Technology feasibility
Budget availability
High
Med
Low
‘Can live with it’
Urgency
‘Starting to hurt’
‘As of yesterday’
Deferred
Quick wins
Strategic
Evaluate
Evaluate
13. 13
WHAT SKILLS DO YOU NEED?
X
• Start with Generalists
• Breadth, more than depth
• Strong business alignment
• Curiosity
• Learn on the go
https://hackernoon.com/how-not-to-hire-your-first-data-scientist-34f0f56f81ae
14. 14
WHAT TOOLS DO YOU NEED?
Alteryx
Amazon EC2
Azure ML
BigQuery
Birst
Caffe
Cassandra
Cloud Compute
Cloudera
Cognos
CouchDB
D3
Decision tree
ElasticSearch
Excel
Gephi
ggplot2
Hadoop
HP Vertica
IBM Watson
Impala
Julia
Jupyter Notebook
Kafka
Kibana
Kinesis
Lambda
Leaflet
Logstash
MapR
MapReduce
Matplotlib
Microstrategy
MongoDB
NodeXL
Pandas
Pentaho
Pivotal
PowerPoint
Power BI
Qlikview
R
R Studio
Random Forest
Redis
Redshift
Regression
Revolution R
S3
SAP Hana
SAS
Spark
Spotfire
SPSS
SQL Server
Stanford NLP
Storm
SVM
Tableau
TensorFlow
Teradata
Theano
Thrift
Torch
Weka
Word2Vec
The tool does not matter. A person’s skill with the tool does.
Pick the person. Let them pick the tool.
15. 15
• Start from the top
• Align with strategic priorities
• Build a data science roadmap
• Get the data right
• Start with generalists
• The tool doesn’t matter
• Organize as a central AI ‘hub’
OrgSizeSpecialization&
“Experiment”
PHASE 1: “EXPERIMENT”
16. 16
“ Start where you are. Use what you have. Do what
you can
- Arthur Ashe
18. 18
PHASE 2: “EXPAND”
• Transition from pilots to
projects
• Map deeper with chosen
Business units
• Extend relationship with
sponsors
• Expand your data footprint
Time
OrgSizeSpecialization&
- Generalists with many broad skills
- Teams organized by initiatives
- “Just get it done”
“Experiment” “Expand”
19. 19
WHAT’S HOLDING BACK COMPANIES AT THIS STAGE?
https://www.oreilly.com/data/free/ai-adoption-in-the-enterprise.csp
20. 20
WHAT SKILLS ARE NEEDED?
Deep
Domain Expertise
Information
Design &
Presentation
Deep
Programming
Statistics & Machine
Learning
Data Bootstrap
Skills
Passion for data Data handling
Design basics
Domain awareness
27. 27
PHASE 2: “EXPAND”
• Plan skill-based teams
• Evolve your execution modelTime
OrgSizeSpecialization&
- Generalists with many broad skills
- Teams organized by initiatives
- “Just get it done”
“Experiment” “Expand”
• Transition from pilots to
projects
• Map deeper with chosen
Business units
• Extend relationship with
sponsors
• Expand your data footprint
• Bring in the specialists
28. 28
“If you only do things where you know the answer
in advance, your company goes away.
- Jeff Bezos, Amazon
30. 30
PHASE 3: “INTEGRATE”
“Expand” “Integrate”
Time
OrgSizeSpecialization&
- Start adding few specialists
- Sprouting of skill-based teams
- “Introduce process, but stay nimble”
(Pic/Icons Credits: José-Manuel Benito/wiki, OpenClipart-Vectors/27440 images, pngtree.com, ClipartPanda.com, macrovector/Freepik)
• Insights business-as-usual
• Diffused org-wide
31. 31Source: “Building the AI Powered Organization”, HBR, Aug 2019
ORGANIZING FOR SCALE: HUB-AND-SPOKE MODEL
Hub
Central group headed by a C-level analytics executive
Spoke
Market-facing Business unit that owns & manages the AI product
Gray area
Work with overlapping responsibilities
Execution teams
Dynamic teams assembled from the hub, spoke & gray area
32. 32
UNCOVER YOUR DARK DATA
Source: http://www.patrickcheesman.com/dark-data-problems-and-solutions/
• INACCESSIBLE data (e.g. technology is outdated)
• FORGOTTEN data (e.g. collected, but not actively used)
• UNCOLLECTED data (e.g. information exists, not digitized)
• SINGLE PURPOSE data (e.g. used for a specific purpose)
33. 33
Data is the product
IT is the key enabler
Tools are the differentiator
Insight is the product
Analysis is the key enabler
Skills are the differentiator
Action is the product
Culture is the key enabler
Process is the differentiator
INCULCATE A DATA CULTURE
Data Science for Business, by Foster Provost & Tom Fawcett, O’Reilly
34. 34Source: Peter Skomoroch – Why machine learning is harder than you think, Strata London 2019
AMAZON, GOOGLE, MICROSOFT ARE REORGANIZING THEMSELVES AROUND AI
35. 35
PHASE 3: “INTEGRATE”
“Expand” “Integrate”
Time
OrgSizeSpecialization&
- Start adding few specialists
- Sprouting of skill-based teams
- “Introduce process, but stay nimble”
(Pic/Icons Credits: José-Manuel Benito/wiki, OpenClipart-Vectors/27440 images, pngtree.com, ClipartPanda.com, macrovector/Freepik)
• Analytics business-as-usual
• Diffused org-wide
• Hub-and-spoke model
• Enable continuous change
• Setup experimentation labs
• ”Excel at mature execution”
36. 36
“ Perfection is not attainable, but if we chase
perfection, we can catch excellence
- Vince Lombardi
38. 38
WRAP-UP – SCALING WITH AI: 3 STAGES OF MATURITY
“Experiment” “Expand” “Integrate”
Time
OrgSizeSpecialization&
- Generalists with many broad skills
- Teams organized by initiatives
- “Just get it done”
- Start adding few specialists
- Sprouting of skill-based teams
- “Introduce process, but stay nimble”
- Mature business units with specialists
- Data Culture
- Data science diffused org-wide
- “Excel at mature execution”