
![Blog.mp3monster.org @mp3monster ‹#›
© 2021 Phil Wilkins. All rights reserved.
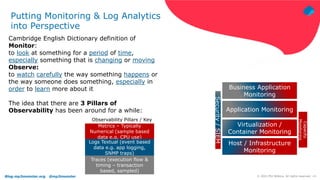
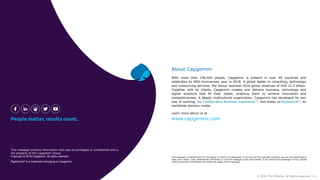
Fluentd Config Example – Node 1
<system>
Log_Level info
</system>
#### begin - tail basic file
<source>
@type tail
path ./Chapter6/basic-file.txt
read_lines_limit 5
tag basicFile
pos_file ./Chapter6/basic-file-read.pos_file
read_from_head true
<parse>
@type json
</parse>
@label labelPipeline
</source>
#### end - file 1
#### begin - tail basic-file2
<source>
@type tail
path ./Chapter6/basic-file2.txt
read_lines_limit 5
tag basicFILE2
pos_file ./Chapter6/basic-file-
read2.pos_file
read_from_head true
<parse>
@type json
</parse>
@label forwarder
</source>
#### end - tail basic-file2
<label labelPipeline>
align naming
<filter *>
@type record_transformer
<record>
message ${record["event"]}
transformed yes
event -
</record>
</filter>
#### begin - file out 1
<match *>
@type copy
<store>
@type file
path ./Chapter6/label-pipeline-file-output
<buffer>
delayed_commit_timeout 10
flush_at_shutdown true
chunk_limit_records 50
flush_interval 15
flush_mode interval
</buffer>
<format>
@type out_file
delimiter comma
output_tag true
</format>
</store>
<store>
@type relabel
@label forwarder
</store>
</match>
</label>
<label forwarder>
<match *>
@type forward
buffer_type memory
flush_interval 5s
<server>
host 127.0.0.1
port 28080
</server>
</match>
</label>](https://image.slidesharecdn.com/howfluentdfitsintothemodernsoftwarelandscape-210420230741/85/How-fluentd-fits-into-the-modern-software-landscape-13-320.jpg)
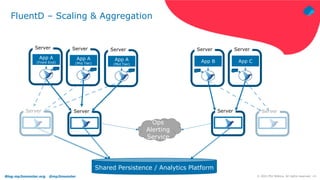
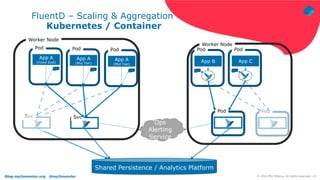
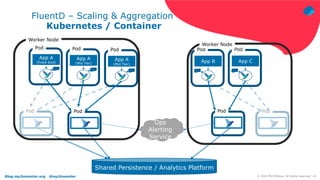
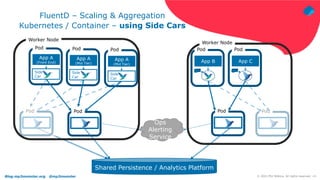
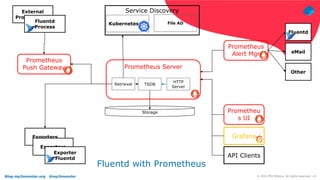
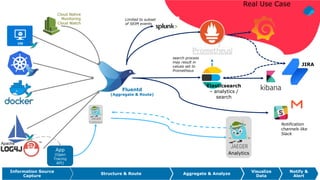


The document discusses using Fluentd to manage logs. It provides an overview of Fluentd, including how it can aggregate and route logs from multiple sources to various outputs like Elasticsearch. It also discusses approaches to scaling Fluentd in distributed environments like Kubernetes, including using sidecars. Real-world challenges with log management are addressed, such as the need to consolidate logs from many distributed services and support multiple analytics tools.


![[March sn meetup] apache pulsar + apache nifi for cloud data lake](https://cdn.slidesharecdn.com/ss_thumbnails/marchsnmeetupapachepulsarapachenififorclouddatalake-220311125943-thumbnail.jpg?width=640&height=640&fit=bounds)