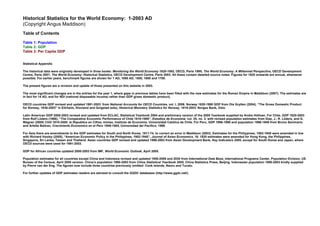
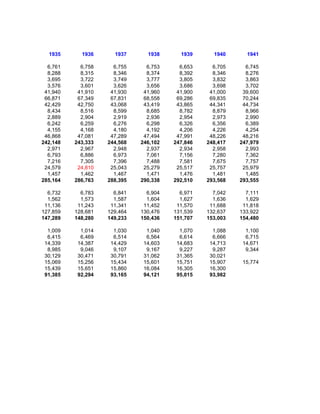
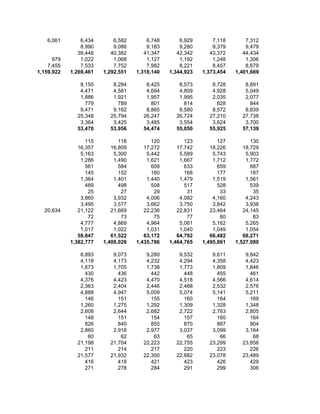
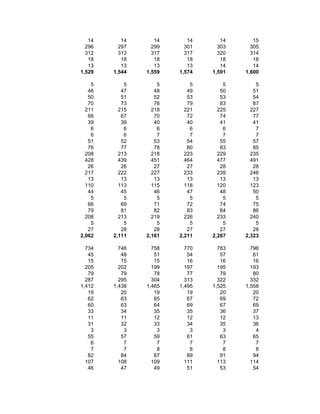
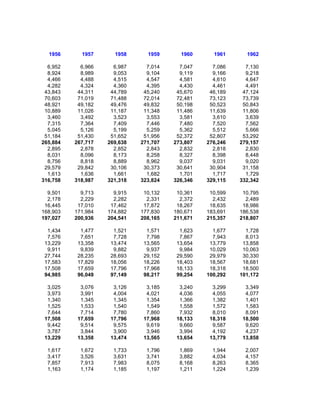
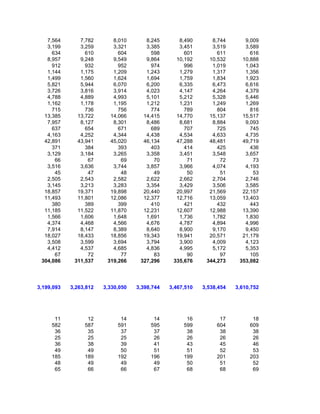
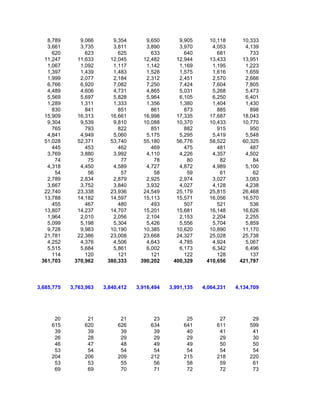
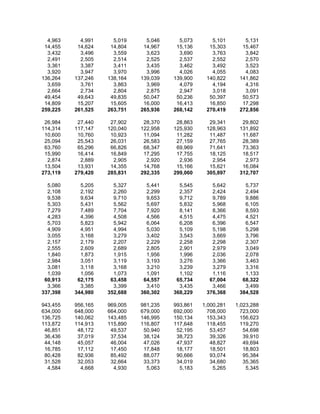
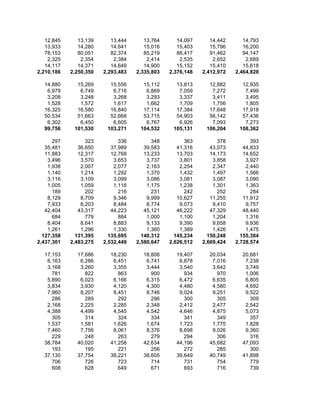
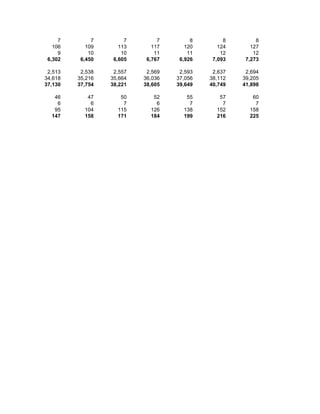
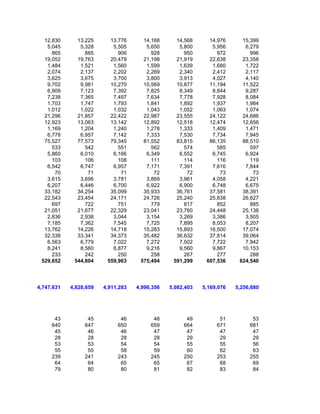
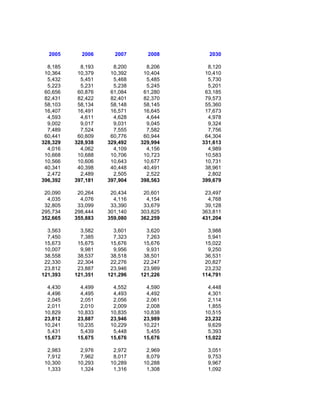
1. Historical Statistics for the World Economy: 1-2003 AD
(Copyright Angus Maddison)
Table of Contents
Table 1: Population
Table 2: GDP
Table 3: Per Capita GDP
Statistical Appendix
The historical data were originally developed in three books: Monitoring the World Economy 1820-1992, OECD, Paris 1995; The World Economy: A Millennial Perspective, OECD Development
Centre, Paris 2001; The World Economy: Historical Statistics, OECD Development Centre, Paris 2003. All these contain detailed source notes. Figures for 1820 onwards are annual, whereever
possible. For earlier years, benchmark figures are shown for 1 AD, 1000 AD, 1500, 1600 and 1700.
The present figures are a revision and update of those presented on this website in 2003.
The most significant changes are in the entries for the year 1, where gaps in previous tables have been filled with the new estimates for the Roman Empire in Maddison (2007). The estimates are
in fact for 14 AD, and for NDI (national disposable income) rather than GDP gross domestic product).
OECD countries GDP revised and updated 1991-2003 from National Accounts for OECD Countries, vol. I, 2006. Norway 1820-1990 GDP from Ola Grytten (2004), “The Gross Domestic Product
for Norway, 1830-2003” in Eitrheim, Klovland and Qvigstad (eds), Historical Monetary Statistics for Norway, 1819-2003, Norges Bank, Oslo.
Latin American GDP 2000-2003 revised and updated from ECLAC, Statistical Yearbook 2004 and preliminary version of the 2005 Yearbook supplied by Andre Hofman. For Chile, GDP 1820-2003
from Rolf Lűders (1998), “The Comparative Economic Performance of Chile 1810-1995”, Estudios de Economia, vol. 25, no. 2, with revised population estimates from Diaz, J., R. Lűders, and G.
Wagner (2005) Chili 1810-2000: la Republica en Cifras, mimeo, Instituto de Economia, Universidad Católica de Chile. For Peru, GDP 1896-1990 and population 1896-1949 from Bruno Seminario
and Arlette Beltran, Crecimiento Economico en el Peru 1896-1995, Universidad del Pacifico, 1998.
For Asia there are amendments to the GDP estimates for South and North Korea, 1911-74, to correct an error in Maddison (2003). Estimates for the Philippines, 1902-1940 were amended in line
with Richard Hooley (2005), “American Economic Policy in the Philippines, 1902-1940”, Journal of Asian Economics, 16. 1820 estimates were amended for Hong Kong, the Philippines,
Singapore, Sri Lanka, Taiwan and Thailand. Asian countries GDP revised and updated 1998-2003 from Asian Development Bank, Key Indicators 2005, except for South Korea and Japan, where
OECD sources were used for 1991-2003.
GDP for African countries updated 2000-2003 from IMF, World Economic Outlook, April 2005.
Population estimates for all countries except China and Indonesia revised and updated 1950-2008 and 2030 from International Data Base, International Programs Center, Population Division, US
Bureau of the Census, April 2005 version. China’s population 1990-2003 from China Statistical Yearbook 2005, China Statistics Press, Beijing. Indonesian population 1950-2003 kindly supplied
by Pierre van der Eng. The figures now include three countries previously omitted: Cook Islands, Nauru and Tuvalu.
For further updates of GDP estimates readers are advised to consult the GGDC databases (http://www.ggdc.net/).
2. Population
(000 at mid-year)
1 1000 1500 1600
Western Europe
Austria 500 700 2,000 2,500
Belgium 300 400 1,400 1,600
Denmark 180 360 600 650
Finland 20 40 300 400
France 5,000 6,500 15,000 18,500
Germany 3,000 3,500 12,000 16,000
Italy 8,000 5,000 10,500 13,100
Netherlands 200 300 950 1,500
Norway 100 200 300 400
Sweden 200 400 550 760
Switzerland 300 300 650 1,000
United Kingdom 800 2,000 3,942 6,170
Total 12 Western Europe 18,600 19,700 48,192 62,580
Ireland 800 1,000
Greece 2,000 1,000 1,000 1,500
Portugal 400 600 1,000 1,100
Spain 3,750 4,000 6,800 8,240
Total 13 small WEC 300 260 276 358
Total 29 Western Europe 25,050 25,560 57,268 73,778
Western Offshoots
Australia 360 400 450 450
New Zealand 0 10 100 100
Canada 80 160 250 250
United States 680 1,300 2,000 1,500
Total Western Offshoots 1,120 1,870 2,800 2,300
Eastern Europe
Albania 200 200 200 200
Bulgaria 500 800 800 1,250
Czechoslovakia 1,000 1,250 3,000 4,500
Hungary 300 500 1,250 1,250
Poland 450 1,200 4,000 5,000
Romania 800 800 2,000 2,000
Yugoslavia 1,500 1,750 2,250 2,750
Total 7 East European Countries 4,750 6,500 13,500 16,950
Yugoslav and Czech Successor states
Bosnia
Croatia
Macedonia
Slovenia
Serbia/Montenegro
Former Yugoslavia
Czech Republic
Slovakia
Former Czechoslovakia
Successor Republics of USSR
Armenia
Azerbaijan
Belarus
Estonia
3. Georgia
Kazakhstan
Kyrgyzstan
Latvia
Lithuania
Moldova
Russian Federation
Tajikistan
Turkmenistan
Ukraine
Uzbekistan
Total Former USSR 3,900 7,100 16,950 20,700
8 Latin American countries
Argentina
Brazil 700 1,000 800
Chile
Colombia
Mexico 2,200 4,500 7,500 2,500
Peru 3,000 4,000 1,300
Uruguay
Venezuela
Total 8 Latin American countries
15 Latin American countries
Bolivia
Costa Rica
Cuba
Dominican Republic
Ecuador
El Salvador
Guatemala
Haïti
Honduras
Jamaica
Nicaragua
Panama
Paraguay
Puerto Rico
Trinidad and Tobago
Total 15 Latin American countries
Total 24 small Caribbean countries
Total Latin America 5,600 11,400 17,500 8,600
16 East Asian countries
China 59,600 59,000 103,000 160,000
India 75,000 75,000 110,000 135,000
Indonesia 2,800 5,200 10,700 11,700
Japan 3,000 7,500 15,400 18,500
Philippines
South Korea
Thailand
Taiwan
Bangladesh
Burma
Hong Kong
4. Malaysia
Nepal
Pakistan
Singapore
Sri Lanka
Total 16 East Asian countries
29 East Asian countries
Afghanistan
Cambodia
Laos
Mongolia
North Korea
Vietnam
Total 23 Small East Asian countries
Total 29 East Asian countries
15 West Asian countries
Bahrain
Iran 4,000 4,500 4,000 5,000
Iraq 1,000 2,000 1,000 1250
Israel
Jordan
Kuwait
Lebanon
Oman
Qatar
Saudi Arabia
Syria
Turkey 8,000 7,000 6,300 7,900
United Arab Emirates
Yemen
West Bank and Gaza
Total 15 West Asian countries 19,400 20,000 17,800 21,400
Total Asia 168,400 182,600 283,800 378,500
57 African countries
Algeria 2,000 2,000 1,500 2,250
Angola
Benin
Botswana
Burkina Faso
Burundi
Cameroon
Cape Verde
Central African Republic
Chad
Comoro Islands
Congo
Côte d'Ivoire
Djibouti
Egypt 4,500 5,000 4,000 5,000
Equatorial Guinea
Eritrea and Ethiopia 500 1,000 2,000 2,250
Gabon
Gambia
5. Ghana
Guinea
Guinea Bissau
Kenya
Lesotho
Liberia
Libya 400 500 500 500
Madagascar 0 200 700 800
Malawi
Mali
Mauritania
Mauritius
Morocco 1,000 2,000 1,500 2,250
Mozambique 50 300 1,000 1,250
Namibia
Niger
Nigeria
Reunion
Rwanda
São Tomé and Principe
Senegal
Seychelles
Sierra Leone
Somalia 200 400 800 800
South Africa 100 300 600 700
Sudan 2,000 3,000 4,000 4,200
Swaziland
Tanzania
Togo
Tunisia 800 1,000 800 1,000
Uganda
Zaire
Zambia
Zimbabwe
Total 3 Small African countries
Total Africa 17,000 32,300 46,610 55,320
World Total 225,820 267,330 438,428 556,148
Composition of the Small Country Groups
Andorra
Cyprus
Faeroe Islands
Gibraltar
Greenland
Guernsey
Iceland
Isle of Man
Jersey
6. Liechtenstein
Luxembourg
Malta
Monaco
San Marino
Total 13 small WEC countries
Anguilla
Antigua & Barbuda
Aruba
Bahamas
Barbados
Belize
Bermuda
British Virgin Islands
Cayman Islands
Dominica
Grenada
Guadeloupe
Guyana
Guyana (Fr.)
Martinique
Montserrat
Neth. Antilles
St. Kitts Nevis
St. Pierre and Miquelon
St. Vincent
St.Lucia
Suriname
Turks and Caicos Islands
Virgin Islands
Total 24 small Caribbean countries
Bhutan
Brunei
Cook Islands
Macao
Maldives
Fiji
Papua New Guinea
American Samoa
French Polynesia
Guam
Kiribati
Marshall Islands
Micronesia
Nauru
New Caledonia
Northern Mariana Islands
Palau
Samoa
Solomon Islands
Tonga
7. Tuvalu
Vanuatu
Wallis and Fortuna
Total 23 Small East Asian countries
Eritrea
Ethiopia
Total Eritrea and Ethiopia
Mayotte
Saint Helena
Western Sahara
Total 3 Small African countries