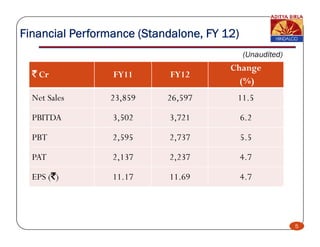
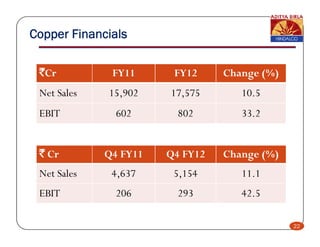
This presentation provides an overview of Hindalco Industries' financial and operational performance in fiscal year 2012. Some key points:
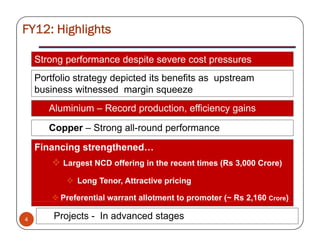
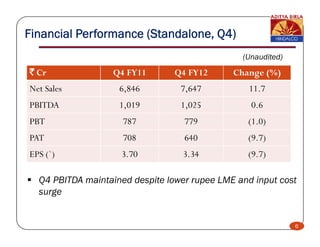
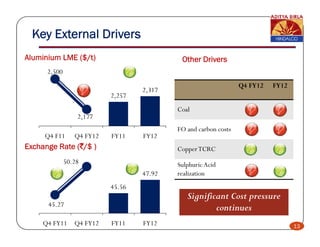
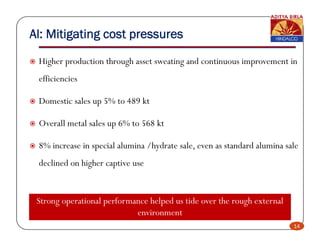
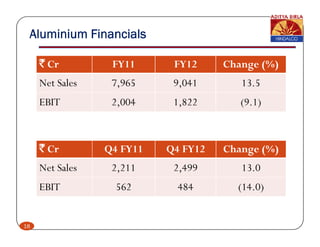
- Hindalco achieved strong financial results despite severe cost pressures from rising coal, fuel, and input costs. Its portfolio strategy helped as upstream aluminum business faced margin squeeze.
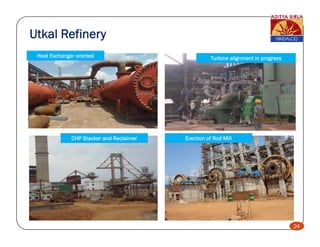
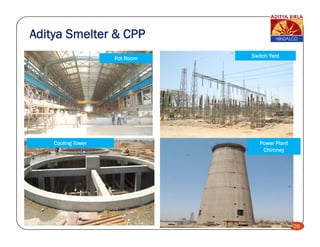
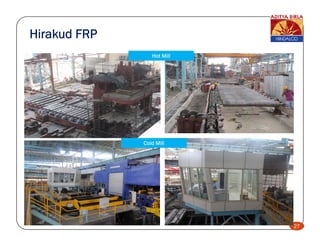
- Major projects like the Utkal alumina refinery, Mahan smelter and CPP, Aditya smelter and CPP, and Hirakud FRP plant are in advanced construction stages.
- Hindalco strengthened its financing through a large NCD offering and preferential warrant allotment to its promoter.
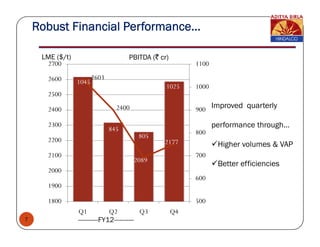
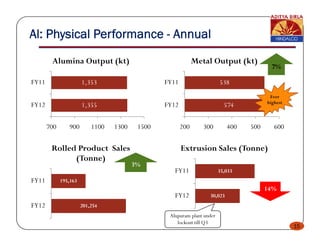
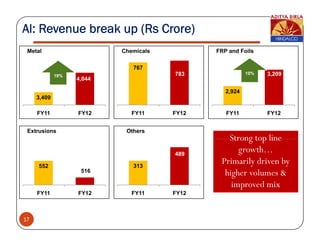
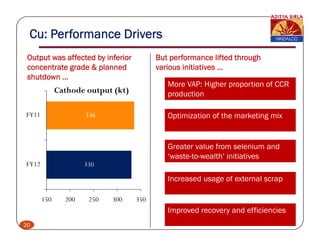
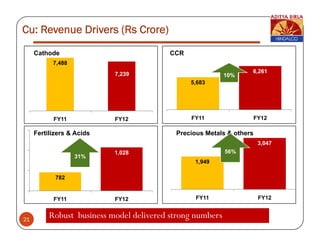
- The aluminum and copper businesses delivered improved production efficiencies and volumes compared