MART 2016 |Business Insight
BAKI SAKİNLƏRİNİN
HƏYAT TƏRZİ
ARAŞDIRMA HESABATI
2.
Business Insight ESOMARÜmumdünya Marketinq və Araşdırma
Mütəxəssisləri Assosiasiyasının üzvüdür
Business Insight bütün marketinq, sosial araşdırmaları və promo
kampaniyaları ICC/ESOMAR-ın Marketinq və Sosial Araşdırma
Təcrübəsi üzrə Məcəlləsində öz əksini tapan ən yüksək peşəkar və etik
standartlara və ISO 20252 beynəlxalq standartının tələblərinə müvafiq
olaraq həyata keçirir.
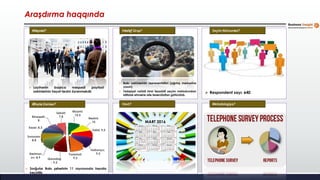
Məqsəd? Hədəf Qrup?Seçim Nümunəsi?
Əhatə Dairəsi? Vaxt? Metodologiya?
Araşdırma haqqında
Respondent sayı: 640
Layihənin başlıca məqsədi paytaxt
sakinlərinin həyat tərzini öyrənməkdir
Bakı sakinlərinin reprezentativi (ağırlıq mərkəzinə
yaxın)
Tədqiqat vahidi kimi təsadüfi seçim metodundan
istifadə etməklə ailə təsərrüfatları götürülüb.
Sorğular Bakı şəhərinin 11 rayonunda həyata
keçirilib
MART 2016
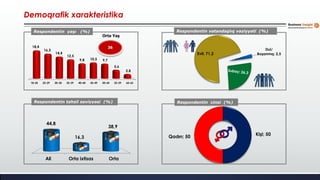
Nizami;
10,5
Nəsimi;
10
Xətai; 9,5
Sabunçu;
9,5Yasamal;
9,5Qaradağ
; 9,2
Nəriman
ov; 8,9
Suraxanı;
8,8
Xəzər; 8,3
Binəqədi;
8
Səbail;
7,8
5.
Respondentin vətəndaşlıq vəziyyəti(%)
Respondentin cinsi (%)
18-24 25-29 30-34 35-39 40-44 45-49 50-54 55-59 60-65
18,4
16,3
14,4
12,5
9,8 10,5 9,7
5,6
2,8
36
Respondentin yaşı (%)
Orta Yaş
Demoqrafik xarakteristika
Ali Orta ixtisas Orta
44,8
16,3
38,9
Respondentin təhsil səviyyəsi (%)
Evli; 71,2
Dul/
Boşanmış; 2,5
Kişi; 50Qadın; 50
Sorğuya cəlb olunanların43,1 faizi işlədiyini qeyd edib
Bəli; 43,1
Xeyr; 23,6
Tələbə; 9,8
Evdar
xanım; 20,0
Hazırda işləyirsinizmi? (%)
Baza: 640
Bina ;
60
Həyət
Evi; 40
Siz neçənci mərtəbədə yaşayırsınız? (%)
13,7
19,6
16,4
14,8
10,5
5,6 5,6 5,9
3,8
,8 ,5 1,1
,3 ,3 ,8 ,3
Baza: 384
Baza: 640
8.
Cavab verməyə çətinlikçəkirəm
Digər
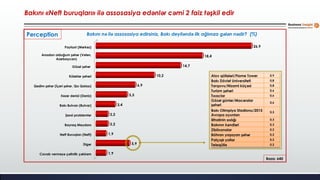
Neft Buruqları (Neft)
Bayraq Meydanı
Şəxsi problemlər
Bakı Bulvarı (Bulvar)
Xəzər dənizi (Dəniz)
Qədim şəhər (İçəri şəhər, Qız Qalası)
Küləklər şəhəri
Gözəl şəhər
Anadan olduğum şəhər (Vətən,
Azərbaycan)
Paytaxt (Mərkəz)
1,9
5,9
1,9
2,2
2,2
3,4
5,5
6,9
10,2
14,7
18,4
26,9
Bakını «Neft buruqları» ilə assosasiya edənlər cəmi 2 faiz təşkil edir
Bakını nə ilə assosasiya edirsiniz, Bakı deyiləndə ilk ağlınıza gələn nədir? (%)
Baza: 640
Alov qüllələri/Flame Tower 0,9
Bakı Dövlət Universiteti 0,8
Tarqovu/Nizami küçəsi 0,8
Turizm şəhəri 0,6
Tıxaclar 0,6
Gözəl günlər/Macəralar
şəhəri
0,6
Bakı Olimpiya Stadionu/2015
Avropa oyunları
0,3
Əhalinin sıxlığı 0,3
Bakının kəndləri 0,3
Zibilxanalar 0,2
Böhran yaşayan şəhər 0,2
Palçıqlı yollar 0,2
Teleqüllə 0,2
Perception
9.
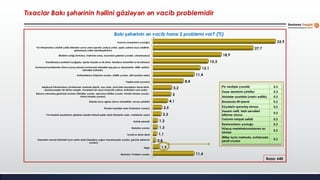
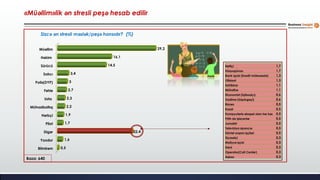
Tıxaclar Bakı şəhərininhəllini gözləyən ən vacib problemidir
Bakı şəhərinin ən vacib hansı 2 problemi var? (%)
Baza: 640
Bilmirəm/ Problem yoxdur
Digər
Gənclərin normal istirahəti üçün yerlər azdır (Uşaqlara uyğun meydançalar yoxdur, gənclər şəhərciyi
yoxdur)
İçməli su təmiz deyil
Radarlar çoxdur
Bahalı şəhərdir
Yol hərəkəti qaydalarını göstərən işarələr kifayət qədər deyil (Radarlar azdır, svetaforlar azdır)
Piyada keçidləri azdır (Tratuarlar yoxdur)
Bakıda hava ağırdır (Hava rütubətlidir, havası çirklidir)
Bakının memarlıq görünüşü korlanır (Tikintilər çoxdur, qanunsuz tikililər çoxalır, hündür binalar çoxdur,
köhnə binalar çoxdur)
Nəqliyyat İnfrastrukturu (Avtobuslar vaxtında işləmir, sayı azdır, sürücüləri qaydalara riayət etmir,
dayanacaqları bir-birinə uzaqdır, ünvanlara bir neçə marşrutla çatırıq, metroların sayı azdır)
Yaşıllıq azdır (yoxdur)
Antisanitariya (Süpürən yoxdur, zibillik çoxdur, zibil qutuları azdır)
Kommunal problemlər (Hava soyuq olanda kommunal xidmətlər-işıq,qaz,su dayandırılır, istilik verilmir,
xidmətlər bahadır)
Kanalizasiya problemi (yağışda, qarda küçələr su ilə dolur, binaların zirzəmiləri su ilə doludur)
Əhalinin sıxlığı (Avtobus, metroda sıxlıq, rayondan gələnlər çoxalıb, urbanizasiya)
Yol infrastrukturu (Asfalt çəkib bitəndən sonra yenə qazırlar, palçıq yollar, qışda yolların buzu əridilmir,
şəhərkənarı yollar abadlaşdırılmır)
Tıxaclar (maşınların çoxluğu)
11,4
1,9
0,8
1,1
1,3
1,3
2,3
2,5
4,1
5
5,2
8,4
11,4
13,1
15,3
18,9
27,7
33,9
Pis vərdişlər çoxalıb 0,3
Xəzər dənizinin çirkliliyi 0,3
Abidələr azaldılıb (məhv edilib) 0,2
Binalarda lift işləmir 0,2
Küçələrin qaranlıq olması 0,2
Xəzərin nefti, təbii sərvətləri
istismar olunur
0,2
Turizmin inkişafı zəifdir 0,2
Restoranların çoxluğu 0,2
Hüquq məsləhətxanalarının az
olması
0,2
Əlillər üçün metroda, avtobusda
şərait yoxdur
0,2
10.
Çətinlik çəkirəm
Heç biri
Digər
8km topdan bazar
Aygün City
Port Baku Mall
Laçın TM
Metropark
"Торговая" (Nizami küçəsi)
Park Bulvar
Sədərək/ Binə TM
28 Mall
6,1
,2
4,7
1,3
1,7
1,9
3,6
5,2
6,3
14,8
22,3
32,0
Bakının ən yaxşı alış-veriş mərkəzi hansıdır? (%)
Baza: 640
Baku Mall 0,8
Lotos TM 0,8
Sahil TM 0,6
Life Center 0,6
Suraxanı TM 0,5
Xəqani TM 0,3
Diqlas TM 0,2
Bakıxanov TM 0,2
Nərgiz TM 0,2
Xalqlar Dostluğu TM 0,2
Amay TM 0,2
Əhmədli TM 0,2
Günel TM 0,2
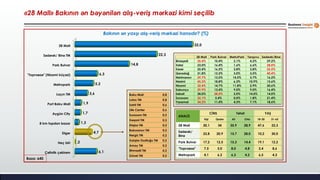
«28 Mall» Bakının ən bəyənilən alış-veriş mərkəzi kimi seçilib
ANALİZ
CİNS Təhsil YAŞ
Kişi Qadın Ali Orta 18-30 31-65
28 Mall 30,1 34 35,9 28,9 47,6 22,3
Sədərək/
Binə
23,8 20,9 15,7 28,0 10,2 30,0
Park Bulvar 17,2 12,5 15,3 14,4 19,1 12,2
"Торговая" 7,5 5,0 8,0 4,8 2,4 8,6
Metropark 4,1 6,2 6,3 4,2 6,5 4,3
28 Mall Park Bulvar MetroPark Tarqovu Sədərək/Binə
Binəqədi 35,4% 10,4% 2,1% 4,2% 29,2%
Xətai 23,0% 16,4% 1,6% 6,6% 28,0%
Xəzər 25,4% 16,5% 3,8% 3,8% 25,5%
Qaradağ 31,8% 15,2% 3,0% 3,5% 40,4%
Nərimanov 29,7% 13,5% 14,5% 3,7% 16,2%
Nəsimi 45,3% 18,8% 6,3% 10,9% 15,6%
Nizami 32,4% 14,7% 11,8% 2,9% 20,6%
Sabunçu 29,9% 13,4% 9,0% 9,0% 16,4%
Səbail 30,0% 28,0% 2,0% 14,0% 14,0%
Suraxanı 32,1% 5,4% 0,0% 1,8% 21,4%
Yasamal 34,3% 11,4% 4,3% 7,1% 18,6%
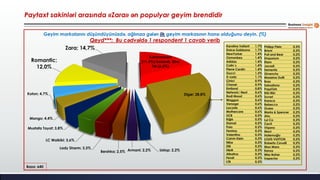
11.
Paytaxt sakinləri arasında«Zara» ən populyar geyim brendidir
Baza: 640
Geyim markalarını düşündüyünüzdə, ağlınıza gələn ilk geyim markasının hansı olduğunu deyin. (%)
Qeyd***: Bu cədvəldə 1 respondent 1 cavab verib
Xatırlamıram
(11,5%)/Sədərək, Binə
TM (6,5%)
Digər; 28,8%
Ustop; 2,2%Armani; 2,2%Bershka; 2,5%
Lady Sharm; 3,3%
LC Waikiki; 3,6%
Mustafa Tayat; 3,8%
Mango; 4,4%
Koton; 4,7%
Romantic;
12,0%
Zara; 14,7% Karolina Valiant 1,7%
Dolce Gabbana 1,7%
NewYorker 1,4%
Osmanbey 1,4%
Adidas 1,4%
Colin`s 1,4%
Pierre Cardin 1,4%
Gucci 1,3%
X-Lady 1,1%
Çinici 0,9%
Chanel 0,9%
Emiland 0,8%
Network/ Next 0,6%
Rodi Mood 0,6%
Waggon 0,6%
Versage 0,6%
Lacoste 0,6%
Mothercare 0,6%
UCB 0,5%
Kiğılı 0,5%
Damat 0,5%
Polo 0,3%
Femina 0,3%
Valentino 0,3%
Calvin Klein 0,3%
Nike 0,3%
Zilli 0,3%
H&M 0,3%
Albatros 0,3%
Fendi 0,3%
LTB 0,3%
Philipp Plein 0,3%
Brioni 0,3%
Pull and Bear 0,2%
Emporium 0,2%
Etam 0,2%
Jacadi 0,2%
Sementa 0,2%
Givenchy 0,2%
Massimo Dutti 0,2%
Boss 0,2%
Saksafona 0,2%
PaşaTürk 0,2%
Kiki Riki 0,2%
Suvari 0,2%
Karaca 0,2%
Rebecco 0,2%
Guess 0,2%
Marks & Spencer 0,2%
Ahu 0,2%
Lui Co 0,2%
Cecil 0,2%
Viqano 0,2%
Mavi 0,2%
Hatemoğlu 0,2%
LOUIS VUITTON 0,2%
Roberto Cavalli 0,2%
Max Mara 0,2%
Kenzo 0,2%
Miss Bahar 0,2%
Inspector 0,2%
12.
Geyim markalarını düşündüyünüzdə,ağlınıza gələn geyim markalarının hansılar
olduğunu deyin? (%)__Qeyd***: Bu cədvəldə isə 1 respondent bir neçə cavab verib
Geyim markası % Geyim markası % Geyim markası %
Zara 30,5% Femina 0,6% Max Mara 0,2%
Romantic 28,8% Valentino 0,6% Təkbir 0,2%
Mango 18,4% Emporium 0,6% Avantaj 0,2%
Koton 13,9% Zilli 0,6% United Sport 0,2%
LC Waikiki 13,6% Sisley 0,6% Oysho 0,2%
Lady Sharm 12,2% Defacto 0,5% Bebetto 0,2%
Bershka 11,6% Gap 0,5% Chicco 0,2%
Mustafa Tayat 10,8% Calvin Klein 0,5% Rebecco 0,2%
NewYorker 10,8% Dior 0,5% Marks & Spencer 0,2%
Osmanbey 9,5% Massimo Dutti 0,5% Vivian 0,2%
Çinici 8,8% H&M 0,5% Darkwin 0,2%
Ustop 7,8% Prada 0,5% Tom Klaim 0,2%
Karolina Valiant 6,9% Albatros 0,5% Ahu 0,2%
Rodi Mood 5,5% Guess 0,5% Lui Co 0,2%
Waggon 5,5% Damat 0,5% Karen Millen 0,2%
Dolce Gabbana 4,2% Philipp Plein 0,5% Max&Co. 0,2%
Armani 4,1% Etam 0,3% Selio 0,2%
Network/ Next 3,6% Boss 0,3% Cecil 0,2%
Gucci 3,0% Suvari 0,3% Viqano 0,2%
Colin`s 2,8% Karaca 0,3% Stradi Varius 0,2%
Emiland 2,7% Las Vegas 0,3% LOUIS VUITTON 0,2%
X-Lady 2,5% Fendy 0,3% Aldo 0,2%
Versage 2,5% Tom Ford 0,3% Roberto Cavalli 0,2%
Adidas 2,3% Mavi 0,3% Max Mara 0,2%
Chanel 2,2% Hatemoğlu 0,3% Özdilek 0,2%
Pierre Cardin 2,2% Brioni 0,3% Kenzo 0,2%
Nike 1,4% Jacadi 0,2% Kids World 0,2%
Pull and Bear 1,1% Ralph Lauren 0,2% Miss Bahar 0,2%
Mothercare 1,1% Sementa 0,2% Promod 0,2%
Polo 0,9% Givenchy 0,2% Ferrari 0,2%
U. C. OF BENETTON 0,9% Saksafona 0,2% Inspector 0,2%
Kiğılı 0,9% PaşaTürk 0,2% Greyder 0,2%
Lacoste 0,9% Garda 0,2% Jack and Jones 0,2%
LTB 0,9% Kiki Riki 0,2% Xatırlamıram (11,5%) /Sədərək Binə TM (6,5%) 18,0% Baza: 640
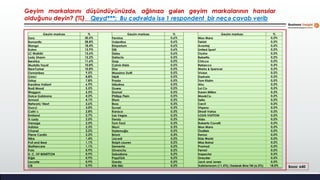
13.
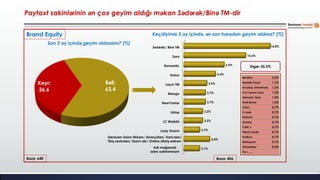
Paytaxt sakinlərinin ənçox geyim aldığı məkan Sədərək/Binə TM-dir
Adi mağazadı
adını xatırlamıram
Lady Sharm
LC Waikiki
Ustop
NewYorker
Mango
Laçın TM
Koton
Romantic
Zara
Sədərək/ Binə TM
2,7%
4,4%
2,7%
3,2%
3,2%
3,7%
3,7%
3,9%
5,4%
6,9%
10,6%
14,8%
Keçdiyimiz 3 ay içində, ən son haradan geyim aldınız? (%)
Bəli;
63,4
Xeyr;
36,6
Son 3 ay içində geyim aldınızmı? (%)
Baza: 406
Bershka 2,2%
Mustafa Tayat 1,7%
Ucuzluq, Univermaq 1,2%
8 km topdan bazar 1,2%
Network/ Next 1,0%
Rodi Mood 1,0%
Çinici 0,7%
X-Lady 0,7%
Defacto 0,7%
Armani 0,7%
Colin`s 0,7%
Pierre Cardin 0,7%
Podium 0,7%
Metropark 0,7%
Osmanbey 0,5%
Və s ......
Baza: 640
Dərziyəm özüm tikirəm/ Alverçidən/ Xaricdən/
Tikiş sexindən/ Qızım alır/ Online sifariş edirəm
Digər-35,5%
Brand Equity
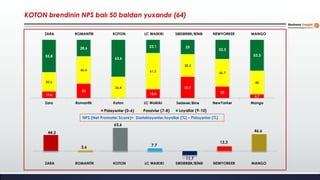
14.
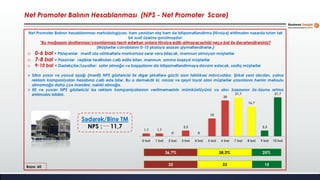
Net Promoter BalınınHesablanması (NPS - Net Promoter Score)
Baza: 60
Net Promoter Balının hesablanması metodologiyası, həm yenidən alış həm də istiqamətləndirmə (tövsiyə) ehtimalını nəzərdə tutan tək
bir sual üzərinə qurulmuşdur:
"Bu mağazanı dostlarınıza/yaxınlarınıza təsvir edərkən onlara tövsiyə edib-etməyəcəyinizi neçə bal ilə dəyərləndirərsiniz?
(Müştərilər cavablarını 0-10 şkalaya əsasən qiymətləndirərlər.)
o 0-6 bal = Pisləyənlər: mənfi söz-söhbətlərlə markamıza zərər verə biləcək, məmnun olmayan müştərilər
o 7-8 bal = Passivlər: rəqiblər tərəfindən cəlb edilə bilən, məmnun, amma laqeyd müştərilər
o 9-10 bal = Dəstəkçilər/Loyallar: satın almağa və başqalarını da istiqamətləndirməyə davam edəcək, sadiq müştərilər
Sıfıra yaxın və yaxud aşağı (mənfi) NPS göstəricisi ilə digər şirkətlərə güclü axın təhlükəsi mövcuddur. Şirkət yeni alıcıları, yalnız
reklam kampaniyaları hesabına cəlb edə bilər. Bu o deməkdir ki, narazı və qeyri loyal olan müştərilər yaxınlarını həmin məhsulu
almamağa daha çox inandırır, nəinki almağa.
50 və yuxarı NPS göstəricisi isə reklam kampaniyalarının verilməməsinin mümkünlüyünü və alıcı bazasının öz-özunə artma
ehtimalını bildirir.
1,7 1,7
0
3,3
0
10
20
21,7
16,7
3,3
21,7
0 bal 1 bal 2 bal 3 bal 4 bal 5 bal 6 bal 7 bal 8 bal 9 bal 10 bal
36,7% 38,3% 25%
22 23 15
Sədərək/Binə TM
NPS : 11,7
15.
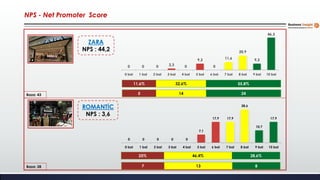
NPS - NetPromoter Score
11,6% 32,6% 55,8%
ZARA
NPS : 44,2
0 0 0 2,3 0
9,3
0
11,6
20,9
9,3
46,5
0 bal 1 bal 2 bal 3 bal 4 bal 5 bal 6 bal 7 bal 8 bal 9 bal 10 bal
5 14 24
Baza: 28
Baza: 43
ROMANTİC
NPS : 3,6
0 0 0 0 0
7,1
17,9 17,9
28,6
10,7
17,9
0 bal 1 bal 2 bal 3 bal 4 bal 5 bal 6 bal 7 bal 8 bal 9 bal 10 bal
25% 46,4% 28,6%
7 13 8
16.
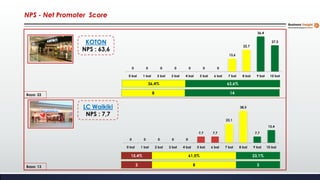
NPS - NetPromoter Score
36,4% 63,6%
KOTON
NPS : 63,6
Baza: 13
Baza: 22
LC Waikiki
NPS : 7,7
15,4% 61,5% 23,1%
0 0 0 0 0 0 0
13,6
22,7
36,4
27,3
0 bal 1 bal 2 bal 3 bal 4 bal 5 bal 6 bal 7 bal 8 bal 9 bal 10 bal
8 14
0 0 0 0 0
7,7 7,7
23,1
38,5
7,7
15,4
0 bal 1 bal 2 bal 3 bal 4 bal 5 bal 6 bal 7 bal 8 bal 9 bal 10 bal
2 8 3
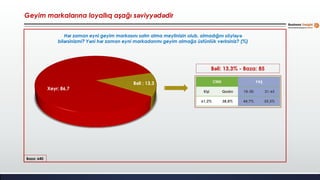
Bəli ; 13,3
Xeyr;86,7
Geyim markalarına loyallıq aşağı səviyyədədir
Hər zaman eyni geyim markasını satın alma meylinizin olub, olmadığını söyləyə
bilərsinizmi? Yəni hər zaman eyni markadanmı geyim almağa üstünlük verirsiniz? (%)
Baza: 640
CİNS YAŞ
Kişi Qadın 18-30 31-65
61,2% 38,8% 44,7% 55,3%
Bəli: 13,3% - Baza: 85
19.
Bilmirəm
Heç biri
Digər
Aqua Mineral
Qax
Erikli
Şahdağ
Jalə
AquaVita
Badamlı
Bonaqua
Sirab
Slavyanka
2,8
5,6
8,3
1,9
2,5
2,7
5,0
5,2
5,3
9,4
14,8
17,3
19,2
Şollar 1,3
Damla 1,3
Vita1000 0,9
Evian 0,6
Mor Mor 0,5
Pinar 0,5
Aquşa 0,5
Kəhriz 0,3
Vata 0,3
İpek su 0,3
İvanovka 0,2
Aysu 0,2
Nestle Pure Life 0,2
Mor Şinski 0,2
Xan 0,2
Saf 0,2
El 0,2
Mərcan 0,2
Qızıl Quyu 0,2
Sultan 0,2
Uludağ 0,2
Золотой колодец 0,2
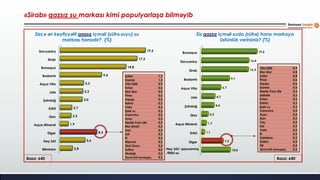
«Sirab» qazsız su markası kimi populyarlaşa bilməyib
Baza: 640
Sizcə ən keyfiyyətli qazsız içməli (süfrə suyu) su
markası hansıdır? (%)
Digər
Erikli
Aqua Mineral
Qax
Şahdağ
Jalə
Aqua Vita
Badamlı
Sirab
Slavyanka
Bonaqua
10,0
7,5
1,1
1,7
2,3
4,4
4,7
6,7
9,7
16,3
16,4
19,2
Siz qazsız içməli suda (süfrə) hansı markaya
üstünlük verirsiniz? (%)
Baza: 640
Vita1000 0,9
Mor Mor 0,8
Şollar 0,8
Pinar 0,6
Aquşa 0,6
Damla 0,5
Nestle Pure Life 0,3
Qəbələ 0,3
Evian 0,3
Kəhriz 0,3
İpek su 0,3
İvanovka 0,2
Aysu 0,2
Xan 0,2
Tutu 0,2
Saf 0,2
Vata 0,2
El 0,2
Gədəbəy 0,2
Sultan 0,2
Fiji 0,2
Золотой колодец 0,2Heç biri/ qaynanmış
/filtirli su
20.
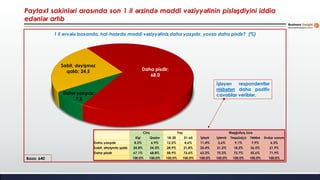
Daha yaxşıdır;
7,5
Sabit, dəyişməz
qalıb;24,5 Daha pisdir;
68,0
Paytaxt sakinləri arasında son 1 il ərzində maddi vəziyyətinin pisləşdiyini iddia
edənlər artıb
Baza: 640
1 il əvvələ baxanda, hal-hazırda maddi vəziyyətiniz daha yaxşıdır, yoxsa daha pisdir? (%)
Cins Yaş Məşğulluq üzrə
Kişi Qadın 18-30 31-65 İşləyir İşləmir Təqaüdçü Tələbə Evdar xanım
Daha yaxşıdır 8,2% 6,9% 12,2% 4,6% 11,4% 3,6% 9,1% 7,9% 6,3%
Sabit, dəyişməz qalıb 24,8% 24,3% 28,9% 21,8% 25,4% 21,2% 18,2% 36,5% 21,9%
Daha pisdir 67,1% 68,8% 58,9% 73,6% 63,2% 75,2% 72,7% 55,6% 71,9%
100,0% 100,0% 100,0% 100,0% 100,0% 100,0% 100,0% 100,0% 100,0%
İşləyən respondentlər
nisbətən daha pozitiv
cavablar veriblər.
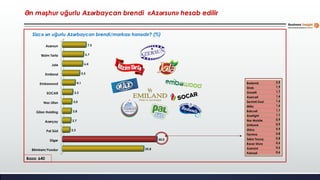
Bilmirəm/Yoxdur
Digər
Pal Süd
Azərçay
Gilan Holding
NazLifan
SOCAR
Embawood
Emiland
Jalə
Bizim Tarla
Azərsun
25,8
30,0
2,3
2,7
2,8
3,0
3,3
4,1
5,5
6,4
6,7
7,5
Ən məşhur uğurlu Azərbaycan brendi «Azərsun» hesab edilir
Baza: 640
Sizcə ən uğurlu Azərbaycan brendi/markası hansıdır? (%)
Badamlı 2,0
Sirab 1,9
Gazelli 1,7
Azərcell 1,6
Sevimli Dad 1,6
Milla 1,6
Bakcell 1,1
Azərlight 1,1
Nar Mobile 0,9
Unibank 0,9
Ulduz 0,9
Femina 0,8
Səba Toyuq 0,8
Bazar Store 0,6
Azərsüd 0,6
Palmali 0,6
23.
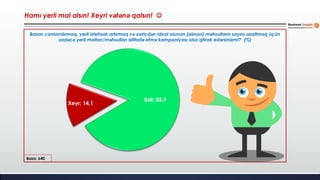
Hamı yerli malalsın! Xeyri vətənə qalsın!
Baza: 640
Bəli; 85,9
Xeyr; 14,1
Bazarı canlandırmaq, yerli istehsalı artırmaq və xaricdən idxal olunan (alınan) məhsulların sayını azaltmaq üçün
sadəcə yerli malları/məhsulları istifadə etmə kampaniyası olsa iştirak edərsinizmi? (%)
24.
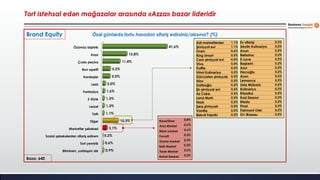
Bilmirəm, yoldaşım alır
Tortyemirik
Sosial şəbəkələrdən sifariş edirəm
Marketlər şəbəkəsi
Digər
Tatlı
Ləzzət
Z-Style
Fantaziya
Ləziz
Kardeşler
Bon apetit
Çudo peçka
Azza
Özümüz bişiririk
0,9%
0,6%
0,2%
3,1%
10,3%
1,1%
1,3%
1,3%
1,6%
2,0%
5,0%
5,2%
11,4%
15,8%
41,6%
Baza: 640
Özəl günlərdə tortu haradan sifariş edirsiniz/alırsınız? (%)
Tort istehsal edən mağazalar arasında «Azza» bazar lideridir
BazarStore 0,8%
Araz Market 0,6%
Bizim market 0,6%
Favorit 0,3%
Grand market 0,3%
Ballı Market 0,2%
Xəzər Market 0,2%
Rahat Market 0,2%
Adi marketlərdən 1,1%
Şirniyyat evi 1,1%
Oven 0,6%
King Smart 0,5%
Cam şirniyyat evi 0,5%
Viva 0,5%
Truffle 0,5%
Vinni Kulinariya 0,5%
Gürcüstan şirniyyatı 0,3%
Alov 0,3%
Güllüoğlu 0,3%
Şir-şirniyyat evi 0,3%
Az Cake 0,3%
Land Mark 0,2%
Nazlı 0,2%
Şərq şirniyyatı 0,2%
Vanilla 0,2%
Biskvit Fabriki 0,2%
Ev sifarişi 0,2%
Akulin Kulinariya 0,2%
Avon 0,2%
Belissina 0,2%
E-Love 0,2%
Başkent 0,2%
Azur 0,2%
Hacıoğlu 0,2%
Azon 0,2%
Lemanca 0,2%
Usta Mübariz 0,2%
Kulinariya 0,2%
Klassika 0,2%
Kod Deazur 0,2%
Mado 0,2%
Final 0,2%
Fairmont Otel 0,2%
От Жанны 0,2%
Brand Equity
25.
Tel.: (+994 12)430 30 42 / 430 00 70 / 511 24 58
Fax: (+994 12) 430 17 77
E-mail: office@businessinsight-az.com
www.businessinsight-az.com
Business Insight
araşdırmalara verdiyiniz dəyərə görə Sizə təşəkkür edir.