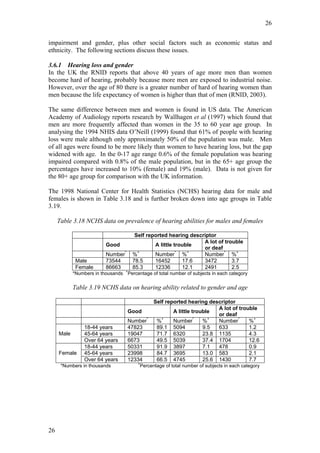
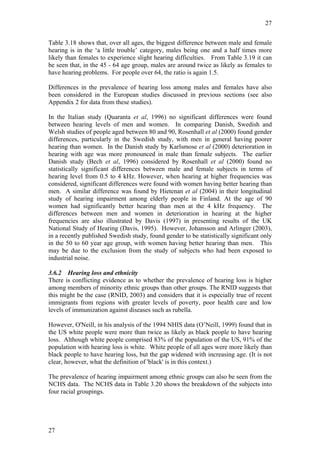
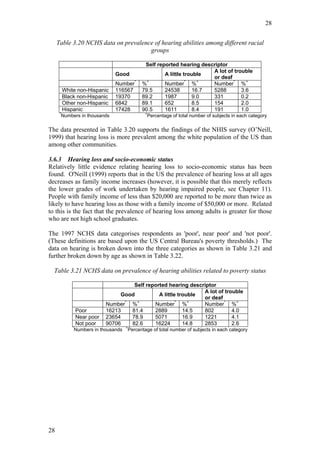
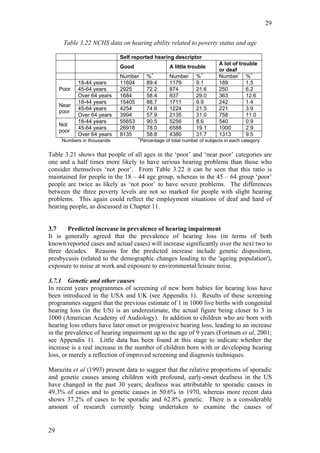
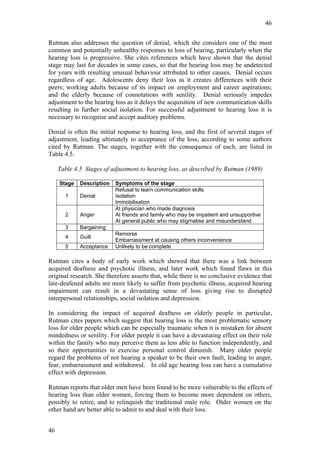
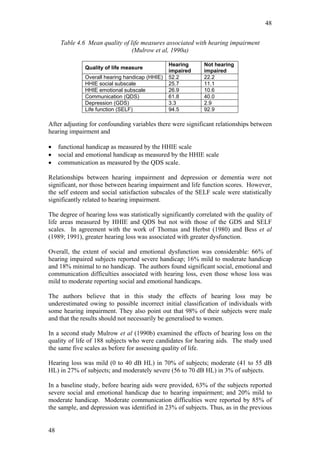
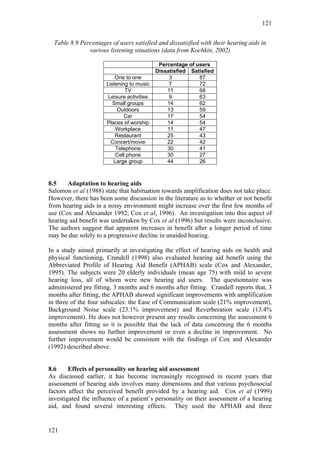
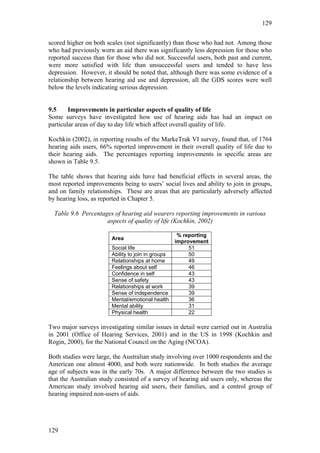
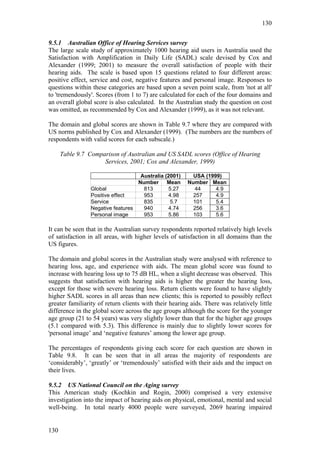
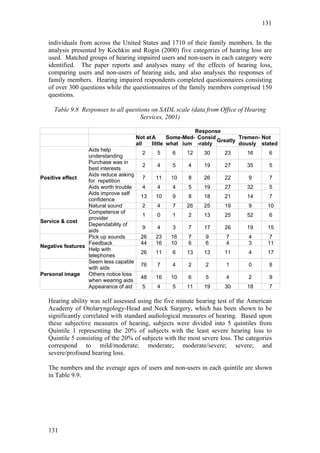
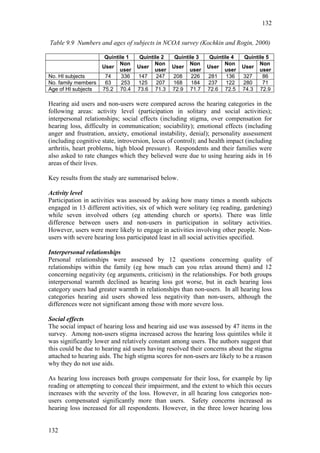
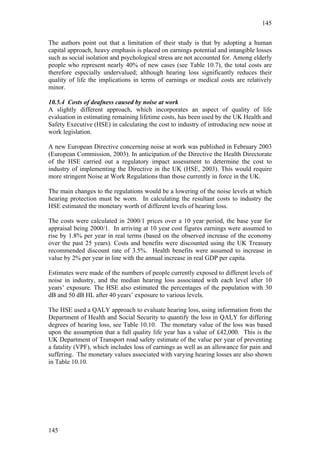
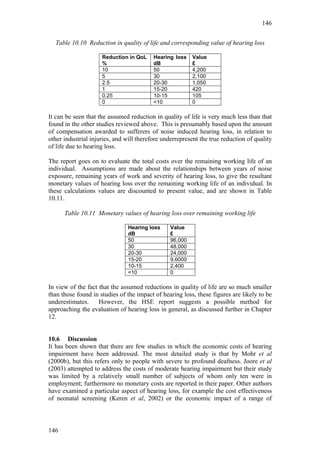
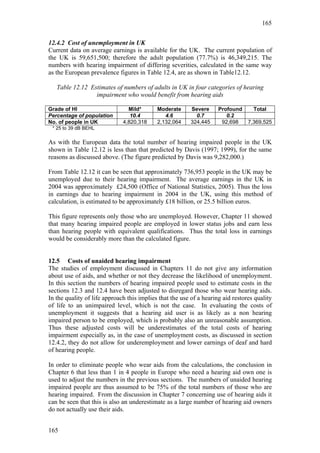
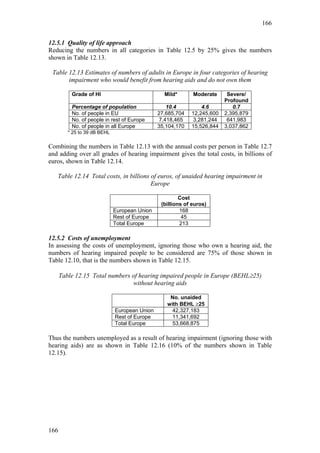
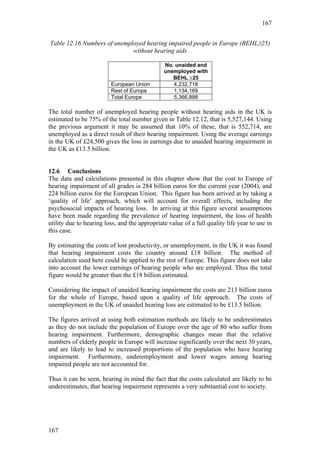
EVALUATION OF THE SOCIAL AND
 ECONOMIC COSTS OF HEARING
        IMPAIRMENT


      A REPORT FOR HEAR-IT


           Bridget Shield


           October 2006
2


                                CONTENTS
CHAPTER 1         INTRODUCTION
            1.1   Introduction
            1.2   Scope and limitations of the study
            1.3   Structure of the report

CHAPTER 2         DEFINITIONS OF DEAFNESS
            2.1   Introduction
            2.2   Qualitative definitions of hearing impairment
            2.3   Quantitative definitions of hearing impairment
                         2.3.1 World Health Organisation
                         2.3.2 European Commission
                         2.3.3 American National Standards Institute
                         2.3.4 RNID
                         2.3.5 British Society of Audiology
                         2.3.6 NIDCD
            2.4   Summary
            2.5   Conclusions

CHAPTER 3         PREVALENCE OF HEARING IMPAIRMENT AMONG
                  ADULTS IN EUROPE
            3.1   Introduction
            3.2   Hearing impairment in developing countries
            3.3   General information on prevalence of hearing loss in US and UK
            3.4   Prevalence of hearing impairment in Europe
                         3.4.1 Overall hearing impairment
                         3.4.2 Prevalence of different grades of hearing
                                 impairment
            3.5   Prevalence of hearing loss related to age
                         3.5.1 US data on age and hearing loss
                         3.5.2 European data on age and hearing loss
                         3.5.3 Increase of hearing loss with age
            3.6   Prevalence related to gender and other factors
                         3.6.1 Hearing loss and gender
                         3.6.2 Hearing loss and ethnicity
                         3.6.3 Hearing loss and socio-economic status
            3.7   Predicted increase in prevalence of hearing impairment
                         3.7.1 Genetic and other causes
                         3.7.2 Presbycusis and ageing
                         3.7.3 Effects of noise exposure
            3.8   Summary
            3.9   Conclusions


2
3


CHAPTER 4          MAJOR STUDIES OF PSYCHOSOCIAL EFFECTS OF
                   HEARING LOSS
            4.1    Introduction
            4.2    An early review
            4.3    First major study of psychosocial effects
                           4.3.1 Psychiatric disturbance
                           4.3.2 General health and wellbeing
                           4.3.3 Social and family life
                           4.3.4 Denial
                           4.3.5 Employment
                           4.3.6 Summary
            4.4    Noise induced hearing loss
            4.5    Functional disturbance in elderly people
            4.6    Review of effects of acquired deafness
            4.7    Hearing impairment and quality of life of elderly people
            4.8    Community surveys of hearing problems in England and Wales
            4.9    Sensory impairment and quality of life in an elderly population
            4.10   Men and women with noise induced hearing loss
            4.11   Effects of hearing impairment on young people
            4.12   Experiences of deaf people
                           4.12.1 Deafness, isolation and exclusion
                           4.12.2 Prejudice and abuse
                           4.12.3 Visits to doctors
            4.13   Psychological aspects of acquired hearing loss
            4.14   Conclusions


CHAPTER 5          PSYCHOSOCIAL EFFECTS OF HEARING LOSS
            5.1    Introduction
            5.2    Overall quality of life
            5.3    Loneliness and social isolation
                          5.3.1 Adults of all ages
                          5.3.2 People of working age
                          5.3.3 Elderly people
                          5.3.4 Young people
                          5.3.5 Women
                          5.3.6 Conclusions on loneliness and social isolation
            5.4    Psychiatric disturbance and depression
            5.5    Family relationships
            5.6    Stigma and low self esteem
            5.7    Education
            5.8    Denial
            5.9    Difficulties in particular environments
            5.10   General health/visiting the doctor
            5.11   Cognitive skills and dementia
            5.12   Memory


3
4


            5.13   Intimate relationships
            5.14   Prejudice and abuse
            5.15   Discussion
                          5.15.1 Types of study
                          5.15.2 Attitudes towards hearing impairment
                          5.15.3 Interrelationships between effects
                          5.15.4 Need for future research
                          5.15.5 Costs
            5.16   Conclusions

CHAPTER 6          OWNERSHIP OF HEARING AIDS
            6.1    Introduction
            6.2    Ownership of hearing aids
                          6.2.1 Hearing aid ownership in northern Europe
                          6.2.2 Hearing aid ownership in the United States
                          6.2.3 Hearing aid ownership among new users
            6.3    Non-ownership of hearing aids
            6.4    General reasons for non-ownership of aids
            6.5    Reluctance to seek help
            6.6    Variability in services provided
            6.7    Denial of problem and delay in seeking help
            6.8    Stigma
            6.9    Early screening
            6.10   Summary
            6.11   Conclusions

CHAPTER 7          USE OF HEARING AIDS
            7.1    Introduction
            7.2    Usage of hearing aids
            7.3    Hearing aid usage among young people
            7.4    Reasons for non-use and under use of hearing aids
            7.5    Analysis of factors related to non-use
            7.6    Defective aids
            7.7    Hearing aid preferences
            7.8    Hearing aid fitting
            7.9    Expectations of hearing aids
            7.10   Hearing aid handling
            7.11   Stigma
            7.12   Use of hearing aids by young people
            7.13   Other reported problems
            7.14   Summary
            7.15   Conclusions


4
5


CHAPTER 8          SATISFACTION WITH HEARING AIDS
            8.1    Introduction
            8.2    Scales for assessment of hearing aid benefits
            8.3    Overall satisfaction with hearing aids
            8.4    Satisfaction and benefits in various listening situations
            8.5    Adaptation to hearing aids
            8.6    Effects of personality on hearing aid assessment
            8.7    Summary
            8.8    Conclusions

CHAPTER 9          IMPACT OF HEARING AIDS ON OVERALL QUALITY OF
                   LIFE
            5.1    Introduction
            5.2    Psychological function
            5.3    Physical health and functioning
            5.4    Overall quality of life
            5.5    Improvements in particular aspects of quality of life
                          5.5.1 Australian Office of Hearing Services survey
                          5.5.2 US National Council on the Aging survey
            5.6    Summary
            5.7    Conclusions

CHAPTER 10         STUDIES OF COSTS OF HEARING IMPAIRMENT
          10.1     Introduction
          10.2     Methods of evaluating the costs of hearing impairment and
                   interventions
                          10.2.1 Cost utility analysis
                          10.2.2 Monetary costings
                          10.2.3 Incidence/prevalence based studies
            10.3   Cost utility analysis of cochlear implants
            10.4   Societal costs of moderate hearing impairment
            10.5   Monetary costs of hearing impairment
                          10.5.1 The costs of communication disorders
                          10.5.2 Cost effectiveness of newborn screening
                          10.5.3 Societal costs of severe to profound hearing
                                   impairment
                          10.5.4 Costs of deafness caused by noise at work
            10.6   Discussion
            10.7   Conclusions


5
6


CHAPTER 11          EMPLOYMENT, EARNINGS AND DISCRIMINATION AT
                    WORK
             11.1   Introduction
             11.2   Employment and unemployment rates of hearing impaired people
                           11.2.1 Unemployment in US
                           11.2.2 Unemployment in Europe
             11.3   Underemployment
             11.4   Earnings
             11.5   Retirement
             11.6   Discrimination at work
             11.7   Conclusions

CHAPTER 12          EVALUATION OF COSTS TO EUROPE OF HEARING
                    LOSS
             12.1   Introduction
             12.2   Numbers of people in Europe who would benefit from hearing aids
                           12.2.1 Numbers of hearing impaired people in Europe
                           12.2.2 Numbers who would benefit from hearing aids
             12.3   Evaluation of costs using a quality of life approach
                           12.3.1 Evaluation of loss of quality of life due to hearing
                                   impairment
                           12.3.2 Quality adjusted life years
                           12.3.3 Annual cost of hearing impairment per person
                           12.3.4 Total costs of untreated hearing impairment
             12.4   Evaluation of costs of unemployment due to hearing loss
                           12.4.1 Numbers of unemployed in Europe
                           12.4.2 Cost of unemployment in UK
             12.5   Conclusions

CHAPTER 13          CONCLUSIONS AND DISCUSSION
          13.1      Introduction
          13.2      Main conclusions
          13.3      Discussion

REFERENCES

APPENDIX 1          PREVALENCE OF HEARING IMPAIRMENT AMONG
                    CHILDREN AND YOUNG ADULTS

APPENDIX 2          PREVALENCE DATA FROM EUROPEAN STUDIES

APPENDIX 3          SCALES USED IN ASSESSING PSYCHOSOCIAL EFFECTS
                    OF HEARING IMPAIRMENT

APPENDIX 4          SUMMARIES OF QUANTITATIVE STUDIES OF
                    PSYCHOSOCIAL EFFECTS OF HEARING IMPAIRMENT


6
7


APPENDIX 5   POPULATIONS OF EUROPEAN COUNTRIES


7
8


CHAPTER 1             INTRODUCTION

1.0    The study
This report presents the results of an extensive study of the social and economic
impacts of hearing loss in Europe. The study has been carried out through Internet
searches, searches and reviews of literature in academic and professional journals and
discussions with professionals in the field.

The ultimate aim of the study was to estimate the costs to Europe of hearing
impairment. In order to accomplish this detailed studies have been made of the
following aspects of hearing loss, with particular (but not exclusive) reference to
Europe:

•   Current definitions of grades of hearing loss
•   Prevalence of hearing loss among adults
•   Relationship of hearing loss to factors such as age
•   Psychosocial effects of hearing loss
•   Ownership of hearing aids
•   Use of hearing aids
•   Benefits of hearing aids
•   Evaluations of the monetary costs of hearing impairment
•   Unemployment and low earnings due to hearing loss

Following this review, two methods of evaluating costs of hearing impairment in
Europe have been derived and costs estimated using these methods.


1.1     Scope and limitations of the study
As stated above, the study was concerned with the socio-economic impact of hearing
impairment of adults in Europe. Throughout the report the terms 'hearing impairment'
and 'hearing loss' are used interchangeably as the report considers impairment only in
the form of hearing loss; other hearing impairments such as tinnitus are beyond the
scope of the study. The study was concerned with the costs of hearing impairments
other than profound deafness, that is impairment that may be treated through the use
of hearing aids. Where relevant some studies concerning profound deafness have
been cited, but in general only those relating to less severe grades of hearing loss are
reviewed.

Although the study is focussed on Europe, much of the published research,
particularly that on effects of hearing impairment and use of hearing aids, has been
carried out in the United States. It may be assumed that the results of this research
would be applicable to a European population so the most important of these
investigations have been included in this review.

A major aim of the study was to determine whether or not there is any published work
on the cost implications of hearing impairment, and to apply the results to the hearing
impaired population of Europe. The literature search revealed that there is very little
relevant information published. A limited amount of work has been published in the


8
9


United States, mainly with reference to profound deafness. In the past few years there
have been several studies of the cost benefits of cochlear implants, and it is proposed
that similar methods could be used to estimate the costs of less severe hearing
impairment.

Furthermore there was notable lack of information on issues concerning young adults
with hearing loss; most of the research that has been carried out, particularly that
dealing with the effects of hearing loss, has concerned elderly subjects. There is
clearly a gap in knowledge and understanding of how hearing loss affects young
people that needs to be addressed.


1.2     Structure of the report
The report is arranged as follows. Chapter 2 describes how the many terms used in
relation to hearing ('deafness', ‘hearing impairment', 'hearing loss' and so on) are used
in different contexts and in different cultures. Current definitions of deafness and
hearing ability in terms of hearing level, as used by different organisations, are also
given.

Chapter 3 reviews studies which have investigated the prevalence of hearing
impairment among populations. This chapter also includes discussion of the
relationships between hearing loss and age, ethnicity, socio-economic status and
gender. The likely increase in hearing impairment, and reasons for the possible
increase, are also discussed.

Chapter 4 describes some of the major studies of the psychological and social effects
of hearing impairment on adults, while Chapter 5 contains a more extensive review of
the evidence for particular psychosocial effects.

Chapters 6 to 9 concern hearing aids. Chapters 6 and 7 discuss ownership and use of
hearing aids. Much of the information presented has been obtained in the United
States, and shows how many hearing impaired people who would benefit from
hearing aids do not possess them, while others who possess aids do not use them.
Chapters 9 and 10 review studies of people’s satisfaction with their aids, and the
benefits they obtain.

Chapter 10 reviews the limited amount of work concerned with evaluating the costs of
hearing impairment; again, most of these studies are American. In Chapter 11 issues
related to employment and unemployment, and earnings of hearing impaired people
are discussed. Based upon the studies in Chapter 10 and the data presented
throughout the report, Chapter 12 describes two methods for evaluating the costs to
Europe of untreated hearing loss, and costs are estimated using both methods.

The final chapter contains brief conclusions, discussion and recommendations for
further work.


9
10


CHAPTER 2              DEFINITIONS OF DEAFNESS

2.1     Introduction
It is important when discussing issues relating to hearing loss to appreciate that many
terms relating to hearing impairment, for example 'deaf', 'deafened', 'hard of hearing',
'hearing impaired', 'hearing disabled' and so on, are used in the literature. These terms
can be used to refer to different conditions in different contexts and in different
cultures.

Furthermore, the varying degrees of severity of hearing impairment are defined
differently by different organisations. This chapter discusses some of the terms used
and gives the definitions of many of the leading bodies concerned with health and/or
hearing loss. These generally define deafness in terms of hearing loss related to terms
such as 'profound deafness', mild deafness' etc. as described below.

The term 'deaf' itself can have different meanings. Many people, for example in
Canada and the USA, make a distinction between the expressions 'deaf' and 'hard of
hearing', using 'deaf' to refer only to people who have a total hearing loss. Hearing
aids alone do not enable such people to understand speech; they need to be used in
association with lip reading and consequently many totally deaf people do not use
hearing aids (Martin, 2000).

In the UK the term ‘deaf’ is often used to include both totally deaf and hard of hearing
people. ‘Hearing impaired’ is the commonly used term to describe inclusively deaf
and hard of hearing people. However, in other cultures, for example in North
America, the use of the word ‘impaired’ is considered to make the expression ‘hearing
impaired’ a derogatory term; people are categorised as either ‘deaf’ or ‘hard of
hearing’.

A further inconsistency is that hearing level is defined differently by different
organisations. In some cases it refers to the hearing level in the better ear, and in
others to the average hearing level of the two ears.

In this report the terms ‘hearing impairment’ and ‘hearing impaired’ are used in
relation to hearing loss which may be total or partial. In addition to hearing loss there
are many other types of hearing impairment of which tinnitus is probably the most
common. Here 'hearing impairment' is taken to refer to hearing loss only;
consideration of other conditions such as tinnitus is beyond the scope of this report.

Many deaf people communicate using sign language alone. In some countries
including the United States they have formed a strong cultural identity and a 'deaf
community' has developed (Martin, 2000; Pearson, 2003). Some branches of the deaf
community do not welcome any interventions such as hearing aids or cochlear
implants (Pearson, 2003).


10
11


2.2     Qualitative definitions of hearing impairment
Many of the studies into hearing loss, its mitigation and effects, particularly those
based on population studies using questionnaire data, define hearing ability or loss in
terms of self reported qualitative data. These may be based upon a 3, 4 or 5 point
scale using descriptors such as 'difficulty hearing normal conversation' (O’Neill,
1999). In their large scale surveys of dental, visual and aural health the US National
Center for Health Statistics (NCHS) uses the terms 'good', 'a little trouble', 'a lot of
trouble' and 'deaf'.


2.3    Quantitative definitions of hearing impairment
Organisations concerned specifically with health or hearing use formal definitions
based upon hearing levels. Some of these definitions are discussed below and
summarised in Section 2.4.

2.3.1 World Health Organisation
The World Health Organisation (WHO) defines disabling hearing impairment in
adults as a permanent unaided hearing threshold level (average for frequencies 0.5, 1,
2, 4 kHz) for the better ear of 41 dB or greater (WHO, 2001). In children under 15
years of age, disabling hearing impairment is defined as permanent unaided hearing
threshold level (average for frequencies 0.5, 1, 2, 4 kHz) for the better ear of 31 dB or
greater. The WHO classifies hearing impairment into 5 grades, as shown in Table
2.1.

                          Table 2.1 WHO grades of hearing impairment

     Grade of              HL in
                                        Qualitative description     Recommendations
     impairment            better ear
     0                     25 dB or     No or very slight hearing
     No impairment         better       problems
     1                     26 - 40 dB   Able to hear and repeat     Counselling.
     Slight impairment                  words spoken in normal      Hearing aids may be
                                        voice at 1 metre            needed.
     2                     41 - 60 dB   Able to hear and repeat     Hearing aids usually
     Moderate                           words using raised voice    recommended.
     impairment                         at 1 metre
     3                     61 - 80 dB   Able to hear some           Hearing aids needed. If not
     Severe                             words when shouted          available, lip-reading and
     impairment                         into better ear             signing should be taught.
     4                     81 dB or     Unable to hear and          Hearing aids may help
     Profound              greater      understand even a           understanding words.
     impairment                         shouted voice               Additional rehabilitation
     including deafness                                             needed. Lip-reading and
                                                                    sometimes signing
                                                                    essential.

Prior to 1997 the WHO defined hearing loss in terms of the pure tone average of the
three frequencies 0.5, 1 and 2 kHz. The grades of hearing impairment were defined as
shown in Table 2.2 (WHO, 1991).


11
12


          Table 2.2 Former WHO definitions of grades of hearing impairment

 Grade of HI    Normal            Mild            Moderate        Severe        Profound
 BEHL (dB)      25 or less        26 - 40         41 - 60         61 - 80       Over 80


2.3.2 European Commission
Definitions of grades of hearing impairment for use in Europe were proposed by the
European Commission in 1996 (Martini, 1996). In these definitions the better ear
hearing loss (BEHL) is defined as the pure tone average of the four frequencies 0.5, 1,
2 and 4 kHz for the better ear. A reason for including the frequency 4 kHz was that it
is often a significant frequency in noise induced hearing loss and age related loss.

The definitions, in terms of better ear hearing loss (BEHL), are shown in Table 2.3.

                Table 2.3 EU definitions of grades of hearing impairment

 Grade of HI    Normal            Mild            Moderate        Severe        Profound
 BEHL (dB)      20 or less        21 - 39         40 - 69         70 - 94       95 or more

Note that, although the terminology is the same, the hearing loss ranges associated
with each grade of impairment differ between the WHO and EU classifications.

2.3.3 American National Standards Institute (ANSI)
The American National Standards Institute (ANSI) defines 5 categories of hearing
impairment, starting at a hearing level of 27 dB. The ANSI categories are shown in
Table 2.4.

                   Table 2.4 ANSI categories of hearing impairment

                  Descriptor of hearing                Hearing level
                  Normal                               Less than 27 dB
                  Mild hearing loss                    27 - 40 dB
                  Moderate hearing loss                41 - 55 dB
                  Moderate-severe hearing loss         56 - 70 dB
                  Severe hearing loss                  71 - 90 dB
                  Profound hearing loss                91 dB and above

2.3.4 Royal National Institute for Deaf and Hard of Hearing People (RNID)
The RNID defines deafness in 4 categories (RNID, 2003) which relate to the quietest
sound that can be heard in the better ear, as shown in Table 2.5.

                   Table 2.5 RNID categories of hearing impairment

     Type of
                     HL in better ear       Qualitative description
     deafness
     Mild            25 - 39 dB             Difficulty following speech
                     40 - 69 dB             Difficulty following speech without a hearing
     Moderate
                                            aid
                     70 - 94 dB             Great reliability on lip reading, even with a
     Severe
                                            hearing aid
                     95 dB or greater       Communication by lip reading, British Sign
     Profound
                                            Language may be first or preferred language


12
13


In addition, the RNID defines ‘deafened’ people as people who are not prelingually
deaf but become profoundly deaf later in life as a result of trauma, infection or
ototoxic drugs.

2.3.5 British Society of Audiology (BSA)
The British Society of Audiology (1988) bases its general definitions of hearing
impairment, shown in Table 2.6, on the average pure tone thresholds at 0.25, 0.5, 1, 2
and 4 kHz (BSA, 1988).

                   Table 2.6 BSA definitions of hearing impairment

                 Descriptor of hearing loss      Hearing level
                 Mild                            20 - 40 dB
                 Moderate                        41 - 70 dB
                 Severe                          71 - 95 dB
                 Profound                        Greater than 95 dB

The BSA definitions have been endorsed and adopted by other organisations such as
the British Association of Teachers of the Deaf (2001) and the UK National Deaf
Children's Society (2003).

2.3.6  National Institute on Deafness and Other Communication Disorders
       (NIDCD)
The NIDCD in the US defines hearing handicap in terms of the pure tone average
hearing loss at speech frequencies 0.5, 1, 2, and 3 kHz (see www.nidcd.nih.gov). The
categories are shown in Table 2.7.

                 Table 2.7 NIDCD definitions of hearing impairment

        Type of handicap      HL - average at    Implications
                              0.5, 1, 2, 3 kHz
        Normal hearing        25 dB or less
        Functional handicap   Around 40 dB       Some form of amplification
                                                 beneficial
        Severe to profound    75 dB or greater   Hearing aids provide limited
        hearing loss                             benefit


2.4 Summary
Table 2.8 summarises the definitions of all the organisations discussed above.

It can be seen that there are some differences between the various organisations in the
definitions of hearing impairment. In some cases mild hearing impairment is assumed
to start at a BEHL of around 20 dB, while other organisations consider hearing losses
of up to 26 dB to constitute ‘normal’ hearing. Table 2.8 also shows that the
definitions of severe and profound deafness can differ by as much as 14 dB HL.


13
14


           Table 2.8 Summary of definitions of hearing impairment (dB HL)

                                                       Moderate
                           None   Mild      Moderate              Severe      Profound
                                                       - severe
WHO
                           ≤ 25   26 - 40    41 - 60              61 - 80          ≥ 81
(avg. 0.5, 1, 2, 4 kHz)
European Commission
                           ≤ 20   21 - 39    40 - 69              70 - 94          ≥ 95
(avg. 0.5, 1, 2, 4 kHz)
ANSI                       ≤ 26   27 - 40    41 - 55    56 - 70   71 - 90          ≥ 91
RNID                              25 - 39    40 - 69              70 - 94          ≥ 95
BSA
                                  20 - 40    41 - 70              71 - 95          >95
(avg. .25, .5,1,2,4 kHz)
NIDCD
                            <25               ~ 40                          ≥ 75
(avg. 0.5, 1, 2, 3 kHz)


2.5 Conclusions
It has been shown that there is considerable variation in both qualitative and
quantitative descriptions of deafness. Care must therefore be taken when considering
or reviewing literature on any aspects of deafness where grades of hearing loss are
discussed. It is important to clarify exactly what is meant by the terms used in a
particular context. Throughout this report, where possible, the meanings of the
particular terms and definitions of hearing impairment used are clarified.


14
15


CHAPTER 3             PREVALENCE OF HEARING IMPAIRMENT
                      AMONG ADULTS IN EUROPE

3.1    Introduction
This chapter reviews the available data on hearing impairment among adults.
Although this study is concerned only with Europe, figures on hearing impairment in
other parts of the developed world are included as they could be assumed to be
comparable with those for Europe. Some literature concerning the prevalence of
hearing loss among children and young adults is reviewed in Appendix 1.

The data presented in this chapter comes from a variety of sources: Government
surveys, organisations concerned with the needs of hearing impaired people, and
academic journal publications.

Some official data should be viewed with caution. For example, in the UK the
number of people registered with social services departments as deaf or hard of
hearing (approximately 195,000 in England in 2001) is a very small percentage of the
9 million deaf and hard of hearing people recognised by the RNID. This is because
registration is voluntary and many people do not wish to inform the social services of
their disability (RNID, 2003).

In addition to examining data on the numbers of deaf and hard of hearing people in
particular populations, this chapter also investigates relationships between hearing
loss and factors such as age, gender, and ethnicity. Estimated increases in prevalence
over the next few decades are also discussed.


3.2    Hearing impairment in developing countries
In 1995 the World Health Organisation estimated that there were 120 million people
with disabling hearing difficulties worldwide (Smith, 1998). In 2001 the WHO
estimate was 250 million people worldwide with disabling hearing impairment
(defined as moderate or worse hearing impairment in the better ear, that is a BEHL of
41 dB or greater), of whom two thirds live in developing countries (WHO, 2002). The
WHO is concerned at the lack of accurate population based data on the prevalence
and causes of hearing impairment in developing countries, and is currently
undertaking a project to obtain this information (WHO, 2001), with surveys of
hearing disability being undertaken in south-east Asia.


3.3     General information on prevalence of hearing loss in US and UK
The overall figure normally given for the current prevalence of hearing impairment in
the US population is 28 million, or 1 in 10 of the population (see for example
websites of the American Academy of Audiology, Hear This Organisation, and the
American Speech-Language-Hearing Association (ASHA)). Of these, 738,000 are
totally deaf (Dallas Hearing Foundation website).

This current figure of 28 million compares with 22 million, estimated from the 1994
US National Health Interview Survey (NHIS) of Disability (O’Neill, 1999) and also


15
16


given by the websites of the Better Hearing Institute and National Institute on
Deafness and other Communication Disorders (NIDCD).

However, the data presented by the National Centre for Health Statistics in the US
(NCHS, 1998) suggest that these figures may be an underestimate. In a 1997 study of
hearing, vision and dental problems, of 195,276,000 people over 18 surveyed
34,752,000, that is 18%, rated their hearing according to the categories 'a little
trouble', 'a lot of trouble' or 'deaf'. This means that nearly 1 in 5 adults in the US
perceive themselves to have hearing difficulties to a greater or lesser degree.

The figure generally quoted for prevalence of hearing impairment in the UK is 1 in 7,
or approximately 9 million people (RNID, 2003), including around 700,000 who are
severely or profoundly deaf. Most of the deaf and hard of hearing people in the UK
have developed hearing loss as they become older. The figures includes an estimated
123,000 deafened people in the UK aged 16 or over, who rely heavily on lip reading
and written communication. Another interesting statistic from the Hearing Research
Trust (Hearing Research Trust, 2001) is that 1 in 3 people in the UK know someone
with a hearing loss. (The personal view of the author is that this may be an
underestimate.)


3.4      Prevalence of hearing impairment in Europe
There have been several European studies in the past 20 years which have
investigated the prevalence of hearing impairment in an adult population. However, it
is difficult to compare or collate the data from the separate studies to give definitive
estimates of the prevalence of the different grades of hearing impairment in a general
population, as also found by Sorri et al (2001) in their report on adult hearing
impairment in Nordic countries and the UK. This is because the various
investigations have used different study populations, different age ranges and
different definitions of impairment. Furthermore, the majority of studies have
focused on prevalence among older people and there are few detailed reports on the
prevalence of hearing impairment of different grades among adults of all ages.
However, where reported, the overall figures for the prevalence of adult hearing
impairment in various countries are reasonably consistent, and agree with those of
other studies in the developed world, although some differences appear when the data
is broken down by age and/or degree of hearing loss.

3.4.1 Overall hearing impairment
The first large scale survey of hearing impairment among adults in a European
country was the UK National Study of Hearing (Davis 1991; 1995), which was
carried out in the 1980s and remains the most comprehensive and most cited survey.
Since this study there have been further large surveys in Italy (Quaranta et al, 1996),
Finland (Uimonen et al, 1999), Denmark (Karlsmose et al, 2000) and Sweden
(Johansson and Arlinger, 2003). Summary data from these studies are presented in
this chapter; more detailed results are given in Appendix 2.

In terms of overall prevalence of hearing impairment of 25 dB BEHL or greater there
is good agreement between these studies. Table 3.1 shows the numbers and ages of
subjects and the overall levels of hearing impairment found in each survey.


16
17


         Table 3.1 Summaries of surveys of adult hearing impairment in Europe

     Country              UK              Italy         Finland        Denmark       Sweden
                                                                                     Johansson
                          Davis 1991,     Quaranta      Uimonen        Karlsmose
     Reference            2001            et al 1996    et al 1999     et al 2000
                                                                                     & Arlinger
                                                                                     2003
     No of subjects       2662            2170          3518           705           590
     Age of subjects      18-80           18-80         2-75           31-50         20-80
     % popln with
                          16.1            17.1          15             14.3*         16.9
     BEHL ≥ 25 dB
         *Subjective hearing impairment

It can be seen that in terms of overall hearing impairment the results of all studies are
very consistent. Possible reasons for the minor differences in results between studies
are listed below:

•    The Finnish study included children as well as adults
•    The Danish study referred only to a rural population in a relatively small age
     range (30 to 50 years)
•    All subjects in the Italian study lived in cities
•    In the Swedish study subjects who had been exposed to industrial noise were
     excluded
•    The UK study was carried out in the mid 1980s and the Swedish study in 1998 so
     there is a difference of around 15 years between the first and last study reported.

The overall levels of hearing impairment reported also agree with a similar survey of
hearing impairment in Australia (Walsh et al, 1999) which found overall prevalence
of 16.6% among subjects aged 16 and over.

These results suggest that at the present time approximately 16-17% of the adult
population of Europe have a hearing impairment of 25 dB BEHL or greater.

3.4.2 Prevalence of different grades of hearing impairment
For the purposes of the current study it is useful to know the prevalence in Europe of
different degrees of hearing impairment, but few of the studies present data directly in
this format. Davis (1991; 1995) presents the results of the UK National Study of
Hearing according to prevalence of losses of 25 dB or more, 35 dB or more, and so on
as shown in Table 3.2. The hearing loss refers to the better ear and is an average
across the frequencies 0.5, 1, 2 and 4 kHz.

    Table 3.2 Estimated prevalence of hearing impairment in UK (Davis, 1991, 2001)

    BEHL            ≥25          ≥35    ≥45       ≥55    ≥65         ≥75       ≥85   ≥95     ≥105
    Estimated
                   16.1          8.2    3.9       2.1    1.1         0.7       0.4   0.2     0.1
    prevalence

The results of the studies in Italy (Quaranta et al, 1996), Denmark (Karlsmose et al,
2000) and Sweden (Johansson and Arlinger, 2003) are presented similarly, which
enables comparison of the situations in four European countries. The results of the
UK, Italian, Danish and Swedish studies, in terms of BEHL, are shown in Table 3.3.


17
18


              Table 3.3 Comparison of UK, Swedish and Danish studies

         Study/        UK            Italy         Denmark          Sweden
         BEHL         Davis       Quaranta et     Karlsmose      Johansson &
           dB       1991, 2001      al 1996       et al 2000     Arlinger 2003
          25+          16.1           17.1            3.4             16.9
          35+          8.2                            1.0             7.7
          45+          3.9             4.0            0.2             3.3
          65+          1.1             1.2                            0.2
          90+                          0.3

Table 3.4 shows that the results of the studies are broadly similar; differences in
results are probably due to the reasons given in the preceding section. However, as
the study by Karlsmose et al (2000) considered only adults aged between 30 and 50 in
a rural population it cannot be directly compared with the data from other countries
and will not be considered further here.

Johansson and Arlinger (2003) also presented the results of the Swedish study using
the current European classifications. Their results are given separately for males and
females, from which the overall figures in each category have been calculated, as
shown in Table 3.4. The results of the Finnish study (Uimonen et al, 1999) were
presented in two ways: using the current European definitions of the four grades of
hearing loss (mild, moderate, severe and profound), based upon BEHL averaged
across the frequencies 0.5, 1, 2 and 4 kHz, and also using the earlier WHO categories
which were based upon the three frequencies 0.5, 1, and 2 kHz. The results for
Finland and Sweden for the four European hearing loss grades are compared in Table
3.4.

 Table 3.4 Comparison of Swedish and Finnish studies in terms of grade of hearing
                                  impairment

                                     Finland        Sweden
                        Study/
                                   Uimonen et    Johansson &
                       HI grade
                                     al 1999     Arlinger 2003
                       Mild            11.5           18.1
                       Moderate        2.8             4.5
                       Severe          0.3              0
                       Profound        0.1              0

It is possible, using the published data, to reanalyse the data from the UK National
Study of Hearing (Davis, 1995) and the data from Finland (Uimonen et al, 1999) to
make them consistent with the results of the other studies.

As explained above, the study by Uimonen et al (1999) included subjects aged from 2
to 75. Using the data presented in the paper it is possible to reorganise the data to
give results for adults only, in the age ranges 15 to 75 or 25 to 75. These two sets of
data are shown in Table 3.5 and compared with the original data.


18
19


 Table 3.5 Data on hearing impairment among adults in Finland (extrapolated from
                     data presented by Uimonen et al, 1999)

                                   Original          Reanalysed        Reanalysed
                                   data              data              data
                 HI grade
                                   Age group         Age group         Age group
                                   2 to 75           15 to 75          25 to 75
                 Mild              11.5              14.7              17.2
                 Moderate          2.8               3.7               4.3
                 Severe            0.3               0.4               0.5
                 Profound          0.1               0.07              0.04

It can be seen that, by considering only the adult information, the results of the
Finnish study are consistent with those of the Swedish study, as shown in Table 3.4.

In the main report on the UK National Study of Hearing, Davis (1995) presents
detailed data giving prevalence in 5 dB bands (see Appendix 2) from which it is
possible to estimate the prevalence in the UK of the different EU grades of hearing
impairment. Table 3.6 shows the percentages of subjects in the UK aged from 18 to
80 with hearing impairment in the four categories.

 Table 3.6 Data from UK National Study of Hearing (Davis, 1995) reanalysed into
                    European grades of hearing impairment

                                                     Age group
                                   HI grade
                                                     18 to 80
                                   Mild              16.8
                                   Moderate          4.9
                                   Severe            0.7
                                   Profound          0.2

Using the reanalysed UK and Finnish data it is possible to compare the results for the
UK, Finland and Sweden, as shown in Table 3.7.

     Table 3.7 Prevalence of adult hearing impairment in different categories in UK,
                                  Finland and Sweden

                           UK*               Finland **       Sweden ***        Average
        Age/HI grade       18-80             25-75            20-80
        Mild               16.8              17.2             18.1              16.9
        Moderate           4.9               4.3              4.5               4.6
        Severe             0.7               0.5              0                 0.4
        Profound           0.2               0.04             0                 0.1
        TOTAL              22.6              22.04            22.6              22.2
         * Figures extrapolated from Davis (1995); ** figures extrapolated from Uimonen et al (1999);
         ***figures calculated from Johansson and Arlinger (2003)

It can be seen that the results of the three studies are very similar, particularly for the
mild and moderate grades of hearing impairment. Differences between the studies for
the higher grades are probably due to the exclusion of people likely to be suffering
from noise induced hearing loss in the Swedish study, and the upper age limit of 75
years for the Finnish study. However, as can be seen the overall prevalence of hearing
impairment in the three studies is remarkably consistent. Considering also the


19
20


similarity between the results of the UK and Swedish studies and those of the Italian
study (Quaranta et al, 1996) shown in Table 3.3, it may be assumed that these
prevalence figures are representative of the whole of Europe. Therefore for the
purposes of the current study, it is assumed that the figures given in Table 3.8
approximate the current prevalence among adults in Europe of the four grades of
hearing impairment in the current study. (The figures from Davis (1995) have been
used for the ‘severe' and ‘profound’ categories owing to the likely underestimates in
these categories in the Swedish and Finnish data.)

Table 3.8 Current prevalence among adults in Europe of different grades of hearing
                                 impairment

         Grade of HI        Mild        Moderate       Severe      Profound
         BEHL               21-39        40-69          70-94         95+
         Percentage
                            16.9           4.6           0.7          0.2
         of population

It should be noted that these figures may underestimate the prevalence of hearing
impairment, particularly in the moderate to profound categories, owing to the upper
age limits of 75 and 80 in the studies considered above.


3.5       Prevalence of hearing loss related to age
It is well known that hearing loss increases with age and that, as a consequence, there
are higher percentages of people with moderate and severe or profound hearing loss in
the older age groups than the younger. The changing demographics in Europe, with a
gradually ageing population, will lead to ever increasing numbers of hearing impaired
people.

There are several sources of data on the prevalence of hearing impairment among
different adult age groups in the US. In the UK National Study of Hearing Davis
(1995) classified data according to age and gender. Other more recent studies in
Europe have also examined the prevalence of hearing impairment among different age
groups. This section presents general statistics from the USA and more detailed
European data on the prevalence of hearing loss related to age. The rate of increase of
hearing loss with age is also examined

3.5.1 US data on age and hearing loss
In the US more than 9 million Americans over the age of 65 and 10 million aged 45 to
64 are affected by hearing loss (National Council on the Aging, 1999). Among
seniors hearing loss is the third most prevalent, but treatable, disabling condition,
behind arthritis and hypertension (American Academy of Audiology). Research has
shown that presbycusis affects about 30% of the population aged 65 and over (Gates
et al, 1990) and that about half of over 75 year olds have significant hearing loss
(Cruickshanks et al, 1998).

In analysing the 1994 National Health Interview Survey data O'Neill (1999) states
that 43% of the hearing impaired population are 65 or older, although only 12% of the
population as a whole is within this age group. In addition, people aged 65 and older
are more likely than any other age group to have hearing loss. Figures for other age


20
21


groups are as follows: 29% of the hearing impaired population are aged from 45 to
64; 23% from 18 to 44; the remaining 5% are under 18.

ASHA reports that 4.6% of individuals between the ages of 18 and 44, 14% between
the ages of 45 and 64, and 54% of the population over 65 have hearing loss. The latter
group consists of 23% of individuals between the ages of 65 and 74 and 31% over 75.
These data are from the 1995 National Center for Health Statistics (NCHS) (Benson
and Murano, 1998) and differ from the figures extrapolated by the author from the
1997 data set (see Table 3.9). Furthermore the figure of 54% of over 65 year olds
having hearing loss is considerably greater than the 1 in 3 figure reported elsewhere
(American Academy of Audiology; Gates et al, 1990). A possible reason for these
discrepancies is that the NCHS survey is based upon self reported hearing difficulties.

The NCHS data set on hearing, vision and dental health is broken down into age
groups. The age related hearing data relating to adults in different age ranges (total
number 195,276,000) is presented in Table 3.9.

              Table 3.9 NCHS data on hearing ability in different age groups

                                             Self reported hearing descriptor
                                                                         A lot of trouble or
                       Good                         A little trouble
                                                                         deaf
                       Number*        %             Number*      %       Number*      %
  18 - 44              98155          90.6          8991         8.3     1111         0.1
  45 - 64              43045          78.0          10014        18.2    1718         3.1
  65 - 74              11918          65.6          4997         27.5    1192         6.6
  75 and over          7089           51.2          4786         34.6    1942         14.0
       *                          +
           Numbers in thousands   Percentage of total number of subjects in each category

In 2000 results of an audiometric survey of 3471 older adults, aged from 48 to 92,
were published (Wiley et al, 2000). Results of this survey are summarised in Table
3.10. The category ‘mild’ refers to a pure tone average hearing loss of 26 to 40 dB,
and ‘moderate/marked’ to a loss of greater than 40 dB.

Table 3.10 Data on prevalence of hearing loss among older adults (Wiley et al, 2000)

                                                      Age group
                             48-59               60-69          70-79             80-92
                         N       %           N       %      N       %       N         %
       None              1114 90.1           747     71.6   447     51.4    66        20.5
       Mild              107     8.7         241     23.1   289     33.2    121       37.6
       Mod/marked        15      1.2         55      5.3    134     15.4    135       41.9


3.5.2 European data on age and hearing loss
The UK, Italian, Finnish, Danish and Swedish studies discussed above have also
looked at the prevalence of differing severities of hearing loss in different age groups.
The data in the UK study (Davis, 1995) is presented as the percentages of the
population aged from 18 to 80, in 10 year age groups, with better ear hearing losses
above particular levels; the full range of data is shown in Appendix 2. The Italian
(Quaranta et al, 1996) and Danish (Karlsmose et al, 2000) data is also presented in
this way, although with a limited number of hearing loss categories, and, in the


21
22


Danish study, a limited age range. The Finnish study (Uimonen et al, 1999) presents
results according to the current EU (and former WHO) categories, while Johansson
and Arlinger (2003) present their results in both formats. The relevant data from the
Italian and Scandinavian papers are shown in Appendix 2.

The detailed data in the report on the UK National Study of Hearing (Davis, 1995) has
enabled reclassification into the EU categories. Some of the studies quoted present
data for male and female subjects separately; for the purposes of the analysis here the
data has been combined.

Tables 3.11 and 3.12 present comparisons of available data according to both types of
classification. Johansson and Arlinger (2003) present their data in fewer age groups
than in the other studies (20-50, 50-60, 60-70 and 70-80). Therefore, for the purposes
of comparison of studies, in Tables 3.11 and 3.12 data in the categories 18-30, 30-40
and 40-50 have been added for comparison with the Swedish data. These sums will
not accurately represent the prevalence of hearing impairment in the wider age group
which will depend upon the relative numbers of people in the three narrower age
ranges. However, they are likely to give a reasonable approximation.

     Table 3.11 Comparison of age related data from UK (Davis, 1995), Finland
  (Uimonen et al, 1999) and Sweden (Johansson and Arlinger, 2003) in EU hearing
          loss categories (Figures given are percentages of sample studied)

                                                Hearing loss grade
                                                      (dBHL)
                                Mild      Moderate     Severe Profound      All
       Age      Study
                               (21-39)     (40-69)     (70-94)    (≥95)   grades
                UK               2.4         0.2         0.0       0.0      2.6
       18-30    Finland          0.4         0.4         0.0       0.0      0.8
                Sweden
                UK               4.5          0.4           0.1   0.6      5.6
       31-40    Finland          1.7          0.0           0.0   0.3      2.0
                Sweden
                UK              11.2          2.0           0.2   0.1      13.5
       41-50    Finland          6.1          0.5           0.0   0.0      6.6
                Sweden
                UK*             18.1          2.6           0.3   0.7      21.7
       18-50    Finland*         8.2          0.9           0.0   0.3      9.4
                Sweden**         4.0          0.0           0.0   0.0      4.0
                UK              23.2          5.0           0.5   0.1      28.8
       51-60    Finland         14.0          1.7           0.2   0.0      15.9
                Sweden          16.9          1.3           0.0   0.0      18.2
                UK              40.1          8.9           1.2   0.6      50.8
       61-70    Finland         31.2          5.8           0.2   0.0      37.2
                Sweden          48.9          7.6           0.0   0.0      56.5
                UK              44.3         26.5           3.1   0.1      74.0
       71-80    Finland         45.1         16.7           2.7   0.0      64.5
                Sweden          54.5         28.8           1.0   0.0      84.3
       * Approximation – sum of three previous age groups
       ** Figures are for age range 20 to 50

It can be seen from both tables that there is in general close agreement between the
results of the UK and Italian studies. However, the figures from the Finnish, Swedish
and Danish studies are somewhat lower for the younger age groups. These


22
23


discrepancies may be due to the differences between the studies discussed in Section
3.4.1.

However, all studies clearly demonstrate the effects of ageing on hearing loss with the
older age groups shown much higher prevalence of hearing impairment than the
younger groups.

    Table 3.12 Comparison of age related data from UK (Davis, 1995), Finland
(Uimonen et al, 1999), Denmark (Karlsmose et al, 2000) and Sweden (Johansson and
                    Arlinger, 2003) in selected BEHL categories
                 (Figures given are percentages of sample studied.)

     Age       Study          ≥25      ≥35     ≥45      ≥65     ≥75    ≥85   ≥90    ≥95
               UK            1.8      0.4     0.2      0.0     0.0    0.0           0.0
               Italy         1.85             0.56     0.0                   0.0
     18-30
               Denmark
               Sweden
               UK            2.8      1.4     1.1      0.7     0.7    0.6           0.6
               Italy         3.89             1.11     0.56                  0.28
     31-40
               Denmark       1.5      0.6     0.0
               Sweden
               UK            8.2      4.0     1.7      0.3     0.3    0.1           0.1
               Italy         8.29             1.46     0.49                  0.24
     41-50
               Denmark       5.3      1.3     0.04
               Sweden
               UK*           12.8     5.8     3.0      1.0
               Italy*        14.03            3.13     1.05
     18-50
               Denmark
               Sweden**      1.6      0.4     0.0      0.0
               UK            18.9     7.8     4.0      0.9     0.4    0.1           0.1
               Italy         18.73            4.13     1.38                  0.28
     51-60
               Denmark
               Sweden        11.3     4.8     0.6      0.0
               UK            36.8     16.2    7.4      2.3     1.4    1.0           0.6
               Italy         37.66            6.65     2.85                  1.27
     61-70
               Denmark
               Sweden         42.3    12.4     5.8       0.0
               UK            60.3     40.0    17.6     4.0     2.5    1.0           0.1
               Italy         69.44            21.11     4.44                 0.0
     71-80
               Denmark
               Sweden         73.8    43.4     21.6     1.8
        * Approximation – sum of three previous age groups
        ** Figures are for age range 20 to 50

All of these studies are concerned with people up to the age of 80. The RNID
produces figures for the UK for all ages above 16 years, as shown in Table 3.13 (note
that the RNID categories are the same as the EU grades, except that ‘mild’ starts at 25
dB HL, rather than 21 dB HL as shown in Chapter 2).


23
24


Table 3.13 Estimated percentages of UK population who are deaf or hard of hearing

                                                   Age group
                                 16 - 60           61 - 80           81+
                 Degree of
                                 Percentage        Percentage        Percentage
                 deafness
                 Mild            4.6               28.1              18.4
                 Moderate        1.6               16.5              57.9
                 Severe          0.2               1.9               13.2
                 Profound        0.1               0.4               3.6
                 All             6.6               46.9              93.2

The RNID figures show that over 90% of people over the age of 80 have some degree
of disabling hearing impairment, with well over half of this age group being
moderately impaired.

This figure agrees closely with that found in an earlier UK study of hearing
impairment among elderly people (Herbst and Humphrey, 1980). In this study the
hearing of 253 subjects over the age of 70 was studied. Measured hearing levels are
shown in Table 3.14.

 Table 3.14 Hearing levels of 253 subjects in London (Herbst and Humphrey, 1980)

          Hearing loss dB*
                                                  Age                             Total
                                      70-79                  80+
                                  No      %           No           %        No       %
          0-34 (not deaf)         88      47          12           18       100      40
          35-44 (moderate)        38      20          8            12       46       18
          45-69 (substantial)     47      25          34           51       81       32
          70+ (severe)            13      7           13           19       26       10
          Total                   186     100         67           100      253      100
         * Better ear hearing loss, average of frequencies 1, 2 and 4 kHz

Table 3.14 shows that 53% of the subjects over 70 had some degree of hearing loss
(according to the definitions used) and 92% of the subjects over 80. Using current
definitions of hearing loss grades these numbers would be higher.

Hietanen et al (2004) have recently published the results of a 10 year study designed
to investigate changes in hearing between the ages of 80 and 90. The results of this
study are tabulated in Appendix 2. The hearing of 291 subjects aged 80, 85 and 90
years were considered both cross-sectionally and longitudinally. The data shows that
over 95% of subjects aged 90 are hearing impaired, of whom the majority have
‘moderate’ hearing loss.

3.5.3 Increase of hearing loss with age
The previous sections show that both the severity and the prevalence of hearing loss
increase with age. Some authors have examined the increase in hearing loss over a
period of years (Davis, 1991; Bech et al, 1996; Rosenhall et al, 2000; Hietenan et al,
2004).

Davis (1991) compared results of surveys of changes in hearing in the UK and in
Denmark. There was good agreement between the results of the two surveys which


24
25


showed a mean rate of deterioration of 1 dB over 2 years, and around 5 to 6 dB per
decade. The rate of deterioration was found to be highly dependent upon age, the
older the subject the greater the deterioration. Over the age of 55 the rate is
approximately 9 dB per decade, while under 55 the rate is about 3 dB per decade.

Bech et al (1996) surveyed the hearing of around 2000 subjects aged 80 and above in
Denmark. The median hearing levels for different age groups are shown in Table
3.15. The deterioration is slightly less than that found by Davis (1991).

     Table 3.15 Median hearing levels of people over the age of 80 (Bech et al, 1996)

                       Age     80-84     85-89      90-94   >= 95   All
                      BEHL      49        51         53      50     50

Rosenhall et al (2000) compared the results of the Danish study by Bech et al (1996)
with those of other studies of hearing of people aged 85, 88 and 90 in Sweden, and
Wales. The median BEHL for men and women in each study is shown in Table 3.16.

     Table 3.16 Comparison of results of studies of people aged 85 to 90 in Sweden,
                    Denmark and Wales (Rosenhall et al, 2000)

             Age         Sweden         Denmark       S Wales, GB      All
                         N = 592         N = 188        N = 132      N = 912
                        M       F       M       F      M       F    M       F
              85        46     39       49     43      51     48    47     41
              88        48     41       48     51      41     58    48     45
              90        48     44       59     48      64     63    50     49

The table shows considerable differences between the three countries; the authors
suggest that these may be due to small sample sizes and methodological differences.
However a consistent pattern of gradual deterioration in hearing over the five years is
apparent.

Median hearing levels of 80 to 90 year olds in the 10 year study in Finland by
Hietanen et al (2004) are shown in Table 3.17.

  Table 3.17 Median hearing levels of 80 to 90 year olds in Finland (Hietanen et al,
                                       2004)

                                                        Age
                                        80 years     85 years     90 years
                                       M     F      M     F     M      F
                   Cross sectional     41.2 33.8    47.5 42.5   53.8 47.5
                   Longitudinal        37.5 32.5    47.5 40.0   53.8 47.5

Table 3.17 shows a slightly smaller deterioration in hearing from 85 to 90 than from
80 to 85, although there is a marked decrease in hearing ability over the decade.


3.6     Prevalence related to gender and other factors
While it is well known that older people are more likely than younger people to be
affected by hearing loss, there is some evidence of relationships between hearing


25
26


impairment and gender, plus other social factors such as economic status and
ethnicity. The following sections discuss these issues.

3.6.1 Hearing loss and gender
In the UK the RNID reports that above 40 years of age more men than women
become hard of hearing, probably because more men are exposed to industrial noise.
However, over the age of 80 there is a greater number of hard of hearing women than
men because the life expectancy of women is higher than that of men (RNID, 2003).

The same difference between men and women is found in US data. The American
Academy of Audiology reports research by Wallhagen et al (1997) which found that
men are more frequently affected than women in the 35 to 60 year age group. In
analysing the 1994 NHIS data O’Neill (1999) found that 61% of people with hearing
loss were male although only approximately 50% of the population was male. Men
of all ages were found to be more likely than women to have hearing loss, but the gap
widened with age. In the 0-17 age range 0.6% of the female population was hearing
impaired compared with 0.8% of the male population, but in the 65+ age group the
percentages have increased to 10% (female) and 19% (male). Data is not given for
the 80+ age group for comparison with the UK information.

The 1998 National Center for Health Statistics (NCHS) hearing data for male and
females is shown in Table 3.18 and is further broken down into age groups in Table
3.19.

     Table 3.18 NCHS data on prevalence of hearing abilities for males and females

                                       Self reported hearing descriptor
                                                                  A lot of trouble
                          Good                 A little trouble
                                                                  or deaf
                          Number*     %+       Number* %+         Number* %+
             Male         73544       78.5     16452       17.6   3472        3.7
             Female       86663       85.3     12336       12.1   2491        2.5
            *Numbers in thousands +Percentage of total number of subjects in each category

            Table 3.19 NCHS data on hearing ability related to gender and age

                                                Self reported hearing descriptor
                                                                          A lot of trouble
                                    Good                A little trouble
                                                                          or deaf
                                    Number*      %+     Number*      %+   Number*      %+
                 18-44 years        47823        89.1 5094           9.5  633          1.2
     Male        45-64 years        19047        71.7 6320           23.8 1135         4.3
                 Over 64 years      6673         49.5 5039           37.4 1704         12.6
                 18-44 years        50331        91.9 3897           7.1  478          0.9
     Female      45-64 years        23998        84.7 3695           13.0 583          2.1
                 Over 64 years      12334        66.5 4745           25.6 1430         7.7
                                         +
      *Numbers in thousands               Percentage of total number of subjects in each category


26
27


Table 3.18 shows that, over all ages, the biggest difference between male and female
hearing is in the ‘a little trouble’ category, males being one and a half times more
likely than females to experience slight hearing difficulties. From Table 3.19 it can
be seen that, in the 45 - 64 age group, males are around twice as likely as females to
have hearing problems. For people over 64, the ratio is again 1.5.

Differences in the prevalence of hearing loss among males and females have also
been considered in the European studies discussed in previous sections (see also
Appendix 2 for data from these studies).

In the Italian study (Quaranta et al, 1996) no significant differences were found
between hearing levels of men and women. In comparing Danish, Swedish and
Welsh studies of people aged between 80 and 90, Rosenhall et al (2000) found gender
differences, particularly in the Swedish study, with men in general having poorer
hearing than women. In the Danish study by Karlsmose et al (2000) deterioration in
hearing with age was more pronounced in male than female subjects. The earlier
Danish study (Bech et al, 1996) considered by Rosenhall et al (2000) found no
statistically significant differences between male and female subjects in terms of
hearing level from 0.5 to 4 kHz. However, when hearing at higher frequencies was
considered, significant differences were found with women having better hearing than
men. A similar difference was found by Hietenan et al (2004) in their longitudinal
study of hearing impairment among elderly people in Finland. At the age of 90
women had significantly better hearing than men at the 4 kHz frequency. The
differences between men and women in deterioration in hearing at the higher
frequencies are also illustrated by Davis (1997) in presenting results of the UK
National Study of Hearing (Davis, 1995). However, Johansson and Arlinger (2003),
in a recently published Swedish study, found gender to be statistically significant only
in the 50 to 60 year age group, with women having better hearing than men. This
may be due to the exclusion from the study of subjects who had been exposed to
industrial noise.

3.6.2 Hearing loss and ethnicity
There is conflicting evidence as to whether the prevalence of hearing loss is higher
among members of minority ethnic groups than other groups. The RNID suggests that
this might be the case (RNID, 2003) and considers that it is especially true of recent
immigrants from regions with greater levels of poverty, poor health care and low
levels of immunization against diseases such as rubella.

However, O'Neill, in his analysis of the 1994 NHIS data (O’Neill, 1999) found that in
the US white people were more than twice as likely as black people to have hearing
loss. Although white people comprised 83% of the population of the US, 91% of the
population with hearing loss is white. White people of all ages were more likely than
black people to have hearing loss, but the gap widened with increasing age. (It is not
clear, however, what the definition of 'black' is in this context.)

The prevalence of hearing impairment among ethnic groups can also be seen from the
NCHS data. The NCHS data in Table 3.20 shows the breakdown of the subjects into
four racial groupings.


27
28


     Table 3.20 NCHS data on prevalence of hearing abilities among different racial
                                      groups

                                                Self reported hearing descriptor
                                                                          A lot of trouble
                                   Good                 A little trouble
                                                                          or deaf
                                   Number*     %+       Number* %+        Number* %+
          White non-Hispanic       116567      79.5     24538       16.7  5288        3.6
          Black non-Hispanic       19370       89.2     1987        9.0   331         0.2
          Other non-Hispanic       6842        89.1     652         8.5   154         2.0
          Hispanic                 17428       90.5     1611        8.4   191         1.0
      *                                          +
          Numbers in thousands                   Percentage of total number of subjects in each category

The data presented in Table 3.20 supports the findings of the NHIS survey (O’Neill,
1999) that hearing loss is more prevalent among the white population of the US than
among other communities.

3.6.3 Hearing loss and socio-economic status
Relatively little evidence relating hearing loss to socio-economic status has been
found. O'Neill (1999) reports that in the US the prevalence of hearing loss at all ages
decreases as family income increases (however, it is possible that this merely reflects
the lower grades of work undertaken by hearing impaired people, see Chapter 11).
People with family income of less than $20,000 are reported to be more than twice as
likely to have hearing loss as those with a family income of $50,000 or more. Related
to this is the fact that the prevalence of hearing loss among adults is greater for those
who are not high school graduates.

The 1997 NCHS data categorises respondents as 'poor', near poor' and 'not poor'.
(These definitions are based upon the US Central Bureau's poverty thresholds.) The
data on hearing is broken down into the three categories as shown in Table 3.21 and
further broken down by age as shown in Table 3.22.

  Table 3.21 NCHS data on prevalence of hearing abilities related to poverty status

                                        Self reported hearing descriptor
                                                                   A lot of trouble
                                    Good          A little trouble
                                                                   or deaf
                               Number* %+       Number* %+         Number* %+
                  Poor         16213   81.4     2889         14.5  802         4.0
                  Near poor    23654   78.9     5071         16.9  1221        4.1
                  Not poor     90706   82.6     16224        14.8  2853        2.6
              *                          +
                  Numbers in thousands   Percentage of total number of subjects in each category


28
29


         Table 3.22 NCHS data on hearing ability related to poverty status and age

                                Self reported hearing descriptor
                                                                           A lot of trouble
                                Good                A little trouble
                                                                           or deaf
                                Number*    %+       Number*     %+         Number* %+
               18-44 years      11604      89.4     1179        9.1        189         1.5
     Poor      45-64 years      2925       72.2     874         21.6       250         6.2
               Over 64 years    1684       58.4     837         29.0       363         12.6
               18-44 years      15405      88.7     1711        9.9        242         1.4
     Near
               45-64 years      4254       74.6     1224        21.5       221         3.9
     poor
               Over 64 years    3994       57.9     2135        31.0       758         11.0
               18-44 years      55653      90.5     5256        8.6        540         0.9
     Not
               45-64 years      26918      78.0     6588        19.1       1000        2.9
     poor
               Over 64 years    8135       58.8     4380        31.7       1313        9.5
     *                                 +
         Numbers in thousands          Percentage of total number of subjects in each category

Table 3.21 shows that people of all ages in the ‘poor’ and ‘near poor’ categories are
one and a half times more likely to have serious hearing problems than those who
consider themselves ‘not poor’. From Table 3.22 it can be seen that this ratio is
maintained for people in the 18 – 44 age group, whereas in the 45 – 64 group ‘poor’
people are twice as likely as ‘not poor’ to have severe problems. The differences
between the three poverty levels are not so marked for people with slight hearing
problems. This again could reflect the employment situations of deaf and hard of
hearing people, as discussed in Chapter 11.


3.7    Predicted increase in prevalence of hearing impairment
It is generally agreed that the prevalence of hearing loss (in terms of both
known/reported cases and actual cases) will increase significantly over the next two to
three decades. Reasons for the predicted increase include genetic disposition,
presbycusis (related to the demographic changes leading to the 'ageing population'),
exposure to noise at work and exposure to environmental/leisure noise.

3.7.1 Genetic and other causes
In recent years programmes of screening of new born babies for hearing loss have
been introduced in the USA and UK (see Appendix 1). Results of these screening
programmes suggest that the previous estimate of 1 in 1000 live births with congenital
hearing loss (in the US) is an underestimate, the actual figure being closer to 3 in
1000 (American Academy of Audiology). In addition to children who are born with
hearing loss others have later onset or progressive hearing loss, leading to an increase
in the prevalence of hearing impairment up to the age of 9 years (Fortnum et al, 2001;
see Appendix 1). Little data has been found at this stage to indicate whether the
increase is a real increase in the number of children born with or developing hearing
loss, or merely a reflection of improved screening and diagnosis techniques.

Marazita et al (1993) present data to suggest that the relative proportions of sporadic
and genetic causes among children with profound, early-onset deafness in the US
have changed in the past 30 years; deafness was attributable to sporadic causes in
49.3% of cases and to genetic causes in 50.6% in 1970, whereas more recent data
shows 37.2% of cases to be sporadic and 62.8% genetic. There is a considerable
amount of research currently being undertaken to examine the causes of


29
30


genetic/hereditary deafness but the examination of this data is beyond the scope of
this report.

3.7.2 Presbycusis and ageing
In Section 3.5 the increase in prevalence of hearing impairment with age was
discussed. The major reason for the anticipated increase in the numbers of hearing
impaired people is the demographic changes relating to the general ageing of the
population, whereby the percentage of people over the age of 65 will increase
dramatically in the next few years.

The World Health Organisation fears that, because of the increase in world population
and lengthening life expectancy, the numbers with disabling hearing impairment will
substantially increase in future unless decisive public health action is taken (WHO,
2002). Data from the WHO also show how the prevalence of hearing impairment has
increased world wide in the past few years. In 1995 the WHO estimated that there
were 120 million people with disabling hearing difficulties world wide (Smith, 1998)
whereas in 2001 the WHO estimate was 250 million people, of whom two thirds live
in developing countries (WHO, 2002). (Note that the term 'disabling hearing
difficulty' in this context refers to moderate or worse hearing impairment in the better
ear.) The WHO also claims that exposure to occupational and urban, environmental
noise, is a major (avoidable) cause of permanent hearing impairment worldwide
(Smith, 1998).

In the US hearing loss is the third most prevalent chronic health condition facing
seniors (American Academy of Audiology). It is predicted that in the next 15 years
78 million people in the US will be over 50 years of age, with a resultant increase in
the number of hearing impaired persons. As discussed in Section 3.3, the figure
currently given in the US for numbers of people with hearing loss is 28 million, that is
1 in 10 of the population. This number is expected to increase rapidly over the next 10
years and to almost double by 2030 (American Academy of Audiology; Hear This
Organisation, 2002).

At present presbysucis affects about 30% of the population in the US who are aged 65
and over (Gates et al, 1990) and about half those over 75 years have significant
hearing loss (Cruikshanks et al, 1998). Figures given for the UK are higher with an
estimated 55% of people over the age of 60 currently deaf or hard of hearing (RNID,
2003).

Davis (1991) argued that, with no change in prevalence rates among different age
groups, demographic changes alone in England and Wales would increase the number
of hearing impaired people by 20% over the following 20 years. Davis has also
estimated the numbers of hearing impaired people in the UK (Davis, 1997) and in
various other areas of the world up to the year 2025. Some of this data is tabulated in
Appendix 2. Of particular interest to the current study are his predictions for Europe
for years 2005 and later, which are shown (in simplified form) in Table 3.23.


30
31


     Table 3.23 Estimated numbers (to nearest million) of hearing impaired adults in
                          Europe (adapted from Davis, 1997)

                                            Hearing threshold
                  Year   Gender
                                     ≥25    ≥35    ≥45    ≥65     ≥95
                         Male         40     21     11     4       1
                  2005   Female       42     27     16     5       1
                         Overall      82     49     27     8       2
                         Male         45     24     13     4       1
                  2015   Female       45     30     17     5       1
                         Overall      91     54     30    10       2
                         Male         50     28     15     6       1
                  2025   Female       50     33     19     6       1
                         Overall     100     61     34    11       2


3.7.3 Effects of noise exposure
In addition to the expected increase in hearing impairment due to the ageing
population, there is some evidence of increases in recent years among younger age
groups, which will also impact on the total numbers of people with hearing difficulties
in the future. O'Neill quotes data which shows a large increase between the years
1971 and 1990 in the number of younger Americans with hearing problems; increases
of 26% among 45 to 64 year olds, and 17% in the 18 to 44 age group (O’Neill, 1999;
Ries, 1994). Further evidence was provided by Wallhagen et al (1997) who studied
over 5000 men and women in Alameda County in the US and found a 150% increase
in hearing impairment among the over 50 age group from 1965 to 1994. These
increases among the younger age groups are attributed to environmental noise,
although the author is unaware of any studies showing a direct causal link between
exposure to general environmental noise and hearing loss.

The relationship between occupational noise exposure and hearing loss is well known.
It is estimated that 30 million people are at risk of noise induced hearing loss (NIHL)
in the US where it is the most common occupational disease and the second most self
reported occupational illness or injury (American Academy of Audiology; Hear This
Organisation, 2002). In the UK it is estimated that between 1.1 million and 1.3 million
people are at risk of NIHL and that 170,000 people suffer deafness, tinnitus and other
ear conditions as a result of exposure to excessive noise at work (Health and Safety
Executive, 2003; Hearing Research Trust, 2001). However, it is to be expected that
increased awareness of the hazards of noise in the workplace, plus further tightening
of noise at work legislation (for example the new European Directive on noise at work
(European Commission, 2003)) will decrease the percentage of the population in the
developed world who suffer from NIHL.

A major current cause of concern is exposure to loud levels of music. It is estimated
in the UK that 20% of young people are regularly exposed to dangerous levels of loud
music (Hearing Research Trust, 2001). It is assumed that this is a reason for the
increase in deafness among younger adults, as discussed by O'Neill (1999). Unless
noise levels are reduced in clubs and other venues where loud music is played the
increase of hearing impairment among the younger age group will be increased; this
will further increase the prevalence of hearing loss among the middle aged and elderly
in 20 to 30 years’ time.


31
32


It is possible that there are links between risk of hearing loss and other (non-auditory)
environmental factors. For example, there is evidence that 70% of smokers are at risk
of hearing loss in middle or old age (Hear This Organisation, 2002). There is also
some evidence of relationships between the adverse effects of noise on hearing and
ototoxic drugs or chemicals (WHO, 1999).


3.8   Summary
The main findings of this chapter are summarised below.

•    The WHO estimated that in 2002 there were over 250 million people world wide
     with disabling hearing impairment, of whom two thirds were in developing
     countries.
•    It is estimated that there are 28 million hearing impaired people in the USA (1 in
     10 of the population).
•    It is estimated (2003) that there are 9 million hearing impaired people in the UK
     (1 in 7 of the population).
•    In Europe the current prevalence of adult hearing impairment (using current
     European classification of hearing loss grade) is estimated from various surveys to
     be approximately 16.9% with mild hearing loss; 4.6% with moderate hearing loss;
     0.7% with severe hearing loss; 0.2% with profound hearing loss.
•    Prevalence and severity of hearing loss increase with age.
•    Over 90% of people aged 80 or older and over 95% of people aged 90 or older are
     hearing impaired
•    In general over a lifetime hearing deteriorates at a rate of 5 to 6 dB per decade.
•    Over the age of 55 hearing deteriorates at a rate of approximately 9 dB per decade,
     while under 55 the rate is about 3 dB per decade.
•    In general women have better hearing than men, the differences in hearing level
     increasing with age and at the higher frequencies.
•    In the USA hearing loss appears to be more prevalent among the white population
     than among other communities.
•    Data from the US suggests that hearing loss is related to economic status.
•    There will be a significant increase in the prevalence of hearing loss over the next
     twenty or thirty years.
•    It is estimated that there will be approximately 100 million hearing impaired
     people in Europe by the year 2025.


3.9    Conclusions
This chapter has reviewed research concerning the prevalence of hearing impairment
among adults, particularly in Europe. Data on prevalence produced by various
independent studies is reasonably consistent and allows the current prevalence in the
four grades of hearing loss to be estimated (see Table 3.8). These figures are used in
Chapter 12 in evaluating the current costs to Europe of hearing impairment.

It is important to the hearing aid community to note the extent of the likely increase in
prevalence, with a consequent demand for hearing aids over the coming decades. This
is due mainly to the ageing population of Europe and also to other factors which may
increase prevalence in certain age groups.


32
33


It can be seen from this chapter that many people in Europe are at risk of suffering
detrimental effects on their lives due to hearing loss. The following two chapters
review literature concerned with the psychosocial impacts of hearing loss, which
reduce quality of life.


33
34


CHAPTER 4              MAJOR    STUDIES  OF   PSYCHOSOCIAL
                       EFFECTS OF HEARING IMPAIRMENT

4.1     Introduction
An extensive literature review of the psychosocial effects of hearing loss has been
carried out. The review presented here and in the following chapter has focused on
the effects of hearing impairment on adults. There is a body of research concerning
the effects of hearing loss on children, in particular on their speech and language
development, but this research is beyond the scope of this report.

This report focuses on a review of the literature related to the psychological and social
effects of hearing impairment. Only literature relating to people with partial, rather
than total, hearing loss has been included; literature relating to people who are totally
deaf and unlikely to benefit from hearing aids is not reviewed here. However, some of
the papers considered in the report also discuss effects of hearing impairment on
people who are totally deaf as well as those who are hard of hearing.

As the papers considered span the past three decades, there are many different terms
used to describe hearing impairment. In particular, the term ‘deafness’ has different
meanings. In general, in the earlier papers ‘deafness’ is used to refer to both total and
partial hearing loss whereas in the later papers ‘deafness’ means only total hearing
loss. Where there is ambiguity the use of the term deafness is clarified.

In the studies here and in Chapter 5, many different methods have been used to assess
the effects of hearing impairment. In some cases particular scales have been used to
assess specific areas relating to the quality of life, for example physical or emotional
health. Some of the scales used are ones previously developed for assessing general
health welfare or in other studies related to hearing; others are modifications of
existing scales. Some authors have designed their own questionnaires for use in a
particular survey. The most commonly used scales are summarised in Appendix 3.

The studies are presented in this chapter in approximately chronological order. The
majority of the research on psychosocial effects of hearing loss relates to the impact
on adults of acquired, rather than congenital, hearing loss. The work reviewed here is
therefore mainly concerned with the effects of hearing impairment that develops in
adolescence or later in life.

It can be seen that very little research in this area was undertaken before the mid
1970s. Although since then there has been a large body of research into the
psychosocial effects of hearing loss, much of it is concerned with the impact of
hearing impairment on the quality of life of elderly people. There is a noticeable gap
in the literature concerning the impact of hearing loss on the lives of young adults and
people under the age of 50.

The larger studies considered here which have used quantitative techniques are
summarised in Appendix 4.


34
35


4.2     An early review (Oyer and Oyer, 1979)
In 1979 Oyer and Oyer published a review into the effects of hearing loss for elderly
people (Oyer and Oyer, 1979). This was the first publication to discuss in detail the
social effects of hearing impairment and it highlighted the need for research on the
consequences of hearing loss among older people. The authors considered that
hearing loss or the wearing of a hearing aid reinforced the already negative view of
elderly people, which often influenced elderly people themselves. They cited
experimental work carried out in the 1960s showing that when someone is constrained
and sensory input is diminished, then they feel a greater sense of being imprisoned
and anxiety, and the authors equated these results with the experiences of many older
people.

Oyer and Oyer list the following social consequences of auditory deprivation among
elderly people:

•    Embarrassment – caused by mishearing or misunderstanding and leading to
     withdrawal from communication situations
•    Fatigue – caused by trying to hear and trying to make oneself understood by
     others who do not hear well
•    Increased irritability – associated with experiences of failure
•    Increased tension – particularly increased marital tension
•    Avoidance and withdrawal – by the hearing impaired individual due to fear of
     failure, and by those who must interact with them for fear of being misunderstood
     (likely to be worse among older than younger adults)
•    Increased endangerment to bodily safety – caused by failure to hear alarm signals
     or locating sources
•    Boredom – the hearing impaired individual may engage in monologue so as to
     avoid questions, thus becoming a social bore; boredom may also develop as a
     result of channels of communication being closed to the hearing impaired person
•    Social rejection – as a result of the inability to understand what is being said
•    Increased vulnerability to promises of restored hearing – similar to that of any
     other disabled people who hope for cures for their condition
•    Depression – hearing loss can lead to suspiciousness and paranoia
•    Acting upon misinformation – older people with severe hearing loss may respond
     inappropriately to cues, and others who interact with them may similarly respond
     inappropriately to cues generated by them
•    Negativism – slowness to respond or lack of response which may be interpreted as
     such
•    Diminished opportunities to assume leadership roles – a result of retirement which
     is exacerbated by hearing loss
•    Reduction in amount of information – compounded by hearing loss in older
     people.


4.3     First major study of psychosocial effects (Thomas and Herbst, 1980)
This study by Thomas and Herbst, published in 1980 (Thomas and Herbst, 1980) was
one of the earliest investigations into the social and psychological implications of
acquired deafness. It was a significant piece of work, and is cited in many of the later
publications. The authors concluded that by the time patients attend a hearing aid


35
36


clinic their lifestyle reflects the distressing psychosocial effects of acquired deafness,
and warn that the possibly pernicious effects in later life of loneliness and withdrawal
caused by uncared for deafness in middle age should not be ignored.

The authors discussed earlier studies which had been undertaken to investigate the
links between personality, psychiatric disturbance and hearing loss and comment on
their limitations. Consistently with Oyer and Oyer (1979), the authors point out the
lack of previous research into the effects of acquired hearing loss on employment,
social and family life.

The study described here was carried out between 1975 and 1978, and investigated
the relationships between hearing impairment and psychiatric disturbance, general
health and well being, social and family life, and employment as well as the efficacy
of rehabilitative provision. The study was based upon a sample of 211 people of
employment age (120 males and 91 females) who had owned a hearing aid for
between 1 and 7 years, and did not include people with untreated hearing loss. The
hearing aids used were either body aids (47% of sample, 100 subjects) or monaural
behind-the-ear aids. Of those subjects with body aids 16 rarely and 34 never used
them, while 13 rarely and 5 never used their post-aural aids.

An important aspect of this study, which does not occur in many of the more recent
investigations, is that the results for the hearing impaired sample were compared with
those of a matched hearing control group, which consisted of 410 subjects. Another
significant feature of this research is that the subjects were of employment age
(between 16 and 64 years of age, although 66% of the hearing impaired sample were
aged 50 or over) whereas the majority of other studies have concerned more elderly
subjects who are usually retired.

The distribution of hearing loss among the hearing impaired subjects was as follows:
16% borderline (0-39 dB HL); 66% moderate (40-69 dB HL) and 18% severe to
profound (above 70 dB HL).

The subjects were interviewed and tested, each interview session consisting of the
following:

     •   pure tone air and bone audiometry tests
     •   speech audiometry test using Boothroyd word lists
     •   self-administered psychiatric screening inventory, consisting of anxiety and
         depression subscales
     •   structured questions on employment, family and social life, general health and
         well being
     •   structured questions relating to hearing aid use
     •   a cup of tea.

The findings of the survey are described below and, where possible, comparisons
between the hearing impaired group and the control group are summarised in Table
4.1.


36
37


4.3.1 Psychiatric disturbance
The assessment of psychiatric disturbance was based upon the measures of anxiety
and depression. The study found that 39, or 19%, of the 205 hearing impaired subjects
who completed this section of the survey were screened as being disturbed, compared
with 5% of the general population. (The authors believe that the figure of 19% may in
fact be an underestimate.) There was no simple linear relationship between pure tone
hearing loss and speech discrimination ability or psychiatric disturbance but when
these latter two effects were combined there was a dramatic increase in the proportion
of psychiatric disturbance. Of those with a hearing loss of over 70 dB plus a speech
discrimination score of 70% or less with aided hearing, 57% were screened as
psychiatrically disturbed (compared with 5% of the general population). The authors
therefore conclude that a severe hearing loss constitutes as much of a psychiatric
problem as does a severely restricting physical disability. Interestingly, tinnitus did
not appear to increase the likelihood of psychiatric disturbance, which was also not
related to the duration of deafness.

Being screened as psychiatrically disturbed was found to relate significantly to other
factors related to hearing loss. These include unhappiness at work, changing jobs due
to deafness, being lonely, having no friends, deafness adversely affecting marriage,
feeling near to a nervous breakdown and overall dissatisfaction with life.

4.3.2 General health and well being
This aspect of the survey covered physical disability, getting to sleep, staying asleep,
having enough energy, consulting a doctor about a nervous problem, satisfaction with
general state of health and questions relating to worry. In all categories except getting
to sleep, there were significant differences between the hearing impaired and the
control groups, the former being ‘worse off’ in each case. Of the hearing impaired
respondents 28% reported further health problems, while only 13% of the control
group reported any health problems at all including hearing loss. The only area in
which there was no difference at all was in responses to questions designed to
measure suspiciousness.

4.3.3 Social and family life
The overriding effect of hearing impairment found in this study was loneliness, 24%
of the hearing impaired group describing themselves as lonely, compared with 14% of
the control group. The authors highlight the fact that extreme loneliness (feeling
lonely all the time or very often) appeared to be more prevalent among hearing
impaired people of employment age than among retired and elderly populations in
general. Of those who said they felt extremely lonely 60% were also screened as
psychiatrically disturbed, indicating the stress that may be caused by loneliness. The
extent of loneliness did not appear to be related to degree of hearing loss, suggesting
that any perceived breakdown in communication is likely to cause feelings of
loneliness. This implies that people who are moderately deaf are likely to feel as
lonely as those who are severely deaf, or that any degree of hearing impairment is
likely to lead to feelings of loneliness.
The authors divided loneliness into two categories: social isolation (concerning
relationships outside the home) and emotional isolation (concerning family
relationships).


37
38


Of the hearing impaired respondents 40% suffered from social isolation (had no
friends at all or fewer than most people) compared with 25% of the control group,
while 40% of the hearing impaired group found it quite or very difficult to make
friends, compared with 15% of the controls. 45% suffered from emotional isolation
(had no or only one person to turn to for support in daily life) compared with 26% of
the control group; while 27%, compared with 12% of the controls, felt that they were
left out of discussions and decision-making at home.

42% of hearing impaired subjects felt that their hearing problem was not understood
by those closest to them. Less than half (48%) felt that their spouse understood what it
was like to be hearing impaired.

4.3.4 Denial
Of the hearing impaired sample 125 (59%) admitted that they tended not to tell other
people of their deafness. The reasons given were that they felt embarrassed or
ashamed (40 subjects, 19%); they had found that if they did admit their hearing
problem then the public treated them badly (27 subjects, 13%); they felt they did not
need to reveal their deafness (53 subjects, 25%); while 5 subjects did not know the
reason. Thus at least 67 subjects (32% of the sample) could identify negative social
responses to their hearing impairment and so took steps to conceal it.

4.3.5 Employment
It was found that hearing impaired people were neither more nor less likely to be at
work than those with normal hearing (this finding contradicts those of subsequent
surveys which are discussed in Chapter 12), although it is possible that the situation
has changed in the past 20 years.) However, 11% of the hearing impaired sample had
changed their job due to their deafness. The authors found no evidence that duration
of deafness affects employment or that hearing impaired people felt that their
prospects of promotion differed from those with normal hearing. However, there was
some evidence that severe deafness may deter people from remaining at work.
Severely deaf people who were not at work appeared to be happier with life than
those who were, while hearing impaired subjects were significantly less happy at
work than a comparable group of hearing people. There is thus some evidence to
suggest that hearing loss lowers the quality of working life.

4.3.6 Summary
This study provided much evidence to show that hearing impairment has a detrimental
effect upon the quality of life. The differences between the hearing impaired group
and the control group are summarised in Table 4.1.


38
39


     Table 4.1 Significant differences between hearing impaired and control groups

                   Category of effect     Hearing          Control
                                          impaired %       group %
                   Psychiatric            19               5**
                   disturbance            57*
                   Health problems        28               13
                   Loneliness             24               14
                   Social isolation       40               25
                   Difficulty making      40               15
                   friends
                   Lack of emotional      45               26
                   support
                   Left out of family     27               12
                   life
                    ** Figure for the general population, not the control group
                    * Refers to those with >70 dB HL and speech discrimination < 70%


4.4     Noise induced hearing loss (Hetu et al, 1990; Hetu, 1996)
Hetu, together with colleagues, has carried out many studies into the effects of
occupational hearing loss on workers and their families (Hetu et al, 1990) and, in
particular, has addressed the issues of denial and stigma associated with hearing loss
(Hetu, 1996).

In order to examine further the issue of denial of hearing problems, found in previous
studies to be a particular characteristic of men suffering from noise induced hearing
loss (NIHL), Hetu et al (1990) carried out interviews with workers who suffered from
NIHL, and their spouses. Previous evidence of the reluctance of men to acknowledge
hearing difficulties included denial, minimisation of the problem, uneasiness in
talking about the problem and attempts to appear ‘normal’ in order to protect their self
image. The authors suggested three possible reasons (with references cited) why men
may deny the existence of their hearing loss:

•    For centuries deafness has been associated with mental illness
•    Deafness is associated with ageing and the approach of the end of life
•    Admitting deafness implies perceiving oneself as belonging to an inferior social
     category.

A group interview was held with three workers who had already participated in a
rehabilitation programme, and their spouses. The workers reported being stigmatised,
particularly by co-workers (usually male), and by relatives and significant others.
They also experienced various psychosocial disadvantages that result directly from
the inability to listen and communicate, such as fear of reduced promotion and job
opportunities and difficulties in group conversations. Some regarded deafness as a
sign of ageing. Thus the self image of hearing impaired workers is very vulnerable,
justifying their unwillingness to acknowledge their hearing difficulties to others. Hetu
et al regard this reluctance as an adaptive means to try to prevent being rejected or
denied normality, and to maintain mental integrity and the capability of being a
spouse. Hetu et al (1990) list the effects of revealing hearing difficulties to others, as
expressed by the hearing impaired workers as follows:


39
40


1      Experience of responses of scepticism and denial or surprise
2      Experience of being stigmatised by co-workers, relatives, other participants to
       an organisation
       Consequences of the stigma:
              i. fear of revealing hearing difficulties to others
              ii. reluctance to use aids
              iii. avoidance of contact with co-workers, isolation
3      Fear of psychosocial disadvantages:
              i. fear of reduced promotion or job opportunities
              ii. fear of being ignored in a group conversation
4      Experience of adjustment on the part of others
       Making others aware of the hearing difficulties
              i. people are more careful about the difficulties of the hearing impaired
              person
              ii. people speak with a louder voice
              iii. people adjust but only for a short period of time after a demand is
              made by the hearing impaired person.

Interviews with another three hearing impaired workers who had not received any
rehabilitative help, and their spouses, were also analysed. There emerged some
discrepancies between the reports of difficulties by the workers and their wives.

One regarded himself as capable, ‘perfectly normal’, and able to overcome any
problems caused by hearing loss, but his wife cited certain difficulties (of which he
might not be aware) such as not hearing the phone ring, and not hearing his wife when
his back was turned. The second appeared threatened, as if he had been accused of
having a hearing problem, against which he strongly defended himself, blaming other
for his problems (for example, other people mumbling). The third did not consider his
hearing loss to be a particular problem, regarding it as a normal occupational hazard.
As with the first subject, he and his wife disagreed over his difficulties, he denying
problems that were disclosed by his wife.

In a review of evidence of the stigma attached to hearing impairment Hetu (1996), in
addition to giving examples from his own studies, cites other research which has
found evidence of embarrassment, lack of confidence, sense of inferiority, or shame.
A study of women had found that they disguised their hearing loss outside the home,
particularly at work and in leisure activities. They wished to hide any manifestation of
hearing impairment as it is perceived to be associated with a lack of intelligence,
mental health problems, weakness, disability, and old age. The women felt less
feminine, and became the objects of jokes or pity. This is in contrast to the work of
Hallberg and Jansson (1996) who found women more accepting than men of their
hearing impairment.

Hearing impairment is a threat to social identity and can lead to self-stigmatisation. A
hearing impaired person has to anticipate difficult communication situations, for
example social gatherings, group conversation, interactions with salespersons, in
banks, or with medical personnel. Hetu considers that this anticipation is itself fraught
with anxiety and frustration, and leads to avoidance of social interactions.


40
41


The lengthy period that often occurs between the onset of difficulties and seeking help
had previously been found to be between 5 and 15 years; this is a further indication of
the negative stigma attached to hearing loss. Hetu (1996) points out the need for
hearing impaired role models in the media. Finally, Hetu concludes that, as stigmas
combine, people who are already discredited because of some other characteristic will
experience the stigma of hearing loss more acutely. This may typically occur in the
case of elderly people (stigmatised because of both hearing impairment and age) and
of women (stigmatised because of hearing impairment and lower social status and self
image).


4.5    Functional disturbance in elderly people (Bess et al 1989, 1991)
Bess has carried out many studies into the effects of noise on both adults and children.
His work with adults, which is reviewed here, has concerned mainly elderly people.

In 1989 results of a study were published in which the relationship between the
amount of hearing loss and functional disturbance (both physical and psychosocial) in
elderly people was examined. Bess at al (1989) analysed the impact of hearing loss on
153 patients over the age of 65, using the Sickness Impact Profile (SIP, see Appendix
3) to measure functional and psychosocial impairment. The subjects were people who
had been referred to clinics for audiological assessment, but had not yet been
prescribed hearing aids.

In order to examine the relationship between degree of hearing loss and effect, the
hearing levels of the subjects, measured using pure tone audiometry, were grouped
into four categories as follows: no loss (0 – 16 dB HL); slight loss (17 – 25 dB HL);
mild loss (26 – 40 dB HL); moderate, severe and profound loss (greater than 40 dB
HL). The researchers found that with increase in hearing impairment there was a
trend for subjects to be older, less well educated, on slightly more medication and to
score slightly higher on a mental status questionnaire.

The three mean SIP scores – physical, psychosocial and overall – were calculated for
each of the four categories of hearing impaired subjects. Figures 4.1 to 4.3 show the
increases in the SIP scales with hearing loss category (data extrapolated from Bess et
al, 1989).

Figures 4.1 to 4.3 show that all three SIP scores increased across the four categories
of hearing loss, as follows: the physical scale from 3.3 for the group with no hearing
loss to 18.9 for those with hearing loss greater than 40 dB; the psychosocial scale
from 4.0 to 16.8; and the overall scale from 5.3 to 17.1.


41
42


                                 Physical SIP scale related to hearing loss


                                20
                                18
                                16
                                14


                    SIP score
                                12
                                10
                                 8
                                 6
                                 4
                                 2
                                 0
                                      0-16        17-25      26-40        >40
                                             Average better ear HL (dB)


 Figure 4.1 Relationship between physical SIP scale and hearing loss (extrapolated
                              from Bess at al, 1989)


                                 Psychosocial SIP scale related to hearing
                                                   loss


                                20
                                18
                                16
                                14
                   SIP score


                                12
                                10
                                 8
                                 6
                                 4
                                 2
                                 0
                                      0-16        17-25      26-40        >40
                                             Average better ear HL (dB)


     Figure 4.2 Relationship between psychosocial SIP scale and hearing loss
                       (extrapolated from Bess at al, 1989)


42
43


                                    Overall SIP scale related to hearing loss


                                   20
                                   18
                                   16
                                   14


                       SIP score
                                   12
                                   10
                                    8
                                   6
                                   4
                                   2
                                   0
                                          0-16       17-25       26-40          >40
                                                 Average better ear HL (dB)


Figure 4.3 Relationship between oveall SIP scale and hearing loss (extrapolated from
                                 Bess at al, 1989)

The authors carried out multiple regression analysis in order to determine which areas
on the SIP scale in particular were related to hearing, and how the extent of hearing
loss affected the SIP scales. The data was controlled for demographics and other
confounding variables (age, race, sex, education level, number of illnesses, presence
of diabetes and ischemic heart disease, number of medications, near visual acuity and
mental status). The authors investigated the changes in SIP scores associated with
changes in category of hearing loss (0-16 dB, 17-25 dB etc) and with a 10 dB increase
in hearing loss. These changes are shown in Table 4.2.

It can be seen from Table 4.2 that there are increases in all SIP scales associated with
increase in hearing loss category and with each 10 dB increase in hearing loss. The
relationships between hearing loss and change in SIP score were statistically
significant, except for the SIP scales related to alertness, sleep/rest, work and
communication. (The authors point out that communication was mainly in terms of
writing and speech production rather than speech perception, which explains the lack
of a statistically significant relationship with SIP.) Regression analysis showed that,
for each 10 dB increase in hearing loss, the physical SIP scale increased by 2.8, the
psychosocial scale by 2.0, and the overall scale by 1.3, as seen in Table 4.2. This
survey therefore suggests that progressive hearing impairment in elderly patients is
associated with progressive physical and psychosocial dysfunction, and that there is a
continuous association between degree of hearing loss and functional disability. The
closest associations are between hearing loss and the physical scales of the SIP; the
causal mechanisms are unknown but the results suggest that auditory clues are
important for successful physical interactions with the environment. The average SIP
scores overall, and for those with hearing losses of over 40 dB are shown in Table 4.3,
which includes average SIP scores reported for other conditions.


43
44


     Table 4.2 Changes in SIP scores related to changes in hearing (Bess et al, 1989)

                                                          Changes in SIP scales
                                                       Per change Per 10 dB
                         SIP scales
                                                       in category increase in
                                                       of hearing    hearing loss
                          Ambulation                        5.9           4.3
          Physical
                          Mobility                          4.0           3.3
          subscales
                          Body care/ movement               3.0           1.9
          Overall physical dimension                        3.9           2.8
                          Social interaction                2.9           2.7
          Psychosocial Communication                        1.4           1.0
          subscales       Alertness behaviour               2.4           1.1
                          Emotional behaviour               3.8           2.9
          Overall psychosocial dimension                    2.6           2.0
                          Sleep and rest                    2.6           3.1
                          Eating                            1.2           1.0
                          Work                               *             *
                          Home management                   6.4           4.9
                          Recreation/ pastimes              4.4           2.7
          Overall SIP scale                                 2.4           1.3
                * Not given

The authors conclude that efforts to improve the hearing of elderly patients could
result in a significant and meaningful improvement in the life quality of older people.

          Table 4.3 Average SIP scores for various conditions (Bess et al, 1989)

                         Condition                       SIP score
                         Unimpaired adults               2–3
                         Heart transplant recipients     9 – 10
                         (after 1 year)
                         Hearing impaired elderly        13.4
                         Elderly with >40 dB HL          17.1
                         Patients with advanced          24 – 25
                         chronic obstructive
                         pulmonary disease
                         Terminally ill cancer and       30 – 40
                         stroke patients


4.6    Review of effects of acquired deafness (Rutman, 1989)
A review of the psychosocial impact of acquired deafness was published by Rutman
(1989). (In Rutman’s paper, the term ‘deafness’ includes partial hearing, and in this
summary is used as in the original paper.) As with other authors, Rutman comments
on the (then) lack of research into the problems, experiences, functional limitations
and coping strategies which affect hearing impaired people.

Although the paper is mainly concerned with acquired deafness, Rutman includes a
comparison of the effects of congenital and later acquired deafness. The effects of
congenital deafness which are discussed by Rutman are listed in Table 4.4.


44
45


                         Table 4.4 Effects of congenital deafness

        Type of effect                  Specific effect
                                        Effects on language acquisition
                                        Effects on information processing
        Developmental effects
                                        Effects on reading and writing skills
                                        Assimilation into mainstream culture
                                        Limitations on career choices and aspirations
        Effects on life style           Effects on socio-economic status
                                        Effects on standard of living
                                        Over protection
        Effects on personality          Dependence on others
                                        Immaturity
        Effects on social interaction   Aggressiveness, impulsiveness, frustration

The main difference between congenital and acquired deafness, according to Rutman,
is that, although congenital deafness has many negative effects, in general people who
are congenitally deaf experience their deafness as a difference, rather than a loss as is
the case with people who become hearing impaired later in life. Congenitally deaf
people are also more likely to interact socially with other deaf people which leads to
feelings of competency and self worth, and freedom from stigmatisation.

In relation to acquired deafness, Rutman writes

‘Acquired deafness is a social and psychological loss which affects all communication
and interpersonal interactions and which deprives the individual of the type of social
relationships, occupational goals and overall quality of life to which they were
accustomed and which gave life meaning. Studies are inconclusive about whether
adjustment to hearing loss is easier or more difficult at various ages; each period of
life gives rise to different problems. There is consistent agreement, however, that
acquired deafness puts the individual at greater psychiatric risk and is likely to result
in more significant psychological and social problems than expected in cases of
congenital deafness.’

As stated above, the main difference between congenital and acquired deafness,
which explains many of the psychological effects associated with the latter, is that
acquired deafness constitutes a loss for sufferers, and is perceived by them as a loss
and deprivation. She quotes Jack Ashley, the former British Member of Parliament,
who was suddenly profoundly deafened, as writing that the congenitally deaf are…

‘…spared the desolating sense of loss. I had enjoyed natural acquisition of speech
and language and had a knowledge of the hearing world. These are priceless assets in
attempting to cope with total deafness. But I was painfully and permanently aware of
what I had lost. My perception of that loss is a lifelong burden.’

Rutman quotes several authors who have likened the loss of hearing to other traumatic
experiences in life, such as bereavement or terminal illness.

All human relationships are affected by hearing impairment as it causes problems in
communication, which may lead to a strong sense of isolation and withdrawal. These
in turn, together with the sense of loss, may lead to depression.


45
46


Rutman also addresses the question of denial, which she considers one of the most
common and potentially unhealthy responses to loss of hearing, particularly when the
hearing loss is progressive. She cites references which have shown that the denial
stage may last for decades in some cases, so that the hearing loss may be undetected
for years with resulting unusual behaviour attributed to other causes. Denial occurs
regardless of age. Adolescents deny their loss as it creates differences with their
peers; working adults because of its impact on employment and career aspirations;
and the elderly because of connotations with senility. Denial seriously impedes
adjustment to the hearing loss as it delays the acquisition of new communication skills
resulting in further social isolation. For successful adjustment to hearing loss it is
necessary to recognise and accept auditory problems.

Denial is often the initial response to hearing loss, and the first of several stages of
adjustment, leading ultimately to acceptance of the loss, according to some authors
cited by Rutman. The stages, together with the consequence of each, are listed in
Table 4.5.

     Table 4.5 Stages of adjustment to hearing loss, as described by Rutman (1989)

     Stage   Description   Symptoms of the stage
                           Refusal to learn communication skills
       1     Denial        Isolation
                           Immobilisation
                           At physician who made diagnosis
       2     Anger         At friends and family who may be impatient and unsupportive
                           At general public who may stigmatise and misunderstand
       3     Bargaining
                           Remorse
       4     Guilt
                           Embarrassment at causing others inconvenience
       5     Acceptance    Unlikely to be complete

Rutman cites a body of early work which showed that there was a link between
acquired deafness and psychotic illness, and later work which found flaws in this
original research. She therefore asserts that, while there is no conclusive evidence that
late-deafened adults are more likely to suffer from psychotic illness, acquired hearing
impairment can result in a devastating sense of loss giving rise to disrupted
interpersonal relationships, social isolation and depression.

In considering the impact of acquired deafness on elderly people in particular,
Rutman cites papers which suggest that hearing loss is the most problematic sensory
loss for older people which can be especially traumatic when it is mistaken for absent
mindedness or senility. For older people it can have a devastating effect on their role
within the family who may perceive them as less able to function independently, and
so their opportunities to exercise personal control diminish. Many older people
regard the problems of not hearing a speaker to be their own fault, leading to anger,
fear, embarrassment and withdrawal. In old age hearing loss can have a cumulative
effect with depression.

Rutman reports that older men have been found to be more vulnerable to the effects of
hearing loss than older women, forcing them to become more dependent on others,
possibly to retire, and to relinquish the traditional male role. Older women on the
other hand are better able to admit to and deal with their loss.


46
47


Denial of deafness is more common among elderly than younger people. There is
some evidence that hearing loss in old age is not related to loneliness, but to isolation.
Nevertheless, hearing loss in old age can have extremely serious psychological and
social implications.

Rutman considers the impact of acquired deafness at different stages of life. For
adolescents and young adults it may have considerable effects upon career choice and
goals, and on an individual’s identity development which may lead to lower self
esteem. Denial in order to maintain peer acceptance may further depress self esteem
and hinder the coping and adjustment process. In middle adulthood hearing
impairment may disrupt professional achievements and interpersonal relationships;
career goals may be ruined and marriages and friendships threatened. Denial is likely
in an attempt to preserve the individual’s established lifestyle. The main problems for
older people are the social isolation and withdrawal which result from communication
problems, and further deterioration in relationships which may follow from
misattributions of senility.


4.7     Hearing impairment and quality of life of elderly people
        (Mulrow et al, 1990a, 1990b)
The results of two studies on elderly people were published by Mulrow and
colleagues in 1990 (Mulrow et al 1990a, 1990b). The aims of both studies were to
identify the types and extent of dysfunction experienced by elderly individuals with
hearing loss. In both studies the quality of life of subjects was assessed using a
combination of the following five scales (briefly described in Appendix 3): Hearing
Handicap Inventory for the Elderly (HHIE), Quantified Denver Scale of
Communication Function (QDS), Short Portable Memory Status Questionnaire
(SPMSQ), Geriatric Depression Scale (GDS) and Self Evaluation of Life Function
(SELF).

The first study (Mulrow et al, 1990a) involved 204 subjects, of whom 106 were
hearing impaired (defined fairly crudely initially as having a better ear threshold of 40
dB or more at 2000 Hz). The subjects were almost all male, and were non hearing
aids users who had been referred to audiology clinics. Of the hearing impaired
subjects, 60% were subsequently found to have minimal hearing loss (< 40 dB HL);
32% to have moderate hearing loss (41-55 dB HL); and 8% moderately severe loss
(56-70 dB HL). None of the subjects had severe to profound loss (> 70 dB HL). All
subjects were over 64 years of age, the mean age being 71 years. The individuals with
hearing loss were in general found to be older, more often retired, less well educated
and more likely to suffer from depression than the other subjects, which is consistent
with the findings of Bess et al (1989; 1991) described above.

Table 4.6 shows the mean scores of hearing impaired and unimpaired subjects on the
various quality of life scales. A higher score indicates greater dysfunction.


47
48


     Table 4.6 Mean quality of life measures associated with hearing impairment
                               (Mulrow et al, 1990a)

                                                Hearing       Not hearing
              Quality of life measure
                                                impaired      impaired
              Overall hearing handicap (HHIE)   52.2          22.2
              HHIE social subscale              25.7          11.1
              HHIE emotional subscale           26.9          10.6
              Communication (QDS)               61.8          40.0
              Depression (GDS)                  3.3           2.9
              Life function (SELF)              94.5          92.9

After adjusting for confounding variables there were significant relationships between
hearing impairment and

•    functional handicap as measured by the HHIE scale
•    social and emotional handicap as measured by the HHIE scale
•    communication as measured by the QDS scale.

Relationships between hearing impairment and depression or dementia were not
significant, nor those between hearing impairment and life function scores. However,
the self esteem and social satisfaction subscales of the SELF scale were statistically
significantly related to hearing impairment.

The degree of hearing loss was statistically significantly correlated with the quality of
life areas measured by HHIE and QDS but not with those of the GDS and SELF
scales. In agreement with the work of Thomas and Herbst (1980) and Bess et al
(1989; 1991), greater hearing loss was associated with greater dysfunction.

Overall, the extent of social and emotional dysfunction was considerable: 66% of
hearing impaired subjects reported severe handicap; 16% mild to moderate handicap
and 18% minimal to no handicap. The authors found significant social, emotional and
communication difficulties associated with hearing loss, even those whose loss was
mild to moderate reporting social and emotional handicaps.

The authors believe that in this study the effects of hearing loss may be
underestimated owing to possible incorrect initial classification of individuals with
some hearing impairment. They also point out that 98% of their subjects were male
and that the results should not necessarily be generalised to women.

In a second study Mulrow et al (1990b) examined the effects of hearing loss on the
quality of life of 188 subjects who were candidates for hearing aids. The study used
the same five scales as before for assessing quality of life.

Hearing loss was mild (0 to 40 dB HL) in 70% of subjects; moderate (41 to 55 dB
HL) in 27% of subjects; and moderately severe (56 to 70 dB HL) in 3% of subjects.

In a baseline study, before hearing aids were provided, 63% of the subjects reported
severe social and emotional handicap due to hearing impairment; and 20% mild to
moderate handicap. Moderate communication difficulties were reported by 85% of
the sample, and depression was identified in 23% of subjects. Thus, as in the previous


48
49


study severe handicaps in social, emotional and communication were found even
among people with mild to moderate hearing loss. Hearing impairment was also
related to both cognition and depression. Changes following the provision of hearing
aids are discussed in Chapter 9.


4.8     Community surveys of hearing problems in England and Wales
        (Stephens et al, 1990, 1991; Herbst et al, 1991)
Stephens has carried out many studies with colleagues into the prevalence and effects
of hearing impairment, communication strategies, and use of hearing aids. In 1986 the
Cardiff Health Survey questioned 5145 residents, randomly sampled from the
electoral register, about general health issues. Hearing difficulty was reported by
14.7% of the 4266 respondents, the response to the hearing question being one of the
highest in the survey. (This is consistent with the estimate of 1 in 7 people in the UK
being hearing impaired, as discussed in Chapter 3.) Some of the respondents wore
hearing aids, but the number is not reported in the paper. People with hearing
difficulties described the main problems that they experienced, the reports
subsequently being analysed by Stephens et al (1990). The commonest complaints
were difficulty hearing radio and TV (22.4% of hearing disabled respondents) and
with general conversation (20%). The numbers of people with each of these
complaints increased markedly with age. However, the oldest age group (> 75 years)
was the least likely to complain of difficulty with hearing speech in noise. When the
data was analysed by social class it was found that younger individuals in social class
I (professional classes) were disproportionately represented among the complainants
of difficulty hearing in noise; this may be because this problem interferes with their
professional needs and also their readiness to articulate the problem. Older individuals
and those in poor general health were less likely to be involved in social activities so
less likely to report this as a major difficulty. General conversational difficulties were
reported by those who had been ill within the previous 2 weeks; the authors postulate
that this could be because such problems had been exacerbated recently through the
need to communicate with unfamiliar health care professionals and other strangers
(the findings of the RNID survey on doctors described in Section 4.12 suggests that
this could well be the case).

A subsequent paper by Herbst et al (1991) compared the experiences of hearing
impaired elderly people in London with a similar group in rural Wales. A sample of
253 people aged 70 and over in London, and 99 similar subjects in rural Wales were
screened for hearing loss, dementia, and depression and interviewed about general
health, use of health and welfare services, loneliness and social contacts, and the
experience of hearing impairment.

The incidence of hearing impairment was higher in Wales but that sample had mostly
worked in heavy and noisy industry such as mines and the steel works. In both areas
hearing impairment was significantly associated with a desire to reduce outdoor
activity (after controlling for sex, age, and poor health of subjects). In both areas 25%
of the hearing impaired subjects said they had not noticed any problems with their
hearing. They also showed little desire to identify or socialise with others with the
same handicap. Of those who admitted to a hearing loss (100 subjects in London and
52 in Wales), 29% in London and 33% in Wales had hearing aids.


49
50


Those for whom the onset of hearing impairment occurred before retirement were
significantly more likely than others to describe their hearing as bothersome. This was
to be expected since its advent was untimely, and because of the associated stigma
they had done nothing about it.


4.9     Sensory impairment and quality of life in an elderly population
        (Carabellese et al, 1993)
An interesting study into the effects of both visual and hearing impairment on the
quality of life of elderly people living at home in a town in Italy was carried out by
Carabellese et al (1993). The hearing and visual acuity of 1192 subjects aged
between 70 and 75 were tested. It was found that 131 subjects had uncorrected visual
impairment and 126 uncorrected hearing impairment, with 20 subjects being
uncorrected for both visual and hearing impairment. Subjects for whom hearing or
visual impairments were successfully corrected were grouped with ‘adequate’
subjects. Thus the term ‘hearing impaired’ in the following refers to people who were
hard of hearing and did not wear hearing aids.

The subjects were divided into four groups, according to visual and hearing function:
adequate auditory and visual functions (n = 948); uncorrected hearing impairment but
adequate visual function (n = 106); uncorrected visual impairment but adequate
hearing function (n = 118); and uncorrected visual and hearing deficits (n = 20).

A limitation of this study is that the hearing impairment was not measured using
audiometry, or even self assessment of hearing handicap; a relatively crude hearing
test of subjects (based on ability to hear three random numbers) was carried out.

The quality of life of subjects was evaluated using four scales: Beck’s Depression
Inventory scale (BDI), Mental Status Questionnaire (MSQ), Instrumental Activities of
Daily Living (IADL) scale and the SELF social relationships scale (see Appendix 3
for definitions of the scales). An assessment of health was made through considering
the number of days in bed and use of health services by subjects.

The frequency distribution of the psychosocial and physical health variables for the
four groups of subjects is shown in Table 4.7.

The presence of a single sensory impairment (hearing or visual) was associated with
significantly higher prevalence of subjects with low mood level or depression (but
female gender and few social relationships were more strongly related to mood than
sensory impairment); with loss of self-sufficiency in daily living activities; and with
poor social relationships. Visual impairment doubled the risk of a low social
relationships score, however, mood level and male gender were more important
factors. Among subjects with adequate visual function, hearing impairment increased
the risk of poor functioning in daily living activities by a factor of 2.1. The mood
level was found to be significantly higher in those with both adequate sensory
functions than those with a deficit in either. Similar results were found for the IADL
and SELF scores.


50
51


           Table 4.7 Frequency distribution of psychosocial and health variables
                                ( Carabellese et al, 1993)

                                Vision          Vision         Vision          Vision
                                adequate        adequate       impaired        impaired
                                Hearing         Hearing        Hearing         Hearing
                                adequate        impaired       adequate        impaired
                                n = 948         n = 106        n = 118         n = 20
                                No      %       No      %      No      %       No     %
                 Normal         677     71.4    60      56.7   57      48.3    9      45.0
Mood             Low            224     23.7    37      34.9   49      41.5    6      30.0
                 Very low       47      4.9     9       8.4    12      10.2    5      25.0
Self-            Dependent      87      9.2     22      20.8   21      17.1    6      30.0
sufficiency      Independent    861     90.8    84      79.2   97      82.9    14     70.0
                 Impaired       28      3.0     5       4.7    6       5.1     3      15.0
Cognition
                 Unimpaired     920     97.0    101     95.3   112     94.9    17     85.0
                 Low            237     25.0    36      34.0   57      48.4    10     50.0
Social
                 Middle         464     48.9    54      50.9   44      37.2    7      35.0
relationships
                 High           247     26.1    16      15.1   17      14.4    3      15.0
                 Good           648     68.3    69      65.1   83      70.3    11     55.0
Physical
                 Borderline     263     27.7    32      30.2   25      21.2    8      40.0
health
                 Poor           37      4.0     5       4.7    10      8.5     1      5.0

Thus the results of this study suggest a significant worsening in most quality of life
measures (affective, functional and social), which is independently associated with
functional deficit in either vision or hearing. The presence of impairment in either
vision or hearing approximately doubled the risk of being impaired in each quality of
life measure. Visual impairment had the stronger effect on depression and social
relationships whereas hearing impairment had the stronger effect on self sufficiency
in daily living. The data presented by the authors, see Table 4.7, can be reanalysed as
shown in Table 4.8, to divide subjects into those who are hearing impaired and those
who are not.

Table 4.8 Differences between hearing impaired and non-impaired samples in survey
                            of Carabellese et al (1993)

                                            Hearing adequate   Hearing impaired
                                                n = 1066            n = 126
                                            No        %        No       %
                              Normal        734       68.9     69       54.8
              Mood            Low           273       25.6     43       34.1
                              Very low      59        5.5      14       11.1
              Self-           Dependent     108       10.1     28       22.2
              sufficiency     Independent   958       89.9     98       77.8
                              Impaired      34        3.2      8        6.3
              Cognition
                              Unimpaired    1032      96.8     118      93.7
                              Low           294       27.6     46       36.5
              Social
                              Middle        508       47.7     61       48.4
              relationships
                              High          264       24.8     19       15.1
                              Good          731       68.6     80       63.5
              Physical
                              Borderline    288       27.0     40       31.7
              health
                              Poor          47        4.4      6        4.8


51
52


Table 4.8 highlights differences between the hearing and hearing impaired subjects. It
can be seen that, among the hearing impaired subjects the percentages with ‘very low’
mood (that is with depression), who are dependent and whose cognition is impaired
are approximately double those of the hearing subjects. It is possible that the figures
shown here underestimate the effects of hearing impairment as the category ‘hearing
adequate’ includes people who are hearing impaired but wear hearing aids. It could be
argued that this is likely to reduce the scores of the ‘adequate’ category while
increasing the scores of the ‘impaired’ group, thereby reducing the differences
between the two groups. It should also be remembered that this research was
primarily aimed at investigating the differences between visual and hearing
impairment in terms of psychosocial effects, and not at determining the effects of
hearing impairment per se.


4.10    Men and women with noise induced hearing loss
        (Hallberg, 1996, 1999; Hallberg and Janssen, 1996)
Hallberg has published several papers describing how people adjust to and cope with
noise induced hearing loss (NIHL). Most studies into the effects of noise induced
hearing loss have focused on men, but Hallberg has looked specifically at the
differences between men and women in perceived disability and coping with NIHL.

As with other hearing disabilities, NIHL causes problems of interaction (an ‘invisible
barrier’) between a person and their environment, largely due to difficulties in
communicating with other people. Hallberg (1996) considers that people suffering
from NIHL may be confused about their hearing status as the capacity to converse
may vary depending upon the background noise. She cites research which shows that
a person with moderate NIHL hears 90% of what is said in a quiet environment but
only 40% in a noisy environment; for severe hearing loss the proportions are 65% and
10%; whereas a person with normal hearing hears 98% of speech in a quiet
environment and 75% in a noisy environment.

Hearing impaired people believe that people with normal hearing do not understand
their problems which leads to frustration and aggression. Hallberg describes various
methods of adjustment to hearing loss, and strategies for coping with day to day
situations. One method of adjustment is to exclude potentially demanding situations
such as parties, group meetings, or restaurant visits, and to choose to socialise only
with small groups of close friends. Avoiding certain social situations can lead to
loneliness, isolation, a lower self image and decreased quality of life. Avoiding
strategies such as this are more often employed by men than by women. It has been
found that men who have tinnitus in addition to NIHL are more likely to adopt
avoiding strategies. Many people adopt strategies to enable them to cope with
situations they find difficult. The main motivation for coping strategies is to maintain
a positive self image and to appear to be ‘normal’ in dealing with others. Controlling
strategies where hearing impaired people attempt to take control of a situation are
often adopted by people at work. Typical examples of controlling strategies include
asking for repetition, or informing others in advance about a hearing disability.

In her paper Hallberg (1996) reviews literature which shows that NIHL can cause
marital and family difficulties, and discusses interviews which she carried out with
hearing impaired men and their wives. Hearing impairment can affect the relationship


52
53


between couples. Communication between a couple may be minimised or hardly
exist at all in some cases. A spouse is often described as the ‘least understanding
person’, and there may be contradictions between a hearing impaired person and their
spouse (Hetu et al, 1990; Hallberg, 1996). A spouse often becomes irritated and
frustrated by requests to repeat what is said. Men with hearing loss are often
unwilling to go out to the theatre, cinema or a party; the spouse may either stay at
home too or go out on their own thereby engendering further negative effects on the
relationship. A spouse described living with a man with NIHL as a ‘demanding and
exhausting task’. Participating in social gatherings can put additional stress upon a
partner; in many cases the wife takes responsibility for the husband’s inability to hear,
and responds or advises the husband on how to behave and cope. Overall, it is
difficult for a couple to preserve the social image of a ‘normal’ couple.

Hallberg cites references which show that interpersonal relations within a family may
also be affected, for example through less intimate talking and joking. A hearing
impaired parent may become less involved in family matters as children will turn
towards the normally hearing parent (usually the mother in cases of NIHL). Hearing
impairment can be a source of annoyance, with hearing impaired individuals showing
more aggression and irritation at home than at work.

The interviews with wives highlighted ‘the husband’s reluctance or unwillingness to
acknowledge hearing difficulties’ and ‘the impact of hearing loss on the couple’s
intimate relationship’. Most of the wives interviewed by Hallberg described frequent
misunderstandings and irritation within a family, which might have a further negative
impact on a couple’s intimate relationship. According to one woman ‘a hearing
disability has many consequences on the close relationship...even in the bedroom’.

In a study to examine the experiences of women with NIHL, Hallberg and Jansson
(1996) interviewed ten women with NIHL of whom nine wore a hearing aid. The
average better ear hearing loss was 60 dB HL. The women showed ambivalent
attitudes to their hearing loss although most accepted and acknowledged their hearing
difficulties. They strove to maintain social relationships and to take part in social
activities, although they often avoided or withdrew from situations such as group
discussions or meetings, and attempted to avoid bothering others. In social situations
various coping strategies were used. Controlling strategies included asking people to
speak up, informing people about their hearing loss, asking for repetition or
dominating in conversations. Avoiding strategies such as minimising hearing
difficulties, pretending to hear, or guessing what has been said were also used.

The women felt stigmatised by their hearing loss and quoted negative attitudes of
other people, including being viewed as mentally retarded or prematurely aged, or
being defined as an abnormal person. Family and friends were cited as the people
most openly showing and expressing irritability. The unwillingness of other people to
adjust to their problems caused emotional distress and irritation. Unknown people
tended to view them as stupid, and lacked knowledge of hearing impairment in
general.

A more detailed investigation into the differences between men and women with
noise induced hearing loss involved a comparison of 60 male (mean age 55) and 33
female (mean age 71) NIHL sufferers (Hallberg, 1999). Both groups had a mean high


53
54


frequency hearing loss of 61 dB in the better ear, while the low frequency loss for
females (37 dB) was greater than that of the males (22 dB). All subjects rated their
hearing loss as ‘moderate’ to ‘severe’ on a four-point scale ranging from ‘mild’ to
‘very severe’. The Communication Strategies Scale (CSS) and Hearing Disability and
Handicaps Scale (HDHS) were used to measure coping and perceived disability and
handicap respectively (see Appendix 3 for definitions of the scales).

It was found that in communication women used maladaptive behaviour (for example,
pretending to ignore people so that they repeated what was said) and verbal strategies
(for example, asking people to repeat) significantly more often than men. There was
no significant difference in the use of non-verbal strategies (for example, sitting
where it will be easier to hear) which were the strategies most often used by the group
as a whole. There were also no significant differences between men and women in
perceived disability and perceived handicap, as measured by the HDHS scale. The
reluctance of men to acknowledge hearing handicap might indicate a need to avoid
stigmatisation and preserve a positive self image.


4.11 Effects of hearing impairment on young people (Gregory, 1998)
In a chapter in Marschark and Clark (1998), Gregory writes of the consequences of
deafness of young people in late adolescence and early adulthood, focusing mainly
upon their social and family relationships. No definition of ‘deafness’ is given and
the paper appears to relate to young people with partial hearing loss as well as total
deafness. In the study by Gregory et al (1995) upon which much of the chapter is
based, it was considered irrelevant and inappropriate to define hearing loss clinically
and to identify individuals in terms of their hearing loss, but it is clear that the term
‘deafness’ is used to refer to both profound and partial hearing loss (see below).

Gregory writes that, whereas language and communication are taken for granted in
most young people, the young deaf person has a different experience. Language is
important for establishing, maintaining and sustaining social relationships, and has a
more general significance in the development of a young person as much of the
understanding of rules of social interaction comes though incidental, overheard or
overseen communication. Gregory also states that, while much has been written
about the social development of young deaf children and their mothers, less attention
has been paid to the social life of the deaf adolescent and young person. There is also
a lack of knowledge about the impact of deafness on the mother-child relationship for
older children. Family relationships can be affected by difficulties in communication
within a family, which may have consequences for identity and social relationships.

Gregory cites the earlier (1995) study carried out by herself and colleagues in which
they interviewed 82 hearing families and 61 of their deaf sons and daughters in their
late teens and early twenties (Gregory et al, 1995). This was part of a longitudinal
study following the progress of deaf children and their families since early childhood
(Gregory, 1976). In this study, individual hearing losses are not given for the reasons
described above. However, both parents and the young people themselves were asked
to describe their hearing loss. Responses are shown in Table 4.9. Interestingly, as
noted by Gregory, apart from profound deafness there was little agreement between
the responses of parents and young people. However, it can be seen that a sizeable
proportion of the sample of young people were partially hearing.


54
55


 Table 4.9 Degrees of hearing loss reported by parents and young people (Gregory,
                                       1998)

                   Degree of hearing loss    Percentages reported
                                            Parents Young people
                   Profound                   63           53
                   Severe                     11           7
                   Moderate                    0           2
                   Partially hearing          11           12
                   Don’t know                 15           25
                   Not answered                0           3

Most of the young people interviewed (95%) possessed hearing aids although only
67% of the sample wore them regularly. Issues concerning the use of hearing aids are
examined in Chapter 7.

The research team found that 25% of deaf young people communicated best with their
mother, 20% with a sibling but only 5% with their father, communication with a
father being found difficult in many instances. Seven per cent said that there was no
one in the family with whom they could communicate.

Research cited by Gregory has also shown that deaf young people are more dependent
on their families, both financially and in terms of leaving home, than their hearing
counterparts. Parents may be asked to help in dealing with colleagues and in
obtaining employment, and may need to explain financial and other matters. In
Gregory’s 1995 study, of forty 20-21 year olds 70% were still living in the family
home and half of them needed help with managing their finances. Although most
could cope with travelling on their own fewer than half (16) were able to go to the
doctor alone. They also found that parents felt they took a greater role in organising
their children’s social arrangements than they would for hearing children, a situation
that was not always satisfactory for either party, and sometimes a cause of concern for
parents.

Gregory considers that the study of sibling relationships is a neglected area. Family
relationships may be affected by differences in the treatment of hearing and deaf
siblings, for example there may be resentment when a parent spends more time with a
deaf sibling. There can be a negative impact on sibling relations when hearing
siblings, who are unable to communicate with a deaf sibling, look outside the family
for relationships. However, in their study Gregory and colleagues found that
relationships with siblings were described in positive terms, with 42% of the deaf
young people saying they got on very well with their siblings, 32% quite well, 20%
with some and not others, and only 4% (2 subjects) saying they did not get on well at
all (Gregory et al, 1995).

Communication within a family may be difficult. In Gregory’s study young people
reported feeling either left out of family gatherings or embarrassed by attempts to
include them. There is a danger that young deaf people miss out on access to
information which is part of general family conversation. Often parents assume that
the deaf child is aware of information when they are not. Of the young people
questioned, 80% said that a lack of communication had occurred to them, including


55
56


the communication of major events such as deaths in the family, pregnancy and
marital breakdown.

Some young people enjoy a rich and varied social life, a number travelling long
distances to meet deaf friends. However, some are extremely lonely at times, feel
isolated and have difficulty making and sustaining friendships. In Gregory’s survey
young people described themselves as seeing friends often or sometimes, but parents
described the majority of young people as having difficulty making friends. Many of
the young people interviewed experienced periods of loneliness or feelings of not
belonging.

Gregory discusses other studies which have examined the impact of educational
setting on social life. Many have found that deaf students experience social
difficulties in mainstream educational settings, including loneliness, isolation and
social rejection. Gregory notes the importance of being able to communicate in a
group when deaf people are educated with hearing peers. In Gregory’s own study
(Gregory et al, 1995), of the 34 deaf young people who had hearing friends 19 said
they had great difficulty communicating in a group setting, 5 had some difficulty and
only 10 said they could converse easily. Apart from the obvious difficulty in
following conversation in a group, a secondary effect is that information that is
conveyed informally in such situations may be missed.

Gregory also found that some young people were isolated at work or college, around
one third being considered by their parents to have no friends there. Parents
suggested this could be due to difficulties in carrying on conversations at the same
time as doing their work. They also perceived their children to be reluctant to join
groups of hearing people because of the possibility of their being excluded. When
young people went out with hearing friends, they needed to be doing something
positive, and tended to be invited to relatively structured occasions such as weddings
or sports matches, possibly because more informal gatherings are difficult as they
involve more verbal negotiation.

Work is cited which suggests that deaf young people regard establishing boy/girl
relationships to be difficult. Of the 48 young people over 21 in the study by Gregory
et al (1995), 18 (38%) were reported by their parents never to have had a boy or girl
friend.


4.12 Experiences of deaf people (RNID, 1999)
In 1999 the RNID (Royal National Institute for Deaf and Hard of Hearing People)
published the results of a survey of its members, the aim of which was to quantify
deaf and hard of hearing people’s experiences of social exclusion, isolation and
prejudice. The report also investigated access to and the quality of services provided
by local doctors and health centres. The RNID is unaware of exactly how many of its
members are totally deaf and how many are hard of hearing. In a survey of its
members in 2001, of the approximately 1000 who responded, 54% were hard of
hearing, 22% deaf, 9% deafened and 9% hearing. The hearing profiles of respondents
to this survey are also unknown but, if these figures are typical of RNID membership
and if respondents to this survey are a representative group of RNID members, then it


56
57


may be assumed that approximately half of the survey respondents were hard of
hearing.

The survey of RNID members was conducted by post and the survey of doctors
through face to face interviews with GPs. In total, the responses of 1666 deaf and
hard of hearing people (54% female, 44% male, 17% working full time, 8% working
part time) and 422 GPs were analysed. The main findings of the survey are presented
below.

4.12.1 Deafness, isolation and exclusion
Large numbers of respondents reported problems of social isolation or
communication, as follows:

•    More than seven out of ten (71%) felt isolated because of their hearing loss.
•    More than one third (39%) avoided meeting new people.
•    Almost half (46%) had given up trying to explain how to make communication
     easier.
•    The vast majority (86%) had difficulty coping in public places such as shops and
     restaurants (typical problems included ordering an incorrect item or meal).
•    The vast majority (91%) thought hearing people failed to appreciate their
     difficulty, and that therefore other people did not make adequate compensation for
     their hearing loss.
•    Almost half (46%) had given up trying to explain to people how to make it easier
     for them to communicate.
•    Over half (59%) believed that hearing people think they are stupid.
•    Over half (55%) believed people think they are stupid if they ask them to repeat a
     question.
•    Almost 9 out of 10 had to ask people to repeat what they had said.
•    More than one in five admitted that they were embarrassed about wearing a
     hearing aid.
•    More than one in five avoided informing people of their hearing loss.

4.12.2 Prejudice and abuse
A shocking finding is the extent of prejudice, intolerance and abuse experienced by
deaf and hard of hearing people. The survey found that having a hearing loss at least
doubles the likelihood of experiencing abusive language in most situations.

The most common problems experienced were other people being impatient and not
taking time to communicate with a deaf person; patronising a deaf person and treating
them as stupid; and using abusive language because of frustration or malice.

The statistics relating to prejudice and abuse experienced by the respondents are as
follows:

•    The vast majority (83%) had experienced impatience, with almost one quarter of
     under 25s experiencing impatience on a weekly basis.
•    Almost two thirds (63%) had been patronised by a stranger because of their
     hearing loss.
•    Nearly half (47%) had been made fun of because of their deafness.


57
58


•    Nearly half (47%) claimed to have been ignored because of their deafness.
•    One in five had been the victim of abusive language and gestures.
•    One in 20 had experienced physical violence.

4.12.3 Visits to doctors
The survey of RNID members found that visiting the doctor is a particular problem
for many deaf and hard of hearing people. The difficulties experienced may have
serious consequences, for example illness may be undiagnosed or untreated.

Particular problems experienced by respondents are listed below:

•    Almost a quarter (23%) had left a doctor’s surgery unsure of what was wrong with
     them.
•    Almost a third (32%) were dependent on friends and family interpreting for them
     at a medical appointment.
•    One in six (16%) avoided going to the doctor’s because of communication
     problems.
•    One in six (16%) found communicating at GP surgeries a barrier to getting an
     appointment.
•    Almost two thirds (63%) thought GP surgeries could be improved.
•    More than two thirds (68%) thought hospitals could be improved.

In contrast to the reports by the RNID members, the survey of GPs found that 87% of
them felt that they could communicate effectively with their deaf and hard of hearing
patients. However, more than half (52%) of the GPs were unaware of what facilities
they had to support deaf and hard of hearing people; only 12% of them used any form
of communication support (including interpreters); only 12% provided deaf awareness
training for staff; only 5% had an induction loop installed at reception; and only 4%
had a text phone.


4.13 Psychological aspects of acquired hearing loss (McKenna, 2001)
McKenna writes about the emotional consequences of hearing loss, including the
relationships between hearing loss and emotional disorder and cognitive functioning,
in the sixth edition of Ballantyne’s Deafness, edited by Graham and Martin (2001).
He points out that, despite the widespread nature of hearing loss, the popular image of
people with hearing impairment is not flattering as it is associated with old age and
with frailty of body and mind, and has connotations of stupidity.

In the past psychiatrists involved in the care of deafened people often described
patients as neurotic or paranoid, leading to reports of negative emotional
consequences of hearing impairment. The prevalence of psychological disorder
among hearing impaired people has been examined in various studies, some of which
have shown a high prevalence of emotional disorder. However, the methods used to
reach these conclusions have often been flawed in terms of psychiatric classification.
Studies using questionnaire techniques to quantify particular types of psychosocial
disturbance have reported elevated levels of psychopathology and maladjustment,
including depression, neurotic symptoms, anxiety and social isolation. A study by
McKenna himself and colleagues in 1991 found that 27% of people attending a neuro-
otology clinic with hearing loss suffered from significant psychological disturbance.


58
59


This is considerably higher than the prevalence of psychological disturbance among
the general population (5%) but lower than prevalence rates associated with
conditions such as tinnitus and vertigo.

The relationship between hearing loss and mental health has also been studied by
examining the extent of hearing loss among patients with psychiatric disorders.
Results suggest that hearing loss increases the chance that a patient will have a
diagnosis of schizophrenia, and that it is one of a number of factors that distinguishes
patients with paranoid psychosis from those with affective psychoses. However,
these studies did not properly account for confounding factors such as health, age and
noise exposure. Other studies have produced conflicting results, and when other
health problems are taken into account correlations between hearing loss and anxiety
and depression become weaker. There is likely to be more significant psychological
distress when multiple symptoms, for example hearing loss and tinnitus, are present.

Several studies have found a strong association between hearing loss and confusion or
dementia. However, in some cases the association has been lost when age is taken
into account. Complaints of difficulty in concentration are found among hearing
impaired people, including younger people. It has been assumed that difficulties in
concentration are due to fatigue, resulting from the effort of listening and lip reading,
or from emotional distress. However, recently subtle difficulties in information
processing, which can not be explained in terms of fatigue or emotion, have been
noted, including evidence that the degree of difficulty was related to the duration of
hearing loss. These studies suggest that some people with hearing loss may be less
able to process certain types of verbal information.

The complexity of the relationship between hearing loss and psychological
disturbance, in particular between the degree of hearing loss and extent of disturbance
is not well understood. McKenna cites the work of Kerr and Cowie (1997) who
described the multidimensional nature of hearing loss in terms of 6 factors:

     •   communication problems
     •   social restrictions such as employment difficulties and strained family
         relationships
     •   poor interactions on the part of others, for example use of gestures rather than
         speech or ignoring, which undermine confidence
     •   distress associated with interactions such as anticipating and trying to avoid
         communication breakdown
     •   sense of loss and bereavement, and feeling that hearing people do not
         understand
     •   positive experiences such as social support and inner resources.

McKenna concludes by listing areas, in addition to depression and isolation, in which
hearing loss may interact with a person’s psychological state, all these factors also
being influenced by age, social circumstances and education:

     •   the individual’s own image of a deafened person
     •   the fact that deafness has the power to make people less socially capable
     •   the fact that deafness may make the processing of verbal information harder
         and so slow up the normal flow of interaction


59
60


     •   people’s differing tolerance of, and compensation for, their disability
     •   the fact that a person’s handicap from deafness can be related to his or her
         own attitude to the disability.


4.14 Conclusions
This chapter has described in some detail a selection of studies of psychosocial effects
of hearing loss that have been carried out in the past 30 years. It can be seen that most
of the studies provide conclusive evidence of the negative effects of hearing loss, with
many of them identifying similar effects. The results of the studies discussed in this
chapter which have produced quantitative data are summarised in Appendix 4.

In the next chapter each of the psychosocial effects found in the various studies is
discussed separately, drawing together the evidence from the studies examined in this
chapter, plus some other studies. In Chapter 11 studies concerning the effects of
hearing loss on employment are considered.


60
61


CHAPTER 5              PSYCHOSOCIAL                 EFFECTS          OF      HEARING
                       LOSS

5.1      Introduction
It is evident from the papers described in Chapter 4 that hearing impairment can have
significant psychosocial effects, with a detrimental impact upon an individual’s
quality of life. This chapter describes the psychosocial effects of hearing loss that
have been identified by various research studies, some of which were reviewed in the
previous chapter; inevitably, in this chapter there is some repetition of results already
presented. As pointed out in Chapter 4 most of the studies have been carried out in
the past 30 years; very little research on the psychosocial effects of hearing loss
appears to have been carried out before the 1970s.

In this chapter, in addition to general effects of hearing loss on quality of life, specific
effects such as loneliness, memory loss and so on are discussed. The main categories
of the effects identified from the papers reviewed in Chapter 4 are listed in Table 5.1.
This chapter discusses each of the categories, other than employment which is
addressed in Chapter 11, individually and cites the evidence of (or against) a
relationship between hearing loss and the particular effect. The references that are
cited in each category are tabulated in Table 5.2.

                 Table 5.1 Categories of effects of hearing impairment


                                    Overall quality of life
                         Loneliness/social isolation/exclusion
                        Psychiatric disturbance and depression
                                    Family relationships
                               Stigma and low self esteem
                                         Education
                                           Denial
                         Difficulties in particular environments
                           General health/visiting the doctor
                              Cognitive skills and dementia
                                        Memory loss
                                   Intimate relationships
                                    Prejudice and abuse
                                        Employment


In reviewing the literature on adults it has become obvious that, while there has been a
great deal of research, particularly in the past 25 years, in this area, most of this
research has focused on the effects of acquired hearing loss on elderly people. There
is a gap in the literature concerning the experiences of young and middle aged hearing
impaired adults and the effects of hearing loss on their lives. There is also a great deal
more research concerning the impact of hearing loss on men than on women; this is
largely due to a number of studies of the effects of noise induced hearing loss, which


61
62


mainly affects men, and because in many cases a large proportion of a sample of
elderly hearing impaired individuals are men who have been deafened at work.

             Table 5.2 References for each psychosocial effect of hearing loss

Effect                    References which discuss effect
Overall quality of life   Bess et al (1989); Carabellese et al (1993); Cheng and Niparko (1999);
                          Erlandsson and Holgers (2001); Espmark et al (2002)*; Grimby and
                          Ringdahl (2000); Hallberg (1996); Mulrow et al (1990a, 1990b); Oyer and
                          Oyer (1979); Rutman (1989); Sorri et al (2001); Thomas and Herbst (1980);
                          O’Neill (1999); Vesterager and Salomon (1991)*
Loneliness/social         Arlinger (2003); Barnett (2002); Carabellese et al (1993)
isolation                 Committee on Disabilities of the Group for the Advancement of Psychiatry
                          (1997); David and Trehub (1989); Davies et al (2001); Lalande et al (1998);
                          Erlandsson and Holgers (2001); Espmark et al (2002)*; Gregory (1998);
                          Grimby and Ringdahl (2000); Hallberg (1996); Hallberg (1999); Hallberg
                          and Jansson (1996); Hauland and Gronninguter (2003); Herbst et al (1991);
                          Joore et al (2003)*; Knutson and Lansing (1990); Oyer and Oyer (1979);
                          RNID (1999); Rutman (1989); Thomas and Herbst (1980); Vesterager and
                          Salomon (1991) *; Weinstein and Ventry (1982); Chen (1994)
Psychiatric               Barnett (2002); Bess et al (1991); Carabellese et al (1993); Committee on
disturbance and           Disabilities of the Group for the Advancement of Psychiatry (1997); David
depression                and Trehub (1989); Dye and Peak (1983); Grimby and Ringdahl (2000)*;
                          Herbst et al (1991); Knutson (1990); McKenna (2001); Mulrow et al (1990a,
                          1990b); Oyer and Oyer (1979); Rutman (1989); Thomas and Herbst (1980);
                          O’Neill (1999); Chen (1994)
Family relationships      Barnett (2002); David and Trehub (1989); Gregory (1998); Hallberg (1996);
                          Hauland and Gronninguter (2003); Knutson and Lansing (1990); Rutman
                          (1989); Thomas and Herbst (1980); Vesterager and Salomon (1991)*
Stigma and low self       David and Trehub (1989); McKenna (2001); Mulrow et al (1990a); Noble
esteem                    (1996); Oyer and Oyer (1979); Hallberg (1999); Hallberg and Jansson
                          (1996); Herbst et al (1991); Hetu et al (1990); Hetu (1996), Lalande et al
                          (1998); Chen (1994)
Education                 Bess et al (1989); Danermark et al, 2001); Hauland and Gronninguter
                          (2003); Gregory (1998); Mulrow et al (1990a); Rutman (1989)
Denial                    David and Trehub (1989); Hetu et al (1990); Hetu (1996); Herbst et al
                          (1991); Rutman (1989); Thomas and Herbst (1980)
Employment                David and Trehub (1989); Herbst et al (1991); Joore et al (2003); RNID
                          (2000); RNID (2002); Thomas and Herbst (1980)*; Chen (1994); O’Neill
                          (1999)
Difficulties in           Breadin (2000); Davies et al (2001)
particular
environments
General health/           Breadin (2000); Gregory (1998); RNID (1999); O’Neill (1999);
visiting the doctor
Cognitive skills and      Bess et al (1989); Bess et al (1991); Committee on Disabilities of the Group
dementia                  for the Advancement of Psychiatry (1997); Hallberg (1999); Hetu (1996);
                          Noble (1996); McKenna (2001); Mulrow et al (1990b)
Memory loss               Dye and Peak (1983); Rabbit (1991)
Intimate relationships    Gregory (1998); Hallberg (1996); Rutman (1989); Thomas and Herbst
                          (1980); Hetu et al (1993)
Prejudice and abuse       Hetu et al (1990); Hetu (1996); RNID (1999)

* These references show no or little relationship between hearing loss and the effect


62
63


Hearing impairment causes difficulty in hearing and interpreting sound, to a greater or
lesser extent depending upon the severity of the loss, the efficacy of any hearing aids,
and the environment in which aural functioning is taking place. Most of the
psychosocial effects of hearing loss discussed here are direct consequences of the
problems experienced in interacting with other people and the individual’s
environment. Arlinger (2003), in a review of the negative consequences of
uncorrected hearing loss, noted that the commonest complaints among hearing
impaired people concern problems in recognising speech, especially in difficult
environments. Other complaints include the reduced ability to detect, identify and
localise sounds, including warning signals, music, and birds, quickly and reliably. In
addition to affecting hearing impaired people the disability also affects other people in
their environment, such as family and work colleagues. However, hearing impaired
people themselves are not always aware of the consequences of the impairment as
they do not always know what they are missing in terms of sound. Consistent with
the findings of much of the research reviewed in Chapter 4, Arlinger (2003) also
points out that uncorrected hearing loss can give rise to isolation, reduced social
activity, the feeling of being excluded and increased symptoms of depression, and that
there is some evidence of correlation between hearing loss and loss of cognitive
functions. All these aspects of hearing impairment, which are discussed in the
following sections of this chapter, contribute to a poorer quality of life.


5.2     Overall quality of life
Many papers describe hearing loss as causing a significant impact upon overall
quality of life. They then go on to examine the occurrence of particular effects of
hearing loss such as loneliness or depression, which have an impact upon the general
quality of life of an individual.

There are few studies in which a direct comparison has been made between the
overall quality of life of a hearing impaired person and that of a hearing person. The
only paper identified so far in which an overall quality of life score is given is that of
Cheng and Niparko (1999), who used the quality of life factor ‘health-utility’ to
evaluate the impact of cochlear implants in adults. The health-utility factor is a
quantitative value expressed on a linear scale from 0.00 (death) to 1.00 (perfect
health). By pooling nine studies involving a total of 619 subjects aged 18 and over,
Cheng and Niparko calculated the health-utility of profoundly deaf adults without
cochlear implants to be 0.54. (This paper is discussed in more detail in Chapter 10)
The report into the joint Nordic-British project on hearing impairment among adults
(Sorri et al, 2001) compares this figure of 0.54 with a mean quality of life value of
0.85 for a representative group of the British population under the age of 60, for
whom the mean did not fall below 0.8 until the age of 70.

Chapter 4 reviewed other work that considered several factors which contribute to
general quality of life. For example, Oyer and Oyer (1979) defined 13 consequences
of hearing loss (listed in Chapter 4) and showed that hearing impairment can have
severe psychosocial consequences, particularly among older people.

The first major study into the psychosocial effects of hearing impairment was carried
out by Thomas and Herbst (1980). They examined relationships between hearing loss
and psychiatric disturbance, general health and well being, social and family life, and


63
64


employment among people of working age, and found that hearing loss impacted
upon all these areas.

Rutman (1989) also considered the overall impact of hearing loss on quality of life,
writing that ‘Acquired deafness is a social and psychological loss which affects all
communication and interpersonal interactions and which deprives the individual of
the type of social relationships, occupational goals and overall quality of life to which
they were accustomed and which gave life meaning’ (Rutman, 1989).

Other studies in the 1980s focused mainly on the impact of hearing loss on the lives of
elderly people. Bess at al (1989) found that progressive hearing loss in elderly
patients is associated with progressive physical and psychosocial dysfunction, the
greater the hearing loss the greater the functional disability. The authors concluded
that efforts to improve the hearing of elderly patients could result in a significant and
meaningful improvement to their quality of life. Similar conclusions to those of Bess
et al were reached by Mulrow et al (1990a, 1990b) who investigated many quality of
life measures among elderly people using different scales to those used by Bess et al
(1989). They found that hearing loss was associated with important adverse effects
on the quality of life and, consistent with the work of Bess et al, that greater hearing
loss was associated with greater dysfunction. Severe handicaps in social, emotional
and communication aspects of life were found even among people with mild to
moderate hearing loss. In another study of elderly people in Italy, Carabellese et al
(1993), using different scales again, found that both visual impairment and hearing
impairment independently have a detrimental effect upon most quality of life
measures. They concluded that the presence of either disability approximately
doubled the risk of being impaired on each of the quality of life measures used.

Studies into the impact of hearing loss on the quality of life of other age groups have
found similar detrimental effects. For example, Hallberg (1996) found that a
consequence of noise induced hearing loss is to avoid potentially demanding auditory
situations such as parties, group meetings, or restaurant visits, with a resultant cost in
terms of loneliness, isolation and decreased quality of life. Lalande et al (1988) found
that noise induced hearing loss affected the quality of life of workers both at home
and at work. Erlandsson and Holgers (2001) examined the impact of tinnitus on
health-related quality of life of adults of all ages (> 25 years) in Sweden, using the
Nottingham Health Profile. Although for all subjects tinnitus was more of a problem
than hearing loss, it emerged that the more severe the hearing loss the more negative
the impact on day to day living (work, social relationships, family life, sexual life,
leisure time etc.).

An analysis by O’Neill of data from the 1992 US Health and Retirement Study (HRS)
of people aged 51 to 62 also showed that adults in this age group with hearing loss
were less satisfied with life in general than those without (O’Neill, 1999). Table 5.3
compares the percentages of those dissatisfied with various aspects of their lives.


64
65


     Table 5.3 Percentages of adults aged 51 to 61 with and without hearing loss
      dissatisfied with various aspects of life (figures taken from O’Neill (1999))

                                             With HL       Without HL
                Life as a whole                 9              4
                Health/physical condition      28              12
                Financial situation            37              22
                Friendships                     6               3
                Family life                     7               3
                Handling of problems            9              4

It can be seen that in all the aspects considered, the percentages of hearing impaired
people who are dissatisfied is approximately twice that of the hearing population.

Thus there is a large body of published work which shows that hearing loss has a
negative effect upon overall or individual quality of life measures, whatever scales are
used to assess the impact of hearing loss. However, it must be pointed out that some
studies disagree with these findings. Salomon and colleagues (Salomon et al, 1988;
Vesterager et al, 1988; Vesterager and Salomon, 1991), in studies of elderly people in
Denmark, have found no correlation between hearing disability and general
satisfaction with life. For example, Vesterager and Salomon (1991) found seventy
four percent of their subjects were satisfied with life, had positive perceptions of the
ageing process, and preserved their mental ability in old age independently of their
ability to communicate. These authors conclude that hearing disability is not an
obstacle to active life in old age.

Another study which found little impact of hearing impairment on quality of life is
that of Grimby and Ringdahl (2000). These authors used the Nottingham Health
Profile and other scales to examine the quality of life of 35 Swedish adults (aged
between 22 and 64), all with severe to profound hearing impairment, who were
employed full time. A particular aim of this study was to see whether having a job
mitigated any of the effects of hearing loss. They found that subjects working full
time were considerably more satisfied with life than other hearing impaired people
working part time or retired, and that, apart from lack of energy and social isolation,
there was little difference between the hearing impaired subjects who were working
and hearing people. The authors do however point out that this study involved a small
sample size and that subjects tended to have the mental and physical prerequisites for
good adaptation at work. They may therefore not be representative of hearing
impaired people in general. Furthermore all but one subject wore a hearing aid, which
would probably have alleviated much of the impact of hearing loss. (The wearing and
benefits of hearing aids are discussed in Chapters 6 to 9.)

Finally, another study, also in Sweden, of hearing disability and handicap among 154
elderly people aged from 70 to 91 (Espmark et al, 2002) found that, apart from
problems of communicating in background noise, the subjects experienced only minor
problems in most everyday activities. Only 21 of the subjects were fitted with hearing
aids. The conclusion of this study was that the quality of life of the subjects was in
general only mildly affected by hearing loss.

It is noted that both the study by Vesterager and Salomon (1991) and the study by
Espmark et al (2002) involved subjects from urban areas in Scandinavia; in the latter


65
66


study the subjects were city centre residents and the authors report that they were all
relatively well off. In the work of Vesterager and Salomon the subjects were town
dwellers with stable housing arrangements, the majority of whom were satisfied with
their living conditions. This suggests that the subjects in these two studies enjoyed a
high quality of life, and may not be representative of hearing impaired elderly people
in Europe in general.

Thus, although some studies have found little effect of hearing loss on overall quality
of life, the major part of the research that has been carried out in the past 25 years
shows that hearing impairment has a significant detrimental effect upon the quality of
life of adults of all ages. The remaining sections of this chapter consider other aspects
of the psychological and social effects of hearing impairment individually, although
many of the effects are of course interrelated.


5.3     Loneliness and social isolation
As can be seen in Chapter 4, much of the research into the psychosocial impact of
hearing loss has found social isolation and loneliness to be major effects of hearing
impairment. Uncorrected hearing loss, which causes difficulties in communication,
can give rise to isolation, reduced social activity and the feeling of being excluded, all
of which may lead to depression (Arlinger, 2003). This is especially true of
postlingually deaf patients who lost their hearing in adolescence or adulthood
(Rutman, 1989). Social isolation is a problem that affects all age groups although
some reports suggest that the elderly have the greatest risk of social isolation (Oyer
and Oyer, 1979; Committee on Disabilities of the Group for the Advancement of
Psychiatry, 1997). Furthermore, much of the research shows that loneliness and
social isolation can occur regardless of the severity of the hearing loss (Thomas and
Herbst,1980). Possible reasons are fear of being stigmatised, or of being
misunderstood (Oyer and Oyer, 1979), or a general wish to avoid demanding auditory
situations (Hallberg, 1996).

In this section the occurrence of loneliness and social isolation among different
groups of people/age groups is considered.

5.3.1 Adults of all ages
It has been found that isolation and loneliness as a result of hearing loss occur in
adults of all ages. In a study of deafened adults of all ages in Canada, David and
Trehub (1989) found subjects experienced anxiety about social contact and so
withdrew from social situations. The average age of subjects in this study was 44.9
years, and the average age of onset of hearing loss was 24.9 years. Knutson and
Lansing (1990) studied problems of adults aged from 22 to 71, all of whom suffered
from profound hearing loss (≥ 95 dB). They found their sample to be more socially
introverted and more suspicious than the general population, with most suffering from
loneliness, ranging from being somewhat lonely to being extremely lonely.
Loneliness is also found among adults with less severe hearing impairment. For
example, Hallberg (1996) reports loneliness and isolation to be a consequence of
noise induced hearing loss in workers.

Important evidence on the prevalence of social isolation among hearing impaired
people comes from the RNID survey of over 1600 deaf and hard of hearing people


66
67


(RNID, 1999) which found that 71% of those surveyed felt isolated because of their
hearing loss, while 39% avoided meeting new people.

Similarly, O'Neill (1999) in analysing the 1992 US HRS data on 51 to 61 year olds
found that people with hearing loss were less likely to participate in social activities
than people without. For example, in this age group around 10% of people with
hearing loss reported that they had done 100 or more hours of voluntary work
compared with 18% of those without hearing loss. In another American study (Chen,
1994) hearing loss was found to be a cause of distress and to lead to psychological
withdrawal in social situations, resulting in feelings of isolation, lack of self
confidence and depression.

However, in contrast to the results of previous studies, a survey by Joore et al (2003),
of 80 hearing impaired people aged 18 years and older, found moderate hearing loss
caused little impediment in social relationships. Patients being fitted with a hearing
aid for the first time scored quite highly on a social functioning scale before being
fitted with hearing aids, although there was a slight improvement in self perceived
social functioning after hearing aid fitting.

5.3.2 People of working age
As described in Chapter 4, loneliness was found to be the overriding effect of hearing
impairment in the early study of Thomas and Herbst (1980). Among a group of
hearing impaired subjects of working age, 24% describing themselves as lonely
compared with 14% of the (unimpaired) control group; furthermore, extreme
loneliness was experienced by many of the hearing impaired group. Of the
‘extremely lonely’ subjects, 60% were screened as psychiatrically disturbed,
indicating the stress that may be caused by loneliness. Significantly, they found that
loneliness was not related to degree of hearing loss, suggesting that people who suffer
from moderate deafness are likely to feel as lonely as severely deaf people.

Difficulty in making and keeping friends is also a common effect of hearing
impairment. Thomas and Herbst (1980) found that 40% of their hearing impaired
sample suffered from social isolation, with few or no friends, compared with 25% of
the hearing control group. The same percentage also found it difficult to make friends,
compared with 15% of the control group.

Two middle aged working people are included among the case studies of David and
Trehub (1989), in their paper on the adjustment to hearing loss by deafened adults in
Canada. A 54 year old man whose loss started at the age of 25 and was profoundly
deaf by the age of 43 described how he changed from an extrovert to an introvert,
avoiding big social events and preferring reading and carpentry (although he appears
to have adapted well to his loss and continues to see his hearing friends and to make
new friends). On the other hand, a 49 year old woman who had sudden onset of
deafness at the age of 44 said that ‘the worst part is isolation and the loss of friends’.
Lalande et al (1988), in a study of 65 workers, two-thirds of whom suffered some
degree of hearing loss, found isolation and low self esteem to be associated with noise
induced hearing loss.

The survey of the effects of hearing loss among working people by Grimby and
Ringdahl (2000) (see Section 5.2) found that social isolation was one of only two


67
68


areas in which the responses of hearing impaired subjects differed from those of
hearing adults. Thus, even among groups for whom general quality of life appears to
be relatively unimpaired by hearing loss, social isolation is still a factor.

5.3.3 Elderly people
Studies of the effects of hearing impairment amongst elderly people have shown
similar results to those above. Weinstein and Ventry carried out an early study to
examine the relationship between hearing impairment and social isolation among
elderly people (Weinstein and Ventry, 1982). They studied 80 male subjects, aged 65
to 88, with a mean age of 74. Subjects assessed their hearing handicap using the HMS
scale, and hearing ability was also assessed using word lists and audiometric testing.
Information on social, emotional and physical problems experienced was obtained
using the CARE scale. (See Appendix 3 for details of the scales used.) The subjects
were divided into four groups according to hearing ability: 13% of the sample had
normal hearing (0-25 dB HL); 30% mild hearing loss (26-40 dB HL); 41% moderate
hearing loss (41-55 dB HL); and 16% moderately severe hearing loss (56-70 dB HL).
The average age of onset of hearing loss was 68 years. The researchers found, in
contrast to the study by Thomas and Herbst of younger people (see above), that
hearing ability was related to isolation. The greater the (self assessed) hearing
handicap, the greater the sense of isolation, loneliness and inferiority. Weinstein and
Ventry found that (self assessed) hearing handicap was more closely related to
reduction in the quality of social contact (reflected by fewer social networks,
loneliness, reduced interest in leisure activities etc) than to the amount of social
contact (number of face to face contacts with friends and relatives and other contacts,
involvement in leisure activities etc).

Similar results were found in a comparison by Herbst et al of two populations of
hearing impaired elderly people living in London and Wales (Herbst et al, 1991). The
hearing losses of 253 subjects aged 70 and over in London, and 99 similar subjects in
a rural area of Wales were measured. Three other aspects of their lives were studied:
general health, use of primary and secondary health services, and contacts with
friends and relations. In both areas the authors found that hearing impairment was
significantly associated with a desire to reduce outdoor activity (after controlling for
sex, age, poor health), and concluded that hearing impairment in old age reduces
outdoor activity and predisposes to isolation, withdrawal and depression.

A similar pattern of behaviour emerges in a qualitative study of the difficulties
experienced by elderly hearing impaired people (Davies et al, 2001). Diaries of
activities kept by sixty subjects showed that subjects tended to shop in the mornings
when shops were less crowded, and not to go out the evening except for special
occasions such as weddings. Overall there was very little evidence of them taking part
in group social situations.

An individual case study described by Barnett (2002) is also consistent with this
behaviour pattern. He describes the case of an elderly patient who was unaware of his
hearing problem, as was his family, the problem manifesting itself as a reluctance to
go out and to engage in social activities.

A few studies however have found no relation between hearing impairment and
loneliness or isolation in the elderly. Vesterager and Salomon (1991) investigated the


68
69


psychological and sociological effects of hearing impairment in elderly people, in a
study of 71 subjects aged 70 to 75. They found no correlation between hearing
disability and general satisfaction with life, and concluded that hearing disability was
not an obstacle to active life in old age. In particular they found no evidence of
loneliness or isolation among their subjects. They did however find one effect which
could possibly lead to isolation: the more pronounced the hearing handicap the less
the individual showed initiative to make new social contacts. Possible reasons for the
differences between the results of this study and those of other studies have been
discussed in Section 5.2.

5.3.4 Young people
As stated before, there has been little research into the general impact of hearing
impairment on the lives of young people. However, the research that has been carried
out finds that they too experience the same effects of loneliness and social isolation
due to hearing impairment as older adults. This may be very significant for young
people embarking upon adulthood, at an age where social networks and an active
social life are very important to self esteem. David and Trehub (1989), in their paper
on the adjustment to hearing loss by deafened adults (with ≥ 80 dB HL in better ear)
in Canada, include two cases of the experiences of young people. A 21 year old
woman who lost her hearing at the age of 16 following surgery ‘stayed at home and
did nothing for 3 years’ and ‘felt isolated’. A man, aged 29 years for whom the onset
of deafness occurred at the age of 15, and who was profoundly deaf by the age of 20,
described how he became, a ‘loner’ as he was afraid to go to school for fear of being
laughed at by the other children and misunderstanding the teacher. However, this
latter subject subsequently accepted and adapted to his hearing disability.

Research on the effects of hearing impairment on the lives of young adults was
carried out by Gregory and colleagues (reported in Gregory, 1998). It appeared that
while some deaf young people enjoyed a rich and varied social life, some were very
lonely at times, felt isolated and had difficulty making and sustaining friendships. It
was parents, rather than young people themselves, who described the majority of
young people as having difficulty making friends. One third of young people were
considered by their parents to have no friends at work or at college. The parents also
perceived their children to be reluctant to join groups of hearing people because of the
possibility of their being excluded.

Gregory (1998) cites other studies which have shown that deaf students may
experience social difficulties such as loneliness, isolation and social rejection in
mainstream educational settings. This may have an impact upon their education, as
discussed in Section 5.7.

5.3.5 Women
Although most studies of the effects of hearing impairment have involved mainly or
only male subjects, a few have considered the response of women to hearing loss.
Hallberg and Jansson (1996) found that, unlike men, women suffering from noise
induced hearing loss strove to maintain social relationships and to take part in social
activities. Hallberg, in a subsequent study (Hallberg, 1999), found that women were
more likely than men to use various strategies (such as asking people to repeat) to
ease communication. However, in a Swedish study of the impact of tinnitus on
health-related quality of life, Erlandsson and Holgers (2001) found that, in the 35-44


69
70


year age group, women with tinnitus experienced more social isolation than women or
men of the same age in a normal hearing control group.

In general, studies suggest that women adapt to their hearing loss more readily than
men. However, this is not always the case. For example, of the four case studies
quoted by David and Trehub (1989) the two female subjects, aged 21 and 49, appear
to have adapted less well to their hearing loss than the two male subjects. Thus there
appears to be conflicting evidence about the attitudes of women to hearing
impairment, among the small number of studies available.

5.3.6 Conclusions on loneliness and social isolation
Loneliness and social isolation are the consequences of hearing impairment cited most
frequently in the literature. The reviewed papers have shown that these effects occur
among subjects of all ages, regardless of the extent of hearing loss. Obviously, to
experience social isolation or loneliness can have a devastating impact upon one’s
happiness and quality of life, and lead to other effects such as depression or loss of
self esteem, as discussed below.


5.4      Psychiatric disturbance and depression
Much has been written about the links between hearing impairment and psychiatric
disorders or depression, research into this area predating that into other psychosocial
effects of hearing loss. It has been recognised for many years that hearing impairment
may be associated with depression, which may be a consequence of social isolation
and withdrawal (Rutman, 1989). Many of the studies reviewed here cite references to
earlier work which has investigated links between hearing loss and depression,
including suspiciousness or paranoia (Oyer and Oyer, 1979; Dye and Peak, 1983;
Rutman, 1989; Mulrow et al, 1990a; Bess et al, 1991; Herbst et al, 1991; Carabellese
et al, 1993). In most cases a link has been established although research described in
some of the cited papers has found no statistically significant evidence that hearing
loss is related to depression or psychiatric problems.

Most of the literature reviewed in this section has established a relationship between
hearing loss and depression, through comparison of hearing impaired subjects with a
control group of hearing people, or with the general population, or provides anecdotal
evidence of such a relationship. Other studies have found incidence of depression
among hearing impaired subjects but when the data is controlled for confounding
factors such as age or visual acuity, no significant relationship is established.

In the study by Thomas and Herbst (1980) 19% of 205 hearing impaired subjects were
screened as psychiatrically disturbed, based upon measures of anxiety and depression,
compared with 5% of the general population. The authors believe that the figure of
19% may be an underestimate as the survey only identified those with recent
symptoms, and some respondents with problems had already been excluded from the
sample. They found no evidence of a simple linear relationship between pure tone
hearing loss or speech discrimination ability and psychiatric disturbance, but when the
two were combined there was a dramatic increase in the proportion of psychiatric
disturbance. Of those with hearing loss of over 70 dB plus a speech discrimination
score of 70% or less when wearing hearing aids, 57% were screened as psychiatrically
disturbed. When compared with the figure of 5% for the general population, it


70
71


appears that severe hearing loss may be a major contributor to psychiatric problems.
The authors concluded that a severe hearing loss constitutes as much of a psychiatric
problem as does a severely restricting physical disability. Psychiatric disturbance was
not related to the duration of deafness, and the presence of tinnitus did not appear to
increase its likelihood. However, being screened as psychiatrically disturbed was
found to relate significantly to unhappiness at work, changing jobs due to deafness,
being lonely, having no friends, deafness adversely affecting marriage, feeling near to
a nervous breakdown and overall dissatisfaction with life.

Similarly, McKenna and colleagues, in a study published in 1991 and cited in
McKenna (2001), found that 27% of people with hearing loss who attended a neuro-
otology clinic suffered from significant psychological disturbance.

In contrast to the work of Thomas and Herbst (1980), the more recent study of a
similar age group by Grimby and Ringdahl (2000) found persistent worry and
depression to be rare among a group of employed hearing impaired subjects. This may
be because, as the authors point out, the subjects were an elite group of severely to
profoundly hearing impaired people who had mental and physical prerequisites for
good adaptation at work, so they may be unlikely to suffer from depression, and may
not be typical of the hearing impaired population of that age. In addition, as
explained in Section 5.2, almost all of these subjects wore hearing aids, the benefits of
which may help to prevent feelings of depression.

Studies which have found higher incidence of depression among hearing impaired
subjects, or some evidence that depression may be related to severity of hearing loss
include those of Dye and Peak (1983), Knutson and Lansing (1990), Mulrow et al
(1990a, 1990b) and Carabellese et al (1993). Dye and Peak (1983) found that, of 58
male subjects, aged 45 to 83, those with more severe hearing loss (greater than 35 dB
HL) were more paranoid and depressed than those with less severe loss (35 dB HL or
less). In a study of 27 individuals with profound hearing loss (≥ 95 dB HL), aged
from 22 to 71 (Knutson and Lansing, 1990) the sample were found to be more
depressed, more socially introverted and more suspicious than the general population.
However, the authors qualify their results by stressing that all their subjects were
awaiting cochlear implants and so were unhappy with their status as deaf persons and
highly motivated to change their situation.

Mulrow et al (1990a) found evidence of depression in 24% of 194 elderly hearing
impaired subjects who were due to receive hearing aids. In a second study Mulrow et
al (1990b) identified depression in 27% of 106 subjects with hearing loss, compared
to 16% of the other subjects. However, the relationship between hearing loss and
depression was not significant when data was corrected for factors such as age and
visual acuity.

In the study of nearly 2000 elderly subjects in Italy, Carabellese et al (1993) found
that depression was associated with deficits in both vision and hearing. In their
investigation, 43% of the subjects with adequate vision and impaired hearing had a
low or very low mood score compared with 29% of those with neither visual nor
hearing impairment, 52% with adequate hearing and visual impairment and 55% of
those with both sensory impairments.


71
72


Weaker evidence, but some suggestion, of depression among hearing impaired
subjects was found in the study by Herbst et al (1991) of two groups of hearing
impaired elderly people in London and rural Wales. There was a greater tendency to
depression in Wales, although as the authors point out this may have been due to
socio-economic problems in that community. However, in both areas hearing loss was
found (after controlling for sex, age, and poor health) to be significantly associated
with a desire to reduce outdoor activity, which the authors suggest predisposes to
isolation, withdrawal and depression.

O’Neill (1999) found similar results in analysing the 1993-1994 Asset and Health
Dynamics among the Oldest Old (AHEAD) study of people aged 70 and over. The
occurrence of depression was almost twice as high for the hearing impaired as for the
non-hearing impaired group, with 26% of the hearing impaired group having
experienced four or more symptoms of depression during the week prior to the
survey, compared with 15% of the hearing group. Again it is likely that the loss of
independence and reliance on others, plus less social activity, are contributory factors
to the feelings of depression in this age group.

There are many other references in the literature to depression associated with hearing
loss. David and Trehub (1989), in their qualitative study of profoundly postlingually
deaf adults in Canada, found evidence of depression among the 25 subjects
interviewed.

It is commonly reported that those who become deafened postlingually are more
prone to depression than people who lose their hearing earlier in life (Rutman, 1989;
David and Trehub, 1989; Committee on Disabilities of the Group for the
Advancement of Psychiatry, 1997; Barnett, 2002). The case studies and interviews
described by David and Trehub (1989) and by Barnett (2002) are consistent with this.
Barnett (2002) also points out that there is under diagnosis of acquired hearing loss
and depression, particularly in older adults.

A reason given by Rutman (1989) for the greater psychiatric risk in the case of
acquired deafness is that it represents a loss and deprivation for sufferers. She quotes
the British former Member of Parliament Jack Ashley who was suddenly profoundly
deafened: ‘I was painfully and permanently aware of what I had lost. My perception
of that loss is a lifelong burden.’ Rutman cites many other authors who have written
about the loss, grief and deep depression which may arise as a result of acquired
deafness.

Finally, McKenna (2001), in discussing the psychological effects of hearing
impairment, states that early reports of negative emotional consequences of hearing
impairment came from observations of psychiatrists involved in the care of deafened
people, who were often described as neurotic or paranoid. Since then some studies of
hearing impaired people attending clinics have shown a high prevalence of emotional
disorder, with elevated levels of psychopathology and maladjustment, including
depression, neurotic symptoms, anxiety and social isolation being reported. The link
between hearing loss and mental health has also been studied by approaching the
problem in reverse and examining the extent of hearing loss among patients with
psychiatric disorders. The results suggest that hearing loss increases the chance that a
patient will have a diagnosis of schizophrenia, and that hearing loss is one of a


72
73


number of factors that distinguishes patients with paranoid psychosis from those with
affective psychoses. However, McKenna points out that these studies did not control
for confounding factors such as general health, age and noise exposure.

McKenna reports that overall there is conflicting evidence on the association of
hearing loss and emotional disturbance. Nevertheless, the presence of multiple
symptoms, for example hearing loss with tinnitus, leads to a greater likelihood that a
person will suffer significant psychological distress.

He concludes that, in addition to depression and isolation, the following factors may
also interact with a person’s psychological state, depending upon age, social
circumstances and education:

     •   the individual’s own image of a deafened person
     •   the fact that deafness has the power to make people less socially capable
     •   the fact that deafness may make the processing of verbal information harder
         and so slow up the normal flow of social interaction
     •   people’s differing tolerance of, and compensation for, their disability
     •   the fact that their present handicap from deafness can be related to their own
         attitude to the disability.

Thus, overall, work published in the past 30 years has shown substantial evidence that
depression and possibly other psychiatric disorders are more prevalent among hearing
impaired people than among the general, hearing, population. These results suggest
that hearing loss can be a cause of depression among sufferers.


5.5     Family relationships
The impact of hearing loss on family relationships has been discussed in several
papers, including those detailed in Chapter 4. As mentioned by Barnett (2002)
relationship difficulties can arise as a result of not talking or not allowing others to
talk, which are two strategies sometimes employed by hearing impaired people to
disguise their hearing loss.

Thomas and Herbst (1980) in their detailed study of psychosocial effects of hearing
impairment on people of working age divided loneliness due to deafness into two
categories: social isolation (concerning relationships outside the home) and emotional
isolation (concerning family relationships). They found that 45% of their hearing
impaired subjects suffered from emotional isolation, defined as having no or only one
person to turn to for support in daily life, compared with 26% of the control group. In
addition, they found that 27% of those with hearing loss felt that they got left out of
discussions and decision-making at home, compared with 12% of the controls.

There is also anecdotal evidence of typical problems that may occur in the family.
One of the case studies included in the paper by David and Trehub (1989) mentions
the impact of his profound deafness on his relationship with his sons; he feels he does
not know them as well as he would like and notices that at meals, they chat with their
mother while he remains silent. This exemplifies the view of Hallberg (1996) that the
hearing impaired parent becomes less involved in family matters as children turn


73
74


towards the normally hearing parent. Hallberg also states that noise induced hearing
loss can lead to frequent misunderstandings and irritation within a family.

Rutman (1989) reports that hearing impairment can have a devastating effect on
family relations – the hearing impaired person worries that their family may regard
them as less able to function independently so opportunities to exercise personal
control diminish. Knutson and Lansing (1990), in their study of people with profound
acquired deafness, found that difficulties in family communication were associated
with perceptions of isolation and loneliness. This is consistent with the work of
Gregory (1998) who, in her research into deaf children and young people and their
families, has found that difficulties in communication in a family can have
consequences for identity and social relationships.

The work of Gregory and others (Gregory, 1998; Hauland and Gronninguter, 2003)
provides evidence of the attitudes and treatment of young hearing impaired people in
a family, and the impact of a deaf child on family relationships.

Gregory and colleagues (Gregory, 1998) interviewed 82 hearing families who had
deaf children, and 61 of the hearing impaired children. The study found that 25% of
deaf young people communicated most readily with their mother, 20% with a sibling
but only 5% communicated most easily with their father. Seven per cent said that
there was no one in the family with whom they could communicate. (Gregory does
not report what the corresponding figures would be for children with normal hearing.)

Also considered was the question of relationships between hearing impaired children
and their siblings. Overall the relationships were felt to be positive, with often a
special understanding developing between the siblings. However, Gregory (1998)
quotes other research which found that there can be a negative impact on sibling
relationships when hearing siblings turn outside the family for relationships as they
are unable to communicate with a deaf sibling. Differences in the treatment of hearing
and deaf siblings, and the need to spend more time with the latter can cause additional
problems.

Deaf young people in their late teens and early 20s are more dependent than their
hearing peers on their families, both financially and in terms of leaving home. For
example, parents may be asked to help in communications with colleagues or in
obtaining employment, and may need to explain financial matters because the hearing
world is not adapted to the needs of deaf people. The study found that, of forty
hearing impaired 20-21 year olds, 70% lived in the family home and half needed help
with managing their finances. Although most could cope with travelling on their own,
only sixteen were able to go to the doctor alone. Parents of hearing impaired children
also had a greater role in organising their children’s social arrangements than they felt
they would have done for hearing children, a situation that may be less than
satisfactory for both parties (Gregory, 1998).

In the study young people reported feeling either left out of family gatherings or
embarrassed by attempts to include them. Gregory (1998) reports that they therefore
miss out on access to information which is part of general family conversation, and
which parents assume the deaf person to be aware of. Of the young people questioned


74
75


80% said such a lack of communication had occurred to them, in some cases relating
to major events such as deaths in the family, pregnancy and marital breakdown.

Similar problems were reported by young people in a recent paper by Hauland and
Gronninguter (2003) who examined the lives of 77 deaf and hard of hearing students
aged 16 to 20 in Norway. Helene (16) said in an interview ‘I am quite left out,
compared to my sisters. I am in one sense one of them but there have always been
problems with me who am hard of hearing. I do not understand what they are talking
about when we are eating dinner. I am quarrelling a lot with my little sister since
there are so many misunderstandings. I have always felt left out at home.’ Problems
with siblings and feeling left out were also reported by Frode (20): ‘I am not very
close to my siblings. They were all talking at once even though I asked them again
and again what they were talking about. I often ran away and walked out for hours
or I sat in my room and listened to music. I do not like to be hard of hearing, it is
better to be hearing. I do not understand what people are talking about.’

These reports are not consistent with the reports by Gregory (1998) of generally good
sibling relationships.

The studies of the impact of hearing loss on elderly people have not usually
considered family relationships. However, Rutman (1989) in her review of the impact
of acquired deafness points out that hearing impaired older adults may become
concerned that their family thinks they are less able to function independently and
responsibly, and that, due to communication problems, older people themselves may
feel less able to maintain a responsible family role. In contrast, Vesterager and
Salomon (1991) detected no impact of hearing loss on friendships or on family life in
their study of elderly hearing impaired people.

Thus the general consensus of the reviewed research is that hearing impairment can
have significant negative effects upon family relationships, affecting general
communication within a family; affecting the relationship between a hearing impaired
parent and their children; causing hearing impaired children to feel ‘left out’; and
generally making the hearing impaired individual feel less able to function as a family
member.


5.6      Stigma and low self esteem
Several authors have written of the stigma attached to hearing loss and the low self
esteem often experienced by hearing impaired individuals. Noble (1996) writes that
the stigma attached to hearing is not only to do with lack of hearing but with what it
signifies more broadly. The popular image of people who are hearing impaired is not
flattering – hearing loss is associated with old age and, as a consequence, with frailty
of body and mind (McKenna, 2001). Deafness has long had a connotation with
stupidity; this may be compounded by someone who cannot hear not responding
immediately, and this being interpreted as being due to rudeness, slowness or
stupidity.

The stigma attached to hearing impairment and the attitudes of others, together with
one’s own perceptions, can lead to low self esteem among hearing impaired persons.
Oyer and Oyer (1979) suggested that low feelings of self worth are a particular


75
76


problem among elderly people. This was confirmed by the work of Mulrow et al
(1990a) who, in their study of the quality of life of older people, found that the self
esteem subscale of the SELF scale (see Appendix 3) was statistically significantly
related to hearing impairment.

Other studies suggest that it may be people of working age who are particularly
susceptible to low self esteem. David and Trehub (1989) found fragile self esteem to
be a common symptom among the deafened adults in their survey. It was cited as a
problem by some of the case studies in their paper. For example, a 49 year old woman
who had to leave her job after sudden onset of deafness at the age of 44 suffered from
loss of self esteem due to her inability to obtain another good job. In the study by
Herbst et al (1991) of over 350 hearing impaired subjects in Wales and London, many
of those whose impairment had commenced before retirement had reportedly done
nothing about it because of the associated stigma. In studies of patients suffering
from noise induced hearing loss Hallberg (1999) suggests that the reluctance to
acknowledge hearing handicap among men might indicate a need to avoid
stigmatisation and preserve a positive self image. Similarly low self esteem was
reported as an effect of noise induced hearing loss in the earlier study by Lalande et al
(1988).

Hetu et al (1990), in their qualitative study of men suffering from noise induced
hearing loss, found strong symptoms of denial and attempts to minimise the problem
and to appear ‘normal’. He gives the following examples of the stigma attached to
hearing loss which explain why people wish to deny their hearing impairment:

•    For centuries deafness has been associated with mental illness
•    Deafness is associated with ageing and the approach of the end of life
•    Admitting deafness implies perceiving oneself as belonging to an inferior social
     category.

The workers interviewed by Hetu et al reported being stigmatised, particularly by co-
workers (usually male), and by relatives and significant others in their lives. The
stigmatisation attached to hearing loss has several important and potentially damaging
consequences, listed by Hetu et al as fear of revealing hearing difficulties to others,
reluctance to use aids, avoidance of contact with co-workers and isolation.

Further evidence of the stigma attached to hearing loss at work is provided in the
study by Herbst et al (1991) which compared a group of hearing impaired elderly
people in London with a similar group in Wales. Those for whom the onset of
hearing impairment had occurred before retirement were significantly more likely
than others to describe their hearing as bothersome. The authors suggest that this was
to be expected since the onset of hearing loss was untimely, and because of the
associated stigma they had done nothing about it.

Hallberg and Jansson (1996) found stigmatisation to be a major issue affecting the
attitudes of women with noise induced hearing loss; they adopted coping strategies
(for example pretending to hear) intended to prevent or minimise the risk of
stigmatisation. The women perceived that other people viewed them as stupid,
mentally retarded or prematurely aged.


76
77


In 1996, Hetu published a major overview of the stigma attached to hearing
impairment (Hetu, 1996). (See Chapter 4 for a full description of this paper.) He
cites his own and other research which shows that hearing loss causes embarrassment,
lack of confidence, a sense of inferiority, and shame. Women perceived their hearing
impairment to be associated with a lack of intelligence, mental health problems,
weakness, disability, and old age. According to Hetu, as well as being stigmatised by
others, hearing loss is a threat to social identity and can lead to self-stigmatisation.
Hetu also explains that, as stigmas combine, people who are already discredited
because of some other characteristic will experience the stigma of hearing loss more
acutely. This may typically occur in the case of elderly people (stigmatised because of
both hearing impairment and age) and of women (stigmatised because of hearing
impairment and lower social status and self image).

The lengthy period that often occurs between the onset of difficulties and seeking
help, which may be up to 15 years, is a further indication of the negative stigma
attached to hearing loss, which may exacerbate the difficulties experienced by the
hearing impaired person.

The overwhelming view among research workers and writers on hearing impairment
is therefore that it can lead to stigmatisation by others, plus self stigmatisation and
loss of self esteem. These problems seem to occur among all age groups and types of
sufferers – people at work being stigmatised by colleagues, and elderly people and
women being particularly sensitive to stigmatisation and loss of self esteem.


5.7     Education
There is a large body of research showing that hearing impairment affects children’s
development at school (Bess et al, 1998), although the effects of hearing impairment
on children are beyond the scope of the present report. However, hearing loss also has
an impact at secondary and university level. The studies by Bess et al (1989) and by
Mulrow et al (1990a) found that, with increasing hearing loss, the educational status
of their hearing impaired subjects decreased, and that individuals with hearing loss
had on average less education than hearing subjects. The reasons for these differences
are not known, all the subjects were elderly and the hearing impaired subjects also
tended to be older than those with normal hearing. Nevertheless it is possible that this
may illustrate the difficulties experienced by hearing impaired people in pursuing
education at higher levels, which have been found in other research.

A study in Sweden investigated the educational expectations and achievements of a
group of young people with hearing loss (Danermark et al, 2001), citing research
which showed that the number of hearing impaired students who continue their
education as a post secondary level in Sweden is much lower than for their normal
hearing peers. The authors reported that, in addition to educational difficulties related
to hearing problems, it is much more difficult for hard of hearing students in upper
secondary education to cope with changes in intentions and educational goals than
their hearing peers. All 16 of their subjects, average age 28 years, had been educated
at hard of hearing school. Almost all reported low expectations from their parents
regarding their education. Half of the group had gone to university and half had
entered the labour market. Of the latter group, all were in low paid, unskilled jobs or
had earlier experience of such work. The ones in this group who were now


77
78


considering post secondary education had great difficulties. However, the authors
found that hearing level did not seem to be related to educational performance and
choice.

Low expectations of deaf and hard of hearing students were also found in the study by
Hauland and Gronninguter (2003), who surveyed students aged 16 to 20 in Norway.
They found that teachers had low expectations of hearing impaired students, and that
consequently levels of instruction were low. Furthermore, many deaf and hard of
hearing students are limited in their choice of subjects. For example, people with a
hearing loss will in general have more problems communicating verbally in foreign
spoken languages, since lip-reading a foreign language is significantly more difficult
than lip-reading a native language. Rutman (1989) also states that hearing
impairment has considerable effects upon career choice and goals for younger people.

Social factors may also contribute to difficulties for deaf and hard of hearing students.
Gregory (1998) cites research which shows that deaf students experience social
difficulties such as loneliness, isolation and social rejection in mainstream educational
settings. Hearing impaired students also have problems in conversing in group
settings, and may be isolated at college with no friends.

There is thus evidence, of an anecdotal rather than statistical nature, to suggest that
hearing impairment impacts in both direct and indirect ways upon educational
experience and achievement.


5.8     Denial
A common feature of the onset of hearing impairment, especially in the early stages,
is denial of the problem (both to oneself and to others), which is mentioned explicitly
or implicitly in many of the studies into the psychosocial effects of hearing loss. This
is often related to fear of stigmatisation (Hetu, 1996). It is easier to deny existence of
hearing impairment than of many other disabilities, as it is an invisible impairment.
Rutman (1989) regards denial as a potentially unhealthy response, which occurs
particularly when the hearing loss is progressive. A result is that the loss may be
undetected for many years with the changing behaviour of the individual being
attributed to other causes such as senility.

Rutman (1989) cites references to show that denial occurs at any age, although it is
more common among the elderly than among young people. Adolescents deny their
hearing problems so as not to appear different from their peers; working adults
because of the impact on employment and career aspirations; and the elderly because
of connotations with senility. Some authors cited by Rutman show that denial is the
first stage of adjusting to hearing impairment, the period of denial lasting from days to
years in some cases. Obviously denial has a serious effect on adjustment to hearing
loss as it delays the acquisition of new communication skills, leading to further social
isolation. As Rutman states, for successful adjustment to hearing loss it is necessary
to recognise and accept one’s auditory problems.

Denial has been found in many of the surveys of hearing impaired people discussed in
Chapter 4. In the study by Thomas and Herbst (1980), 125 (59%) of their subjects
said that they tended not to tell other people of their deafness. The reasons given


78
79


were as follows: because they felt embarrassed or ashamed (40 subjects, that is 19%
of sample); because they had found that if they did the public treated them badly (27,
or 13%); they felt it unnecessary (53, or 25 %); while five did not know the reason.
At least 67 subjects (32% of the sample) could identify negative social responses to
their hearing impairment and so took steps to conceal it. Denial was also a common
feature of the survey of adjustment to acquired hearing loss among deafened adults in
Canada, carried out by David and Trehub (1989).

Similar reluctance to acknowledge their hearing difficulties was found in the
qualitative study of the effects of noise induced hearing loss upon workers and their
spouses (Hetu et al, 1990). This reluctance was expressed through various forms of
denial, minimisation of the problem, uneasiness in talking about problems and in
attempts at normalisation (Hetu, 1996). Denial was also found in the study by Herbst
et al (1991) of hearing impaired people in London and Wales. In both areas a quarter
of the sample denied having any hearing problems, although the majority of both
groups had better ear hearing losses of over 35 dB.

Denial is generally reported as being more common among men than women. In his
paper on the stigma attached to hearing loss Hetu (1996) cites several references
which show that men are less able than women to accept physical disability of any
kind. However, there is evidence, cited by Hetu, of women concealing their hearing
impairment outside the home, particularly at work and in leisure activities, as it made
them feel less feminine and was perceived as a sign of lack of intelligence, of mental
health problems, weakness, disability, and old age. Also, in the four case studies
included in the paper by David and Trehub (1989) the two male subjects (aged 29 and
54) seemed eventually to accept and adapt to their hearing loss, unlike the two female
subjects (aged 21 and 49).

In summary, denial of a hearing problem, more or less consciously, has been found to
be common among all age groups. It can obviously have serious consequences and
exacerbate the problems of hearing impairment, not least because it delays an
individual seeking help to mitigate the problem to a greater or lesser extent.


5.9    Difficulties in particular environments
Two recent studies have investigated particular problems that hearing impaired people
have in using public spaces (Breadin, 2000; Davies et al, 2001).

Breadin used a combination of semi-structured interviews and questionnaires to ask
15 hearing impaired people, aged from 40 to over 80, about difficulties they
experienced in particular types of space in the built environment. They reported
having difficulties with conversation in cafes, with staff at supermarkets, and in
general when large numbers of people were present. As well as reverberant spaces,
spaces with lots of sound absorption that are regarded as pleasant and quiet by people
with normal hearing cause problems because people speak quietly in such places.
Particular difficulties were reported in places with high noise levels, for example near
a busy road, in church when the organ is playing, and hearing announcements in
stations and airports etc. Several respondents reported that they no longer visited
particular pubs or hotels because of the noise levels, and that they feared their hearing
would be further damaged in noisy environments.


79
80


Breadin also carried out a questionnaire survey of 40 people, of whom 21 had (self
reported) normal hearing and 19 some degree of hearing impairment. The hearing
impaired group cited coaches, churches, doctors’ surgeries, lecture theatres and public
halls, and adult education centres as places where more loop systems should be
installed.

Differences between the hearing impaired and the hearing groups included the
following:

•    More of the hearing impaired group than the hearing sample reported it was easier
     to hear a woman’s voice
•    None of the hearing impaired group reported no difficulty in hearing in noise,
     compared with 14% of the hearing group
•    42% of the hearing impaired group found piped music very annoying, compared
     with 14% of the hearing sample.
•    16% of the hearing impaired group regarded live music as pleasant compared with
     43% of the normal hearing
•    42% of the hearing impaired group reported amplified music in shops to be very
     annoying, compared with 14% of the hearing group.

A similar but more extensive study was carried out by Davies et al (2001). In this
survey the activities and daily lives of 207 elderly hearing impaired people, 84% of
whom were over 65 and 67% over 75, were examined. The survey consisted of
interviews, focus groups and examination of weekly diaries kept by 60 of the subjects.
Many of the subjects said they avoided crowded spaces and tended to shop in the
mornings when shops are less crowded. Many described problems of socialising in
groups when there were other voices in the background. Subjects reported particular
difficulties when using transport, for example hearing was made more difficult by the
noise of the engine of a car or bus. Churches were also identified as spaces where
hearing was difficult although the problems were often attributed to the person
speaking. Interestingly there was some evidence that, in completely routine social
interactions, poor speech communication was tolerated. For example, some people
attended lectures regularly even though they often missed part of what was said.
Respondents seemed to prefer to take part in the activity and not be able to hear than
to avoid the activity altogether. It seemed that the process of conversation was more
important than hearing every word.


5.10 General health/visiting the doctor
There appears to be a limited amount of information regarding the relationship
between general health and hearing loss. In his analysis of the 1994 NHIS data
O’Neill (1999) found that, overall, 39% of those with hearing loss reported being in
'excellent or good health' compared with 68% of those without hearing loss. For those
over 65 years of age, the percentages were 29% (with hearing loss) and 41% (without
hearing loss). Nearly one third of the population with hearing loss reported being in
'fair or poor health' compared to 9% of population without. These figures are
consistent with those from the 1992 Health and Retirement Study, also reported by
O’Neill (1999) which show that, among the retired population, poor health was a


80
81


factor in the decision to retire for 70% of those with hearing loss compared with 44%
of those without.

There is some evidence in the literature of problems experienced by deaf and hard of
hearing people when visiting doctors’ surgeries. Gregory found that, of 40 hearing
impaired 20-21 year olds only 16 were able to go to the doctor alone (Gregory, 1998).
In the study by Breadin (2000) the hearing impaired subjects questioned felt there was
a need for more loop systems in doctors’ surgeries.

These comments are supported by the large survey of its members and GPs carried
out by the RNID (RNID, 1999) which provides evidence of the difficulties faced by
deaf and hard of hearing people when visiting their GP. Problems included leaving a
doctor’s surgery without understanding what is wrong (23%), relying on other people
to interpret (32%), and being unable to make an appointment because of
communication problems (16%). Two thirds of the people surveyed thought GPs
surgeries could be improved.

In the survey of over 400 GPs it was revealed that very few surgeries had appropriate
facilities to support deaf and hard of hearing people. This survey is described in more
detail in Chapter 4.

Thus it can be seen, from Section 5.9 and this section, that hearing impairment can
cause difficulties in day to day life through difficulties in using commonly visited
environments.


5.11 Cognitive skills and dementia
Evidence on the relationship between hearing impairment and cognitive or mental
skills is confused. As pointed out by Hetu (1996), for many years deafness has been
associated with mental disability and reduced cognitive skills. This is partly because
hearing loss is associated with old age and, as a consequence, with frailty of body and
mind. McKellin, cited in Hallberg (1999), also refers to the cultural association of
hearing disability with impaired cognitive skills.

In some cases the symptoms of hearing loss, especially in elderly people, can be
sufficiently debilitating to mimic dementia (Committee on Disabilities of the Group
for the Advancement of Psychiatry, 1997). This may be the reason for some of the
findings suggesting that dementia is related to hearing loss.

Several authors refer to papers which show a link between hearing impairment and
dementia, confusion or decline in cognitive function in old age (Bess et al, 1991;
Noble, 1996; McKenna, 2001). However, in some of these studies the association is
lost when age is taken into account (McKenna, 2001).

Mulrow et al (1990b) report that research into an association between hearing
impairment and dementia is inconclusive and cite several studies which show a
relationship and others which do not. An aim of the study by Mulrow et al was to
examine this aspect further but, using the SPMSQ scale to assess the cognitive status
of their hearing and hearing impaired subjects, almost all subjects in both groups had
unimpaired mental function so they were not able to progress this investigation (see


81
82


Appendix 3 for details of the scale). The study by Bess et al (1989) in fact found that
as hearing impairment increased there was a trend for subjects to score slightly higher
on a mental status questionnaire.

McKenna (2001) reports that some people with hearing loss, including young people,
find difficulty in concentrating. It has been assumed in the past that this is a result of
fatigue, due to the effort of listening and lip reading, or from emotional distress.
However, recent research has found subtle difficulties in information processing
which can not be explained in terms of fatigue or emotion. One study found that the
degree of difficulty in information processing was related to the duration of the
hearing loss. It is suggested that, in some people, hearing loss may lead to changes in
the way the brain processes information, and that they may be less able to process
certain types of verbal information. This appears to be the only study to provide
definitive evidence of a relationship between hearing loss and some aspect of
cognitive function.


5.12 Memory
There has been a limited amount of research investigating whether or not hearing loss
affects memory. Dye and Peak (1983) found that of 58 male subjects, aged 45 to 83,
those with more severe hearing loss HL (>35 dB HL) were less alert to information
from the environment, and less capable at memory tasks and learning new material
than those with a less severe loss.

A study by Rabbit (1991) found that mild hearing loss can cause apparent memory
failures which increase with age and reduce with IQ. Screening, using word tests, of
960 individuals aged 50 to 79 suggested that changes in memory efficiency could be a
secondary effect of age related mild hearing loss. Words were presented both visually
and aurally in quiet and in noise. For young adults recall is better for spoken words
but for the older subjects in this study the reverse was true. The disparity between
auditory and visual presentation increased with age and was significantly greater for
those in the 70-79 age group than for those aged 50-69 years. The number of words
recognised decreased with age and hearing loss. Rabbit suggests that older people
with hearing loss are therefore at a double disadvantage in following speech – they
may not hear or may mishear words, and may remember less well words which they
do identify correctly. This can have a significant social effect, as they may appear to
be much less competent than they actually are in everyday social interaction, and
therefore appear less rewarding companions than they may potentially be.


5.13 Intimate relationships
Hearing loss can cause problems in establishing and maintaining relationships with
the opposite sex. Gregory (1998) reports that young deaf people perceive problems in
establishing such relationships. Of 48 over 21 year olds in the study by Gregory, 18
(38%) were reported by their parents as never having had a boy or girl friend.

Hearing impairment can also put a strain upon marital relationships. In the study by
Thomas and Herbst (1980) less than half the hearing impaired subjects (48%) felt that
their hearing problem was understood by their spouse.


82
83


In an article on the impact of acquired deafness, Rutman (1989) describes how
hearing impairment in middle adulthood may disrupt interpersonal relationships and
threaten marriages.

Hetu et al (1993) reviewed the available literature concerning the impact of hearing
impairment on intimate relationships and noted the lack of research in this area. The
authors list reported effects on the unimpaired partner of a hearing impaired person;
these include stress, tension, irritation, fatigue, frustration, anger, resentment and
guilt. These highlight how vulnerable intimate relationships may be to the effects of
hearing impairment. However, in most rehabilitative programmes the focus is on the
needs of the impaired partner while those of the unimpaired partner are often not
considered.

Effects of hearing impairment on couples were also discussed by Hallberg (1996) who
found that a hearing impaired person often describes their spouse as the least
understanding person, and that hearing impairment can cause contradictions between
couples and affect their relationship. Communication between a couple may be
minimised or hardly exist at all in some cases, and there may be frustration and
irritation on the part of the hearing partner. A couple’s social life may be disrupted
and social gatherings may cause additional stress. Misunderstandings and irritation
within a family may have a further negative impact on intimate relationships, and,
according to one of Hallberg’s interviewees, ‘a hearing disability has many
consequences on the close relationship...even in the bedroom’.

It is therefore possible, although no quantitative evidence has yet been found, that
hearing loss can lead to a break up of marital and other close relationships, which will
in turn cause further depression, loneliness and so on.


5.14 Prejudice and abuse
The main evidence on prejudice towards and abuse of hearing impaired people is
provided by the RNID report of 1999, summarised in Chapter 4, although Hetu et al
(1990) describe hearing impaired workers as being the victims of jokes by male
colleagues, and also being stigmatised by relatives and others. Hetu (1996) also
reports research which has found that hearing impaired women have been the objects
of jokes or pity.

The RNID report (RNID, 1999) showed a great extent of prejudice, intolerance,
patronising and abuse experienced by deaf and hard of hearing people. The survey
found that having a hearing loss at least doubles the likelihood of experiencing
abusive language. Nearly half the respondents reported having been made fun of or
ignored because of their deafness, while the vast majority had been ignored,
patronised or had experience of others becoming impatient with them. One in five
had been the victim of abusive language and gestures, and one in 20 had experienced
physical violence. (However, the proportion of the general population who
experience such behaviour is not given for comparison.)


83
84


5.15 Discussion
This and the preceding chapter have presented an extensive review of literature
relating to the psychological and social effects of hearing impairment. Nearly all the
literature shows that hearing impairment has a significant psychosocial impact upon
sufferers. Some of the effects are more serious than others, but all lead to a reduction
in the quality of life of the hearing impaired person. This section discusses the
evidence which has been presented. in Chapter 4 and this chapter.

5.15.1 Types of study
The studies which have been reviewed are of various different types: some are
qualitative studies, where the findings are based upon interviews with hearing
impaired subjects; others have involved more quantitative research in which subjects
are ‘scored’ in various dimensions. To an extent however, all the studies are
qualitative in nature, most involving some sort of questionnaire survey and self
assessment in areas such as hearing handicap, personality and social relationships.

Of the qualitative studies based entirely upon interviews, some have involved
interviews and discussions with a small number of individuals or small groups and the
outcomes have been analysed in detail to discover common patterns of experience and
behaviour in dealing with hearing impairment and its effects. Other studies such as
those carried out by the RNID have involved large scale interview surveys from
which figures relating to different experiences have been obtained.

The quantitative surveys are of two kinds. Some studies present data relating to the
percentages of a hearing impaired sample who experience particular kinds of effects;
in some cases the figures for a hearing impaired group are compared with those of a
matched control group. Other studies have attempted to investigate in more detail the
exact relationship between impairment and an effect, that is, to determine whether the
effect is greater if the degree of hearing loss is greater.

However, whatever the methods used, with very few exceptions, all the reviewed
studies arrive at the same conclusion: that is, that hearing impairment, at any age, has
significant detrimental psychosocial effects.

5.15.2 Attitudes towards hearing impairment
While the negative attitudes towards deaf and hard of hearing people are not as strong
as they were a century ago – Davis et al (1991) quote Jackson who in 1902
recommended that deaf people should withdraw from society so they would no longer
notice their deafness – they still exist among both hearing people and hearing
impaired people themselves. This review has shown how these attitudes can affect
hearing impaired people who may be abused, discriminated against at work and in
seeking employment (see Chapter 11 for discussion of employment issues) or have
family problems, and can lead to low self esteem.

The medical profession also often has an ambivalent attitude towards deafness.
Several authors comment on the fact that loss of hearing in old age may be under
diagnosed or not taken seriously by doctors as it is often regarded as a natural
consequence of old age and therefore as a relatively benign problem (Bess et al, 1989;
Barnett, 2002).


84
85


5.12.3 Interrelationships between effects
Some of the effects that have been reported, such as memory loss or difficulty
understanding conversation, may be considered as direct and independent effects of
hearing loss. However, many of the effects described in this chapter can be regarded
as indirect, or secondary, effects which may be interrelated, for example depression
could be caused by loneliness or poor family relationships which are themselves a
consequence of the hearing loss.

Results of different surveys are also strongly related. For example, several surveys of
older people found that greater hearing loss was associated with less education. Other
papers have suggested that young people may have difficulties coping with
mainstream education and also that their choice of subjects for study can be restricted.
It is possible that the lower level of education is a direct consequence of these
problems, or of the anticipation of such problems which may deter hearing impaired
people from pursuing their studies.

5.15.4 Need for future research
It can be seen that much of the research that has been reviewed is concerned with
elderly adults, or with men suffering from noise induced hearing loss. Even in studies
which have examined effects of hearing loss across the age range, the majority of
subjects tend to be on the older side. However, the work of Gregory (1998) and
others shows that hearing impairment has many important effects on adolescents and
young adults. These young people will be affected throughout their lives. There is
therefore an urgent need for more research with people of this age. This is
particularly important in view of a likely increase in the prevalence of hearing loss
among this age group as a result of listening to personal stereos and loud music. This
is also likely to lead to an increase in the number of people in their 30s and 40s with
serious hearing loss. As with younger adults, apart from anecdotal evidence, data on
the effects of hearing impairment on this age group is scarce. Similarly, there is a
need for further research into the impact of hearing impairment upon the lives of
women of all ages.

5.15.5 Costs
Apart from the personal cost to the individual in terms of their quality of life, many of
the effects described in these two chapters will have costs to the state for health care,
treatment of depression, social benefits for unemployed people, marriage break ups
and so on. The costs to society and the individual of hearing impairment are
addressed in Chapters 10 and 12.


5.16 Conclusions
This chapter has considered the many psychosocial effects of hearing impairment on
adults of all ages. It can be seen that most of the papers and articles reviewed provide
converging and conclusive evidence that hearing impairment, whether moderate or
severe, has a serious impact upon a person’s social and/or emotional life, and reduces
their quality of life.

In Chapter 12 specific issues relating to the impact of hearing loss upon employment
are considered. Chapters 6 to 9 examine the provision of hearing aids and evidence of


85
86


the benefits that are provided by aids, which may mitigate some of the effects
reported in this and the preceding chapter.


86
87


CHAPTER 6             OWNERSHIP OF HEARING AIDS

6.1     Introduction
Many people who are hearing impaired do not own a hearing aid. This chapter
reviews literature concerning the prevalence of hearing aid ownership and non-
ownership among the hearing impaired population. Data concerning ownership in
different countries is presented and reasons for people not seeking help or not
accepting a hearing aid are discussed.

This review covers a period of approximately 40 years, and therefore refers to
different types of aids including body-worn devices, behind-the-ear and in-the-ear
aids. It might be expected that ownership would increase as technology advanced and
hearing aids became smaller and less obvious. However, the data presented in this
chapter shows that in fact this has not been the case.


6.2      Ownership of hearing aids
There is a significant amount of recent reliable data on the prevalence of hearing aid
fitting and non-use in the US and northern Europe. The main sources of data reviewed
here are a report by the National Institute of Clinical Excellence (NICE) in the UK,
which is part of the National Health Service, published in 2000 (NICE, 2000), and a
report comparing hearing services in the UK and Scandinavian countries published in
2001 (Sorri et al, 2001). Detailed data on hearing aid ownership and use in the US is
published regularly by Kochkin in a series of reports of MarkeTrak surveys which
have been carried out by Knowles Electronics for the Hearing Industries Association
since 1989 (Kochkin 1993, 1994, 1998, 2001, 2002, 2003). It will be seen that there
is considerable variation in the number of hearing aids prescribed in different
countries.

6.2.1 Hearing aid ownership in northern Europe
In England and Wales it is estimated that approximately 8.1 million of the population
have a hearing impairment, of whom around 90% have a sensorineural hearing loss
and would benefit from a hearing aid. Approximately 1.4 million, or 3.4% of the
population, have a hearing aid prescribed, although around 10.4% of the population
could benefit (NICE, 2000; Davis, 2003). Thus only around one in three of those who
could benefit from a hearing aid owns one. The number of aids supplied annually is
around half a million, of which one third are given to new users.

Interestingly, the ratio of the number of aids fitted to the number of people who could
benefit has not changed over a period of many years. The National Institute of
Clinical Excellence reported in 2000 that this ratio had not changed in the preceding
15 years (NICE, 2000), and there is some evidence that it might have remained the
same for the past 40 years (Gilholme-Herbst et al, 1991), see Section 6.3. This is
surprising in view of the evidence, discussed below, which suggests that technical
improvements and changes in the appearance of hearing aids would increase their
usage.

Sorri et al (2001) report that of the several million hearing impaired people in Nordic
countries (Denmark, Finland, Iceland, Norway, Sweden), around 60-70%, possibly up


87
88


to 85%, could benefit from hearing aids. It is estimated that around 5% of the total
population have a hearing loss of 45 dB or above in both ears, while around 20% have
a bilateral loss of 25 dB or above.

Sorri et al tabulate the number of hearing aids provided in each of the countries they
considered, including the UK, as shown in Table 6.1. The table shows considerable
variation between countries in the numbers and proportions of hearing aids provided.
This is partly because some countries, eg Denmark, prescribe a greater proportion of
bilateral aids, as seen in Table 6.2. The UK and Finland provide fewer bilateral aids
than Denmark and Norway and in Finland a lower number of people than elsewhere
have a hearing aid. It should also be noted that hearing aids dispensed privately are
not included in this data.

Table 6.1 Numbers of hearing aids provided in various countries (data from Sorri et
                                    al, 2001)

        Country                     Estimated number of                Average     number     of
                                    hearing aids provided              hearing aids provided
                                    annually                           annually per 1000 people
        Denmark                     65,000                             12.30
        Finland                     14,000                             2.72
        Norway                      40,000                             9.10
        Sweden                      62,000                             7.00
        UK                          560,000                            9.32
         Notes:   All except Sweden include hearing aids provided to both adults and children
                  Hearing aids dispensed privately are not included
                  A hearing aid for each ear counts as two hearing aids


Using a figure of 3.5% for the percentage of the population of the UK who own a
hearing aid, and taking account of the numbers of people who have bilateral hearing
aids, Sorri et al have estimated the percentages of the populations of Nordic countries
who have a hearing aid as shown in Table 6.2.

Table 6.2 Estimated numbers and percentages of hearing aid users (Sorri et al, 2001)

     Country       Estimated % of              Average no. of people              Estimated % of
                   bilateral hearing           prescribed       hearing           population who have
                   aids                        aid(s) annually per 1000           hearing aid(s)
     Denmark       50-60                       7.7-8.2                            3.35
     Finland       20                          2.27                               0.96
     Norway        60                          5.69                               2.40
     Sweden        30                          5.38                               2.27
     UK            10-15                       8.1-8.5                            3.50
     Average                                                                      2.5

From Table 6.2 it can be seen that the percentages of people with hearing aids are
very much lower than the 20% of the population predicted to have a hearing loss of 25
dB or greater, and even lower than the 5% estimated to have a hearing loss of 45 dB
or more. On average 2.5% of the population in Europe have a hearing aid; that is 1 in
8 of the 20% of the population with a hearing impairment, or 1 in 4 of the population
who would benefit form an aid according to Davis (2003). There are thus many more
people who could benefit from the use of hearing aids than are currently doing so.


88
89


A recent survey of older people in the UK aimed to estimate the numbers of them who
were hearing impaired, and the levels of ownership and use of hearing aids (Smeeth et
al, 2002). Of 32,656 subjects aged at least 75 years 8% reported a lot of difficulty
hearing and 42% a little or a lot of difficulty. Thus half the study group reported some
hearing difficulty. However, only 26% of the subjects owned a hearing aid. Of these,
60% said they used their aids regularly, implying that 40% of the hearing aid owners
in the study do not wear their aids regularly. Nearly 15,000 subjects were given a
whispered voice test, the results of which are shown in Table 6.3. It can be seen that
the test was failed by 26% of the participants. Of those who failed the hearing test
48% owned a hearing aid and 26% were wearing their hearing aid at the time of
testing. Thus 52% of the subjects with hearing difficulties did not own an aid.

Table 6.3 Numbers failing hearing test and owning hearing aid (Smeeth et al, 2002)
                             % who failed     % who failed test     % who failed test
                      Age
                             hearing test     wearing aid           who own aid
                     75-79        19                 23                   44
                     80-84        31                 26                   53
           Men       85-89        41                 31                   52
                     ≥90          56                 26                   49
                     All          27                 26                   49
                     75-79        15                 20                   39
                     80-84        25                 26                   49
           Women     85-89        38                 29                   49
                     ≥90          55                 37                   51
                     All          25                 27                   47

This is one of the few studies to investigate the relative ownership and use of hearing
aids by men and women. Of the subjects with reduced hearing, after adjustment for
age, women were less likely than men to own a hearing aid. However, after
adjustment for age women were found to be slightly more likely than men to use their
aids regularly.

6.2.2 Hearing aid ownership in the United States
A similar pattern of ownership to that in Europe emerges in the US. The most recent
MarkeTrak survey was the Marke Trak VI, carried out in late 2000. Following a
survey of 80,000 US households, detailed demographic data was obtained on 15,800
hearing impaired individuals. Of these, 3000 hearing aids owners were studied in
more detail and the results published in the following year (Kochkin, 2001).

Kochkin presents detailed data showing the variation in numbers of hearing impaired
people and hearing aids owned and used in the US since 1984, as shown in Table 6.4.

  Table 6.4 Hearing aid ownership in the US since 1984 (data from Kochkin, 2001)

                                              1984   1989    1991      1994    1997     2000
     Number of hearing impaired (millions)    16.4   24.68   25.84     26.12   27.21    28.62
     Hearing aid owners (millions)            3.9    5.65    5.84      5.56    5.55     6.35
     Hearing impaired non-owners (millions)   12.5   19.03   20.00     20.56   21.66    22.27
     No of hearing aids owned (millions)      4.8    7.76    8.79      8.45    8.88     10.43
     No of hearing aids used (millions)       4.15   6.71    7.73      6.94    7.44     9.20
     Percentage of hearing impaired
                                              23.8   22.9    22.6      21.3    20.4     22.2
     who own aid(s)


89
90


It can be seen that although the numbers of hearing impaired people have increased
consistently since 1984 the numbers of people owning hearing aids decreased
between 1991 and 1997. The percentages of hearing impaired people owning hearing
aids also decreased consistently from 1984 to 1997. However, between 1997 and
2000 both the number of hearing aid owners and the percentage of hearing impaired
people with aids increased. Kochkin analyses the ownership of hearings aids from
1984 to 2000 according to various demographic factors such as age, household
income and educational level. He found that the age group with the largest increase in
reported hearing impairment in the 10 years from 1991 to 2000 was the 45 to 54 year
old group. In the period 1997 to 2000 this group, and the 75+ age group, showed the
greatest increases in incidence of hearing impairment. Kochkin suggests that a reason
for the increase in the 45 to 54 age group is the revelation in 1997 by President
Clinton of his hearing loss and use of hearing aids. This factor may also explain the
overall increase in percentage ownership of hearing aids.

The percentage of hearing impaired people who own hearing aids in the US is around
22%; thus approximately one in five of those who would benefit own a hearing aid,
compared with one in three in the UK. A possible reason for the difference between
the US and UK is that hearing aids are provided free of charge under the National
Health Service in the UK, whereas there is a cost involved in having a hearing aid
fitted in the US.

6.2.3 Hearing aid ownership among new users
Table 6.5 shows the numbers of new users as a percentage of all hearing aids sold in
the US from 1989 to 2000 (Kochkin, 2001). It can be seen that there was a
considerable drop in the number of new users during the period 1997 to 2000 (31.6%
of hearing aid sales in 2000 compared with 39% in 1997). However, the number in
1997 was a large increase over the 1994 figure, again suggesting that the ‘Clinton
factor’ may have encouraged hearing loss sufferers to acknowledge their loss and to
request hearing aids. The high percentage of new users in 1989, decreasing
continually until 1997, also suggests that users may have been motivated to purchase
a hearing aid as a result of hearing aid TV commercials in 1988 and 1989. Kochkin’s
analysis also shows that the age of new users is increasing, being 68.8 years in 2000
compared with 66.3 in 1997. This is surprising given the increase of hearing
impairment among younger age groups and suggests either that there is a lack of
awareness of hearing impairment or a reluctance to use aids among these age groups.

     Table 6.5 First time ownership in the US since 1989 (data from Kochkin, 2001)

                                              1989   1991   1994   1997   2000
              New hearing aid owners
                                              53.4   40.5   29.0   39.0   31.6
              (percentage of all aids sold)
              Average age of new owners       66.0   68.4   67.8   66.3   68.8

Kochkin also discusses the factors influencing first time users to purchase hearing
aids. Of the 19 factors mentioned, the three most prevalent in 2000 were awareness of
deterioration in hearing (68.5%); pressure from family member (45.2%); and
audiologists (40.5%).

The percentage of first time hearing aid users in the US is very similar to that in the
UK where it is estimated that about one third of hearing aid provision is to new users


90
91


(Davis, 2003). The age of first time use in the UK has also increased as in the US
although the age of new users is higher than in the US, the median having increased
from about 70 years in the early 1980s to around 74 in 1999. The average age of first
time users is approximately the same as that of all users. This further implies a delay
between diagnosis of hearing impairment and wearing of an aid, possibly caused by
denial of the hearing loss.


6.3     Non-ownership of hearing aids
The data presented in Section 6.2 shows that (in Europe) only about one third of those
who would benefit from a hearing aid actually own one, while this ratio is lower in
the US. As reported by the National Institute for Clinical Excellence (2000), the ratio
of owners to non-owners did not change in England and Wales over the fifteen year
period leading up to 2000. In fact, the ratio appears to have remained constant,
certainly in the UK, for an even longer period. Gilholme Herbst et al (1991) found, in
a comparison of elderly people in London and a rural community in Wales, that only
around one third of those admitting to hearing loss (29% in London and 33% in
Wales) possessed hearing aids, and reported that these figures were consistent with
those of previous surveys carried out in 1962 and 1972. As the authors comment ‘It is
rather a sad reflection on the state of the art and attitudes to hearing impairment that
things have not improved in so many years.’ (Gilholme Herbst et al, 1991). How
much more depressing it is that the situation remains the same after yet another
decade. The surveys carried out by Kochkin (2001) and discussed in Section 6.2 show
similar consistency in the US, where the percentage of the hearing impaired
population owning hearing aids has remained at around 22% for the past 20 years, see
Table 6.4. This is despite the reasonable supposition, supported by some studies and
expressed by several authors (for example Thomas and Herbst, 1980; Dye and Peak,
1983; Robillard and Gillain, 1996), that with improvements in the technology and
appearance of hearing aids, an increasing number of people would accept and wear
aids.

There are many reasons why people do not seek help for hearing loss or, having
sought advice, decide against wearing a hearing aid. Research which has been carried
out to examine these issues over the past twenty five years is reviewed in the
following sections.


6.4    General reasons for non-ownership of aids
Several papers, in addition to carrying out research into particular aspects of non-use
of hearing aids, discuss the general reasons why people do not seek help or refuse to
wear an aid.

An early study to examine the reasons why elderly (65 and over) people reject the use
of hearing aids was carried out by Franks and Beckmann (1985) among a group of
100 subjects in the US. The subject group was divided evenly into four categories:
those with normal hearing; those with hearing impairment who had never worn an
aid; those who had worn an aid for at least one month but no longer wore one; and
those who currently used hearing aids. Subjects were presented with 36 possible
reasons for non-use of aids and asked to rank them. A disadvantage of this method is
that it ‘leads’ respondents and, in the report of the study, some of the questions appear


91
92


to be repetitive or not appropriately worded. Nevertheless important insights were
provided into the reasons for non-ownership of aids, which have subsequently been
confirmed by other studies. The two most important reasons given for non-use were
cost and the fear that having a hearing aid will draw attention to the hearing loss.
Other highly ranked reasons among the groups without aids were that aids are
inconvenient and uncomfortable to wear, ignorance of where to buy aids, the belief
that aids are only for the most severe problems, and being influenced by the poor
reports of others. Interestingly, reasons concerning attitudes of family and friends are
ranked the lowest which suggests that the reasons for non-use relate solely to users
and potential users themselves. Dissatisfaction with dispensers of aids also
contributed to their non-use.

Kochkin (1993) compared the reasons given for not purchasing hearing aids in two
studies of the Hearing Industries Association focus groups in 1984 and 1990. The
reasons commonly given in the earlier survey were the following:

     •   Hearing loss not severe enough
     •   Physicians do not recommend hearing instruments
     •   Hearing instruments cannot solve specific hearing problems

In the 1990 survey the stated reasons, in order of importance were:

     •   Hearing instruments have a stigma attached to them
     •   The person’s hearing loss is not serious enough to warrant getting hearing
         instruments
     •   Hearing instruments are uncomfortable or do not perform well
     •   Hearing instruments cannot solve specific hearing problems
     •   Hearing instruments cost too much, especially in relation to their value

It is interesting to note than in the earlier survey stigma, cost and performance did not
feature as reasons for non-ownership of aids. The reasons emerging from the 1990
study however agree strongly with those of the study by Franks and Beckmann (1985)
described above.

In 1993 Kochkin carried out a similar but much more extensive survey using a larger
group of subjects (Kochkin, 1993). He analysed the responses of 2306 hearing
impaired non-owners of hearing aids, having presented them with a list of 60 possible
reasons why they might not own a hearing aid and asked them to score the importance
of each reason.

He divided the reasons into six categories: hearing loss issues; consumer/personal
issues; stigma; hearing healthcare professionals; social network; and product. The
most important reasons which emerged within each category are listed in Table 6.6.


92
93


 Table 6.6 Reasons for non-ownership of hearing aids within categories defined by
                               Kochkin (1993)

                                                                                       Percentage
 Category of reasons                     Reason                                        non-owners
                                         Loss not severe enough                        43.3*
 Hearing loss issues                     Mild hearing loss                             40.6*
 Total 96%                               Hear well enough in most situations           39.5*
                                         Hearing loss not disruptive                   26.9*
                                         Cannot afford                                 44
 Consumer/personal issues
                                         More serious priorities                       43
 Total 68%
                                         Hearing not tested yet                        34
                                         Do not want to admit loss in public           27
                                         Embarrassment about wearing                   27
 Stigma
                                         Hearing aids are noticeable                   25
 Total 44%
                                         Hearing aids make you look old                22
                                         Hearing aids make you look disabled           20
                                         Advice of ENT specialist                      33
 Hearing healthcare professionals        Distrust of hearing aid specialists           29
 Total 44%                               Opinion of family doctor                      27
                                         Opinion of audiologist                        26
 Social network                          Opinion of spouse                             20
 Total 34%                               Opinion of hearing aid owner                  20
                                         Poor performance and low value                55
 Product feature                         Amplification of background noise             36
 Total 48%                               Maintenance expense                           32
                                         Hassle to use                                 30
* Percentage giving factor as ‘definite’ reason only; elsewhere numbers refer to percentages marking
factor as ‘definitely’ or ‘somewhat’ a reason.

Consistent with the findings of Franks and Beckmann (1985), cost, stigma, and a
belief that hearing aids are only for those with a severe problem feature as important
reasons why people do not own hearing aids. As in the Franks and Beckmann study,
Kochkin found that issues related to social networks and opinions of spouses and
other family members were of relatively low importance. These two studies therefore
suggest several possibilities: non-owners do not respond to the views of others close
to them; the families of non-owners are not bothered by the hearing loss; family
members are unaware of the benefits that could be obtained using hearing aids; or
many non-owners are not close to other people (for example, single or widowed and
living on their own).

An interesting finding relating to stigma in the study by Kochkin is that it is the 35 to
44 year age group who are most affected by stigma-related issues. Over 50% of non-
owners in this age group report not purchasing hearing aids because of some stigma
attached. This is of particular interest as this is the age group with the largest number
of non-owners.

Several of the issues contributing to the non-use of hearing aids which have been
raised in the studies reviewed in this section have been examined individually in other
studies and are discussed in the following sections.


93
94


6.5    Reluctance to seek help
Several studies have examined the reasons why people who are aware that they have a
hearing loss are reluctant to seek help for that loss. The survey by Kochkin discussed
above (Kochkin, 1993) found that over one third of hearing impaired subjects had not
had their hearing tested.

After reviewing the literature concerning the lack of help seeking for hearing
impairment Brink et al (1996) suggest that the main factors which influence help
seeking are related to:

1      The severity of hearing problems
2      A presumed passive acceptance of hearing problems by the elderly
3      Clinical experience that many hearing impaired elderly people believe that the
       problem is external
4      The stigma attached to hearing impairment and its association with mental
       disorder and old age
5      The poor image of hearing aids as ‘ineffective’ crutches
6      Mobility and financial barriers to help seeking
7      Lack of knowledge and misconceptions about hearing loss and hearing aids
8      Professionals who regard hearing problems as a normal part of ageing and
       doubt the ability of hearing aids to help the elderly
9      Social pressure from significant others to seek help

It can be seen that these factors reflect in general the reasons given in the surveys
discussed above concerning the non-ownership of hearing aids.

Two surveys have been carried out in the Netherlands by Brink and colleagues (Brink
et al, 1996; Duijvestijn et al, 2003) to establish more precisely the attitudes of mature
hearing impaired people towards help seeking. In the earlier study 144 hearing
impaired subjects, aged 57 and above and selected randomly from various general
practices, answered an attitude questionnaire and a hearing disability and handicap
questionnaire. Forty one percent of the sample used a hearing aid. Over one quarter
(27%) had not seen a doctor; over one quarter (26%) had seen a doctor but not tried
an aid and 3% had not taken an aid after a trial. The authors found that help seeking
was related to the perceived seriousness of the hearing problem. Those who had not
consulted a doctor perceived their hearing loss as relatively inconsequential, while
those who saw a doctor but would not try an aid saw the most stigma related barriers
to wearing hearing aids (for example making the hearing loss obvious to others or
making a wearer feel old).

The second Dutch study (Duijvestijn et al, 2003) investigated the importance of the
following four factors which influence help-seeking behaviour: hearing disability,
perceived social pressure from significant others; hearing aid image; and willingness
to try hearing aids. Two groups of hearing impaired subjects who did not possess
hearing aids were compared: 166 who had not consulted a doctor about their hearing
loss and 115 who had consulted their doctor. Significant differences were found
between the two groups in the subjective impressions of hearing and social pressure to
obtain a hearing aid, but there was no difference in their images of hearing aids.
Significantly more people in the ‘consulter’ group were willing to try a hearing aid.
The researchers found that awareness of hearing impairment alone was not sufficient


94
95


to seek a consultation with the doctor; help seeking behaviour was strongly dependent
on the degree of difficulty, social pressure and willingness to try a hearing aid.
However, the results of this study may not be widely applicable as subjects
volunteered to take part and were not typical of the hearing impaired population being
generally younger (55 and over), healthy and predominantly male. Also the
questionnaire described in the paper is short and limited in scope and in some cases
the interpretation of responses does not appear to be consistent with the wording of
questions (this may be due to translation of the questionnaire).


6.6     Variability in services provided
Once someone has decided to seek advice or help for a hearing loss, there is a wide
variety in the provision of audiological services. In particular, there is significant
variation in waiting times, for example within the UK as reported by NICE (2000)
where some centres have unacceptably long waiting times. There is also wide
variation across countries. The study of services in the UK and Nordic countries
(Sorri et al, 2001) also found a high variation in waiting times across and within
countries, from less than 3 months in Sweden to up to 18 months in Finland. It is
possible that the long waiting time in Finland is a reason for the low provision of
hearing aids in that country. In some countries certain groups have priority, for
example in Denmark and Norway employed people and children are prioritised to
have shorter waiting times. (However, there is no evidence to suggest that older
people receive an inferior service in these countries.)

Nevertheless, it is possible that, within a long waiting period, some of those who are
reluctant to seek help in the first place might change their mind and decide to continue
without a hearing aid.

In 1991 Gilholme Herbst et al suggested that services in the UK were likely to be
worse in areas of greater socio-economic deprivation where in fact there was a greater
need of services. In their study of hearing impaired subjects in Wales and London the
authors found that less than half of those who had consulted their doctor ended up in
possession of a hearing aid ((29/66 in London; 17/39 in Wales) suggesting that the
process of procuring an aid was equally problematic in both areas, due to the attitude
of both the patient and their doctor to hearing loss and ageing.


6.7    Denial of problem and delay in seeking help
Many researchers have reported that hearing impaired people wait as long as possible
before seeking help, sometimes as a result of denying to themselves and to others the
existence or the severity of a problem, or because, as seen above, they believe that
hearing aids are only used to benefit people with more serious hearing problems.

Dye and Peak (1983) report that seeking help is often delayed until the problems
caused by hearing loss outweigh the perceived stigma of wearing an aid. Brink et al
(1996) report two studies, by Brooks (1979) and Stephens et al (1980) which found
periods of several years (medians of 8 and 12 years respectively) between the onset of
awareness of hearing difficulties and seeking help. Thomas and Herbst (1980) found
an even longer delay in seeking help to be common; of 211 hearing aids owners in


95
96


their study, over 40% had known they had a hearing loss for 20 or more years before
obtaining an aid.

One possible reason for the delay in seeking help given by Eriksson-Mangold et al
(1990) is the association of hearing problems with getting old; this leads people to
ignore their problems for as long as possible. There is some evidence that elderly
people may have more difficulty acknowledging their hearing loss than younger
persons (Committee on Disabilities of the Group for the Advancement of Psychiatry,
1997). A study by Wiley et al (2000) suggests that one reason why the elderly may
apparently not acknowledge their loss is that they are less likely to consider
themselves handicapped by hearing loss. In examining the likelihood of self reporting
of hearing handicap among over 3000 participants aged from 48 to 92 in America,
although the prevalence of hearing loss increased with age, the self reporting of
hearing handicap decreased. Only 40% of participants with a measured hearing loss
reported having a hearing handicap. In the same study population Popelka et al
(1998) found that hearing aids were used by only 15% of those with a measured
hearing loss, and that only 21% of older adults with any degree of hearing loss had
tried aids.

Other reasons why older individuals may delay seeking help include depression and
social withdrawal which may prevent them from making use of available services
(Aguayo and Coady, 2001; Barnett, 2002). Also, older people who do not participate
in a great deal of activity outside the home may genuinely have little awareness of
their impairment, particularly as they may have learned to cope with it, possibly
unconsciously (Duijvestin et al, 2003). As Espmark et al (2002) report, it is not until
elderly people experience lack of sound as lack of contact with life that they show any
interest in hearing technology.


6.8     Stigma
It is apparent from the papers reviewed above that stigma plays an important role in
preventing many hearing impaired people from wearing a hearing aid. Indeed, as
stated above it may be that help is not sought until problems of hearing loss outweigh
the perceived stigma of wearing an aid (Dye and Peak, 1983).

Hetu (1996) has addressed at length the issue of stigma attached to hearing
impairment and considers it to be the major obstacle to rehabilitation, contributing to
the length of time between onset of difficulties and seeking professional help and to
the reluctance to adopt and use hearing aids when prescribed.

Many papers identify particular aspects of the stigma attached to hearing loss and
hearing aids as being reasons for non-ownership of aids. For example:

     •   Association with ageing (Dye and Peak, 1983; Eriksson-Mangold, 1990;
         Kochkin, 1993; Brink 1996)
     •   Association with mental disorder (Brink, 1996)
     •   Unsightliness of hearing aids (Dye and Peak, 1983)
     •   Drawing attention to hearing loss (Dye and Peak, 1983; Rutman, 1989;
         Kochkin, 1993; Hetu, 1996)
     •   Embarrassment (Kochkin, 1993; RNID, 1999)


96
97


It is therefore very important in order to increase the wearing of hearing aids that the
perceived stigma attached to the wearing of a hearing aid is overcome.

One way in which this might be achieved is by the use of ‘success stories’ as
suggested by Gilholme Herbst et al (1991). The use of role models would also
encourage people to use a hearing aid, as evidenced by the increase in the wearing of
aids following the revelation by President Clinton of his hearing impairment
(Kochkin, 2001). Hetu (1996) also suggests that the visual appearance of hearing aids
should be enhanced so they become a ‘fashion aid’ as happened a few years ago with
spectacles; this would also help to reduce the stigma attached to wearing an aid.


6.9    Early screening
There is some evidence from studies in the UK that early intervention or screening of
the population for hearing loss might lead to an uptake in the acceptance of hearing
aids.

A survey of the pre retirement population in South Wales found that of 662 subjects
aged 50-65 around half reported a hearing disability; of these 7.3% already possessed
a hearing aid (Stephens et al, 1991; Davis et al, 1992). All those reporting a disability
were offered rehabilitation including hearing aids. Twenty three percent of those
reporting hearing problems and found to have a hearing loss of 30 dB or more
accepted an aid and were still using it 6 months later. Furthermore, after 2 years 90%
of the newly fitted remained users and were satisfied with their aids. Acceptance of an
aid was not dependent on sex, social class, hearing level or exposure to occupational
noise, but was found to be more likely by those who complain of both tinnitus and
hearing disability together. However those reporting the greater handicap were more
likely to accept an aid which suggests, as would be expected, that those prepared to
accept an aid are those who are more disturbed by their hearing loss.

In a more recent study (Davis, 2003) 2466 subjects aged 55 to 74 were screened for
hearing loss and those with a worse ear hearing loss of greater than 25 dB were
offered an aid. Forty percent of those offered aids accepted them, whereas normally
only approximately 6% of this age group possess aids although around half have a
hearing loss of over 25 dB.

These studies suggest that active intervention aimed at identifying those who would
benefit from an aid would increase ownership of aids. It is possible that early and
active intervention might help to counter the negative consequences of the stigma
attached to hearing impairment and the wearing of hearing aids.


6.10 Summary
The main points that arise from the research reviewed in this chapter are as follows:

     •   Around 10% of the population of the UK could benefit from a hearing aid
     •   Around 3.5% of the population in the UK and in Denmark own a hearing aid
     •   Around 2.3% of the population in Sweden and Norway own a hearing aid
     •   Around 1% of the population in Finland own a hearing aid
     •   In Europe on average around 2.5% of the population own a hearing aid


97
98


     •   In the UK only around one in three of those who would benefit own a hearing
         aid
     •   In the US only around one in five of those who would benefit own a hearing
         aid
     •   In the UK and US the ratio of those who possess hearing aids to those who
         need them has not changed for 40 years
     •   Revelation of hearing impairment and use of hearing aids by high profile
         figures increases acknowledgement of hearing impairment and ownership of
         aids
     •   Awareness of deterioration of hearing and family pressure increase motivation
         to obtain a hearing aid
     •   Around one third of hearing aids supplied each year are to new users
     •   The age of new users is increasing
     •   Reasons for non-ownership of aids include the belief that hearing loss is not
         severe enough to benefit from an aid; stigma; cost; discomfort; reported poor
         performance of aids
     •   Over 1 in 3 hearing impaired people do not seek help for a hearing loss
     •   There is wide variety in the provision of services and waiting times
     •   People delay seeking help because of association with ageing
     •   Active intervention would increase ownership of aids


6.11 Conclusions
The research reviewed in this chapter shows that there are still many people around
the world who would benefit from a hearing aid but do not own one. There are many
reasons for this, including the cost of aids in some countries, the stigma attached to
wearing a hearing aid, and refusal to acknowledge hearing loss.

It is surprising, particularly in view of the technological advances leading to improved
performance of aids, more in-the-ear aids and smaller, less obvious, aids that the
percentage of hearing impaired people who own an aid has not increased for many
years. This suggests that society in general still has a negative and ignorant view of
hearing impairment, and that the hearing aid industry and the medical profession are
failing to convince both the general public and the hearing impaired population of the
availability and benefits of wearing hearing aids.

Evidence concerning relatively low ownership of hearing aids among those who need
them has been available for many years, yet the situation has not improved. In order
to improve the quality of life of a large number of the population, it is necessary to
address the reasons for the low ownership so that more hearing impaired people can
benefit from the assistance provided by hearing aids.

However, ownership of a hearing aid does not necessarily guarantee that it will be
used. The following chapter discusses issues concerning no, or little, use of aids
among hearing aid owners.


98
99


CHAPTER 7              USE OF HEARING AIDS

7.1    Introduction
The previous chapter discussed the prevalence of hearing aid ownership and non-
ownership among the hearing impaired population, and examined reasons why some
hearing impaired people do not own a hearing aid. This chapter considers the amount
of time hearing aids are used by their owners, and possible reasons why some hearing
aid owners do not use their aids or use them for only a small amount of time.

In considering the research reviewed in this chapter it must be remembered that the
quality, design and performance of hearing aids has changed over the past 40 years.
The earlier papers were concerned predominantly with body worn aids whereas later
papers discuss behind-the-ear and/or in-the-ear aids. There is an additional body of
research in which preferences for different types of aids have been investigated. This
is beyond the scope of this report. However, in this chapter, if these factors impinge
upon the issues being discussed they will be referred to; otherwise papers discussing
solely that aspect of hearing aid use have been omitted from this report.


7.2    Usage of hearing aids
Several studies have reported on the usage of hearing aids, for example in terms of
how often they are worn, or number of hours per day for which they are worn, and
have attempted to relate this to factors such as age or degree of hearing loss. This
section reviews some of the data that has been presented, from which it can be seen
that many hearing aids are used very little or not at all.

An early study into factors affecting hearing aid use was carried out by Surr et al
(1978). The authors cite research carried out in the 1970s which reached contradictory
conclusions regarding the relationship of hearing aid use to age and to severity of
hearing loss. They cite previous research by Ewertsen (1974) in which a follow up
study of 1006 patients found that a greater percentage of patients with severe hearing
loss for speech used their aids always, compared with those with less severe losses.
There was no apparent relationship between usage and age. However, in contrast to
the findings of Ewertson, Surr et al report that Jerger and Hayes (1976) found that the
mean age of dissatisfied users was higher than that of the satisfied group. Consistently
with Ewertson, Kapteyn (1977a, 1977b, 1977c) found no age effect, but he also found
no consistent relationship between hearing loss and use. However, he did find that the
longer it takes to acclimatise to the aid, the lower the daily usage, which suggests that
the longer it takes to adjust to an aid the less likely a patient is to wear it. (It was
reported in Chapter 6 that early intervention increases ownership of aids; these two
aspects may be related in that it is possible that the earlier the intervention the shorter
the adjustment period.) Surr et al themselves surveyed 666 US army members who
wore hearing aids. A difference between this study and others was that the subjects
were, on the whole, younger than those used elsewhere, and also had a wide age range
from the 20s to the 80s, the majority being in their 40s and 50s. The subjects suffered
from predominantly noise induced hearing loss and all had worn their aids for at least
6 months. A variety of aids were in use; no in-the-ear aids were included in the
analysis. The responses of 439 subjects were analysed to investigate use related to
age, to hearing loss, to length of training programme, and in different situations.


99
100


It was found that around 75% of respondents used their hearing aid for at least 50% of
the time, regardless of the type of aid. In examining the relationship between hearing
loss and usage, the authors found that more than 70% of those with normal or mildly
impaired hearing for speech wore their aids always or often; this figure increased to
80% of those with more severe hearing loss for speech. However, when other
audiometric data was examined there was little variation with hearing impairment
across the usage categories. The factor that most strongly correlated with use was
age. Table 7.1 shows the number and average age of subjects within the following
four usage categories:

         Never             Hearing aids used 0% of the time
         Occasionally      Hearing aids used 1% to 50% of the time
         Often             Hearing aids used 51% to 99% of the time
         Always            Hearing aids used 100% of the time

   Table 7.1 Frequency of use of hearing aid compared with age (Surr et al, 1978)

                                                Categories of usage
                                Always          Often      Occasionally       Never
      Number of subjects     95 (22%)       227 (53%)     99 (23%)        9 (2%)
      Mean age               47.3           50.3          55.4            67.0

More detailed analysis of the data by age is shown in Table 7.2 which shows the
usage within different age groups.

             Table 7.2 Hearing aid use of different age groups (Surr et al, 1978)

                         Percentages in different categories of usage        Total
       Age
                Always         Often            Occasionally Never           number
       21-30    30             44               26              0            23
       31-40    31             61               8               0            74
       41-50    26             60               14              0            104
       51-60    15             53               30              2            112
       61-70    16             43               36              5            67
       71-80    21             47               26              6            38
       81-90    0              38               50              12           8

It can be seen from Tables 7.1 and 7.2 that the use of hearing aids among these
subjects decreased with age, Table 7.2 showing a marked drop in use after the age of
50. The authors suggest that this may be due to the high incidence of mild impairment
in this study, possibly resulting in selective hearing aid use after people retire.

The authors also found that the length of training post fitting affected use (as has been
found in subsequent studies, see Section 7.4). Subjects who attended longer training
programmes used their aids more frequently than those who attended a short period of
training. This may have contributed to the higher usage among the younger age
groups as they tended to have received the longer training programmes. However,
when the younger age groups were eliminated from the analysis the length of training
was still found to have a significant effect upon usage.

At around the same time as the study by Surr et al, Thomas and Herbst (1980) carried
out a study of 211 hearing aid owners in the UK to determine whether the


100
101


introduction of behind-the-ear aids improved usage compared with body worn aids.
Their subjects had owned aids for between one and eight years, with an average
period of hearing aid ownership of three years. Nearly half (47%) of their sample had
body worn aids. Table 7.3 shows the amount of time each type of aid was worn.

Table 7.3 Effect of introduction of post-aural (behind-the-ear) aid on usage (Thomas
                                  and Herbst, 1980)

                                          Hearing aid usage
                  Always       Often        Sometimes Rarely             Never
   Body-worn
                  10 (10%)     17 (17%)     21 (21%)      16 (16%)       34 (35%)
   N = 98
   Post-aural
                  42 (38%)     23 (21%)     28 (25%)      13 (12%)       5 (5%)
   N = 111

Table 7.3 shows that post-aural aids were worn very much more than body-worn aids.
Only 5% of post-aural aid owners did not use their aids at all, compared with 35% of
those with body-worn aids. Comparing usage with hearing loss the authors found that
the introduction of post-aural aids had increased hearing aid use dramatically,
especially among those with profound or severe hearing losses. Such people were
twice as likely to wear a post-aural aid as a body-worn aid. However, it can be seen
that, of the whole sample, 32% rarely or never wore their hearing aids, compared with
24% of people wearing their aids occasionally or never in the study by Surr et al
(1978).

There appears to be little other detailed study of hearing aid usage until the work of
Kochkin and others in the 1990s (Kochkin, 2000, 2001, 2002; Arlinger and
Billermark, 1999). Much of this more recent research has focused on determining the
reasons why hearing aids are not used, as discussed in Section 7.5.

Some studies published during the 1990s refer to incidence of non-use or reduced use
of hearing aids. For example, Hallberg (1996) in a discussion of the impact of noise
induced hearing loss (NIHL) on family life in Sweden observes that the use of hearing
aids has a low priority among men with NIHL. In studies by Hallberg only 7% to 26%
of those with moderate to severe hearing loss were found to possess hearing aids, and
only 7% of the men in one study wore aids.

It is possible, as suggested by Surr et al (1978), that as people become older they tend
to use their hearing aids selectively. The Committee on Disabilities of the Group for
the Advancement of Psychiatry (1997), discussing issues relating to deaf and hard-of-
hearing patients, reports that elderly patients use hearing aids inconsistently (for
example, only at work or in social situations). Elderly people interviewed by Davies
et al (2001) reported similar, intermittent, patterns of usage.

A Swedish study carried out by Arlinger and Billermark (1999) found that digital aids
were preferred by owners and used more frequently than analogue aids. Of 29
subjects fitted with digital aids (mean age 65 years) who had previously worn
analogue aids, the average usage was for 11 hours a day, with 20 subjects using their
digital aids for 10 or more hours a day. (Analogue aids had previously been worn for
on average 6 hours per day.)


101
102


In the 2001 survey of hearing aid users carried out by the Australian Office of
Hearing Services (Office of Hearing Services 2001; 2002), 91% of respondents (out
of 1014) reported using their hearing aids on a daily basis (for one or more hours a
day) although use was found to be higher among refitted clients than new clients
(45% of return clients reported using their aids for over 8 hours a days, compared with
19% of new clients). This therefore suggests that 9% of the population who own
hearing aids do not wear them at all. This figure is very much lower than that reported
in other countries. However, at present insufficient information has been acquired on
other aspects of hearing aid provision in Australia to suggest possible reasons for this
difference. It is possible, and to be expected, that only regular wearers responded to
the questionnaire survey.

In the UK it is generally accepted that around one third of hearing aids prescribed on
the National Health Service are never used (NICE, 2000).

The large scale survey by Smeeth et al (2002) of hearing aid ownership and use
among elderly people in the UK found that, of those who owned a hearing aid, 60%
said that they used their aids regularly, thus implying that 40% of the hearing aid
owners in the study did not wear their aids regularly. In comparing the data for men
and women and adjusting for age, it was found that, although women were less likely
than men to own a hearing aid, they were slightly more likely than men to use their
aids regularly

The Marke Trak VI survey, reported by Kochkin (2001) gives data on unused hearing
aids (or ‘in-the-drawer’ aids as they are referred to by Kochkin). Table 7.4 shows the
percentages of aids not used since 1984 (where the data is available), for aids less than
4 years old which Kochkin gives as the effective life of a hearing aid.

  Table 7.4 US data on unused hearing aids since 1984 (data from Kochkin, 2001)

                                       1984   1989    1991   1994   1997   2000
        Percentage of aids not used
        Total                          13.5           12.0   17.9   16.2   11.7
        Aids less than 1 year old                     3.0    3.5    4.6    3.1
        Aids less than 4 years old                    7.7    11.1   8.8    6.8

The numbers of unused aids appear to be much less in the US than in the UK, and to
be decreasing. The difference between the US and UK is again probably due to the
fact that hearing aid owners in the US will probably have paid for their aids, whereas
most UK aids are provided free of charge through the National Health Service (and
may not be the most suitable for a particular patient).

Kochkin does not provide any data on frequency of use of aids for comparison with
other studies. He does explore at length reasons why hearing aids are not used, and
customer satisfaction with aids, as discussed in Section 7.5.

Two surveys carried out in Australia in 2001 and 2002 (Office of Hearing Services
2001; 2002) found an increase in the number of respondents saying that they never
use their aids. In 2002 7% of respondents reported using their aids less than one hour
per week or never whereas in 2001, the figure was 3%. The percentages reporting
never using their aids were 1% in 2001 and 5% in 2002. A possible explanation is


102
103


that there was a higher percentage of new clients in the second survey and they tend to
use hearing aids less than return clients as, on average, they have milder hearing loss
and also they are not so experienced in using the aids (Office of Hearing Services,
2002).

It can be seen from the papers reviewed here that there is considerable variation
between countries and studies in the numbers of hearing aids that are reported as
being not used, and that it is not easy to gain a general picture of the extent of non-
use.


7.3    Hearing aid usage among young people
The only study found which has investigated usage of hearing aids among young
people is that of Gregory et al (1995). Details of this study are included in Chapter 4.
Of the 58 young people interviewed by Gregory, 55 (95%) had hearing aids although
the number who wore them regularly was much less as is shown in Table 7.5.

      Table 7.5 Extent of use of hearing aids by young people (Gregory et al, 1995)

                                           Hearing aid usage
                               Always   Usually Rarely Never          No aid
               Number of
                               32       7          5        11        3
               subjects
               Percentage
                               55       12         9        19        5
               of subjects

It can be seen that almost one third of the young people in this study who possessed
aids used them rarely or not at all. Interestingly in some cases there was a
discrepancy between the reports of the young people themselves regarding their
hearing aid use, and those of their parents. For example, one young person reported
wearing the aid rarely, while the parents claimed the aid was worn all the time;
another young person reported wearing their aid all the time but the parent said it was
rarely worn.

Gregory et al also related the use of hearing aids to severity of hearing loss. Dividing
the usage into two groups – regular (always, usually) and little use (rarely, never, no
aid) – the numbers with varying degrees of hearing loss in each group are as shown in
Table 7.6.

Table 7.6 Hearing aid usage of young people related to hearing loss (Gregory et al,
                                     1995)

                                            Degree of hearing loss
                             Profound        Severe              Moderate/partial
           Regular use       6               20                  13
           Little use        10              5                   4

Table 7.6 shows that the less severe the hearing loss the more likely the young people
are to wear their aids. The use of aids is also related to choice of language, with those
preferring the use of oral language rather than signing making greater use of aids, as


103
104


would be expected. Reasons given by young people for not using aids are discussed
in the next section.


7.4    Reasons for non-use and under-use of hearing aids
While the problems of non-use and under-use of hearing aids have been recognised
and researched for many years, there appears to have been little advance in addressing
many of the issues; as shown in the previous section the use of hearing aids by those
who need them has barely increased over the years. The same reasons have been
repeatedly cited and appear to be well recognised in the literature.

For example, the National Institute for Clinical Excellence (NICE) (2000) list the
following general reasons why in the UK approximately one in three hearing aids is
hardly ever used:

   •   Inadequacy of device
   •   Poor handling skills
   •   Poor initial user information and instruction
   •   Absence of timely follow up to ensure user’s specific needs being met and
       problems resolved
   •   Possibly social stigma and cosmetic problems

The long waiting times at some audiology centres, mentioned in Section 6.6, may also
deter people from seeking help if they are experiencing problems with their aids.

The reasons cited by NICE (2000) for non-use of aids in the UK are paralleled by a
similar list given by Kochkin (2002) following a survey of 3000 hearing aid owners in
the US:

   •   Poor benefit and listening experiences
   •   Inability to hear in noise
   •   Poor fit and comfort
   •   Negative side effects
   •   Price and cost of repairs

Some of these factors are examined in more detail in subsequent sections. The
following section, Section 7.5, summarises surveys which have attempted to quantify
the importance of various factors related to non-use. Sections 7.6 to 7.11 consider
some factors individually.


7.5    Analysis of factors related to non-use
Several studies have sought to examine in detail the reasons why people who own
hearing aids either do not use them at all, or do not use them as often as they might in
order to obtain maximum benefit from the aids. Many of the reasons given are the
same as those given for not seeking help or not owning a hearing aid (see Chapter 6).
The most detailed reports on the causes of non-use of hearing aids are those by Surr et
al (1978), Franks and Beckmann (1985) and those in the Marke Trak series by
Kochkin (1993, 2000, 2001, 2002).


104
105


In their survey of hearing aid users in the US army (see Section 7.2), Surr et al (1978)
asked those who wore their aid less than 50% of the time to indicate the reasons for
the limited use of the aid. A total of 179 reasons were given by 125 patients. The
most common reasons, and percentage of users indicating each one, are listed in Table
7.7.

           Table 7.7 Reasons for reduced hearing aid use (Surr et al, 1978)

                      Reason                   % of respondents
                      Background noise         32
                      Lack of need             31
                      Earmould problems        9
                      Eyeglass problems        6
                      Other (non-specified)    5
                      Not effective            4
                      Cosmetic                 4
                      Too loud                 4
                      Mechanical problems      3
                      Poor quality of sound    2

The fact that 31% of respondents gave ‘lack of need’ as a reason for using their
hearing aid for less than half the time may be due to many subjects having only mild
hearing loss, or being retired. The authors conclude that, for older patients suffering
from presbycusis, psychosocial factors such as need, motivation and length of training
may be more important than audiometric factors in relation to the wearing of aids.

In the study by Franks and Beckmann (1985) (see Section 6.4), a group of subjects
who had rejected their hearing aid after wearing it for at least a month were asked to
indicate the importance of 36 possible reasons for their non-use of the aid. This group
showed consistently negative attitudes to hearing aids compared with other subjects,
for which the authors suggest two possible explanations: the negative attitudes arise
directly as a result of experiences with hearing aids, or people within this group
already have negative psychosocial attitudes which may influence their dissatisfaction
with their hearing aid.

For this group, of the 36 possible reasons the 11 highest ranking are listed below, in
order of importance:

   •   Cost too much
   •   High pressure from dealers
   •   Amplify noise
   •   Dealers use deceptive practices
   •   Dealers not trained
   •   Difficulty manipulating aid
   •   Make sound too loud
   •   Dealers’ interest is only in money
   •   Not instructed in use
   •   Little or no help from aid
   •   Aids only for most severe problems


105
106


It can be seen that four of these reasons relate to dealers in hearing aids. They would
therefore not necessarily be applicable in countries where hearing aids are supplied
free of charge. Such reasons also do not appear in the study by Surr et al (1978), as
their subjects had been provided with their hearing aids by the US Army.

Kochkin (2000), in his detailed study of owners of ‘in-the-drawer’ hearing aids
reported that only 10.6% of these owners are satisfied with their aids; 27.1% are
neutral and 62.3% are dissatisfied. The older the aid the more likely it is to be
unused, with one third of aids 8 years or more old unused.

In examining the reasons for non-use of aids, Kochkin analysed 348 letters from non-
users in which they described in narrative form their hearing aid experiences. The top
eight reasons and percentages of respondents citing each reason, together with some
typical comments quoted in Kochkin’s paper are shown in Table 7.8.

This survey shows that nearly one third of these owners claim to receive no benefit
from the aid. Similar dissatisfaction with performance of aids, in particular increasing
background noise, has been found to be a major cause of non-use in the previous
surveys described above. Kochkin advises that in order to increase benefits of aids
and quality of listening as many consumers as possible should be fitted with advanced
programmable aids.

Table 7.8 Top eight reasons for non-use of hearing aids in survey by Kochkin (2000)

                                             Estimated
                               % of
      Reason                                 no.          Comments
                               respondents
                                             of owners
                                                          Inability to distinguish words
      Poor benefit from HA     29.6          268,510      Amplify everything
                                                          Do not improve hearing
                                                          Increase background noise
      Background
                               25.3          229,407      Everything amplified
      noise/noisy situations
                                                          Cause pain
                                                          Too big
      Fit and comfort          18.7          169,448      Uncomfortable
                                                          Fall out
                                                          Ears hurt
      Negative side effects    10.9          99,062       Itching, sweating ears
                                                          Dizziness, headaches
      Price and cost of                                   Too expensive
                               10.3          93,848
      repairs                                             Not worth cost
                                                          Socially isolated so no longer
      Do not need help         8.0           72,993       need aids
                                                          HL too mild
                                                          Repeated breakdowns
      Hearing aid is broken    7.8           70,386
                                                          Repairs too expensive
                                                          Lack of clarity
      Sound quality is poor    6.3           57,352       Distorted sound
                                                          Hissing

The findings related to noise and sound quality are corroborated by a subsequent
survey of 3000 hearing aid users to determine what improvements they would most
like to see in hearing aids (Kochkin, 2002). It was found that improving speech


106
107


intelligibility in noise was the highest rated improvement wanted, with better sound
quality rated second.

The following sections consider some individual aspects of hearing aids and hearing
aid fitting which may contribute to their non-use.


7.6     Defective aids
A problem that may be the cause of many people ceasing to wear an aid is that
hearing aid components are often defective (Sorri et al, 2001). Sorri et al base this
observation upon the work of Parving et al (1992) and Sibelle and Parving (1994)
who in 1994 published a report of a two year audit of hearing aid quality in Denmark.
They found that 11% of aids were defective at the time of fitting, while many other
aids became defective within two years of fitting. The survey showed that 12% of
behind-the-ear aids became defective within 1 year, while after two years all in-the-
ear aids had become defective and only 33% of them remained intact. Of the defects
30% were due to faults in internal components while over 60% had problems in
external components. Of 4450 people who attended hearing aid services, over 60% of
the visits were due to defective hearing aids. Of these aids, 21% had been used for
less than 1 year; and over 91% for less than 4 years. Overall 8% of aids were
defective within the first year of use although examining specific types of aid, the
defect rates varied from 6.6% to 70.9% in the first year.

These figures are surprisingly high when viewed in light of the percentages of, and
reasons for, non-use discussed in the preceding sections, and the relatively low
citations of poor performance as a reason for non-use. However, they do highlight the
importance of maintaining high standards of quality and robustness of aids in order to
maximise usage.


7.7     Hearing aid preferences
There have been some studies examining individual preferences for type of hearing
aid which have provided contradictory results (Sorri et al, 2001). These studies are
beyond the scope of the current review; however, according to Sorri et al, due to
funding constraints, patients are often not provided with the hearing aid which is most
likely to give them maximum benefit. This could be a contributory factor to people
not wearing aids once they have received them. As Arlinger and Billermark (1999)
showed, see Section 7.2, a change from analogue to digital aids in a group of 29
subjects increased daily use significantly. Robillard and Gillain (1996) and Smeeth et
al (2002) also consider that increased use of in-the-ear and non-linear aids would
encourage higher levels of use among older people. However, it would seem from the
US surveys carried out by Kochkin that overall satisfaction with hearing aids has not
increased in recent years, suggesting that the introduction of digital and
programmable aids has not improved user satisfaction. This may suggest that in fact
the more advanced aids might not encourage higher usage, and that reasons other than
those connected directly to the performance of the hearing aid itself may contribute to
non-use. This issue is explored further in Chapters 8 and 9. Nevertheless, in order to
increase the likelihood of people wearing their aids, individuals should be fitted with
models which they personally find the most comfortable and provide the most benefit
for their particular hearing problem.


107
108


7.8     Hearing aid fitting
Both psychological and practical factors influence the outcome of hearing aid fitting.
The surveys described in Section 7.5 showed that several issues connected to fitting
contribute to the reduced wearing of aids. Inadequate fitting may result in aids being
inconvenient to wear, or fitting incorrectly. In the UK 27% of wearers find them
awkward, uncomfortable or badly fitting (Sorri et al, 2001). Aids may also be
rejected because they are difficult to manipulate (see Section 7.10) and unattractive
(Eriksson-Mangold et al, 1990).

A factor discussed by Eriksson-Mangold et al (1990) which is relevant to the
successful outcome of hearing aid fitting is that of ‘passivity’. Fitting of aids in a
hospital context means that patients feel they have a passive role, accepting help and
care, so that they are not responsible themselves for the outcome. To examine this
aspect, Eriksson-Mangold et al (1990) investigated the benefits of an ‘active fitting’
programme where patients were more actively involved in their hearing aid fitting.
They found that participants in this programme had a more positive approach to their
hearing aids, used their aids more frequently and felt more psychologically secure
with them.

In a trial of early screening and intervention Davis et al (1992) found increased
satisfaction with aids and a low incidence of non-use after fitting. It is possible that
the participants in this study felt more involved in their fitting, leading to a successful
outcome in most cases, as in the study by Eriksson-Mangold et al (1990).

Another aspect of hearing aid fitting which can affect the ultimate success of wearing
an aid is the provision of adequate training in their maintenance and use. Often too
little instruction is provided (Eriksson-Mangold et al, 1990) and this is often cited as a
reason for non-use or reduced use of aids (Franks and Beckmann, 1985; National
Institute for Clinical Excellence, 2000). Surveys such as that by Surr et al (1978)
have shown that those given longer periods of training wear their hearing aids more
often.


7.9    Expectations of hearing aids
It has been suggested in some studies that another factor that may influence the
outcome of hearing aid fitting is that of unrealistic expectations of the use and benefits
of a hearing aid (Eriksson-Mangold et al, 1990; Schum, 1999). If people expect too
much of an aid, they may feel let down and disappointed if it does not perform as well
as expected, which may lead to rejection of the aid.

Cox & Alexander (2000) have recently developed a new scale specifically to
investigate this aspect of hearing aid fitting, the Expected Consequences of Hearing
aid Ownership (ECHO) scale. The scale was initially used with a group of new users
and compared with the views of experienced users to see if the expectations of new
users were unrealistic; and then with a second group to see whether their expectations
affected the eventual outcome of their fitting. The first group were found to expect
more improvements in performance and function, and better service and value than
they were likely to receive. They also did not fully appreciate potential negative issues
such as problems with feedback. There was also a tendency for them to have more
concerns about stigma issues than the experienced users.


108
109


However, in comparing expectations with subsequent satisfaction with aids, only one
aspect of the ECHO scale was related to eventual satisfaction. Those who expected
psychological and psychoacoustic benefits tended to report greater improvement from
their aids. However, there was some evidence that unrealistic advertising of hearing
aids has had a negative impact on patient satisfaction.


7.10      Hearing aid handling
A feature of aids that can be problem, particularly for elderly people, especially those
with large or arthritic fingers, is difficulty in handling them (Salomon et al, 1988;
Barnett, 2002). Ironically, one of the main features of modern aids and the one which
is likely to encourage use, particularly among those who are conscious of a stigma
attached to wearing an aid, is their small size; however this also makes them
increasingly difficult to handle. Small aids also mean small batteries which add to the
difficulties. This problem has been mentioned to the author in interviews with hearing
impaired persons in their 20s and 50s, and was included in the lists of reasons for non-
use given by Franks and Beckmann (1985) and NICE (2000).


7.11 Stigma
Although stigma and negative perceptions of hearing aids play a large role in
affecting the ownership of aids, as discussed in Chapter 6, it does not appear to
feature as a major factor in non-use or reduced use of aids. Once the barrier of
obtaining an aid has been passed, it appears to be more practical matters concerned
with the aid itself – the actual fit of the aid, its ease of use, and performance – that
determine how often it will be used.


7.12 Use of hearing aids by young people
In the only survey of hearing aid use among young people, Gregory et al (1995) asked
their subjects to describe their experiences with aids. Some of the problems described
by the young people could equally well apply to older users, while reasons for non-
use or little use are similar to those given by older users.

Those with mild loss who did not use aids said they heard better without them. Of
those who had aids some had always liked them while others appreciated them more
as they became older. Sometimes aids were used not primarily for listening to speech,
but to maintain contact with their environment, for example for awareness of cars or
of music.

Some young people who wanted to wear their aids experienced difficulty in getting
leads and batteries once they had left school. The distance to a fitting centre
sometimes caused problems as it meant having to take time off work to visit the
centre.

The main reasons given for not wearing aids were similar to those given in the studies
discussed in Section 7.5. For example aids were of no use, were intrusive or
embarrassing, caused headaches, made ‘noises’, or were inconvenient to wear. As a
result of such problems some aids were discarded in adulthood. It was found that the
age at which aids were first worn (less than 1 year to over 2 years) did not affect later


109
110


use. However, the amount they were worn early in life and the person’s attitude to
their aid as a child – whether the aid was tolerated or not – affected the amount it was
worn when older. Nevertheless, some children, even if encouraged to wear aids,
never grew to accept them.


7.13 Other reported problems
Although not related to non-use of aids, two large scale surveys of hearing aid users
across Australia (Dillon et al, 1999; Office of Hearing Services, 2001) reported the
percentages of users reporting specific problems with their aids. In the survey of over
4000 users by Dillon et al subjects reported an average of 0.9 problems per person.
This would suggest that most people experience one problem, with a small number of
subjects experiencing none or more than one. The percentage of respondents in the
two surveys reporting particular problems are shown in Table 7.9.

Table 7.9 Problems with hearing aids reported by subjects in two Australian surveys
              (Dillon et al, 1999; Office of Hearing Services, 2001)

                                                    % reporting problem
                                                   Dillon et al    OHS
                          Problem                    (1999)       (2001)
                                                    N = 4421     N = 1014
                 Quality of own voice sound            27.8         52
                 Whistling (feedback)                  19.1         52
                 Adjusting controls                    13.2         47
                 Shell or mould discomfort             12.4         30
                 Positioning or removing aid            8.7         43*
                 Loud noises unbearable                 6.1         20*
                       *estimated from figure in report

It can be seen that there are large difference between the numbers of people reporting
the various problems in the two surveys. The reason for this are unclear but are
interesting as, as discussed in Section 8.3, there was a very high incidence of user
satisfaction reported in both surveys. In the Office of Hearing Services survey the
numbers given are those reporting the problem some, most or all of the time; perhaps,
due to phrasing or interpretation of the relevant question in the survey by Dillon et al,
only those who experienced problems frequently would have responded. Also, in the
survey by the Office of Hearing Services, under 30% of those who experienced
problems had reported the problems to their practitioner. This may indicate that many
of the reported problems in this survey were not serious, as suggested by the high
overall rate of user satisfaction.


7.14 Summary
The main points from the research reviewed here concerning usage of hearing aids are
as follows:

   •   There is no consistent relationship between amount of use of a hearing aid and
       hearing loss or age
   •   There is some evidence that hearing aid usage declines after the age of 50
   •   Older people tend to use their aids selectively and intermittently


110
111


   •   The longer the training programme the greater the usage of aids
   •   The introduction of behind-the-ear aids increased usage
   •   Digital aids are preferred to analogue aids
   •   There is wide variation in the reported numbers of aids not used in different
       countries
   •   Around one third of hearing aids owned in the UK are not used
   •   Around one third of hearing aids owned by young people in the UK are not
       used
   •   Around 12% of aids owned in the US are not used
   •   There appears to be a high rate of usage of aids in Australia
   •   Reasons for not using aids include poor performance, problems of noise,
       inadequate fitting and training, little benefit, poor fit and discomfort, stigma,
       defective aids, too high expectations, handling difficulties
   •   A high proportion of hearing aid components become defective within a short
       time
   •   Manipulating small hearing aids and their batteries presents problems for some
       people


7.15 Conclusions
The research reviewed in this chapter has shown that, even when people own hearing
aids, the amount of usage varies considerably. The problems of non-use and under-
use of hearing aids have been recognised and researched for many years, and the same
reasons for reduced use have been repeatedly cited in the literature. Yet there appears
to have been little advance in addressing many of the issues, as the use of aids by their
owners has not increased significantly over the years.

Chapter 6 showed that, on average, only 25% of people in Europe who need a hearing
aid own one. If only two thirds of hearing aid owners use their aids then only 1 in 6
people who would benefit from an aid are doing so.

The research highlights the importance of good fitting and acclimatisation to aids.
Without this the user will not appreciate the benefits of wearing aids and may stop
wearing them; good fitting will aid acclimatisation to the aids leading to benefits (see
Chapters 8 and 9) and hence continuing use. It is also important that users have
realistic expectations of the advantages of wearing hearing aids as if expectations are
met continuing use is likely; if a user’s expectations are not realised then the aids may
cease to be used.

Defects in hearing aids may be an important factor in non-use, and also cause anxiety
and frustration for a hearing impaired person. Failure of an aid has serious
consequences for the individual who has to spend time and possibly money in
resolving the problem. There is therefore a need for the reliability of hearing aids to
be as high as possible.

The following two chapters show the high rates of satisfaction among hearing aid
users and the benefit to listening and to overall quality of life that can accrue from
wearing a hearing aid. It is therefore doubly important to address the reasons for


111
112


irregular use to ensure that those who need hearing aids obtain and wear them to
achieve maximum benefit.


112
113


CHAPTER 8               SATISFACTION WITH HEARING AIDS

8.1     Introduction
Over the years there have been many studies into the benefits provided by hearing
aids, in terms both of improvements to listening and more general quality of life
issues. Some studies have investigated overall satisfaction with aids, or satisfaction in
particular situations, whereas more recent studies have used a variety of scales to
assess the impact of hearing aids on various aspects of life which contribute to overall
quality of life.

In assessments of the subjective outcome of hearing aid fitting in the past Cox (2003)
reports that the emphasis has been on the importance of technical characteristics of
outcome measures rather than non-technical issues. However, it is increasingly
recognised that the latter may be more important in terms of the ultimate success of a
hearing aid as the outcome of hearing aid fitting is multidimensional (Cox, 2003;
Gatehouse et al, 2003). As Cox (2003) points out the reason why people seek hearing
aids is because they cannot carry out daily activities as they want or cannot participate
fully in family, social and cultural lives. It is therefore to be expected that the extent to
which the wearing of a hearing aid improves their participation in such activities will
have an important bearing on their overall opinion of the benefits provided. Cox
(2003) lists seven categories of relevant subjective areas in which it is important to
seek outcome data: satisfaction, quality of life, benefit, use, impact on others, activity
limitations, participation restrictions.

All of these issues are addressed in the studies reviewed in this and the following
chapter. Some studies have investigated just one of these aspects while others have
addressed several areas simultaneously. Table 8.1 lists the studies reviewed in this
chapter and in Chapter 9 and indicates which of the following areas each addresses:
satisfaction with aids, general quality of life issues, psychological functioning, social
functioning, physical health, and benefits to listening. It can be seen a) that the
majority of this work has been carried out in the United States, and b) that the
majority of the research has been published since 1995.

While overall satisfaction with hearing aids depends on a range of factors, reported
benefits of hearing aids are also strongly influenced by listeners’ characteristics such
as motivation, expectations and personality, and also the various auditory
environments in which they are normally required to function (Gatehouse et al, 2003).

This chapter reviews studies which have evaluated satisfaction with hearing aids,
either overall or in relation to specific listening environments, and those which assess
the benefits of hearing aids in terms of listening.


113
114


                        Table 8.1 Studies reviewed in Chapters 8 and 9

                                             Satis-           Psych   Social   Listen    Phys     Scales
Authors         Date       Country                      QoL
                                            faction            func    func    benefit   health   used*
Office of
                2001/                                                                             HAUQ
Hearing                    Australia            X        X
                2002                                                                              SADL
Services
Thomas &                                                                                          Sp
                1980       UK                                                    X
Herbst                                                                                            Discrim
Harless &
                1982       USA                                 X                                  TSCS
McConnell
Dye &                                                                                             Many
                1983       USA                                 X
Peak                                                                                              psych
                                                                                                  HHIE
                                                                                                  QDS
Mulrow
                1990a      USA                                 X                                  SPMSQ
et al
                                                                                                  GDS
                                                                                                  SELF
                                                                                                  HHIE
Mulrow                                                                                            QDS
                1990b      USA                  X       X
et al                                                                                             SPMSQ
                                                                                                  GDS
                                                                                                  APHAB
Crandell        1998       USA                                         X?        X         X      SIP
                                                                                                  SF-36
Bridges &                                                                                         GDS
                1998       USA                          X?     X
Bentler                                                                                           SWLS
Robilliard &
                1996       Belgium              X                                X
Gillain
Golabek et
                1988       Poland                                                X
al
Salomon
                1988       Denmark              X
et al
Kochkin &
                2000       USA                          X
Rogin
Kochkin         2002       USA                  X       X
                                                                                                  EQ 5D
Joore et al     2003       Netherlands          X       X               X                         SF 36
                                                                                                  AI
Cox et al       1996                                                             X
Dillon et al    1999       Australia            X                                X                HAUG
Cox et al       1999                                                             X                APHAB

* See text for definitions and descriptions of scales


114
115


8.2     Scales for assessment of hearing aid benefits
In the studies reviewed in this and the following chapter many different scales are
used to assess benefits of, satisfaction with, and various aspects of functioning using
hearing aids. Most of these scales, some of which are described in Appenmdix 3,
have been developed specifically to assess these areas. Much of the work in the
development of these scales has been carried out by Cox and colleagues (Cox and
Rivera, 1992; Cox et al, 1999; Cox and Alexander 1999b, 2000, 2001). Other scales
have been developed by Gatehouse (1999). Joore et al (2003) confirm that many of
the scales used in the assessment of hearing aids are recognised examples of generic
health related quality of life (HRQOL) questionnaires.


8.3     Overall satisfaction with hearing aids
Salomon et al (1988), in a Danish study of the relationship between age and hearing
difficulties asked 25 people aged 70 to 75 years, who had worn hearing aids for
between 4 and 30 years (average 16 years), to rate their overall satisfaction with their
hearing status. The results, related to usage of their aids, are shown in Table 8.2.

 Table 8.2 Numbers of subjects reporting satisfaction with hearing status and use of
                        hearing aids (Salomon et al, 1988)

                                        Hearing aid use (N = 25)
            Hearing status              8-10 hr 1 – 7 hr Less than once
                               Constant
                                        daily    daily     a week
            Very satisfied     4        1        1
            Satisfied          8        2        2
            Less satisfied     1        1        1         2
            Dissatisfied                                   2

From Table 8.2 is can be seen that the majority of subjects (18 out of 25, or 72%)
were satisfied or very satisfied with their aids, and that this was reflected in the
amount of time the aids were used, as would be expected.

A few years later Mulrow et al (1992) carried out a study to examine the long term
benefits of hearing aids for elderly people (average age 72). All 162 subjects were
tested 4 months, 8 months and 12 months after fitting. Use of aids and satisfaction
reported at each test are shown in Table 8.3.

   Table 8.3 Use and satisfaction with hearing aids (data from Mulrow et al, 1992)

                                                    Time after fitting
                                         4 months     8 months        12 months
          % using HAs more than 4
                                         90           83            76
          hours daily
          % ‘very satisfied’ with aids   71           80            70
          % ‘unsatisfied’ with aids      5            5             5
          % ‘uncertain’ or ‘very
                                         0            0             0
          unsatisfied’ with aids

It can be seen that after 12 months of use a small percentage remained unsatisfied
with their aids while the large majority of subjects remained very satisfied.


115
116


The subjects in the study by Mulrow et al are of similar age to those in the study by
Salomon, but have worn hearing aids for a shorter period. This may partly explain
why the percentage of subjects ‘very satisfied’ with their aids is much higher in the
study by Mulrow et al than in the one by Salomon et al. Also, all the subjects in the
Mulrow et al study wore in-the-ear aids. Salomon et al do not specify the types of
aids in their study but it is possible that some body worn aids were in use which may
have affected user satisfaction.

A group of slightly younger patients was studied by Robillard and Gillain (1996) in
the early 1990s. The age range of subjects was predominantly 50 to 90, and most
subjects were fitted with behind-the-ear aids. Approximately half the group had worn
an aid for over a year. Of all subjects, 74% were generally satisfied with their aid,
10% were dissatisfied, and 3% had discarded their aid.

Thus from the three studies above it appears that around 72% of subjects, on average,
were satisfied or very satisfied with their hearing aids.

A higher rate of satisfaction with aids was found in two nationwide studies in
Australia. In a study of over 4000 hearing aid users (Dillon et al, 1999) 58% of
wearers reported being ‘very satisfied’ with their aids and 40% ‘satisfied’. In
addition, 92% reported being ‘very satisfied’ with the hearing aid service, and 8%
‘satisfied’. Another study, of over 1000 Australian users (Office of Hearing Services,
2001) showed similar high levels of satisfaction with both aids and practitioners.
Results of this survey are shown in Table 8.4.

      Table 8.4 Satisfaction of respondents with hearing aids and practitioners in
                     Australia (Office of Hearing Services, 2001)

                                       Percentage of respondents
                                                          Very
               Very satisfied Satisfied     Dissatisfied                 Not reported
                                                          dissatisfied
Hearing aid          43              46            7             2             3
Practitioner         74              23            2             1             1

In the recent study in the Netherlands by Joore et al (2003), 80 first time hearing aid
users aged over 18, the majority of whom were fitted with behind-the-ear aids, were
asked to rate their overall satisfaction with their aids approximately 6 weeks after
fitting and 25 weeks after fitting. Satisfaction was rated on a three point scale: ‘very
satisfied’ (3), ‘moderately satisfied’ (2) and ‘not satisfied’ (1). Overall satisfaction
was high with an average score of 2.44 after 6 weeks and 2.54 after 25 weeks,
implying that more people were ‘very satisfied’ at the second time of testing.

The results of the Australian and Dutch studies, which were carried out around a
decade after the earlier studies, suggest that satisfaction with hearing aids among
users may be increasing.


8.4    Satisfaction and benefits in various listening situations
It is now recognised that the cognitive abilities of listeners influence speech
understanding and the auditory benefits of hearing aids (Gatehouse et al, 2003).


116
117


However, in most of the studies reviewed here this aspect of listening is not
considered.

An early study to assess the benefits of hearing aids was that of Thomas and Herbst
(1980) who used speech discrimination tests with 211 subjects, 47% of whom had
body worn aids, the reminder wearing post aural aids. It was found that 48% of the
sample gained little or no benefit when listening to recorded speech, while more of
those who used their aids ‘always’ or ‘often’ obtained some benefit. Obviously the
amount of use and amount of benefit are related, as will be seen in other studies
discussed. However, what is not known is whether those who obtain most benefit use
their hearing aids more often as a result, or whether greater use of the aids leads the
user to obtain more benefit. The amount of benefit recorded in this study is
comparatively small and it must be noted that the performance of hearing aids in
relation to listening to speech can be assumed to have improved in the 25 years since
this study was carried out.

A detailed study of the benefits of wearing hearing aids in normal living environments
was undertaken by Golabek et al in Poland in 1988. A further aim of this study was to
see if there were significant differences between people who worked and a non-
working group. A total of 169 adults (average age 52) took part in the study, of
whom approximately half were working (average age 40) and half were retired
(average age 65). The questionnaire used was open ended in that subjects were asked
to report all benefits of their hearing aids in order of importance.

The number of benefits reported per patient ranged from one to nine with a mean of
four. The most common, reported by over 20% of subjects are shown in Table 8.5.

Table 8.5 Most common benefits reported by subjects in study by Golabek et al (1988)

                                                     % subjects
                        Benefit
                                                     reporting
                        Conversation at home         78.7
                        TV/radio                     75.1
                        Conversation at work         43.2
                        Meetings                     42.6
                        Shopping                     38.5
                        Traffic                      33.1
                        Church                       29.0
                        Conversation in the street   24.3

Table 8.6 shows the most important benefits together with a weighted score indicating
the importance of the benefit (1=lowest ranking, 5 = highest ranking) for the two
groups of working and non-working subjects separately, indicating where there is a
significant difference between the two groups.


117
118


Table 8.6 Benefits reported by working and retired subjects in study by Golabek et al
                                      (1988)

                                         Working group            Non-working group
                                         (N = 83)                 (N = 86)
                                         No.      %      Score    No.      %       Score
Conversation at work*                    66       79.5   4.7      7        8.1     4.9
Conversation at home                     65       78.3   3.9      68       79.1    3.6
TV and radio                             64       77.1   3.4      63       73.3    3.6
Meetings                                 36       43.4   3.3      36       41.9    2.8
Traffic                                  30       36.1   1.9      26       30.2    2.3
Shopping                                 26       31.3   2.1      39       45.3    3.9
Conversations in the street              20       24.1   2.2      21       24.4    2.2
Cinemas and theatre                      20       24.1   2.1      12       13.9    2.7
Social gatherings                        10       12.0   3.5      15       17.4    3.6
Church*                                  10       12.0   2.8      39       45.3    2.9
Conversation in offices*                 6        7.2    2.3      15       17.4    2.9
Other forms of conversation              3        3.6    4.0
Doorbell, knocking at door               2        2.4    2.5
Embarrassment                            2        2.4    1.5
Conversation with doctors                2        2.4    1.0      10        11.6     2.5
Other listening                          1        1.2    1.0
Telephone bell                           1        1.2    1.0
*significant difference between groups

It can be seen that all subjects reported most benefit from their hearing aids in various
types of conversation, while listening to radio or television, in church, and hearing
traffic and warning signals.

It was further found that the number of reported benefits in both groups was related to
amount of use of the aids (being greater for regular users than for infrequent users)
but not to degree of hearing loss.

Similar benefits were reported by over 130 subjects in a Belgian study by Robillard
and Gillain (1996). The majority of subjects were in the age range 60 to 90, and wore
behind-the-ear aids. The authors also investigated differences between those fitted
with monaural aids and those fitted binaurally. The percentages of subjects reporting
satisfaction with their aids in different listening situations are shown in Table 8.7.

There were no statistically significant differences in satisfaction between subjects
with monaural and binaural aids. It can be seen from Table 8.7 that only about one
third of subjects were satisfied with the performance of their aids in group situations.
Dissatisfaction in this situation was high even among those with binaural aids, of
whom half were dissatisfied in group situations.


118
119


Table 8.7 Percentages of subjects reporting satisfaction in various listening situations
                           (Robillard and Gillain, 1996)

                                                                     % of
               Situation
                                                                   subjects
               In quiet environment                                   93
               In front of television                                 77
               Outdoors                                               69
               Enhanced ability to localize sound                     67
               In large auditorium (conference, church, theatre)      51
               Answering telephone                                    54
               In group situation                                     38


An alternative method of assessing improvements to listening provided by hearing
aids was used by Dillon et al in the large scale survey of hearing aid users in Australia
described earlier (Dillon et al, 1999). In this study the Client Oriented Scale of
Improvement (COSI) was used to investigate the most important listening needs of
hearing aid users, and to quantify both the improvements provided by hearing aids
and the final listening ability when wearing aids in 16 common listening situations.
The assessment was carried out with 1770 subjects approximately 4 weeks after their
hearing aid fitting. Most of the aids fitted were digital programmable aids.

‘Change’ is rated from 1 (worse) to 5 (much better); the ‘listening ability’ scale which
assesses ability to hear in the 16 listening situations also ranges from 1 (hardly ever)
to 5 (almost always).

Table 8.8 shows, for each of the COSI listening situations, the percentage of subjects
identifying it as a need, the average change scores, and the final listening ability
score. The average change scores, and the final listening ability score have been
estimated from histograms in the original paper.

It can be seen from Table 8.8 that the most commonly mentioned need was listening
to TV and/or radio, followed by conversation with one or two in quiet. The greatest
changes in listening occurred for listening to TV/radio, hearing traffic and
conversation with one or two in quiet. These three situations also score highest on the
‘final listening ability’ scale, plus listening in church or a meeting. The overall mean
scores across all subjects and all 16 categories were 4.47 for change and 4.45 for final
listening ability. 89% of subjects reported mean improvement ratings of ‘better’ or
greater and 40% of ‘much better’. It appears from these results that users’ needs are
being satisfied by their hearing aids. Furthermore, the scores are consistent with the
high degree of user satisfaction found in this and the more recent Australian hearing
aid survey (Office of Hearing Services, 2001).


119
120


  Table 8.8 COSI listening situations, needs, change and ability scores (data from
                                Dillon et al, 1999)

        Listening category     % identifying       Change        Final listening
                                   need            score*        ability score*
        Conversation with 1
                                   47.4              4.54             4.48
        or 2 in quiet
        Conversation with 1
                                   24.1              4.32             4.29
        or 2 in noise
        Conversation with
                                   31.9              4.36             4.3
        group in quiet
        Conversation with
                                   23.5              4.21             4.2
        group in noise
        TV/radio at normal
                                   74.8              4.68             4.71
        volume
        Familiar speaker on
                                   10.9              4.31             4.42
        phone
        Unfamiliar speaker
                                    5.0              4.22             4.43
        on phone
        Hear telephone from
                                    9.3              4.6              4.6
        another room
        Hear front doorbell
                                    1.8              4.51             4.31
        or knocker
        Hear traffic                1.5              4.6              4.30
        Increased social
                                    1.8              4.46             4.44
        contact
        Feel embarrassed
                                    2.4              4.36             4.26
        or stupid
        Feel left out               0.4              4.3              4.30
        Feel upset or angry         0.6              3.9              4.11
        Listening in church
                                   19.8              4.51             4.56
        or meeting
        Other                      21.2              4.38             4.31
               *estimated

In the most recent survey discussed in this section, Kochkin (2002), in analysing
responses from nearly 3000 hearing aid users in the US, reports both satisfaction and
dissatisfaction with aids in various listening environments, as shown in Table 8.9.

Kochkin also estimates that 11% of users are dissatisfied in all listening situations
while 35% are satisfied in only 25% or less; and 25% of users are satisfied in over
three quarters of listening situations.

It is difficult to compare directly the results of the various surveys discussed in this
section, owing to the disparate scales used, questions asked, and general
methodologies employed. However, overall it would appear that hearing aids greatly
improve listening for users in the majority of listening situations. In particular, they
improve listening in some of the situations that are regarded as the most important,
such as listening to TV or radio. However, there tends to be a lack of satisfaction
when listening in group situations.


120
121


  Table 8.9 Percentages of users satisfied and dissatisfied with their hearing aids in
               various listening situations (data from Kochkin, 2002)

                                             Percentage of users
                                            Dissatisfied Satisfied
                          One to one             3          87
                      Listening to music         7          72
                              TV                11          68
                       Leisure activities        9          63
                         Small groups           14          62
                           Outdoors             13          59
                              Car               17          54
                      Places of worship         14          54
                          Workplace             11          47
                          Restaurant            25          43
                        Concert/movie           22          42
                          Telephone             30          41
                          Cell phone            30          27
                         Large group            44          26


8.5    Adaptation to hearing aids
Salomon et al (1988) state that habituation towards amplification does not take place.
However, there has been some discussion in the literature as to whether or not benefit
from hearing aids in a noisy environment might increase over the first few months of
use (Cox and Alexander 1992; Cox et al, 1996). An investigation into this aspect of
hearing aid benefit was undertaken by Cox et al (1996) but results were inconclusive.
The authors suggest that apparent increases in benefit after a longer period of time
may be due solely to a progressive decline in unaided hearing.

In a study aimed primarily at investigating the effect of hearing aids on health and
physical functioning, Crandell (1998) also evaluated hearing aid benefit using the
Abbreviated Profile of Hearing Aid Benefit (APHAB) scale (Cox and Alexander,
1995). The subjects were 20 elderly individuals (mean age 75) with mild to severe
hearing loss, all of whom were new hearing aid users. The questionnaire was
administered pre fitting, 3 months and 6 months after fitting. Crandell reports that, 3
months after fitting, the APHAB showed significant improvements with amplification
in three of the four subscales: the Ease of Communication scale (21% improvement),
Background Noise scale (23.1% improvement) and Reverberation scale (13.4%
improvement). He does not however present any results concerning the assessment 6
months after fitting so it is possible that the lack of data concerning the 6 months
assessment shows no further improvement or even a decline in improvement. No
further improvement would be consistent with the findings of Cox and Alexander
(1992) described above.


8.6     Effects of personality on hearing aid assessment
As discussed earlier, it has become increasingly recognised in recent years that
assessment of hearing aids involves many dimensions and that various psychosocial
factors affect the perceived benefit provided by a hearing aid. Cox et al (1999)
investigated the influence of a patient’s personality on their assessment of a hearing
aid, and found several interesting effects. They used the APHAB and three


121
122


psychological tests with 83 subjects aged 60 to 89, most of whom were in their 70s,
and almost all of whom had worn a hearing aid for over a year (25% for over 10
years).

The psychological tests were used to establish extroversion/introversion; anxiety; and
locus of control (that is, a person’s perception of whether what happens to them is due
to their own actions (internal control) or to the actions of others or fate or chance
(external control)).

The results showed that there was a strong relationship between personality and ease
of communication, the more extroverted patients tending to report more hearing aid
benefit in all speech communication situations. Patients with more external locus of
control tended to have more negative reactions to loud environmental sounds, both
with and without amplification.

The attitudes to problems also varied between extroverted and introverted subjects.
There was a tendency for the more extrovert to report more problems when unaided,
and fewer problems when aided, than more introverted subjects.

There was only a limited relationship with anxiety although higher anxiety was
related to more communication difficulties. However, people with external locus
control found environmental sounds more unpleasant both with and without aids.
There was also a significant relationship between age and aversiveness (that is
negative reaction to sound) of amplified sounds – rather unexpectedly, older subjects
reported less unpleasant reactions to amplified sounds than younger subjects. The
authors give possible reasons for this such as older people being fitted with less
powerful aids or having lower expectations than younger patients. Note that, in this
case ‘younger’ refers to people in their 60s as all subjects were over the age of 60.

Gender also had an effect, with men reporting more communication difficulty in noise
than women and greater increase in ‘aversiveness’ after amplification than women.
This may explain the finding by Smeeth et al (2002), discussed in Section 6.2.1, that
men are more likely to own a hearing aid than women but women are more likely than
men to use their aids.

The conclusion of the study by Cox et al (1999) shows that, when using self
assessment tools, it is important to remember that the results will reflect, to some
extent, the psychological characteristics of subjects, independently of the quality and
performance of their hearing aids and hearing aid fitting.


8.7  Summary
The most important points arising from the work discussed in this chapter are
summarised below:

   •   Over 70% of hearing aid wearers are satisfied or very satisfied with their aids
   •   Around 90% of hearing aid wearers in Australia are satisfied or very satisfied
       with their aids
   •   Benefits of hearing aids are influenced by the user’s personality and
       psychological characteristics, and by their cognitive abilities


122
123


   •   The perceived amount of benefit provided by an aid is related to the amount of
       use
   •   The perceived amount of benefit provided by an aid is not related to the degree
       of hearing loss
   •   The most common reported benefits tend to be in conversation in small groups
       and listening to radio or watching TV
   •   The situation in which least benefit is obtained is conversations in groups


8.8      Conclusions
The surveys reviewed in this chapter have found that there is a very high rate of
satisfaction with their aids among hearing aid users, despite the problems with aids
that were discussed in Chapter 7. This suggests that, if only non-owners and non-
users could be persuaded to obtain aids and to use them regularly, they would
perceive significant benefits to their listening in many of their day-to-day activities.
This therefore provides further impetus for increasing the numbers of hearing aid
owners and users around the world.


123
124


CHAPTER 9             IMPACT OF HEARING AIDS ON OVERALL
                      QUALITY OF LIFE

9.1     Introduction
As discussed in Chapter 8, the overall impact of hearing aids on a user is a
multidimensional issue involving many more factors than just improvements in
listening. Many of these factors are, of course, an indirect result of the hearing
benefits described in Chapter 8, but they also reflect improvements in various
physical, social and psychological areas, all of which contribute to the overall quality
of an individual’s life. This chapter reviews papers that have investigated these other
aspects of the benefits of hearing aids. Some papers have considered individual
aspects such as effects of hearing aids on psychological or physical health function,
while others have used several tests simultaneously to examine quality of life issues in
more detail. Also included in this review is the major study carried out in the United
States by the National Council of the Aging in 1998 (National Council on the Aging,
1999; Kochkin and Rogin, 2000).


9.2     Psychological function
Two relatively early papers published in the early 1980s (Harless & McConnell, 1982
and Dye & Peak, 1983) investigated the relationship between various psychological
factors and hearing aid use.

Harless & McConnell (1982) studied the issue of ‘self-concept’, or self-esteem,
among hearing aid users by comparing a group of successful users with a matched
hearing impaired group who had never worn aids. In total 86 subjects took part in the
study, all over the age of sixty (mean age of the two groups was 69 years) and with
mild to moderate hearing loss (average 44 dB). The groups answered two standard
questionnaires on self concept and speech intelligibility, the aided group rating items
on both scales as applicable when wearing their aids. Those with hearing aids were
shown to have overall higher self esteem, scoring higher than the other group on
subscales representing such dimensions as behaviour, self satisfaction and identity.
Consistency of responses was also greater for the group with aids, indicating greater
confidence and stronger self-image. In areas relating to personality such as
maladjustment, personality disorder, and neurosis there was no difference between the
groups. The hearing aid users also perceived themselves to have better communicative
function than the other group. Correlation of the two questionnaires showed that those
with greater communication efficiency had the higher self esteem. However, the
results of this study could imply, as the authors suggest, that those who are willing to
wear a hearing aid have higher self esteem before using aids than non-wearers.

Dye and Peak (1983) took a different approach in exploring the relationship between
severity of hearing loss to psychological functioning pre and post amplification.
They gave 58 male subjects a battery of psychological tests, including assessments of
mood, memory, and paranoia, on the day they were fitted with hearing aids and six
weeks later, the tests being performed while wearing the aids. The subjects were
divided into two groups – those with ‘more’ and ‘less’ severe hearing loss – based
upon hearing thresholds and speech discrimination scores. In almost all tests, the more
severely impaired group performed less well at both times of testing, being less alert


124
125


to information from their environment, less capable of remembering meaningful
information, less capable of learning new tasks, more paranoid and more depressed
than those with less severe hearing loss. Both groups showed improvements in scores
over the six weeks after fitting. However, whereas there were significant differences
between the two groups at fitting, the more severely impaired showed greater
improvements afterwards resulting in no significant difference between the groups
after six weeks. These results show that the use of hearing aids can go some way
towards reversing deterioration in psychological functioning as a result of hearing
impairment. It is therefore important that hearing loss is diagnosed and treated with
hearing aids as soon as possible to prevent further psychological deterioration,
particularly for those with more severe losses.


9.3    Physical health and functioning
A study by Crandell in the mid 1990s aimed to examine the effects of amplification
on physical health status, as few studies in this area had been carried out previously
(Crandell, 1998). Crandell used two scales to assess health status, the Sickness
Impact Profile (SIP), described in Appendix 3, and the Short Form-36 Health Survey
(SF-36).

The SIP is a 146 item standardised questionnaire designed to assess physical and
psychosocial functioning. It consists of 12 subscales, some of which are grouped
together to provide three main scales: physical, psychosocial and overall. The higher
the SIP score, the greater the functional impairment.

The SF-36 is a standardised form consisting of 11 questions. It includes eight multi-
item sub scales (physical functioning, role limitations due to physical and/or
emotional difficulties, social functioning, bodily pain, mental health, vitality, general
health perceptions) each of which contain between two and ten items. The form also
includes a single-item measure of reported health transition. The lower the total SF-36
score, the greater the functional impairment.

There were 20 subjects in Crandell’s study, aged 65 to 91 years (mean 75 years), all
with mild to severe hearing loss and no previous experience of using hearing aids.
The questionnaires were administered to the subjects pre hearing aid fitting, 3 months
after fitting and after 6 months of use. The mean SIP and SF-36 scores are shown in
Table 9.1.

It can be seen that there were significant reductions in SIP scores within three months
of fitting, all three scores showing statistically significant decreases. There were no
further improvements in the following three months. In the first three months there
were improvements in all subscales except those for eating, body care/movement,
ambulation and work. In contrast to the SIP scores there were no statistically
significant differences in the overall SF-36 scores (or in any of the subscales)
although they show a positive trend. There were also no differences in the overall
health transition scale.


125
126


               Table 9.1 Mean SIP and SF-36 scores (Crandell, 1998)

                                                   Hearing aid use
                                     Pre-fitting    3 months         6 months
                     Total           14.8           9.1              8.9
        SIP scale    Physical        15.8           9.9              10.4
                     Psychosocial    21.3           11.8             11.0
       SF-36 scale                   95.2           95.3             97.3

These results suggest that the use of hearing aids can reduce functional health
difficulties in elderly hearing impaired subjects after only three months use, although
there is no further improvement after this time. Crandell purports that the health
improvements occur because of the enhancement in communicative function. He
observes that the SIP assesses behavioural consequences of physical health difficulties
while the SF-36 is more indicative of objective health problems. It could therefore be
that the wearing of hearing aids leads to an improved perception of health, rather than
actual physiological manifestations.


9.4      Overall quality of life
The first major study to investigate the impact of hearing aids on overall quality of
life was carried out by Mulrow and colleagues in the late 1980s (Mulrow et al 1990a,
1990b, 1992). The scales used in this study, which are briefly described in Appendix
3, are listed below.

   •   Hearing Handicap Inventory for the Elderly (HHIE)
       25-item questionnaire scored from 0 to 100 that assesses emotional and social
       effects of hearing loss
   •   Quantified Denver Scale of Communication Function (QDS)
       25-item questionnaire scored from 0 to 100 that assesses perceived
       communication difficulties due to hearing loss
   •   Short Portable Mental Health Status Questionnaire (SPMSQ)
       10-item scale scored from 0 to 10 that assesses cognitive function
   •   Geriatric Depression Scale (GDS)
       15-item scale scored from 0 to 15 that is used to indicate depression
   •   Self Evaluation of life Function (SELF)
       54-item global scale scored from 54 to 216 that assesses six areas of
       functioning: physical disability, social satisfaction, symptoms of aging,
       depression, self-esteem, personal control.

For all the scales used, a higher score indicates greater dysfunction. The HHIE and
QDS scales are specific to hearing loss, while the other scales are generic quality of
life measures.

The initial study (Mulrow et al 1990a) involved a group of nearly 200 hearing
impaired subjects aged 64 and over (mean age 72), none of whom were hearing aid
users. The subjects were divided into two groups, one of which was fitted with
hearing aid immediately, while the other group was placed on a waiting list and fitted
with an aid after 4 months. The battery of tests was administered to all subjects at the
start of the project (baseline), and after 4 months. This enabled the test scores of the
group with hearing aids to be evaluated 4 months after fitting, and to be compared


126
127


with a matched control group who were not wearing hearing aids. Table 9.2 shows
the scores of both groups at baseline and after 4 months.

Table 9.2 Quality of life scores for group wearing hearing aids (HA) and waiting list
          group (WL) at baseline and after 4 months (Mulrow et al, 1990a)

                              Baseline                 After 4 months
                       HA group    WL group       HA group      WL group
             HHIE      48.7        51.2           14.7          51.2
             QDS       58.7        61.0           35.7          62.2
             SPMSQ     0.47        0.18           0.29          0.28
             GDS       3.1         3.5            2.6           3.8
             SELF      92.7        95.6           92.0          96.8

There were no statistically significant differences between groups at baseline on any
of the quality of life measures except the mental health status questionnaire (the
hearing aid group being slightly worse).

The table shows that, while there was no change in the quality of life measures for the
group without hearing aids, the scores on all scales for the group with hearing aids
improved after four months of wearing aids.

The HHIE and QDS scales were also administered to both groups six weeks after
fitting. Whereas at baseline there was no difference in the two scores between the
groups, after six weeks the group with aids had scores similar to those at the four
month testing, while the scores for the other group remained roughly constant
throughout the four month period. This shows that improvements occurred in the first
six weeks of use, after which there was no further change.

Family members in 162 cases were also asked to assess improvements in social and
communication function after six weeks. Marked improvements were reported by the
subjects with hearing aids and their families, compared with the waiting list group.

This study therefore showed that hearing aids can reverse social, emotional and
communication dysfunctions caused by hearing impairment, and lead to
improvements in cognition and mood. Furthermore, the benefits are experienced as
early as six weeks after fitting of aids.

At the end of the first project subjects in the waiting list group were fitted with aids
and all subjects, where possible, were followed up four months, eight months and
twelve months after fitting (Mulrow et al 1992). All tests except the SELF scale were
used at each assessment. The scores for all 162 subjects who completed all tests are
shown in Table 9.3.

  Table 9.3 Quality of life scores for subjects wearing hearing aids at intervals after
                               fitting (Mulrow et al, 1992)

                        Baseline      4 months     8 months     12 months
            HHIE        50.6          21.3         20.6         23.3
            QDS         60.8          41.9         40.3         39.9
            SPMSQ       0.4           0.3          0.3          0.4
            GDS         3.5           2.8          2.8          2.7


127
128


The table shows statistically significant improvements in all measures from baseline
to four months, the greatest improvements being for the social, emotional and
communication measures (HHIE, QDS, GDS). The scores remain approximately
stable for the rest of the period of testing. Thus it appears that psychosocial
improvements to quality of life occur in the first few months after being fitted with
hearing aids, and are sustained over a one year period. The authors do comment that,
as their subjects were elderly and retired, the findings may not be generally applicable
to other populations of hearing aid users. Nevertheless the results do strongly suggest
that hearing aids play an important role in improving the quality of life of elderly
hearing impaired individuals.

Bridges and Bentler (1998) attempted to examine not only the effects of hearing aids
on well being and satisfaction with life, but also whether their impact was related to
the amount of use. The quality of life assessment they used was shorter than in other
studies, consisting of the Geriatric Depression Scale (GDS) (as in the studies by
Mulrow et al described above) and the Satisfaction with Life Scale (SWLS).

The version of the GDS used by Bridges and Bentler consisted of 30 items, a score
above 11-15 suggesting a need for further evaluation for clinical depression. The
SWLS is a 5-item self-report questionnaire which indicates subjective well being.
The assessment is based on an overall judgement of life, rather than specific areas or
points in time. Each item is scored from 1 (strongly disagree) to 7 (strongly agree) so
that higher scores indicate greater satisfaction with life. The average score of elderly
people completing the SWLS is typically 25.8.

Responses of 251 elderly people (mean age 74.2 years) were analysed, just over half
the group (51.4%) having a hearing loss although only 29.5% said they had ever worn
an aid. Of those who had ever worn an aid around 73% reported successful use.

Table 9.4 shows the ages and quality of life scores of various categories of subjects.

 Table 9.4 Ages, GDS and SWLS scores related to hearing loss and hearing aid use
                          (Bridges and Bentler, 1998)

                                                    Mean GDS       Mean SWLS
        Subject groups               Mean age
                                                      score          score
        All subjects                    74.2           5.4            25.3
        With hearing loss               76.6           6.1            25.0
        No hearing loss                 71.8           4.6            25.6
        Has worn hearing aid            77.4           5.8            25.3
        Has not worn hearing aid        72.9           5.2            25.2
        Has worn aid but does not
                                        76.3            7.8            23.4
        wear successfully now
        Now wears aid
                                        77.9            5.1            26.1
        successfully
        Now wears aid but not
                                        73.3            5.5            25.0
        successfully

The authors found, as in other studies of the effects of hearing loss on quality of life,
that subjects with hearing loss were in general older, suffered more depression and
were slightly less satisfied with life (although this difference was not statistically
significant) than those without. Subjects who had worn hearing aids were older and


128
129


scored higher on both scales (not significantly) than those who had not. Among those
who had previously worn an aid there was significantly less depression for those who
reported success than for those who did not. Successful users, both past and current,
were more satisfied with life than unsuccessful users and tended to have less
depression. However, it should be noted that, although there was some evidence of a
relationship between hearing aid use and depression, all the GDS scores were well
below the levels indicating serious depression.


9.5     Improvements in particular aspects of quality of life
Some surveys have investigated how use of hearing aids has had an impact on
particular areas of day to day life which affect overall quality of life.

Kochkin (2002), in reporting results of the MarkeTrak VI survey, found that, of 1764
hearing aids users, 66% reported improvement in their overall quality of life due to
their hearing aids. The percentages reporting improvements in specific areas are
shown in Table 9.5.

The table shows that hearing aids have had beneficial effects in several areas, the
most reported improvements being to users’ social lives and ability to join in groups,
and on family relationships. These are areas that are particularly adversely affected
by hearing loss, as reported in Chapter 5.

  Table 9.6 Percentages of hearing aid wearers reporting improvements in various
                     aspects of quality of life (Kochkin, 2002)

                                                     % reporting
                        Area
                                                    improvement
                        Social life                      51
                        Ability to join in groups        50
                        Relationships at home            49
                        Feelings about self              46
                        Confidence in self               43
                        Sense of safety                  43
                        Relationships at work            39
                        Sense of independence            39
                        Mental/emotional health          36
                        Mental ability                   31
                        Physical health                  22

Two major surveys investigating similar issues in detail were carried out in Australia
in 2001 (Office of Hearing Services, 2001) and in the US in 1998 (Kochkin and
Rogin, 2000), for the National Council on the Aging (NCOA).

Both studies were large, the Australian study involving over 1000 respondents and the
American one almost 4000, and both were nationwide. In both studies the average
age of subjects was in the early 70s. A major difference between the two studies is
that the Australian study consisted of a survey of hearing aid users only, whereas the
American study involved hearing aid users, their families, and a control group of
hearing impaired non-users of aids.


129
130


9.5.1 Australian Office of Hearing Services survey
The large scale study of approximately 1000 hearing aid users in Australia used the
Satisfaction with Amplification in Daily Life (SADL) scale devised by Cox and
Alexander (1999; 2001) to measure the overall satisfaction of people with their
hearing aids. The scale is based upon 15 questions related to four different areas:
positive effect, service and cost, negative features and personal image. Responses to
questions within these categories are based upon a seven point scale, from 'not at all'
to 'tremendously'. Scores (from 1 to 7) are calculated for each of the four domains and
an overall global score is also calculated. In the Australian study the question on cost
was omitted, as recommended by Cox and Alexander (1999), as it was not relevant.

The domain and global scores are shown in Table 9.7 where they are compared with
US norms published by Cox and Alexander (1999). (The numbers are the numbers of
respondents with valid scores for each subscale.)

      Table 9.7 Comparison of Australian and US SADL scores (Office of Hearing
                     Services, 2001; Cox and Alexander, 1999)

                                    Australia (2001)      USA (1999)
                                   Number Mean          Number Mean
                 Global              813       5.27       44      4.9
                 Positive effect     953        4.98      257     4.9
                 Service             835        5.7       101     5.4
                 Negative features   940       4.74       256     3.6
                 Personal image      953       5.86       103     5.6

It can be seen that in the Australian survey respondents reported relatively high levels
of satisfaction in all areas, with higher levels of satisfaction in all domains than the
US figures.

The domain and global scores in the Australian study were analysed with reference to
hearing loss, age, and experience with aids. The mean global score was found to
increase with hearing loss up to 75 dB HL, when a slight decrease was observed. This
suggests that satisfaction with hearing aids is higher the greater the hearing loss,
except for those with severe hearing loss. Return clients were found to have slightly
higher SADL scores in all areas than new clients; this is reported to possibly reflect
greater familiarity of return clients with their hearing aids. There was relatively little
difference in the global score across the age groups although the score for the younger
age group (21 to 54 years) was very slightly lower than that for the higher age groups
(5.1 compared with 5.3). This difference is mainly due to slightly lower scores for
'personal image’ and ‘negative features’ among the lower age group.

The percentages of respondents giving each score for each question are shown in
Table 9.8. It can be seen that in all areas the majority of respondents are
‘considerably’, ‘greatly’ or ‘tremendously’ satisfied with their aids and the impact on
their lives.

9.5.2 US National Council on the Aging survey
This American study (Kochkin and Rogin, 2000) comprised a very extensive
investigation into the impact of hearing aids on physical, emotional, mental and social
well-being. In total nearly 4000 people were surveyed, 2069 hearing impaired


130
131


   individuals from across the United States and 1710 of their family members. In the
   analysis presented by Kochkin and Rogin (2000) five categories of hearing loss are
   used. Matched groups of hearing impaired users and non-users in each category were
   identified. The paper reports and analyses many of the effects of hearing loss,
   comparing users and non-users of hearing aids, and also analyses the responses of
   family members. Hearing impaired respondents completed questionnaires consisting
   of over 300 questions while the questionnaires of the family members comprised 150
   questions.

     Table 9.8 Responses to all questions on SADL scale (data from Office of Hearing
                                      Services, 2001)

                                                               Response
                                       Not at A      Some- Med- Consid         Tremen- Not
                                                                       Greatly
                                       all    little what ium -rably           dously stated
                  Aids help
                                         2     5    6     12    30      23      16      6
                  understanding
                  Purchase was in
                                         2     4    5     4     19      27      35      5
                  best interests
                  Aids reduce asking
Positive effect                          7    11    10    8     26      22       9      7
                  for repetition
                  Aids worth trouble     4     4    4     5     19      27      32      5
                  Aids improve self
                                        13    10    9     8     18      21      14      7
                  confidence
                  Natural sound          2     4    7     26    25      19       9      10
                  Competence of
                                         1     0    1     2     13      25      52      6
                  provider
Service & cost
                  Dependability of
                                         9     4    3     7     17      26      19      15
                  aids
                  Pick up sounds        26    23    16    7      9      7        4       7
                  Feedback              44    16    10    6      6      4        3      11
Negative features
                  Help with
                                        26    11    6     13    13      11       4      17
                  telephones
                  Seem less capable
                                        76     7    4     2      2      1        0      8
                  with aids
Personal image    Others notice loss
                                        48    16    10    6      5      4        2      9
                  when wearing aids
                  Appearance of aid      5     4    5     11    19      30      18      7

   Hearing ability was self assessed using the five minute hearing test of the American
   Academy of Otolaryngology-Head and Neck Surgery, which has been shown to be
   significantly correlated with standard audiological measures of hearing. Based upon
   these subjective measures of hearing, subjects were divided into 5 quintiles from
   Quintile 1 representing the 20% of subjects with the least severe hearing loss to
   Quintile 5 consisting of the 20% of subjects with the most severe loss. The categories
   correspond to mild/moderate; moderate; moderate/severe; severe; and
   severe/profound hearing loss.

   The numbers and the average ages of users and non-users in each quintile are shown
   in Table 9.9.


   131
132


Table 9.9 Numbers and ages of subjects in NCOA survey (Kochkin and Rogin, 2000)

                      Quintile 1    Quintile 2    Quintile 3    Quintile 4    Quintile 5
                            Non           Non           Non           Non           Non
                     User          User          User          User          User
                            user          user          user          user          user
No. HI subjects       74     336   147     247   208     226   281     136   327     86
No. family members    63     253   125     207   168     184   237     122   280     71
Age of HI subjects   75.2 70.4     73.6 71.3     72.9 71.7     72.6 72.5     74.3 72.9

Hearing aid users and non-users were compared across the hearing categories in the
following areas: activity level (participation in solitary and social activities);
interpersonal relationships; social effects (including stigma, over compensation for
hearing loss, difficulty in communication; sociability); emotional effects (including
anger and frustration, anxiety, emotional instability, denial); personality assessment
(including cognitive state, introversion, locus of control); and health impact (including
arthritis, heart problems, high blood pressure). Respondents and their families were
also asked to rate changes which they believed were due to using hearing aids in 16
areas of their lives.

Key results from the study are summarised below.

Activity level
Participation in activities was assessed by asking how many times a month subjects
engaged in 13 different activities, six of which were solitary (eg reading, gardening)
while seven involved others (eg attending church or sports). There was little
difference between users and non-users in participation in solitary activities.
However, users were more likely to engage in activities involving other people. Non-
users with severe hearing loss participated least in all social activities specified.

Interpersonal relationships
Personal relationships were assessed by 12 questions concerning quality of
relationships within the family (eg how much can you relax around them) and 12
concerning negativity (eg arguments, criticism) in the relationships. For both groups
interpersonal warmth declined as hearing loss got worse, but in each hearing loss
category users had greater warmth in relationships than non-users. In all hearing loss
categories hearing aid users showed less negativity than non-users, although the
differences were not significant among those with more severe loss.

Social effects
The social impact of hearing loss and hearing aid use was assessed by 47 items in the
survey. Among non-users stigma increased across the hearing loss quintiles while it
was significantly lower and relatively constant among users. The authors suggest that
this could be due to hearing aid users having resolved their concerns about the stigma
attached to hearing aids. The high stigma scores for non-users are likely to be a reason
why they do not use aids.

As hearing loss increases both groups compensate for their loss, for example by lip
reading or attempting to conceal their impairment, and the extent to which this occurs
increases with the severity of the loss. However, in all hearing loss categories non-
users compensated significantly more than users. Safety concerns increased as
hearing loss increased for all respondents. However, in the three lower hearing loss


132
133


groups users showed greater concerns with safety than non-users, whereas there was
no difference between the users and non-users with more severe hearing loss. This
may reflect the personality differences between those who do and do not wear aids for
milder loss, or may indicate that users tend to have experiences that make them worry
about safety; alternatively it could reflect the reasons why some people choose to
wear hearing aids in the first place.

Sociability was evaluated by assessing phone contact and meetings with family and
friends and showed little difference between the two groups. Hearing aid use also
appeared not to affect issues such as negative effects on the families of hearing
impaired people, adapting to the individual’s hearing loss, and rejection of, or
withdrawal by, the hearing impaired person.

Emotional effects
Emotional effects were assessed by 80 items in the questionnaire. Many aspects of
emotional life were found to be improved by the wearing of hearing aids in most of
the hearing loss categories, including anger (less anger and frustration displayed by
users), depression (fewer symptoms of depression among users), anxiety (fewer
symptoms of anxiety among users) paranoia (fewer feelings of paranoia among users)
and phobias (users less likely to exhibit social phobias). Reduction in anxiety and
phobias with hearing aids was more pronounced among the subjects with the most
severe hearing impairment. Furthermore, the survey showed that, among both users
and non-users, emotional instability, anger, depression and paranoia all increased with
the severity of the hearing loss. Denial of hearing loss was very much more prevalent
among non-users than users, as would be expected, but decreased with increased
severity of hearing loss.

Emotional factors that were not affected by hearing aids included sense of
independence, experience of traumas and overall satisfaction with life. This latter
finding is surprising in view of the other studies, discussed above, in which hearing
aids were found to improve satisfaction with life. However, it is not known how the
questions relating to this aspect were phrased and scored, so it is possible that it does
not measure the same characteristic as in the previous studies.

Personality
In addition to personality traits assessed by the scales on emotional effects, 79 further
items were used to assess personality. Family members were of the view that the
hearing impaired individual’s cognitive state decreased with increased hearing loss.
However, those without aids were perceived by their families to be more confused,
disorientated, arrogant or inattentive than hearing aid users. Family perceptions of
introversion were also related to hearing loss, those with greater losses being more
introverted than the less severely impaired, although users of hearing aids were
perceived to be less introverted than non-users.

Health
Health status was assessed by six questions, by asking respondents to indicate
whether they suffered from specific health problems, and by overall assessments of
health. In every hearing category users scored higher on the overall assessment of
health than non- users, although for both groups overall health scores decreased with
increased hearing loss.


133
134


In most hearing categories there was higher incidence of arthritis, high blood pressure
and heart problems among non-users than users of hearing aids, although this was not
consistent for all conditions across all categories. The differences could reflect a
tendency for people who are visiting a doctor or hospital for some condition other
than hearing impairment to have their loss diagnosed and treated.

Perceived changes in life due to hearing aid use
The percentages of users and their families reporting improvements in various aspects
of their lives, with the users divided into groups of ‘milder’ and ‘more severe’ loss are
shown in Table 9.10. The numbers are those who rated the improvement due to
hearing aids to be between ‘somewhat’ and ‘a lot’ better.

      Table 9.10 Percentages of users and family members reporting improvements

                                          Percentages reporting improvement
                                       All           Milder loss     More severe loss
                                  Users Family    Users Family       Users Family
      Relationships at home         56     66       44        59       60       68
      Feelings about self           50     60       40        54       53       61
      Life overall                  48     62       33        53       53       64
      Relations with children
                                   40       52       28       44       43       53
      and grandchildren
      Self-confidence              39       46       28       35       42       48
      Mental health                36       39       29       37       38       35
      Willing to participate in
                                   34       44       23       33       37       47
      group activities
      Sense of
                                   34       39       27       30       36       41
      independence
      Sense of safety              34       37       25       32       37       38
      Ability to play
                                   31       47       25       39       33       49
      card/board games
      Social life                  34       41       27      28        36      45
      Physical health              21       24       21      21        21      25
      Dependence on others         22       31       17      26        24      32
      Relations at work            26       43       19      37        28      45
      Ability to play sports       7        10       8       11         7       9
      Sex life                     8        N/A      4       N/A        9      N/A

When the data for each hearing loss quartile is examined it can be seen that, in most
categories, there is a consistent increase in the percentage reporting improvement as
the hearing loss increases. This is reflected in the higher scores for those with more
severe loss in every category shown in Table 9.10. The most striking improvements
were among those with the most severe hearing loss; for quintile 5 the top six
categories in Table 9.10 were rated as improved by at least 50% of users, and 10
categories by at least 50% of family members.

It can be seen from the table that people with mild or severe hearing loss report
significant improvements in many aspects of their lives due to the wearing of hearing
aids. The most widely reported improvements were in family relationships, self
esteem, mental health, and life overall,

Overall, the results of this important study show that the wearing of hearing aids has a
beneficial impact on social, emotional, psychological and physical well being. It is


134
135


not possible to directly attribute the beneficial effects to the wearing of hearing aids; it
may be that hearing aids are sought by the more well balanced, healthy and
emotionally stable members of the hearing impaired community. Nevertheless, the
results are consistent with those of the smaller studies described above and provide
powerful evidence that hearing aids are associated with improvements in many areas
which contribute to the quality of life.


9.6    Summary
From the studies reviewed in this chapter the key points regarding the impact of
hearing aids on quality of life, together with their sources, are summarised below.

   •   Hearing impaired people with aids have greater self confidence, stronger self-
       image and better communicative function resulting in overall higher self
       esteem than those without aids (Harless and McConnell, 1982).
   •   Among elderly hearing impaired people there are no differences in personality
       between hearing aid users and non-users (Dye and Peak, 1983).
   •   Hearing aids help to reduce deterioration in psychological functioning as a
       result of hearing impairment (Dye and Peak, 1983).
   •   Hearing aids help to reduce functional health difficulties in elderly hearing
       impaired subjects, improvements taking place in the first three months of use
       (Crandell, 1998).
   •   Hearing aids can reverse social, emotional and communication dysfunctions
       caused by hearing impairment (Mulrow et al, 1990a).
   •   Psychosocial improvements to quality of life occur in the first few weeks after
       being fitted with hearing aids, and are sustained over a one year period
       (Mulrow et al, 1990a, 1990b).
   •   Successful hearing aid users are more satisfied with life than unsuccessful
       users and tend to have less depression (Bridges and Bentler, 1998).
   •   Hearing aids improve overall quality of life for most users (Kochkin, 2002).
   •   The areas where hearing aids have the most beneficial effects are in users’
       social lives and taking part in group activities, and family relationships
       (Kochkin, 2002).
   •   The majority of hearing aid users in Australia are very satisfied with their aids
       and the impact they have on their lives (Office of Hearing Services, 2001).
   •   Hearing aid users in Australia exhibit higher levels of satisfaction with quality
       of life than those in the US (Office of Hearing Services, 2001).
   •   Satisfaction with hearing aids is higher the greater the hearing loss, except for
       those with severe hearing loss (Office of Hearing Services, 2001).
   •   Satisfaction with hearing aids does not depend on age (Office of Hearing
       Services, 2001).
   •   Hearing aid users are more likely than non-users to engage in activities
       involving other people (Kochkin and Rogin, 2000).
   •   Hearing aid users have greater warmth and less negativity in personal
       relationships than non-users (Kochkin and Rogin, 2000).
   •   Perceptions of stigma attached to wearing hearing aids are higher among non-
       users than users of hearing aids (Kochkin and Rogin, 2000).
   •   Non-users of hearing aids are more likely to disguise their hearing loss than
       users (Kochkin and Rogin, 2000).


135
136


   •   Hearing aid users are more concerned about safety than non-users (Kochkin
       and Rogin, 2000).
   •   Hearing aids improve most aspects of emotional life (Kochkin and Rogin,
       2000).
   •   Denial of hearing loss is more prevalent among non-users than users of
       hearing aids (Kochkin and Rogin, 2000).
   •   Hearing aid users are perceived by their families to have better cognitive
       functioning than non-users and to be less introverted (Kochkin and Rogin,
       2000).
   •   Hearing aid users have greater overall health status than non-users (Kochkin
       and Rogin, 2000).
   •   Benefits to day to day life as a result of wearing hearing aids, in particular
       improvements in family relationships, self esteem, mental health and overall,
       are greatest among those with the most severe hearing loss (Kochkin and
       Rogin, 2000).


9.7    Conclusions
This chapter has shown that there is overwhelming evidence that the use of hearing
aids causes significant improvement to the quality of life of hearing impaired people.

The use of hearing aids benefits many aspects of people’s lives, having a positive
effect upon their social, emotional, psychological and physical well being, and many
of their day to day activities. In most areas the benefits occur early on in the wearing
of aids, in some cases within a few weeks of fitting, and are then sustained throughout
the period of wearing aids.

The outstanding aspect of the research in this area is that the results of all the different
studies are remarkably consistent. This is despite the many differences in
methodologies employed, such as sizes and types of subject groups, different
assessment techniques and scales, use of subjective and objective data, and
comparisons with control groups in some studies and not in others.

However, it must be noted that almost all the studies concerned groups of elderly
hearing aid users; as in the previous chapters, there is a notable lack of evidence
concerning the use and impact of hearing aids on younger age groups. This is likely
to be a reason for the overwhelming consistency of results between studies. In view
of the increasing prevalence of hearing impairment among younger age groups, it is
essential that this area is addressed and that similar research to that described in this
chapter is carried out with younger subjects. There has been much discussion in
earlier chapters about the stigma attached to hearing impairment because of its
association with ageing. The hearing research community itself and the hearing aid
industry are in some ways perpetuating this perception through failing to address the
concerns of younger people; in reviewing the literature the impression obtained is that
hearing loss is an impairment experienced by only elderly individuals.


136
137


CHAPTER 10             STUDIES  OF                COSTS           OF       HEARING
                       IMPAIRMENT

10.1 Introduction
This chapter reviews studies of the costs of hearing impairment that may be relevant
to the evaluation of the societal costs in Europe of hearing impairment. No
comprehensive studies evaluating the costs of hearing loss in general have been
carried out. The paucity of information on the costs of hearing impairment is
commented upon in several of the papers that have been reviewed (Mohr el al, 2000b;
Joore et al, 2003).

Thus no papers have been found that are directly applicable to the current project but
within the few published papers on costs, there are some concepts and methods that
may be applicable to the evaluation of the costs of hearing impairment in general. In
this chapter different methods used in the studies reviewed are outlined, and the
studies of interest described.


10.2 Methods of evaluating the costs of hearing impairment and interventions
Although there is very little work on the costs of hearing impairment in general, there
is a relatively large body of literature concerning the cost effectiveness of cochlear
implants. This is usually evaluated using a method of cost benefit analysis that could
possibly be adapted to the evaluation of hearing loss in general (see reviews in Cheng
and Niparko, 1999; Niparko et al, 2000; Wong et al, 2000). Further studies have
attempted to cost other aspects of deafness (Mohr el al, 2000b; Ruben, 2001; Keren et
al, 2002; Joore et al, 2003). However, the most detailed and rigorous of these studies
is concerned only with the costs of severe to profound deafness (Mohr el al, 2000b),
although it suggests a possible approach to the evaluation of the socio-economic costs
of less severe hearing loss. Another report which suggests a method of evaluating
hearing loss gives an evaluation of the costs to the UK of new noise at work
legislation (Health and Safety Executive, 2003). It is possible that some of the
concepts and methods used in these studies may be applicable to the evaluation of the
costs of hearing impairment in general.

10.2.1 Cost utility analysis
A method that has commonly been used in the past ten years for evaluating the cost
effectiveness of cochlear implants is that of cost utility analysis. This method is
increasingly used for evaluating and comparing the societal costs of various medical
interventions. It is particularly appropriate for evaluating interventions which have
little effect upon survival or longevity, but enhance the quality of life following the
intervention.

Cost utility analysis is based upon the concepts of health utility and quality adjusted
life years (QALYs). Health utility is a factor between 0 and 1 which represents a
subjective evaluation of a person’s quality or life or state of health. On the health
utility scale 0 corresponds to death and 1 to perfect health. QALYs are calculated as
the number of years in a particular health state, multiplied by the health utility of that
state. Thus, for example, ten years at a health utility of 0.5 or five years at a health
utility of 1.00 would both be equivalent to five QALYs.


137
138


The cost utility of an intervention is evaluated by calculating the cost utility ratio, that
is the ratio of the total costs associated with the intervention to the net benefit in
QALYs arising from the intervention. In the case of cochlear implants the total costs
include costs of diagnosis and evaluation, surgery, rehabilitation, maintenance of the
implants etc., while the benefits (expressed as QALYs) may reflect changes in
physical function, bodily discomfort, social function and mental health.

Improvement in quality of life resulting from an intervention decreases the cost
incurred per QALY. The lower the cost per QALY, or the greater the number of
QALYs obtained at a given cost, the greater the cost effectiveness of the treatment.

In the studies of cost utility analysis of cochlear implants described below, various
recognised and standardised methods have been used to evaluate the QALYs provided
by implants. To obtain the health utility indices associated with health states pre and
post implantation, health related questionnaires or visual analogue scales are generally
used. These may result directly in a health utility index between 0 and 1, or in a score
which is then translated into the equivalent value on the health utility scale.

The concept in these studies of assigning health utility indices to the quality of life
before and after implantation suggests a possible method of evaluating hearing loss.
This idea is explored further in Chapter 12, where the method is used in a calculation
of the costs of hearing impairment in Europe.

10.2.2 Monetary costings
Other studies have provided direct monetary values to various socio-economic costs
of hearing impairment, for example loss of earnings and medical costs, either on an
individual or total population basis. However, these studies do not include any
evaluation of the social and psychological aspects of hearing impairment.

In assigning monetary values the costs obtained from previous studies or reports are
generally updated to the current year using some recognised indicator such as (in the
USA) increase in Consumer Price Index over the intervening period. Where lifetime
costs are considered, future costs are discounted to the ‘net present value’, again using
a recognised factor, for example the inflation adjusted return on long term investment
bonds.

10.2.3 Incidence/prevalence based studies
Two different approaches, either incidence or prevalence based, can be taken in
evaluating the costs associated with a medical condition or cost effectiveness of
medical interventions.

In an incidence based approach the number of new cases of a condition in a given
year is determined. The lifetime costs associated with each case, which will depend
on the severity of the case and age of onset, are then evaluated.

In a prevalence based approach the number of people experiencing a particular
condition in a given year are estimated and the total costs of the condition for that
year are evaluated.


138
139


10.3 Cost utility analysis of cochlear implants
In the past ten years there have been several studies of the cost effectiveness of
cochlear implants in both adults and children. This section is concerned only with
those studies involving adults.

As cochlear implants affect the quality of life but do not extend life, the method
commonly used is cost utility analysis. These studies therefore quantify, by means of
a health utility value, the quality of life before and after implantation.

A meta analysis of nine previous studies (Cheng and Niparko, 1999; Niparko, 2000)
shows that the results are remarkably consistent, particularly in assigning a value to
the loss in health utility experienced before implantation, that is, as a result of
profound deafness. The studies reviewed by Cheng and Niparko (1999) were
published between 1995 and 1999, and included different methods of assessing the
health indices pre and post implantation. Most of these studies were carried out in
the UK or USA; a more recently published study in Hong Kong (Wong et al, 2000)
showed similar results.

In pooling the results of nine studies, involving a total of 619 subjects, Cheng and
Niparko (1999) calculated the health utility of profoundly deaf adults without
cochlear implants to be 0.54, that is profound deafness resulted in an average loss of
health utility of 0.46. (The average gain in health utility following implantation was
0.26, resulting in a health utility value of 0.8 with cochlear implants.) The health
utility losses in each of the studies considered by Cheng and Niparko (1999) are
shown in Table 10.1.

          Table 10.1 Loss in health utility from profound deafness in adults
                            (Cheng and Niparko, 1999)

                     Study                Patients      No of       Health
                                                      patients    utility loss
          Palmer et al, 1999             Implant      40         -0.42
          Palmer et al, 1999             No implant   14         -0.42
          Wyatt et al, 1996              No implant   32         -0.41
          Wyatt & Niparko, 1995          Implant      229        -0.47
          Summerfield & Marshall, 1995   Implant      105        -0.63
          Summerfield & Marshall, 1995   Implant      103        -0.42
          Summerfield & Marshall, 1995   No implant   52         -0.41
          Summerfield & Marshall, 1995   No implant   37         -0.38
          Harris et al, 1995             Implant      7          -0.36
          Overall                                     619        -0.46

More recent studies by Summerfield et al (2002) have also found a loss in health
utility of approximately 0.44 prior to cochlear implantation. However, when the
scores were adjusted to overcome the possibility of other conditions contributing to
health utility loss, an average loss of 0.26 was obtained for profoundly deaf people
who get no benefit from hearing aids. The adjustment of scores in this way has not
been considered in any other studies.


139
140


10.4 Societal costs of moderate hearing impairment
The only study to address the socio-economic benefits of hearing rehabilitation of
moderately impaired people is that of Joore et al (2003) (the ‘Maastricht study’). This
study considered those aspects of hearing aid fitting and benefits which have an
economic impact: changes in health related quality of life; effects on social
functioning; productivity in paid and unpaid labour; and use of medical services.
However, although these factors were assessed using various scales and questionnaire
data, the results were not translated into monetary costs. The authors decided against
the use of a health utility index in their assessments as they did not consider it valid in
this case owing to the clustering together of all sensory problems.

Of the 80 Dutch subjects involved in the study only 10 were in paid employment. The
results suggest that hearing aids may improve the situation at work for some
moderately hearing impaired individuals, thereby reducing productivity losses.
However, as discussed by the authors, the number of subjects is too small for firm
conclusions to be drawn.

With regard to medical costs, the results presented suggest that following hearing aid
fitting, numbers of visits to medical practitioners decreased; however the authors
report that following fitting use of medical services remained relatively stable.

Although a health utilities approach was not used in this study, the authors do tabulate
among their results a ‘hearing-specific health state valuation’, rated on a visual
analogue scale from 0 to 100. However, this item is not mentioned or discussed in the
paper. The tabulated values of the mean score are 52.00 before hearing aid fitting (n
= 80); 77.14 six weeks after initial fitting (n = 77); and 78.00 approximately six
months after fitting (n = 80). To be consistent with the cochlear implant studies, these
scores could be translated into a health utility index of 0.52 before hearing aid fitting
and 0.78 after fitting. It can be seen that there is close agreement with the average
health utility values of 0.54 and 0.8 before and after cochlear implantation,
determined by Cheng and Niparko (1999). In both cases the gain in health utility is
0.26 following hearing rehabilitation. There therefore seems to be some similarity in
health utility scores, and gains following rehabilitation, between profound and
moderate deafness.


10.5 Monetary costs of hearing impairment
There have been some recent evaluations of the costs to society, in dollars, of hearing
loss in the USA. The most detailed evaluation of the total costs to society caused by
hearing impairment is that carried out by Mohr et al (2000b), which considered the
costs of severe to profound hearing loss in the USA. Other studies have been carried
out by Ruben (2001) and Keren et al (2002). All three studies have included the costs
of some or all of the following factors in their calculations: unemployment,
underemployment or lost productivity (Ruben, 2001; Keren et al, 2002; Mohr et al,
2000b); special education (Ruben, 2001; Keren et al, 2002; Mohr et al, 2000b);
vocational rehabilitation (Keren et al, 2002; Mohr et al, 2000b); and assistive devices
and medical costs (Keren et al, 2002; Mohr et al, 2000b).


140
141


10.5.1 The costs of communication disorders (Ruben, 2001)
Ruben (2001) considered the costs to the US economy of different types of
communication disorder. He shows that the US economy relies increasingly on
communication based (rather than manual) employment, particularly in urban areas.
Thus the losses to the economy caused by disorders of hearing, voice, speech and
language have an increasingly significant impact.

Ruben tabulates the prevalence of these disorders in the US, together with the
unemployment rates in the various categories (1997 data), as shown in Table 10.2.

   Table 10.2 Employment and unemployment rates and communication disorders

                                                       Employed            Unemployed
 Condition                           Number            No.          %      No.        %
 Working age population with         138,142,000       103,330,26   74.8   34,811,780 25.2
 employment and without disability
 With non-severe disability          16,497,000        12,224,277   74.1   4,272,723    25.9
 With severe disability              14,392,000        3,669,960    25.5   10,722,040   74.5
 Difficulty hearing                  5,837,000         3,759,028    64.4   2,077,972    35.6
 Unable to hear                      430,000           216,700      50.4   213,280      47.6
 Difficulty in speaking              1,520,000         492,480      32.4   1,027,520    67.6
 understandably
 Unable to speak understandably      172,000           41,968       24.4   130,032      75.6
 Total communication disorders       7,959,000         4,510,196    56.7   3,448,804    43.3

Ruben also presents data to show that communication disorders are more prevalent
among the lower social classes, both in the US and UK, thus establishing a further
relationship between hearing and other problems and economic status.

Comparing the economic status of hearing impaired people with that of disabled
people in general, Ruben shows that income for hearing impaired people is 40% to
45% of that of the non-hearing impaired population (in Chapter 11 it is argued that the
current figure is probably higher than this) whereas for people with disabilities of all
kinds income is 85% of that of the non-disabled population. Table 10.2 shows that
43.3% of people with communication disorders are unemployed, compared with
25.9% of those with non-severe disabilities.

Ruben also presents data which show that low income is more common among people
with hearing or speech impairments than in the rest of the population, as can be seen
from Table 10.3.

      Table 10.3 US income level from 1994 to 1995 for persons aged 22 to 64

                                                           Income level (%)
                           Disability
                                                        Low     Middle High
              None                                      16.7    63.7     19.6
              Any                                       30.4    58.4     11.2
              Not severe                                19.3    64.9     15.9
              Difficulty hearing normal conversation    24.7    61.3     14.0
              Inability to hear normal conversation     21.4    60.0     18.6
              Difficulty having speech understood       43.7    48.1     8.2


141
142


Table 10.3 shows that 21.4% to 43.7% of persons with communication disorders are
in the lowest income group, compared with 19.3% of those with non-severe
disabilities.

An example of the relative incomes of the hearing impaired and general populations
in California in 1983 can be seen in Table 10.4.

 Table 10.4 Family income in California related to severity of hearing loss in 1983

                                              Median income $
                         General population   21,479
                         Hearing impaired     11,738
                         Unilateral           12,907

Ruben uses the data presented to calculate (in 1999 US$) the economic impact of
communication disorders, as shown in Table 10.5. However, there is some
inconsistency among the figures presented, and an apparent error. Furthermore it is
not made clear whether or how the costs have been inflated to 1999 values.

        Table 10.5 Economic impact of communication disorders (1999 US$)

                                                   5% prevalence     10% prevalence
  Education 0 – 18                                 31,700,000,000    63,400,000,000
  Unemployed                     79,500,000,000
  Underemployed                  43,100,000,000
  Total employment               122,600,000,000
  Total employment + education                     154,300,000,000   186,000,000,000

Ruben thus estimates the costs to the US economy to be between $154.3 and $186
billion per year, that is 2.5% to 3% of the 1999 GNP. He further predicts that a
shortage of skilled workers will cause a 5% drop in the growth rate of the GNP.
Amelioration of communication disorders would contribute significantly to meeting
the demand for skilled workers and thus assist in adding to the US GNP. As a
corollary, the increasing need for communication skills in the 21st century means that
people with communication disorders are becoming increasingly unemployable, more
so than people with other disorders. Thus there is an urgent need for rehabilitation of
those with communication disorders.

The other two studies discussed in this section calculate lifetime costs associated with
deafness.

10.5.2 Cost effectiveness of newborn screening (Keren et al, 2002)
The study by Keren et al (2002), which analyses the cost effectiveness of statewide
universal newborn hearing screening, was the first such study to include lifetime
societal costs of deafness. In order to determine the cost effectiveness of early
diagnosis and intervention the authors compare the lifetime societal costs of
congenital deafness for a deaf child with normal language (resulting from early
intervention) and delayed language. The lifetime costs in the two cases are shown in
Table 10.6. The costs were adjusted to 2001 US dollars using the appropriate
components of the US Consumer Price Index.


142
143


Table 10.6 Comparison of societal lifetime costs for deaf children with delayed and
                        normal language (2001 US$)

                                              Delayed            Normal
                                              language           language
        Lost productivity                     486,100            121,500
        Special education                     549,600            493,700
        Vocational rehabilitation             12,500             3,100
        Assistive devices and medical costs   79,100             79,100
        Total                                 1,126,300          697,500

This study thus shows that early diagnosis and intervention is cost saving in the long
term. However, the authors point out that a limitation of the study is the lack of
consideration of the long term social and psychological benefits of normal
communication for deaf children and adults, which would be captured using a quality
of life approach.

10.5.3 Societal costs of severe to profound hearing impairment (Mohr et al, 2000b)
The most comprehensive study to evaluate the costs to society of hearing impairment
is that by Mohr et al (2000b), in which the societal costs of severe to profound
hearing impairment were calculated.

The authors estimated that severe to profound hearing loss in the USA costs society
$297,000 over the lifetime of an individual. Most of these costs are due to reduced
work productivity, although special education for children contributes an additional
21%. For those with prelingual onset of deafness the lifetime costs exceed $1 million.
In calculating the costs Mohr et al included direct medical (diagnosis, medical visits
associated with hearing loss, audiological testing, fitting of hearing aids, costs
associated with other assistive devices) and non medical (special education and
rehabilitation) costs, and indirect productivity costs (reduction of lifetime earnings).

Costs were inflated to 1998 dollars using the Urban Consumer Price Index, future
costs were discounted at a rate of 3%, the inflation adjusted return on long term
treasury bonds.

The authors used an incidence based approach, considering five different age cohorts
in their calculations. Table 10.7 shows their estimate of the number of incident cases
in 1991.

Table 10.7 Estimate of incident cases in 1991 (calculated from 1990/1 NHIS and US
                                   Census 1991)

          Age cohort   Synthetic incidence      No of incident   Distribution by
                       (rate per 10,000 pop)    cases            age cohort (%)
          0-2          1.4                      1,638            11
          3-17         0.03                     167              1
          18-44        0.2                      2,524            16
          45-64        1.1                      5,216            34
          65+          1.9                      5,897            38
          Total        0.6                      15,442           100


143
144


Using data from various sources the authors derive estimates for the costs of the
different components in their analysis, as shown in Table 10.8.

          Table 10.8 Lifetime costs of severe to profound HL by component

                         Absolute and relative costs of various components
 Age                   Lost          Special      Vocational      Assistive     Total
 cohort                productivity education rehabilitation devices,           costs
                                                                  medical etc
 0-2      Cost $       433,400       504,900      11,500          70,200        1,020,000
          % of total   42            50           1               7             100
 3-17     Cost $       444,300       401,000      12,600          61,100        919,000
          % of total   48            44           1               7             100
 18-44    Cost $       382,900       20,200       6,700           43,200        453,000
          % of total   85            4            1               10            100
 45-64    Cost $       220,300       0            1,800           30,900        253,000
          % of total   87            0            1               12            100
 65+      Cost $       24,600        0            0               18,400        43,000
          % of total   57            0            0               43            100

To arrive at an average figure, the total costs for each age group are weighted
according to the relative incidence for that age group shown in Table 10.7. The
conclusion is that, averaged across age of onset, severe to profound hearing loss is
expected to cost society an additional $297,000 over the lifetime of an individual.
The magnitude of the cost is directly related to age of onset, as would be expected.

Table 10.8 shows that the largest component of societal lifetime costs (67%) is due to
reduced productivity. People who experience severe to profound hearing loss before
retirement age lose between $220,000 and $440,000 in earnings over their working
life, depending on when the onset of hearing loss occurs. The table also shows that,
apart from the over 65 age group, medical costs are a relatively small proportion of
the total.

The authors show how their estimate of the lifetime cost of profound hearing loss
compares with that of other conditions, see Table 10.9 (all figures represent 1998
costs). It can be seen that, calculated in this way using a human capital approach,
hearing loss is one of the most expensive conditions.

 Table 10.9 Lifetime costs of various conditions (data taken from Mohr et al, 2000b)

                                                                Cost
                               Condition
                                                             (1998 US$)
              Accidents with firearms                          89,100
              Near drowning                                    98,500
              Strokes                                          129,200
              25 year costs for young woman with
                                                              130,500
              rheumatoid arthritis
              Epilepsy among non-institutionalised persons
                                                              172,900
              with frequent seizures
              Schizophrenia                                   295,000
              Severe to profound hearing loss                 297,000
              Family where member has multiple sclerosis      593,000


144
145


The authors point out that a limitation of their study is that by adopting a human
capital approach, heavy emphasis is placed on earnings potential and intangible losses
such as social isolation and psychological stress are not accounted for. Among elderly
people who represent nearly 40% of new cases (see Table 10.7), the total costs are
therefore especially undervalued; although hearing loss significantly reduces their
quality of life the implications in terms of earnings or medical costs are relatively
minor.

10.5.4 Costs of deafness caused by noise at work
A slightly different approach, which incorporates an aspect of quality of life
evaluation in estimating remaining lifetime costs, has been used by the UK Health and
Safety Executive (HSE) in calculating the cost to industry of introducing new noise at
work legislation.

A new European Directive concerning noise at work was published in February 2003
(European Commission, 2003). In anticipation of the Directive the Health Directorate
of the HSE carried out a regulatory impact assessment to determine the cost to
industry of implementing the Directive in the UK (HSE, 2003). This would require
more stringent Noise at Work Regulations than those currently in force in the UK.

The main changes to the regulations would be a lowering of the noise levels at which
hearing protection must be worn. In calculating the resultant costs to industry the
HSE estimated the monetary worth of different levels of hearing loss.

The costs were calculated in 2000/1 prices over a 10 year period, the base year for
appraisal being 2000/1. In arriving at 10 year cost figures earnings were assumed to
rise by 1.8% per year in real terms (based on the observed increase of the economy
over the past 25 years). Costs and benefits were discounted using the UK Treasury
recommended discount rate of 3.5%. Health benefits were assumed to increase in
value by 2% per year in line with the annual increase in real GDP per capita.

Estimates were made of the numbers of people currently exposed to different levels of
noise in industry, and the median hearing loss associated with each level after 10
years’ exposure. The HSE also estimated the percentages of the population with 30
dB and 50 dB HL after 40 years’ exposure to various levels.

The HSE used a QALY approach to evaluate hearing loss, using information from the
Department of Health and Social Security to quantify the loss in QALY for differing
degrees of hearing loss, see Table 10.10. The monetary value of the loss was based
upon the assumption that a full quality life year has a value of £42,000. This is the
UK Department of Transport road safety estimate of the value per year of preventing
a fatality (VPF), which includes loss of earnings as well as an allowance for pain and
suffering. The monetary values associated with varying hearing losses are also shown
in Table 10.10.


145
146


  Table 10.10 Reduction in quality of life and corresponding value of hearing loss

                     Reduction in QoL     Hearing loss    Value
                     %                    dB              £
                     10                   50              4,200
                     5                    30              2,100
                     2.5                  20-30           1,050
                     1                    15-20           420
                     0.25                 10-15           105
                     0                    <10             0

It can be seen that the assumed reduction in quality of life is very much less than that
found in the other studies reviewed above. This is presumably based upon the amount
of compensation awarded to sufferers of noise induced hearing loss, in relation to
other industrial injuries, and will therefore underrepresent the true reduction of quality
of life due to hearing loss.

The report goes on to evaluate the total costs over the remaining working life of an
individual. Assumptions are made about the relationships between years of noise
exposure, remaining years of work and severity of hearing loss, to give the resultant
monetary values of hearing loss over the remaining working life of an individual. In
these calculations values are discounted to present value, and are shown in Table
10.11.

      Table 10.11 Monetary values of hearing loss over remaining working life

                                Hearing loss     Value
                                dB               £
                                50               96,000
                                30               48,000
                                20-30            24,000
                                15-20            9,6000
                                10-15            2,400
                                <10              0

In view of the fact that the assumed reductions in quality of life are so much smaller
than those found in studies of the impact of hearing loss, these figures are likely to be
underestimates.     However, the HSE report suggests a possible method for
approaching the evaluation of hearing loss in general, as discussed further in Chapter
12.


10.6 Discussion
It has been shown that there are few studies in which the economic costs of hearing
impairment have been addressed. The most detailed study is that by Mohr et al
(2000b), but this refers only to people with severe to profound deafness. Joore et al
(2003) attempted to address the costs of moderate hearing impairment but their study
was limited by a relatively small number of subjects of whom only ten were in
employment; furthermore no monetary costs are reported in their paper. Other authors
have examined a particular aspect of hearing loss, for example the cost effectiveness
of neonatal screening (Keren et al, 2002) or the economic impact of a range of


146
147


communication disorders (Ruben, 2001); however neither of these studies includes
any discussion of psychosocial effects of hearing impairment.

It is recognised (Keren et al, 2002; Mohr et al, 2000b) that the lack of consideration
of psychosocial effects may lead to an underestimation of the costs of hearing
impairment. This is especially true in the case of elderly people for whom
psychosocial effects may be considerable yet for whom the costs of lost productivity
and medical costs are not high relative to other age groups.

An assessment by the Health and Safety Executive in the UK (HSE, 2003) evaluated
noise due to industrial hearing loss in the UK. Although the reduction in quality of
life due to hearing loss is significantly underestimated in this analysis, the report
suggests a quality of life approach that may be appropriate to the evaluation of
hearing impairment in general. Health utility indices to assess quality of life are
commonly used in the analysis of the cost effectiveness of cochlear implants in many
studies. The health utility scores reported in these studies could also be of use in the
evaluation of the costs of hearing impairment.


10.7 Conclusions
A comprehensive literature review has revealed that there have been no previous
studies of the socio-economic costs of hearing loss which can be directly applied to
the evaluation of the costs of hearing impairment in Europe. However, the literature
suggests some methods of evaluating hearing loss which it is thought could usefully
be applied to the European hearing loss data presented elsewhere in this report, in
order to give an estimate of the costs to Europe of varying degrees of hearing
impairment.

The monetary cost studies reviewed in this chapter showed that loss of earnings were
a major component of the overall costs of hearing impairment. The next chapter
reviews data on employment and underemployment, and relative earnings of hearing
and hearing impaired people. The methods discussed in this chapter are used with the
data from the next chapter in an evaluation of the costs of hearing impairment in
Chapter 12.


147
148


CHAPTER 11            EMPLOYMENT, EARNINGS AND
                      DISCRIMINATION AT WORK

11.1 Introduction
The studies on costs of hearing impairment reviewed in the preceding chapter showed
that, in economic terms, the value of lost earnings/lost productivity is a major
component of the total cost to society of hearing disorders. In this chapter information
relating to the impact of hearing impairment on employment is presented. This
includes data on the incidence of unemployment or underemployment among deaf
and hard of hearing people, plus some information on typical earnings of hearing
impaired people. There is also discussion of discrimination experienced by hearing
impaired people while at work.

Most of the data in this chapter is from studies carried out in the UK by the RNID, or
from American surveys, but, given the consistency of the data from the two countries
it is assumed that the results would be applicable to Europe.


11.2 Employment and unemployment rates of hearing impaired people
In the relatively early study by Thomas and Herbst (1980) of the social impact of
hearing impairment among people of working age, no difference was found in
employment rates between the hearing impaired and control subjects. (Problems at
work were evident among the hearing impaired subjects, as discussed further in
Section 11.6.)

However, there is now a significant amount of more recent data to show that a greater
proportion of deaf and hard of hearing people is unemployed than of the hearing
population. Furthermore among those who are employed, a higher percentage of
hearing impaired people than of the general workforce are in the lower grades of
employment

11.2.1 Unemployment in the US
Two of the studies in the preceding chapter included details of employment and
unemployment rates of hearing impaired people in the US.

A major study of the impact of severe to profound hearing impairment was carried out
in the US in the late 1990s (Mohr et al, 2000a, 2000b). The grade of hearing was
based upon self-reported data; Mohr et al estimate that, in this context, ‘severe to
profound’ hearing loss corresponds to a better ear hearing loss of over 70 dB. It was
found that people with severe to profound hearing loss earn 50 - 70 % of their non-
hearing impaired peers and lose between $220,000 and $440,000 in earnings over
their working life, depending on when their hearing loss occurs. The labour force
participation rates of severe to profoundly hearing impaired persons and of the non-
hearing impaired population, in three age groups, are shown in Table 11.1 (figures
taken from (Mohr et al, 2000b) based upon an analysis of 1990/1 data.


148
149


 Table 11.1 Comparison of labour participation rate in severe to profoundly hearing
              impaired and non-hearing impaired (Mohr et al, 2000b)

                            Severe to profoundly
                                                      Non-hearing impaired
                            hearing impaired
             Age            Sample Percentage         Sample        Percentage
                            size      employed        size          employed
             18-44          149       59              97737         77
             45-64          273       49              45299         68
             65 and over    851       7               28443         13

From figures in Table 11.1 it is possible to calculate the percentages of all those of
working age (18 to 64 years) who are employed, as shown in Table 11.2.

 Table 11.2 Labour participation rate in severe to profoundly hearing impaired and
                  non-hearing impaired people of working age

                           Severe to profoundly
                                                     Non-hearing impaired
                           hearing impaired
             Age           Sample     Percentage     Sample      Percentage
                           size       employed       size        employed
             18-64         422        53             97737       74

The study by Ruben (2001) into the economic impact of communication disorders
detailed the employment and unemployment rates of people with various types of
communication disorder, including hearing impairment. The table of Ruben’s data
from Chapter 10 is reproduced here as Table 11.3.

   Table 11.3 Employment and unemployment rates and communication disorders
                                (Ruben, 2001)

                                                        Employed          Unemployed
 Condition                           Number         No.        %        No.        %
 Working age population with         138,142,000    103,330,26 74.8     34,811,780 25.2
 employment and without disability
 With non-severe disability          16,497,000     12,224,277   74.1   4,272,723    25.9
 With severe disability              14,392,000     3,669,960    25.5   10,722,040   74.5
 Difficulty hearing                  5,837,000      3,759,028    64.4   2,077,972    35.6
 Unable to hear                      430,000        216,700      50.4   213,280      47.6
 Difficulty in speaking              1,520,000      492,480      32.4   1,027,520    67.6
 understandably
 Unable to speak understandably      172,000        41,968       24.4   130,032      75.6
 Total communication disorders       7,959,000      4,510,196    56.7   3,448,804    43.3

From this table it is possible to calculate the percentages of people with any form of
hearing impairment who are employed and unemployed, as shown in Table 11.4.

      Table 11.4 Employment and unemployment rates of hearing impaired people

                                                 Employed            Unemployed
      Condition                  Number          No.         %       No.        %
      Difficulty hearing         5,837,000       3,759,028   64.4    2,077,972  35.6
      Unable to hear             430,000         216,700     50.4    213,280    47.6
      Any hearing impairment     6,267,000       3,975,728   63.4    2,291,252  36.6


149
150


In his analysis of data from the 1994 National Health Interview Survey (NHIS),
O'Neill (1999) found that labour force participation rates of the working age
population (18 - 64 years of age) with hearing loss (67%) were lower for this group
than for non-hearing impaired people (75%).

In Table 11.5 the figures extrapolated from the data of Mohr et al (2000b) and Ruben
(2001) are compared with those of O’Neill (1999).

      Table 11.5 Employment rates of people with and without hearing impairment

                                       Degree of hearing impairment
                                               Profound/
                                  Any                        None
                                               severe
             O’Neill (1999)       67                         75
             Mohr et al (2000b)                53            74
             Ruben (2001)         63.4         50.4          74.8

Table 11.5 shows good agreement between the three studies, with on average 65% of
hearing impaired people being in employment, compared with 75% of the general
population. For those with severe to profound hearing loss, around 52% are in
employment.

11.2.2 Unemployment in Europe
The major source of literature on levels of employment and unemployment among
hearing impaired people is Europe is provided by the RNID in the UK. The major
part of this section concerns data arising from a survey carried out by the RNID in
1999 (RNID, 2000; Bradshaw, 2002).

As stated above, in the 1980 UK study of the impact of hearing impairment by
Thomas and Herbst, no evidence was found of increased levels of unemployment
among hearing impaired people. However more recently the RNID surveys of its
members (RNID, 2000; Bradshaw, 2002) plus official government statistics, have
shown that there are significantly higher rates of unemployment among hearing
impaired people than among the general working age population, and that the
difference is increasing.

In the earlier report (RNID, 2000) the RNID quotes figures from the UK Government
Labour Force Surveys which show that in 1999 the overall level of unemployment
amongst deaf and hard of hearing people was 15% compared with 6% of the hearing
population. More significantly, 22% of hearing impaired people between the ages of
25 and 45, were unemployed. That is, when most of the hearing population is at its
most economically active, a deaf or hard of hearing person is four times more likely to
be unemployed than a hearing person. Furthermore, according to government
statistics, in 1997 and 1998 a deaf or hard of hearing person was twice as likely to be
unemployed as a hearing person. This suggests that the gap between the proportion of
deaf and hard of hearing people in work and the rest of the population is widening.

In 2002 the results of a comprehensive survey of RNID members aged 16 to 64,
carried out in 1999, were published. The figures relating to unemployment in this
survey were higher than those derived from government statistics. However, as
pointed out in the report, the majority of the 1099 respondents were profoundly deaf


150
151


so the data may not be representative of the hearing impaired population as a whole.
The main findings concerning unemployment rates are as follows. (Note that
‘unemployment rate’ is defined as the percentage of those who are economically
active, rather than of the whole sample.)

•   The unemployment rate of all respondents was 19% (compared with 5% of the
    non-disabled population and 10% for disabled people).
•   Of those unemployed, 57% had been unemployed for over a year and 20% for
    over 20 years.
•   Deaf people from ethnic groups or with other disabilities experienced even higher
    levels of unemployment, as did people who were profoundly or severely deaf.
•   The unemployment rate for deaf people from ethnic groups was 28%, compared
    with 18% for the rest of the sample.
•   The unemployment rate for deaf people with other disabilities was 32%, compared
    with 16% for the rest of the sample.
•   The unemployment rate for profoundly or severely deaf people was 20%
    compared with 12% for the rest of the sample.
•   The unemployment rate for sign language users was slightly higher (21%) than for
    those with English or another spoken language as their first language (18%).
•   The high levels of unemployment are despite the fact that the survey population
    was more highly qualified (33% with higher qualifications) than the general
    working population (23% with higher qualifications).

Overall, of the 1099 respondents to the survey 668 (61%) were in employment; 122
(11%) were students and 309 (28%) were unemployed. In the RNID report, as in
Government statistics, a distinction is made between those who are unemployed and
looking for work (and therefore considered ‘economically active’) and those who are
unemployed and not seeking work. In the summary of the results presented here this
distinction is not made.

Table 11.6 shows the numbers and percentages of respondents of different
employment status classified by age.

            Table 11.6 Employment status classified by age (RNID, 2002)

                                                    Age
            Employment status
                                    Under 25        25-54          55-65
                                    N     %        N      %      N       %
            In work                 59    34      539     69     56     46
            In education/training   78    45       35      4      3      2
            Unemployed              35    20      204     26     64     52

The respondents are also categorised according to their own description of the
severity of their hearing loss. Employment status according to degree of hearing loss
is shown in Table 11.7. As can be seen, the categories are not mutually exclusive.
Nevertheless there is a clear indication that the greater the degree of deafness the
higher the unemployment rate. ‘Deafened’ refers to people who have lost their
hearing as an adult relatively suddenly. It can be seen that this group also experiences
a high rate of unemployment.


151
152


          Table 11.7 Employment status according to degree of hearing loss

                                             Degree of hearing loss
 Economic activity                                Hard of                    Deaf with
                            Profound    Severe                  Deafened
                                                  hearing                    tinnitus
                            No    %     No    %    No     %     No    %       No    %
 Employed                   448   59    100 63     45     70     26   58      55    59
 In education/training       88   12     18   11    4      6      6   13       7     7
 Unemployed                 219   29    41    26   15     23     13   29      31    33
 Total respondents          755         159        64            45           93

It is possible from the data in Table 11.7 to calculate the percentages of people with
all degrees of hearing loss, and with severe to profound hearing loss, who are
employed for comparison with the US data presented in the preceding section.
Considering all degrees of hearing impairment, 61% are employed, which is lower
than the US figures shown in Table 11.5. However, of those with severe to profound
hearing loss 60% are in employment, which is higher than the comparable figures
from the US. These differences, plus the similarity between the RNID figures for all
hearing impairment and severe/profound impairment, suggest that, as stated in the
RNID report, the overall data is not representative of the hearing impaired population
as a whole.


11.3 Underemployment
In addition to higher rates of unemployment among hearing impaired people than
among the hearing population, it also appears that those in employment tend to be in
the lower skill jobs. This is reflected in the average earnings of hearing impaired
people, which are discussed in the next section.

Capella (2003) reviews work showing that deaf and hard of hearing people are overly
concentrated in ‘blue-collar’ positions and significantly underrepresented in
professional, managerial and technical occupations.

In the 1994 NHIS data in the US, analysed by O’Neill (1999), approximately 13% of
hearing impaired workers aged 51 to 61 reported that hearing loss limited the type or
amount of paid work carried out. Workers with hearing loss were more likely than
those without to list their occupation as farming, craft and repair, machine operator or
transportation and less likely to cite administrative, professional, service, or sales.

Ruben (2001) showed that in the year 2000, in the US, 62% of the total labour force
worked in ‘white collar’ jobs, based upon communication of some sort, while 37%
were in farming or ‘blue-collar’ employment. He presents tables showing the
percentages of men and women with and without hearing disorders across the social
classes in America. This data was acquired from a survey of over 8000 people aged
33 and is shown Table 11.8.


152
153


 Table 11.8 Percentages of men and women across US social classes (Ruben, 2001)

       Hearing             I, II          III, not manual    III, manual      IV, V
       impairment     M            F         M        F       M       F     M       F
       None           41           33        13      32      31       8     15      22
       Some           34           31        12      29      34       9     17      25
       Handicap       23           28         9      34      40       8     25      20

In the UK data from the 1999 RNID survey was analysed (Bradshaw, 2002) to
examine the type of work undertake by deaf and hard of hearing people.

Table 11.9 shows a breakdown of the respondents’ occupation types, using UK
Government classifications.

   Table 11.9 Occupation types of respondents to RNID survey (Bradshaw, 2002)

                           Occupational group               No       %
                           Professional                      72      11
                           Intermediate                     167      26
                           Skilled (non-manual)             158      25
                           Skilled (manual)                 100      15
                           Partly skilled                    89      14
                           Unskilled                        57       9
                           Total respondents                643     100

It is possible to reanalyse the data provided in Table 11.8 to give approximate overall
data for any degree of hearing loss, as shown in Table 11.10, in order to compare it
directly with the RNID data. This has been done by recalculating the percentages as
percentages of those in the labour force, assuming equal numbers of men and women
in the sample, and equal numbers of those with ‘some’ hearing impairment and with a
‘handicap’.

  Table 11.10 Overall percentages of employed people in US across social classes

           Hearing                                   Social class
         impairment          I, II        III, not manual     III, manual    IV, V
         None                38                   24                20        19
         Some                34                   22                23        22
         Handicap            26                   22                25        23
         Any HI              30                   22                24        23

Assuming the US social class categories correspond to the occupational groups listed
in Table 11.9 the US and UK data can be directly compared as shown in Table 11.

   Table 11.11 Comparison of US and UK data on types of employment of hearing
                                impaired people

              Social class              Occupational group            US    UK
              (US)                      (UK)                          %     %
              I, II                     Professional/Intermediate     30    37
              III (non-manual)          Skilled (non-manual)          22    25
              III (manual)              Skilled (manual)              24    15
              IV, V                     Partly skilled/unskilled      23    23


153
154


The data for the US and UK show a very similar pattern, especially considering that
the US figures are necessarily approximate in the absence of the original data set. A
possible further reason why higher percentages of people in the UK survey than in the
US are in ‘white-collar’ employment is that the educational level of the sample in the
RNID was high. The results suggest that in general around 30% of hearing impaired
people are in ‘white-collar’ work, compared with around 38% of the general
population (Ruben, 2001).


11.4 Earnings
A consequence of the differential in types of employment between hearing and
hearing impaired people discussed above is that hearing impaired people in general
earn less than their hearing peers. There is a small amount of data to confirm this,
again mainly from studies carried out in the US and UK.

Capella (2003) showed that, even among groups with similar education level, in the
1990s deaf and hard of hearing adults earned substantially less than hearing workers.
Capella cites work by Mowry (1988) which found that, even after rehabilitation, deaf
people earned on average 19% and hard of hearing people 8.5% less than others in the
same occupational category. A study of the General Labour Force data in the US
showed that over twenty occupations including agriculture, clerical, management,
professional, sales and service, deaf and hard of hearing workers earned 83% and
84% respectively of the average median earnings.

The income of full time and part time employees in the 1999 RNID survey of people
of working age (RNID, 2002; Bradshaw, 2002) was analysed. Full time earnings are
shown in Table 11.12. At the time of the survey the national minimum wage in the
UK was £3.60 per hour, equivalent to £126 per week for a 35 hour week, with 1.1%
of full time employees earning below this.

      Table 11.12 Weekly income of RNID survey respondents working full time

             Weekly income £        Male        Female            Total
                                   N     %     N     %        N        %
             <50                 4     2     5     2.5      9        2
             50-99               1     1     5     2.5      6        2
             100-149             12    6     26    13       38       10
             150-199             30    16    42    21       72       19
             200-299             68    36    74    38       142      37
             300-399             37    20    26    13       63       16
             400-499             19    10    7     4        26       7
             >=500               16    9     11    6        27       7
             Total respondents   187   100   196   100      383      100

Table 11.12 shows that 4% of full time employees in the survey earned less than £100
per week, while approximately 8% earned less than the minimum wage. Thus
respondents were approximately seven times more likely than the national average to
be earning less than the minimum wage.

In the general population at this time, 11.8% earned less than £10,000 per year; Table
11.12 shows that 61% of the sample earned less than £15,600 per year and around


154
155


25% earned less than £10,000. Respondents were far less likely than then the general
population to be in a higher income bracket. At the time of the survey around 27% of
the general population earned more than £460 per week, while the table shows
roughly 10% of the sample earned this amount.

The study by Mohr et al discussed in Chapter 10 took account of earnings of severe to
profoundly deaf people in estimating the costs to society of deafness. Table 11.13
shows the mean monthly earnings of people with severe to profound hearing loss
compared with the hearing population for the year 1990-91.

 Table 11.13 Comparison of mean monthly earnings of severe to profoundly hearing
           impaired and non-hearing impaired people (Mohr et al 2000b)

                 Severe to profoundly                               HI earnings as
                                             Non-hearing impaired
   Age           hearing impaired                                   % of non HI
                 Number    Earnings $        Number    Earnings $
   18-44         90        1301              75244     1930         67%
   45-64         137       2044              30727     2357         87%
   65 and over   59        969               3720      3720         77%

Combining the age ranges 18-44 and 45-64 gives the figures shown in Table 11.14 for
people of working age.

 Table 11.14 Mean monthly earnings of severe to profoundly hearing impaired and
                 non-hearing impaired people of working age

                 Severe to profoundly        Non-hearing impaired   HI earnings as
                 hearing impaired                                   % of non HI
   Age           Number    Earnings $        Number    Earnings $
   18-64         227       1749              105971    2054         85

Table 11.14 shows that the earnings of severe to profoundly deaf people are
approximately 85% of those who are not hearing impaired. This figure is consistent
with the figures of 83% and 84% given by Capella (2003) for deaf and hard of hearing
people in the twenty occupations considered.

Ruben (2001) presents data from California, dating from 1983, which compares the
median income of hearing impaired people with the general population, see Table
11.15.

Table 11.15 Family income in California related to severity of hearing loss in 1983

                                              Median income $
                        General population    21,479
                        Hearing impaired      11,738
                        Unilateral            12,907

This table shows a much wider discrepancy between the earnings of hearing impaired
people and the general population, but it is difficult to interpret the data without
further information. Also, the figures quoted are median values rather than mean
values. However, as the data is considerably older than the other figures quoted, it
may no longer be applicable. As pointed out by Capella (2003), although earnings of


155
156


hearing impaired people are still well below those of other workers, in recent years
post secondary education has been shown to have a positive effect on earning of deaf
and hard of hearing adults. Therefore the discrepancy between the earnings of the two
groups could have reduced since the California data was published.


11.5 Retirement
In discussing employment and earnings of hearing impaired people, the possibility of
hearing impairment and its effects as possible reasons for early retirement, and the
implications of early retirement need to be considered.

The only discussion of issues relating to retirement was found in the analysis by
O’Neill of the 1992 US Health and Retirement Study (HRS) (O’Neill, 1999). O’Neill
compared retirement data for people with and without hearing loss, as shown in Table
11.16.

 Table 11.16 Percentages of adults aged 51 to 61 concerned with various aspects of
                                    retirement

                                    With hearing loss   Without hearing loss
          Completely retired               18                    12
          Poor health a factor in
                                           70                   44
          deciding to retire
          Wanted to retire                 23                   42
          Satisfaction with
                                           29                   42
          retirement

It can be seen that a higher percentage of hearing impaired than hearing people are
retired, which will contribute to the higher percetages of hearing impaired people of
working age who are unemployed. However, the data suggest that many of the people
with hearing loss who are retired did not retire for positive reasons, and were in
poorer health at the time of retirement than their hearing peers. These factors, plus
consequent lower economic status, would probably be the reasons for the larger
percentage among the hearing impaired who are not satisfied with their retirement.

The HRS also found that, among 51 to 61 year olds, the median net worth of an
individual with hearing loss was $65,575 compared with $102,000 for someone
without hearing loss.


11.6 Discrimination at work
Among deaf and hard of hearing people who are in work, there are many reports of
discrimination at work.

The two reports by the RNID concerning employment (RNID, 2000; Bradshaw, 2002)
provide evidence of discrimination, both while seeking work and at work. The figures
relating to employment and discrimination among respondents to the RNID survey
are as follows:


156
157


•   Over two thirds (70%) said their deafness had prevented them from getting a job.
•   Over two thirds (68%) felt that seeking work was a problem because their
    communication problems were not understood.
•   Over half (52%) said that they had been prevented from pursuing further training
    or education because of their deafness or lack of communication services.
•   Nearly three quarters (74%) said opportunities for promotion were fewer than for
    hearing colleagues.
•   Over half (60%) said their colleagues did not understand their hearing problems.
•   Over a third (38%) in employment said they were looking for another job because
    of the way they were treated at work.
•   Nearly two thirds (64%) experienced communication barriers at work.
•   Over half said they were unable to communicate with hearing colleagues.
•   Over a third (38%) in employment said they moved jobs more often than they
    liked because of the way they were treated at work.

A further survey of employers carried out by the (RNID, 2002b) provided possible
reasons for the discrimination experienced by deaf and hard of hearing people in the
workplace. There was a lack of awareness and ignorance of the needs of disabled
staff in general, and of the support available to employers. The employers also
showed poor knowledge of their legal responsibilities towards disabled people. There
was little employer support or adjustments for disabled staff; only one third of the
companies with deaf or hard of hearing staff had made adjustments for them in the
work environment; and only three out of the 400 companies had provided any deaf
awareness training. Employers also lacked knowledge of government support which
is available to employers of disabled people.

Although Thomas and Herbst in their 1980 study found no evidence of different rates
of employment between hearing impaired and hearing people, they did find that 11%
of their hearing impaired subjects had changed their job due to their deafness
(Thomas and Herbst, 1980). However, unlike the RNID survey there was no evidence
that hearing impaired subjects felt that their prospects of promotion differed from
those with normal hearing. Nevertheless, Thomas and Herbst found that the hearing
impaired subjects were significantly less happy at work than a comparable group of
normal hearing people, and concluded that there is some evidence to suggest that
deafness lowers the quality of working life.

There is some other evidence, more recent than the Thomas and Herbst study, which
supports the RNID findings. The workers interviewed by Hetu et al (1990) spoke of
the fear of reduced promotion and job opportunities and, in the study by Joore et al
(2003), of 10 moderately impaired subjects in work, 6 said that their deafness caused
problems at work.


11.7 Conclusions
This chapter has provided evidence, mainly from the US and the UK, which shows
that hearing impairment and resulting discrimination cause problems in all aspects of
working life including obtaining work, functioning at work, communicating with
colleagues and being stigmatised by co-workers. There is a consistent pattern of
lower employment rates among the hearing impaired population than the general
population, employment rates decreasing with increased severity of impairment. It


157
158


appears that the gap between the employment rates of hearing and hearing impaired
people is widening. Ruben (2001) considers that, with the increasing importance of
work requiring communication skills, this gap will increase in the 21st century.

The outcomes of research studies concerning employment are related. It may be the
discrimination at work which leads to less job satisfaction and to people changing
jobs. Of those surveyed by the RNID 38% were looking for another job because of
discrimination. This represents a significant cost to employers in terms of lost
expertise and recruitment expenditure. As pointed out "Employment opportunities are
critical to individual prosperity and happiness. The exclusion of deaf and hard of
hearing people from such opportunities results in individual misery and a heavy
social cost in terms of lost skills and extra strain on an over-stretched welfare
system." (RNID, 2002).

Not only is the employment rate of hearing impaired people lower than that of the rest
of the population, but more hearing impaired than hearing people are employed in
jobs with less status and lower earnings. This could also contribute to lower job
satisfaction among deaf and hard of hearing people.

Studies of the relative earnings of hearing and hearing impaired people show that, on
average, the latter earn around 85% of the former, representing a further cost to
society.

In the following chapter data presented in this chapter is used in the overall evaluation
of hearing loss.


158
159


CHAPTER 12             EVALUATION OF HEARING IMPAIRMENT IN
                       EUROPE

12.1 Introduction
This chapter brings together the information presented in the previous chapters in
order to estimate some costs to Europe of hearing impairment. The data on
prevalence of various grades of hearing loss contained in Chapter 2 are used to
estimate the current numbers of hearing impaired people in Europe. Two approaches
are then used in estimating costs. The first uses a ‘quality of life’ approach, suggested
by some of the studies in Chapter 10. Information on the effects of hearing loss
presented in Chapters 4 and 5 is used to assign a health utility index to different
grades of hearing impairment, from which overall costs of hearing loss in the
European population can be estimated. The second approach calculates the financial
loss in terms of loss of earnings of hearing impaired people, using information from
Chapter 11.

The choice of method of evaluation has to be based upon the data which are available.
Sufficient information has been obtained for a full quality of life evaluation.
However, there is insufficient information available at the present time for a full and
accurate monetary evaluation. Further research is needed across Europe in order to
obtain the necessary data, as discussed in the next chapter.

In order to evaluate the costs using both methods the following information is
required:

•   Numbers of people in Europe with hearing loss of differing degrees of severity
•   Numbers of people in Europe who would benefit from a hearing aid
•   Quality of life values associated with each degree of hearing loss
•   A monetary value associated with a full quality of life year
•   Numbers of people in Europe who are unemployed or underemployed as a result
    of hearing loss
•   Average earnings of population of Europe

As will be seen ‘Europe’ is taken to mean both the European Union (25 states) and
also the whole continent including countries not in the EU but excluding Turkey and
Russia. Countries included in both definitions, together with their current populations
are listed in Appendix 5.

The evaluations using both methods are carried out for the total numbers of people in
Europe who would benefit from hearing aids. In addition, the numbers are adjusted to
consider only those people who would benefit from hearing aids but do not own one,
thus giving a more conservative estimate of the costs of hearing impairment.


12.2 Numbers of people in Europe who would benefit from hearing aids
The total numbers of hearing impaired people in the current four EU hearing loss
grades have been calculated. Of these, the numbers who would benefit from hearing
aids is also estimated.


159
160


12.2.1 Numbers of hearing impaired people in Europe
Using the information on prevalence of hearing loss in Europe, discussed in Chapter
3, it is possible from the population data to calculate how many European adults
currently have hearing impairment of different grades.

In Chapter 3 it was deduced that the current prevalence in Europe was as shown in
Table 12.1 (reproduced from Section 3.4.2).

Table 12.1 Current prevalence among adults in Europe of different grades of hearing
                                  impairment

        Grade of HI            Mild        Moderate        Severe       Profound
        BEHL                   21-39        40-69           70-94          95+
        Percentage of
                                16.9          4.6            0.7           0.2
        population

The populations of individual countries of Europe (2003/4 data) are listed in
Appendix 5. From these the populations of the European Union, the rest of the
Europe and Europe as a whole can be calculated, as shown in Table 12.2. This report
is concerned with adults aged 18 and over. Davis (1997) estimated the total
population of Europe in 2005 to be 530,803,000 of whom 412,573,000, that is 77.7%,
would be over 18. (Note that the total population estimated by Davis, which was
based upon United Nations predictions, agrees with the total population in Table 12.2
less the population of Ukraine.) Assuming that 77.7% of the current population is
over 18 gives the numbers of adult populations in regions of Europe also shown in
Table 12.2.

                   Table 12.2 Estimate of total population of Europe

                                          Total              Adult
                                       population         population
                  European Union       456,814,600        354,944,940
                  Rest of Europe       122,404,817        95,108,530
                  Total Europe         579,219,417        450,053,470

Using the prevalence figures shown in Table 12.1, the numbers of people with hearing
impairment in the four categories are as shown in Table 12.3 (to nearest million).

 Table 12.3 Estimates of numbers of adults in Europe in four categories of hearing
                                  impairment

   Grade of HI                            Mild        Moderate      Severe     Profound
   Percentage of population               16.9           4.6          0.7         0.2
   No. of people in EU                 59,985,694    16,327,467    2,484,615    709,890
   No. of people in rest of Europe     16,073,341     4,374,992     665,760     190,217
   No. of people in all Europe         76,059,036    20,702,459    3,150,375    900,107

12.2.2 Numbers who would benefit from hearing aids
The four categories in Table 12.3 reflect the current European definitions of hearing
impairment. The category ‘mild’ refers to hearing impairment of from 21 to 39 dB
BEHL. However, it is usually assumed that those with hearing impairment of 25 dB
BEHL or greater would benefit from hearing aids. As evident from Chapter 3, Davis


160
161


(1995) found that 6.5% of adults in the UK had BEHL of between 20 and 25 dB. In
estimating the costs of untreated hearing impairment only those who would benefit
from hearing aids should be considered. If those in the ‘mild’ category with BEHL
between 20 and 25 dB are not considered, then 10.4% of the population remain in the
‘mild’ category. Table 12.4 shows the numbers of adults in Europe who would benefit
from hearing aids, considering only those with BEHL of 25 dB and above.

 Table 12.4. Estimates of numbers of adults in Europe in four categories of hearing
                  impairment who would benefit from hearing aids

   Grade of HI                            Mild*      Moderate     Severe     Profound
   Percentage of population                10.4         4.6         0.7         0.2
   No. of people in EU                 36,914,273   16,327,467   2,484,615    709,890
   No. of people in rest of Europe      9,891,287    4,374,992    665,760     190,217
   No. of people in all Europe         46,805,560   20,702,459   3,150,375    900,107
       * 25 to 39 dB BEHL

For the purposes of the following analysis, given the relatively small numbers of those
with profound HL, the severe/profound categories have been combined as shown in
Table 12.5.

 Table 12.5. Estimates of numbers of adults in Europe in three categories of hearing
                  impairment who would benefit from hearing aids

         Grade of HI                           Mild*      Moderate     Severe/
                                                                      Profound
         No. of people in EU                36,914,273   16,327,467   3,194,505
         No. of people in rest of Europe     9,891,287    4,374,992    855,977
         No. of people in all Europe        46,805,560   20,702,459   4,050,482
       * 25 to 39 dB BEHL


12.3 Evaluation of costs of hearing impairment using a quality of life approach
It has been seen in Chapter 10 that some studies of the costs of hearing impairment
have used a quality of life approach to evaluate the benefits that may be derived from
treatment such as cochlear implants (Cheng and Niparko, 1999; Wong et al, 2000;
Summerfield et al, 2002) or in estimating the costs of new legislation to protect
workers’ hearing (HSE, 2003). Other studies have estimated the direct costs of
various issues connected with hearing loss such as employment, treatment, or
education (Mohr et al, 2000; Ruben, 2001; Keren et al, 2002). However, authors of
these studies have pointed out that using a purely monetary approach ignores the
important psychosocial costs of hearing impairment (Mohr et al, 2000; Keren et al,
2002). Chapters 4 and 5 have illustrated the significant psychosocial effects that even
mild and moderate hearing impairment can have upon individuals and their families,
while Chapter 9 shows how many of these effects may be mitigated by the use of
appropriate hearing aids. Given the extent of psychosocial problems which may be
attributable to an individual’s hearing loss it is important that these factors are
accounted for in any evaluation of hearing impairment. This section therefore
describes an approach to evaluation based upon a quality of life method. A
prevalence based approach is used, based upon the prevalence data in the previous
section, in which the costs for a particular year are evaluated.


161
162


12.3.1 Evaluation of loss of quality of life due to hearing impairment
Chapter 10 reviewed studies which have taken a quality of life approach in estimating
the cost effectiveness of cochlear implants. In these studies a health utility index
(HUI) value has been assigned to a patient’s condition before and after implantation.
The value of the index before implantation may be regarded as an indicator of the
quality of life due to profound deafness. In the studies reviewed the average value of
the HUI associated with profound deafness was 0.54, indicating that profound
deafness causes a loss of 0.46 in the quality of life index. Sorri et al (2001) also
regard this value, derived from cochlear implant studies, as being indicative of the
loss of quality of life due to profound deafness. Cochlear implantation was found to
increase the HUI by approximately 0.3 on average, to around 0.8. Sorri et al (2001)
cite a study which found that for a representative group of the British population, the
value of the HUI was above 0.85 until after the age of 60, and above 0.8 until the age
of 70.

It therefore seems reasonable to associate a HUI value of 0.6 to severe/profound
deafness and 0.8 to mild hearing impairment.

Chapters 4 and 5 discussed many studies showing the impact of hearing impairment
on quality of life. It was seen that the detrimental psychosocial effects of hearing
impairment increased, and overall quality of life decreased, with an increase in
hearing loss. In particular, the study by Bess (1989; 2000) shows an approximately
linear relationship between hearing loss and psychosocial effects as measured using
the Sickness Impact Profile. It therefore seems reasonable to assume a linear increase
in HUI with increase in severity of hearing loss.

Therefore HUI values have been assigned to the three grades of hearing loss as shown
in Table 12.5. If it is assumed that the ‘average’ value of HUI is 0.85 for an adult in
Europe (Sorri et al, 2001) then the loss in HUI caused by each grade of hearing loss is
as also shown in Table 12.6.

          Table 12.6 Health utility indices assigned to grades of hearing loss

                                                                   Severe/
               Grade of HI                Mild        Moderate
                                                                   Profound
               Health utility index       0.8         0.7          0.6
               Loss in HUI due to HI      0.05        0.15         0.25

12.3.2 Quality adjusted life years
In health economics it is common practice to evaluate in monetary terms the
effectiveness of a health policy in terms of quality adjusted life years (QALY). A
quality adjusted life year allocates a value to one full quality year of life, and adjusts it
by a factor reflecting the change in quality of life due to a health effect. This method
has been used in evaluating the cost effectiveness of cochlear implants, as described
in Chapter 10. As was also discussed, this approach was used by the Health and
Safety Executive (HSE) in the UK to evaluate the costs of implementing the new EC
Directive on noise at work (Health and Safety Executive, 2003). The HSE assigned
loss of quality of life factors to noise induced hearing loss of different severities, and
evaluated an annual cost of the hearing loss. The value of a full quality of life year
was assumed to be £42,000, which was based upon the ‘value of preventing a fatality’
used by the UK Department of Transport, in assessments of road safety. The value of


162
163


a full quality of life year used in health assessments includes consideration of loss of
earnings, plus allowances for pain and suffering (Health and Safety Executive, 2003).

The most recent figure proposed for use in Europe to represent the value of one year
of life is 44,000 euros (European Commission Environment DG, 2003). This is the
value used in Section 3.3 in evaluating an annual cost of hearing impairment.

12.3.3 Annual cost of hearing impairment per person
Assuming 44,000 euros as the value of a full quality life year, then the values in euros
per person per year for the different categories of hearing impairment are as shown in
Table 12.7.

           Table 12.7 Annual cost of hearing impairment in euros per person

                                                                           Severe/
                Grade of HI                   Mild           Moderate
                                                                           Profound
                Loss in HUI due to HI         0.05           0.15          0.25
                Cost in euros                 2,200          6,600         11,000

12.3.4 Total costs of untreated hearing impairment
Combining the estimates in Table 12.5 of population numbers with hearing
impairment with the values shown in Table 12.7 gives the total annual costs of each
grade of hearing loss; these are shown in millions of euros in Table 12.8.

      Table 12.8 Costs in millions of euros of four categories of hearing impairment

                                                                            Severe/
               Grade of HI                       Mild*       Moderate
                                                                           Profound
               Total cost in EU                81,211         107,761       35,140
               Total cost in rest of Europe    21,761         28,875         9,416
               Total cost in all Europe        102,972        136,636       44,556
                 * 25 to 39 dB BEHL

Thus the total annual costs of untreated hearing impairment in each area are the sums
of the values for the three categories shown in Table 12.8. These overall figures, in
billions of euros, to the nearest billion, are shown in Table 12.9.

      Table 12.9 Total costs, in billions of euros, of hearing impairment in Europe

                                                             Cost
                                                     (billions of euros)
                             European Union                  224
                             Rest of Europe                   60
                             Total Europe                    284


12.4 Evaluation of costs of unemployment due to hearing loss
The studies by Mohr et al (2000) and Keren et al (2002), described in Chapter 10,
showed that a major contribution to the lifetime costs of hearing impairment was the
loss of earnings of people with hearing loss. Mohr et al found that reduced
productivity, expressed as loss of earnings, contributed 67% of the societal lifetime
costs of severe to profound hearing impairment. The following sections estimate the


163
164


numbers of people who are unemployed in Europe as result of their hearing loss, and
illustrate the costs of unemployment in one European country by calculating the lost
productivity, expressed as loss of earnings, in the UK.

12.4.1 Numbers of unemployed in Europe
The data presented in Chapter 12 on rates of employment and unemployment among
hearing impaired people in the US and UK can be used to estimate the numbers of
people in Europe who are unemployed as a result of their hearing loss. It is possible
to estimate the lost earnings for the current year in the UK, but there is insufficient
data available for a full consideration of other European countries. The data that is
required is information on employment rates of deaf and hard of hearing people
across Europe, and average earnings in different European countries.

The studies reviewed in Chapter 11 suggest that 65% of all hearing impaired people
are employed, compared with 75% of the general population. That is, hearing
impairment causes an additional 10% of unemployment over the unemployment.

Table 12.10 shows the total numbers of hearing impaired people in Europe, with
hearing loss of 25 dB or more, derived from the figures in Table 12.4.

      Table 12.10 Total numbers of hearing impaired people in Europe (BEHL≥25)

                                                 No. with
                                                BEHL ≥25
                           European Union       56,436,245
                           Rest of Europe       15,122,256
                           Total Europe         71,558,501

The figures in Table 12.10 are somewhat lower than the predictions by Davis
(1997;1999) of 81,536,000 people in Europe with hearing loss of over 25 dB by the
year 2005. Davis’ predictions were based upon population estimates and predicted
demographic changes in the population. In addition the figures in Table 12.10 are
based upon prevalence studies that did not include people over the age of 80, whereas
the estimates by Davis included people of all ages. It is therefore possible that the
following figures underestimate the extent of unemployment in Europe.

Assuming that 10% of the hearing impaired population are unemployed as a result of
their hearing impairment gives the figures shown in Table 12.11.

      Table 12.11 Numbers of people in Europe unemployed as a result of hearing
                                    impairment

                                             No. unemployed
                                              due to HL≥25
                         European Union         5,643,625
                         Rest of Europe         1,512,226
                         Total Europe           7,155,850

With data on average earnings in Europe it would be possible to calculate the loss of
earnings in a year due to hearing impairment, as calculated for the UK in the
following section. It can be seen that this would represent a very substantial cost.


164
165


12.4.2 Cost of unemployment in UK
Current data on average earnings is available for the UK. The current population of
the UK is 59,651,500; therefore the adult population (77.7%) is 46,349,215. The
numbers with hearing impairment of differing severities, calculated in the same way
as the European prevalence figures in Table 12.4, are as shown in Table12.12.

   Table 12.12 Estimates of numbers of adults in UK in four categories of hearing
                 impairment who would benefit from hearing aids

Grade of HI                     Mild*       Moderate     Severe      Profound      Total
Percentage of population         10.4          4.6         0.7          0.2
No. of people in UK           4,820,318     2,132,064    324,445      92,698     7,369,525
 * 25 to 39 dB BEHL

As with the European data the total number of hearing impaired people in the UK
shown in Table 12.12 is less than that predicted by Davis (1997; 1999), for the same
reasons as discussed above. (The figure predicted by Davis was 9,282,000.)

From Table 12.12 it can be seen that approximately 736,953 people in the UK may be
unemployed due to their hearing impairment. The average earnings in the UK in
2004 was approximately £24,500 (Office of National Statistics, 2005). Thus the loss
in earnings due to hearing impairment in 2004 in the UK, using this method of
calculation, is estimated to be approximately £18 billion, or 25.5 billion euros.

This figure represents only those who are unemployed. However, Chapter 11 showed
that many hearing impaired people are employed in lower status jobs and earn less
than hearing people with equivalent qualifications. Thus the total loss in earnings
would be considerably more than the calculated figure.


12.5 Costs of unaided hearing impairment
The studies of employment discussed in Chapters 11 do not give any information
about use of aids, and whether or not they decrease the likelihood of unemployment.
In this section the numbers of hearing impaired people used to estimate costs in the
sections 12.3 and 12.4 have been adjusted to disregard those who wear hearing aids.
In the quality of life approach this implies that the use of a hearing aid restores quality
of life to an unimpaired level, which is not the case. In evaluating the costs of
unemployment it suggests that a hearing aid user is as likely as a non hearing
impaired person to be employed, which is probably also an unreasonable assumption.
Thus these adjusted costs will be underestimates of the total costs of hearing
impairment especially as, in the case of unemployment costs, as discussed in section
12.4.2, they do not allow for underemployment and lower earnings of deaf and hard
of hearing people.

In order to eliminate people who wear aids from the calculations, the conclusion in
Chapter 6 that less than 1 in 4 people in Europe who need a hearing aid own one is
used to adjust the numbers in the previous sections. The numbers of unaided hearing
impaired people are thus assumed to be 75% of the total numbers of those who are
hearing impaired. From the discussion in Chapter 7 concerning use of hearing aids it
can be seen that this is also an underestimate as a large number of hearing aid owners
do not actually use their aids.


165
166


12.5.1 Quality of life approach
Reducing the numbers in all categories in Table 12.5 by 25% gives the numbers
shown in Table 12.13.

 Table 12.13 Estimates of numbers of adults in Europe in four categories of hearing
       impairment who would benefit from hearing aids and do not own them

          Grade of HI                            Mild*       Moderate     Severe/
                                                                         Profound
          Percentage of population                 10.4         4.6         0.7
          No. of people in EU                  27,685,704   12,245,600   2,395,879
          No. of people in rest of Europe       7,418,465    3,281,244    641,983
          No. of people in all Europe          35,104,170   15,526,844   3,037,862
         * 25 to 39 dB BEHL

Combining the numbers in Table 12.13 with the annual costs per person in Table 12.7
and adding over all grades of hearing impairment gives the total costs, in billions of
euros, shown in Table 12.14.

   Table 12.14 Total costs, in billions of euros, of unaided hearing impairment in
                                        Europe

                                                        Cost
                                                (billions of euros)
                              European Union            168
                              Rest of Europe             45
                              Total Europe              213

12.5.2 Costs of unemployment
In assessing the costs of unemployment, ignoring those who own a hearing aid, the
numbers of hearing impaired people to be considered are 75% of those shown in
Table 12.10, that is the numbers shown in Table 12.15.

      Table 12.15 Total numbers of hearing impaired people in Europe (BEHL≥25)
                                without hearing aids

                                                   No. unaided
                                                  with BEHL ≥25
                              European Union        42,327,183
                              Rest of Europe        11,341,692
                              Total Europe          53,668,875

Thus the numbers unemployed as a result of hearing impairment (ignoring those with
hearing aids) are as shown in Table 12.16 (10% of the numbers shown in Table
12.15).


166
167


Table 12.16 Numbers of unemployed hearing impaired people in Europe (BEHL≥25)
                             without hearing aids

                                               No. unaided and
                                               unemployed with
                                                  BEHL ≥25
                         European Union           4,232,718
                         Rest of Europe           1,134,169
                         Total Europe             5,366,888

The total number of unemployed hearing people without hearing aids in the UK is
estimated to be 75% of the total number given in Table 12.12, that is 5,527,144. Using
the previous argument it may be assumed that 10% of these, that is 552,714, are
unemployed as a direct result of their hearing impairment. Using the average earnings
in the UK of £24,500 gives the loss in earnings due to unaided hearing impairment in
the UK as £13.5 billion.


12.6 Conclusions
The data and calculations presented in this chapter show that the cost to Europe of
hearing impairment of all grades is 284 billion euros for the current year (2004), and
224 billion euros for the European Union. This figure has been arrived at by taking a
‘quality of life’ approach, which will account for overall effects, including the
psychosocial impacts of hearing loss. In arriving at this figure several assumptions
have been made regarding the prevalence of hearing impairment, the loss of health
utility due to hearing loss, and the appropriate value of a full quality life year to use in
this case.

By estimating the costs of lost productivity, or unemployment, in the UK it was found
that hearing impairment costs the country around £18 billion. The method of
calculation used here could be applied to the rest of Europe. This figure does not take
into account the lower earnings of hearing people who are employed. Thus the total
figure would be greater than the £18 billion estimated.

Considering the impact of unaided hearing impairment the costs are 213 billion euros
for the whole of Europe, based upon a quality of life approach. The costs of
unemployment in the UK of unaided hearing loss are estimated to be £13.5 billion.

The figures arrived at using both estimation methods are likely to be underestimates
as they do not include the population of Europe over the age of 80 who suffer from
hearing impairment. Furthermore, demographic changes mean that the relative
numbers of elderly people in Europe will increase significantly over the next 30 years,
and are likely to lead to increased proportions of the population who have hearing
impairment. Furthermore, underemployment and lower wages among hearing
impaired people are not accounted for.

Thus it can be seen, bearing in mind the fact that the costs calculated are likely to be
underestimates, that hearing impairment represents a very substantial cost to society.


167
168


CHAPTER 13             CONCLUSIONS AND DISCUSSION

13.1 Introduction
This report has presented the results of many studies concerned with prevalence of
hearing impairment, effects of hearing impairment, the extent of ownership and use of
hearing aids and their benefits, and the costs to society of hearing impairment. This
chapter highlights the main conclusions of the wide ranging literature review
contained in the report, discusses some of the issues raised and suggests where, in the
opinion of the author, further research and action is needed.


13.2 Main conclusions
The report has shown that at the current time around 22% of the population of Europe
are hearing impaired to a greater or lesser extent. The prevalence of hearing
impairment will increase as the population ages; it is estimated that in 20 years’ time
there will be approximately 100 million hearing impaired people in Europe.

The wide extent of hearing impairment has a major impact upon society. Among
sufferers it can cause loneliness, depression, and low self esteem. It affects family and
other close relationships, and hearing impaired people may experience prejudice and
abuse because of their disability. A problem often arises as the hearing impaired
person typically denies that there is a problem and therefore delays seeking help.

Research in the UK and Scandinavia has shown that, on average, around 3% of the
population own a hearing aid. This means that fewer than one in three people who
would benefit from an aid own one. Furthermore, of those who own aids typically
only two thirds use them. Thus many people are unnecessarily experiencing the
negative effects of hearing loss.

These numbers are particularly surprising when it is realised that the proportions of
hearing impaired people owning and using aids have not changed significantly for the
past 40 years. This is despite advances in technology which have improved the
performance and appearance of aids over the years.

Among those who do use hearing aids the majority are satisfied or very satisfied with
their performance. The perceived amount of benefit provided by an aid is related to
the amount of use and not to the degree of hearing loss. There is overwhelming
evidence that the use of hearing aids provides significant improvement to overall
quality of life. Apart from the obvious improvements in communication they can
improve self confidence, psychological functioning, health, social life and family
relationships. These benefits tend to occur early on in the wearing of aids and to last
throughout the time that aids are used.

Further evidence of the need to treat hearing loss as effectively as possible is seen in
the studies on costs to society of hearing impairment. Severe to profound deafness has
been shown to be one of the most expensive medical conditions, over a lifetime
costing more than strokes, epilepsy or schizophrenia. However there is little
information available on the societal costs of less severe hearing impairment. Data has
been found which shows that hearing impaired people are more likely to be


168
169


unemployed and, if employed, to earn less than their hearing counterparts. In addition
to the financial loss to the individual, the relatively high rate of unemployment among
hearing impaired people, and their working in jobs of lower status represent wasted
opportunities and a loss to society of necessary skills.

Taking account of the psychosocial effects of hearing impairment, and of lost
productivity in terms of unemployment, it has been shown that hearing impairment
causes a huge monetary loss to Europe.


13.3 Discussion
An overwhelming feature of the literature reviewed in this report is the consistency of
the results of the many studies considered. This is particularly noticeable where
results have been adjusted so that their presentation is consistent with that of other
studies. In all the aspects of hearing impairment considered, the conclusions reached
are supported by the findings of a great number of independent studies.

The review has, however, highlighted some areas of concern.

It is obvious that, despite the very large body of research in all areas of hearing
impairment, only (some) professionals involved in the area are aware of the findings.
In order to avoid the prejudice and stigma of hearing loss, there needs to be an
effective campaign of raising awareness among the general public of the effects of
hearing loss and the needs of hearing impaired people. One way in which this could
be achieved is by the use of high profile figures discussing hearing loss and the
importance of obtaining and wearing hearing aids. (The advantages of such a strategy
are highlighted by the increased uptake of hearing aids in the US when Bill Clinton
revealed that he wore an aid.) Only by publicity of the issues will the general public
become aware of and sympathetic towards the needs of hearing impaired people,
thereby reducing the stigma attached to hearing impairment.

As repeatedly pointed out during the report, nearly all the research that has been
published on the effects of hearing loss has concerned the elderly population.
Although not reviewed here, there is also a large body of information concerning
hearing impaired babies and children. However, there is a dearth of information
concerning teenagers and young adults. The general population does not expect young
people to be hearing impaired; it is a disability associated with ageing. This adds to
the stigma of hearing loss for young people. There is an urgent need for research to
be carried out to study the impact of hearing impairment among young people and
their particular needs and wishes regarding rehabilitation.

Finally, it is shocking that, despite ever improving hearing aid technology, so few aids
are owned and worn. The benefits of hearing aids have been demonstrated in many
research projects over many years, and the extent to which they can improve the
quality of life of hearing impaired people shown in many studies. The hearing aid
industry needs to promote the results of these studies among the hearing impaired
community, the general public and the medical profession. Quite apart from the costs
to society that could be reduced by appropriate prescribing and wearing of aids, it is a
tragedy that so many hearing impaired people are not taking advantage of the
improvements to their lives that hearing aids offer.


169
170


REFERENCES

M O Aguayo and N F Coady. The experience of deafened adults: implications for
rehabilitative services. Health and Social Work 26(4), 269-277, 2001

American Academy of Audiology. Facts on hearing loss. www.audiology.org

American Academy of Audiology. A white paper addressing the societal costs of
hearing loss and issues in third party reimbursement. www.audiology.org.

American Speech-Language-Hearing Association. www.asha.org

S Arlinger. Negative consequences of uncorrected hearing loss – a review.
International J of Audiology, 42 Supplement 2, 2s17-20, 2003

S Arlinger and E Billermark. One year follow up of users of a digital hearing aid.
British J. of Audiology 33(4), 223-232, 1999

S Barnett. Curbside consultation – A hearing problem. American Family Physician
66(5), 911-915, 2002

B Bech, B Christensen and A Parving. The Valby project. A survey of the hearing in
the elderly >= 80 years of age – provided with hearing aids. Scandinavian Audiology
25, 247-252, 1996

V Benson and M Murano. Current estimates from the National Health Interview
Survey, 1995. National Center for Health Statistics, Vital Health Statistics 10, 1998.

F H Berg. The minimally hearing impaired child. Ear and Hearing 6, 43-47, 1985

F Bess, M Lichtenstein, S Logan, M C Burger and E Nelson. Hearing loss as a
determinant of function in the elderly. J. American Geriatrics Society 37, 123-128,
1989

F Bess, M Lichtenstein and S Logan. Making hearing impairment functionally
relevant: linkages with hearing disablity and handicap. Acta Otolaryngologia Suppl
476, 226-231, 1991

F H Bess, J Dodd-Murphy and R A Parker. Children with minimal sensorineural
hearing loss: prevalence, educational performance, and functional status. Ear and
Hearing 19(5), 339-354, 1998

F H Bess. The role of generic health-related quality of life measures in establishing
audiological rehabilitation outcomes. Ear and Hearing 21(4), 74S-79S, 2000

Better Hearing Institute. Facts about hearing disorders. 1999 www.betterhearing.org

W Bradshaw. The employment situation and experiences of deaf and hard of hearing
people. RNID, May 2002.


170
171


S. Breadin. The effect of noise and acoustics on the perception of public places. MSc
thesis, South Bank University, 2000

J Bridges and R Bentler. Relating hearing aid use to well-being among older adults.
The Hearing Journal 51(7), 39-44, 1998

R H S van den Brink, H P Witt, G I J M Kempen and M J G van Heuvelen. Attitude
and help-seeking for hearing impairment. British J. of Audiology 30(5), 313-324,
1996

British Association of Teachers of the Deaf. Audiometric descriptors, BATOD
magazine, January 2001

British Society of Audiology, Descriptors for pure tone audiograms, British Journal of
Audiology 22, 123, 1988

D N Brooks. Hearing aid candidates - some relevant features. British J. of Audiology
13, 81-84, 1979

M E Capella. Comparing the occupational status of vocational rehabilitation
consumers who are deaf or heard of hearing in the general labour force. JADARA
36(2), 1-21, 2003

C Carabellese, I Appollonio, R Rozzini et al. Sensory impairment and quality of life
in a community elderly population. J. American Geriatics Society 41, 401-407, 1993

H L Chen. Hearing in the elderly. Relation of hearing loss, loneliness and self esteem.
Journal of Gerontol. Nursing 20(6), 22-28, 1994

A K Cheng and J K Niparko. Cost-utility of the cochlear implant in adults. Arch.
Otolaryngol. Neck Head Surgery 125, 1214-1218, 1999

Committee on Disabilities of the Group for the Advancement of Psychiatry. Issues to
consider in deaf and hard-of-hearing patients. American Family Physician 56(8),
2057-2068, 1997

R M Cox. Assessment of subjective outcome of hearing aid fitting: getting the client’s
point of view. International J of Audiology 42, S90-S96, 2003

R M Cox and I M Rivera. Predictability and reliability of hearing aid benefit
measured using the PHAB. J American Academy of Audiology 3, 242-254, 1992

R M Cox and G C Alexander. Maturation of hearing aid benefit: objective and
subjective measurements. Ear and Hearing 13, 131-141, 1992

R M Cox and G C Alexander. The abbreviated profile of hearing aid benefit. Ear and
Hearing 16, 176-186, 1995

R M Cox, G C Alexander, I M Taylor and G A Gray. Benefit acclimatization in
elderly hearing aid users. J American Academy of Audiology 7, 428-441, 1996


171
172


R M Cox and G C Alexander. Personality and the subjective assessment of hearing
aids. J American Academy of Audiology 10, 1-13, 1999a

R M Cox and G C Alexander. Measuring satisfaction with amplification in daily life:
the SADL scale. Ear and Hearing 20(4), 306-320, 1999b

R M Cox and G C Alexander. Expectations about hearing aids and their relationship
to fitting outcome. J American Academy of Audiology 11, 368-382, 2000

R M Cox and G C Alexander. Measuring satisfaction with amplification in daily life:
validation of the SADL scale. Ear and Hearing 22(2), 151- 160, 2001

R M Cox, M Hyde, S Gatehouse, W Noble, H Dillon et al. Optimal outcome
measures, research priorities and international cooperation. Ear and Hearing 21(4),
106S-115S, 1999

C Crandell. Hearing aids: their effects on functional health status. The Hearing
Journal 51(2), 2-6, 1998

K J Cruickshanks, T L Wiley, T S Tweed et al. Prevalence of hearing loss in older
adults in Beaver Dam, Wisconsin: The Epidemiology of Hearing Loss Study.
American Journal of Epidemiology 148(9), 1075-1078, 1998

Dallas Hearing Foundation. www.dallascochlear.com

B Danermark, S Antonson and I Lundstrom. Social inclusion and career development
– transition from upper secondary school to work or post-secondary education among
hard of hearing students. Scandinavian Audiology 30, Suppl 53, 120-128, 2001

M David and S E Trehub. Perspectives on deafened adults. American Annals of
Deafness 134, 200-204, 1989

W J Davies, T J Cox, A T Kearon, B J Longhurst and C L Webb. Hearing loss in the
built environment - the experience of elderly people. Acustica 87, 610-616, 2001

A Davis, K G Herbst and von Wedel. Discussion on paper by K R G Herbst, R
Meredith and S D G Stephens. Implications of hearing impairment for elderly people
in London and in Wales. Acta Otolaryngologia Suppl 476, 214, 1991

A C Davis. Longitudinal study of hearing. Acta Otolaryn Suppl 476, 12-22, 1991

A Davis, D Stephens, A Rayment and K Thomas. Hearing impairments in middle age:
the acceptability, benefit and cost of detection. British J. of Audiology 26(1), 1-14
1992

A Davis. Hearing in adults. The prevalence and distribution of hearing impairment
and reported hearing disability in the MRC Institute of Hearing Research’s National
Study of Hearing. Whurr publishers, 1995.


172
173


A Davis. Epidemiology. In A Kerr (ed): Scott-Brown’s Otolaryngology, (sixth
edition), Volume 2. Butterworth Heinemann, 1997

A Davis, C Yoshinaga-Itano and S Hind. Commentary: Universal newborn hearing
screening: implications for coordinating and developing services for deaf and hearing
impaired people. British Medical Journal 323, 539-540, 2001

A Davis. Population study of the ability to benefit from amplification and the
provision of a hearing aid in 55-74 year old first time hearing aid users. Int J
Audiology 42, 2S39-2S52, 2003

Deafness Forum. www.dest.gov.au/archive/highered.

H Dillon, G Birtles and R Lovegrove. Measuring the outcomes of a national
rehabilitation program: normative data for the client oriented scale of improvement
(COSI) and the hearing aid user’s questionnaire. J American Academy of Audiology
10, 67-79, 1999

J A Duijvestijn, L J Anteunis, C J Hoek, R H van de Brink, M N Chenau and J J
Manni. Help-seeking behaviour of hearing-impaired persons aged > 55 years; effect
of complaints, significant others and hearing image. Acta Otolaryngology 123(7),
846-850, 2003

C Dye and M Peak. Influence of amplification on the psychological functioning of
older adults with neurosensory hearing loss J. Academy of Rehabilitative Audiology
XVI, 210-220, 1983

M Eriksson-Mangold, A Aingdahl, A-K Bjorklund and B Wahlin. The active fitting
(AF) programme of hearing aids: a psychological perspective. BJA 24, 277-285, 1990

S I Erlandsson and K M Holgers. The impact of perceived tinnitus severity on health-
related quality of life with aspects of gender. Noise and Health 3(10), 39-51, 2001

A K Espmark, U Rosenhall, S Erlandsson and B Steen. The two faces of presbycusis:
hearing impairment and psychosocial consequences. International J of Audiology,
41(2), 125-135, 2002

European Commission. Directive 2003/10/EC of the European Parliament and of the
Council of 6 February on the minimum health and safety requirements regarding the
exposure of workers to the risks arising from physical agents (noise). Official Journal
of the European Union L042, 38-44, 15 February 2003

European Commission Environment Directorate-General. Assessment of mortality. In
report of ad hoc workshop of the methodology of analysing benefits reduced of air
pollution in the CAFÉ programme, 12 December 2003

H W Ewertsen. Use of hearing aids (always, often, rarely, never). Scandinavian
Audiology 3, 173-176, 1974


173
174


H M Fortum, A Q Summerfield, D H Marshall, A C Davis and J M Bamford.
Prevalence of permanent childhood hearing impairment in the United Kingdom and
implications for universal neonatal hearing screening: questionnaire based
ascertainment study. British Medical Journal 323, 536-540, 2001.

J R Franks and N J Beckmann. Rejection of hearing aids: attitudes of a geriatric
sample. Ear and Hearing 6(3), 161-166, 1985

Gallaudet Research Institute. Regional and National Summary Report of data from the
2001-2002 annual survey of deaf and hard of hearing children and youth. GRI,
Gallaudet University, USA, 2001

S Gatehouse. Glasgow hearing aid benefit profile. Derivation and validation of a
client centred outcome measure for hearing aid services. J American Academy of
Audiology 10, 80-103, 1999

S Gatehouse, G Naylor and C Elberling. Benefits from hearing aids in relation to the
interaction between the user and the environment. International J Audiology 42, S77-
S85, 2003

G A Gates, J C Cooper, W B Kannel et al. Hearing in the elderly. The Framingham
cohort, 1983-1985, Part 1, basic audiometric test results. Ear and Hearing 11(4), 247-
256, 1990

K R Gilholme-Herbst, R Meredith and S D G Stephens. Implications of hearing
impairment for elderly people in London and in Wales. Acta Otolaryngologia Suppl
476, 209-214, 1991

L. Glanopoulos, D. Stephens and A. Davis. (2002) Follow up of people fitted with
hearing aids after adult hearing screening; the need for support with fitting. BMJ 325,
471, 2002

W Golabek, M Nowakowska, H Siwiec and s D G Stephens. Self-reported benefits of
hearing aids by the hearing impaired. British J. Audiology 22, 183-186, 1988

J Graham and M Martin (ed). Ballantyne’s Deafness, Sixth edition. Whurr Publishers,
2001

S Gregory. The Deaf Child and His Family. George Allen and Unwin, 1976.
(Republished in 1995 as Deaf Children and Their Families, Cambridge University
Press)

S Gregory, J Bishop and L Sheldon. Deaf Young People and Their Families.
Cambridge University Press, 1995

S Gregory. Deaf young people: aspects of family and social life. Chapter 7 in M
Marschark and M D Clark (ed), Psychological Perspectives on Deafness, Volume 2.
Lawrence Erlbaum Assoc, 1998


174
175


A Grimby and A Ringdahl. Does having a job improve the quality of life among post-
lingually deafened Swedish adults with severe-profound hearing impairment? British
J. of Audiology 34(3), 187-195, 2000

L R-M Hallberg. Occupational hearing loss. Scandinavian Audiology 25, Suppl 43,
25-33, 1996

L Hallberg. Is there a gender difference in coping, perceived disability and handicap
in patients with noise-induced hearing loss? Noise and Health 2, 66-72, 1999

L R M Hallberg and G Jansson. Women with noise-induced hearing loss: an invisible
group? British J. of Audiology 30(5), 340-345, 1996

E L Harless and F McConnell. Effects of hearing aid use on self concept in older
persons. J. Speech and Hearing Disorders 47, 305-309, 1982

J P Harris, J P Anderson and R Novak. An outcomes study of cochlear implants in
deaf patients. Arch. Otolaryngol. Neck Head Surgery 121, 398-404, 1995

H Hauland and A Gronninguter. Uniting divided worlds: Identity, family and
education in the life projects of deaf and hard of hearing people. Disability Studies
Quarterly 23(2), 75-88, 2003

Health and Safety Executive. Proposal for a physical agents (noise) directive. Revised
regulatory impact assessment. www.hse.gov.uk/ria/noise, 2003

Hear This Organisation, 2002. www.hearthisorg.com

Hearing Research Trust. Defeating Deafness, 2001. www.defeatingdeafness.org

K R G Herbst, R Meredith and S D G Stephens. Implications of hearing impairment
for elderly people in London and in Wales. Acta Otolaryngologia Suppl 476, 209-214,
1991

K Herbst and C Humphrey. Hearing impairment and mental state in the elderly living
at home. BMJ 281, 903-905, 4 October 1980

R Hetu, L Riverin, L Getty, M N Lalande and C St-Cyr. The reluctance to
acknowledge hearing difficulties among hearing impaired workers. British J. of
Audiology 24(4), 265-276, 1990

R Hetu, L Jones and L Getty. The impact of acquired hearing impairment on intimate
relationships: implications for rehabilitation. Audiology 32, 363-381, 1993

R Hetu. The stigma attached to hearing loss. Scandinavian Audiology 25, Suppl 43,
12-24, 1996

A Hietanen, P Era, M Sorri and E Heikkinen. Changes in hearing in 80-year old
people: a 10-year follow-up study. Int J Audiology 43(3), 126-135, 2004


175
176


J Jerger and D Hayes. Hearing aid evaluation: clinical experiences with a new
philosophy. Arch. Otolaryngology 102, 214-225 1976

M S K Johansson and S D Arlinger. Prevalence of hearing impairment in a population
in Sweden. Int J Audiology 42, 18-28, 2003

M A Joore, D E M Brunenberg, M N Chenault and L J C Anteunis. Societal effects
of hearing aid fitting among the moderately hearing impaired. International J of
Audiology 42, 152-160, 2003

T S Kapteyn. Factors in the appreciation of a prosthetic rehabilitation. Audiology 16,
446-452, 1977a

T S Kapteyn. Satisfaction with fitted hearing aids: I. An analysis of technical
information. Scandinavian Audiology 6, 147-156, 1977b

T S Kapteyn. Satisfaction with fitted hearing aids: II. An investigation into the
influence of psycho-social factors. Scandinavian Audiology 6, 171-177, 1977c

B Karlsmose, T Lauritzen, M Engberg and A Parving. A five year longitudinal study
of hearing in a Danish rural population aged 31 to 50 years. British J Audiology
34(1), 47-55, 2000

R Keren, M Helfand, C Homer, H McPhillips and T A Lieu. Projected cost-
effectiveness of statewide universal newborn hearing screening. Pediatrics 110(5),
855 – 895, 2002

P Kerr and R Cowie. Acquired deafness: a multidimensional experience. British J. of
Audiology 31, 177-188, 1997

J F Knutson and C R Lansing. The relationship between communication problems and
psychological difficulties in persons with profound acquired hearing loss. J Speech
Hear Disord 55, 656-664, 1990

S Kochkin. MarkeTrak III: Why 20 million in US don’t use hearing aids for their
hearing loss. Hearing Journal 46(1), 20-27; 46(2), 26-31; 46(4), 36-37, 1993

S Kochkin. MarkeTrak IV: Impact on purchase intent of cosmetics, stigma, and style
of hearing instrument. Hearing Journal 47(9), 29-36, 1994

S Kochkin. MarkeTrak IV: Correlates of hearing aid purchase intent. Hearing Journal
51(1), 30-41, 1998

S Kochkin. MarkeTrak V: Why my hearing aids are in the drawer: the consumer’s
perspective. The Hearing Journal 53(2), 34-42, 2000

S Kochkin. The VA and direct mail sales spark growth in hearing aid market. The
Hearing Review 8(12), 16-24, 63-65, 2001


176
177


S Kochkin. 10-year customer satisfaction trends in the US hearing instrument market.
The Hearing Review 9(10), 14-25, 46, 2002a

S Kochkin. Consumer rate improvements sought in hearing instruments. The Hearing
Review 9(11), 18-22, 2002b

S Kochkin. On the issue of value: hearing aid benefit, price, satisfaction and brand
repurchase rates. The Hearing Review 10(2), 12-25, 2003

S Kochkin and C M Rogin. Quantifying the obvious: the impact of hearing
instruments on quality of life. The Hearing Review 7(1), 6-34, 2000

N M Lalande, J Lambert and L Riverin. Quantification of the psychosocial
disadvantages experienced by workers in a noisy industry and their nearest relatives:
perspectives for rehabilitation. Audiology 27, 196-206, 1988

C Lundeen. Prevalence of hearing impairment among children. Language, Speech and
Hearing Services in Schools, 22, 269-271, 1991

M L Marazita, L M Ploughman, B Rawlings, E Remington, K S Arnos and W E
Nance. Genetic epidemiological studies of early-onset deafness in the US school-age
population. American Journal of Medical Genetics 46, 486-491, 1993

M Marschark and M D Clark (ed), Psychological Perspectives on Deafness, Volume
2, Lawrence Erlbaum Assoc, 1998

M. Martin. Speech Recognition and Hearing Impairment. COST 219 Seminar ‘Speech
and Hearing Technology’, Cottbus, Germany, November 2000

A Martini (ed). European Working Group on genetics of hearing impairment,
European Commission Directorate, Biomedical and Health Research Programme
(HEAR) Infoletter 2, November 1996 www.gendeaf.org

L McKenna. Psychological aspects of acquired hearing loss. In Ballantyne’s Deafness
(Sixth edition), ed J Graham and M Martin, 2001

P E Mohr, J J Feldman and J L Dunbar. The societal costs of severe to profound
hearing loss in the United States. Project Hope Center for Health Affairs, H Series
2(1), April 2000a.

P E Mohr, J J Feldman, J L Dunbar, A McConkey-Robbins, J K Niparko, R K
Rittenhouse and M W Skinner. The societal costs of severe to profound hearing loss
in the United States. International Journal of Technology Assessment in Health Care,
16(4), 1120-1135, 2000b

R L Mowry. Quality of life indicators for deaf and hard of hearing former VR clients.
J of Rehabilitation of the Deaf 21(3), 1-7, 1988

C Mulrow , C Aguilar, J Endicott et al. Association between hearing impairment and
quality of life of elderly individuals J. American Geriatics Society 38, 45-50, 1990a


177
178


C Mulrow, C Aguilar, J Endicott et al. Quality of life changes and hearing
impairment. Annals of Internal Medicine 3, 188-194, 1990b

C Mulrow , M Tuley and C Aguilar. Sustained benefits of hearing aids. J. Speech and
Hearing Research 35, 1402-1405, 1992

National Centre for Health Statistics. Series 10, no 205, 1998

National Center on Hearing Assessment and Management, www.infanthearing.org.

The National Council on the Aging. The consequences of untreated hearing loss in
seniors, May 1999.

National Deaf Children’s Society. Understanding Deafness, January 2003.

National Institute for Clinical Excellence. Technology appraisal guidance no 8:
Guidance on hearing aid technology. July 2000 (now withdrawn)

National Institute on Deafness and Other Communication Disorders (NIDCD).
Statistics on Hearing. www.nidcd.nih.gov/health/statistics/hearing.asp

J K Niparko, A K Cheng and H W Francis. Outcomes of cochlear implantation:
assessment of quality of life impact and economic evaluation of the benefits of the
cochlear implant in relation to costs. In J K Niparko (ed) Cochlear implants –
principles and practices, Lippincott Williams and Wilkins, 2000.

A S Niskar, S M Kieszak, A Holmes, E Esteban, C Rubin and D J Brody. Prevalence
of hearing loss among children 6 to 19 years of age. The third national health and
nutrition examination survey. J. American Medical Association 279(140, 1071-1075,
1998.

W Noble. What is a psychosocial approach to hearing loss? Scandinavian Audiology
25, Supplement 43, 6-11, 1996

Office of Hearing Services. Client satisfaction and hearing aid survey. Government
Department of Health and Ageing, Australia, October 2001

Office of Hearing Services. Top-up survey. Government Department of Health and
Ageing, Australia, October 2002

G. O’Neill. Hearing loss –a growing problem that affects quality of life. Profile 2.
National Academy on an Aging Society, December 1999. www.agingsociety.org

H Oyer and E Oyer. Social consequences of hearing loss for the elderly. Allied
Health and Behavioural Sciences 2(2), 123-138, 1979

C Palmer, J Niparko, R Wyatt, M Rothman and G Lissovoy. A prospective study of
the cost-utility of the multichannel cochlear implant. Arch. Otolaryngol. Neck Head
Surgery 125, 1221-1228, 1999


178
179


A Parving, P Sibelle and H West. An audit of hearing aid quality in Denmark. British
J. of Audiology 26(4), 239-244, 1992

A Pearson, Consultant in museum education and disability issues. Personal
communication, 2003.

M M Popelka, K J Cruickshanks, T L Wiley, T S Tweed and B E K Klein. Low
prevalence of hearing aid use among older adults with hearing loss: the epidemiology
of hearing loss study. J American Geriatric Society 46, 1075-1078, 1998

A Quaranta, G Assennato and V Sallustio. Epidemiology of hearing problems among
adults in Italy. Scandinavian Audiology 25, Suppl 42, 7 –11, 1996

P Rabbit. Mild hearing loss can cause apparent memory failures which increase with
age and reduce with IQ. Acta Otolaryngologia Suppl 476, 167-176, 1991

P W Ries. Prevalence and characteristics of persons with hearing trouble: United
States 1990-1991. National Center for Health Statistics, Series 10. No 188, 1994

RNID. Breaking the sound barrier. Can you hear us? Deaf people’s experience of
social exclusion, isolation and prejudice. RNID, 1999

RNID. Deafness, employment and discrimination, 2000

RNID. (W Bradshaw) The employment situation and experiences of deaf and hard of
hearing people. May 2002.

RNID. Facts and figures on deafness and tinnitus. January 2003. www.rnid.org

RNID. The experience of employers – research into deafness and employment. RNID,
2002

T Robillard and M Gillain. Hearing aids: statistical study and satisfaction survey of
patients in an ENT practice. Acta Oto-rhino-laryngologica Belg. 50, 115-120, 1996

U Rosenhall, K Pedersen and M B Moller. Self-assessment of hearing problems in an
elderly population. Scandinavian Audiology 16, 211-217, 1987

U Rosenhall, R Jonsson, A Davis and A Parving. Hearing in the ‘oldest old’ – a
cross-sectional collaborative study from three European countries. J Audiological
Medicine 9(1), 43-52, 2000

R J Ruben. Redefining the survival of the fittest: communication disorders in the 21st
century. Laryngoscope 111(6), 1115-1116, 2001

D Rutman. The impact and experience of adventitious deafness. American Annals of
Deafness 134, 305-311, 1989


179
180


G Salomon, V Vesterager and M Jagd. Age related hearing difficulties. I. Hearing
impairment, disability and handicap – a controlled study. Audiology 27, 164-178,
1988

J Schein and M Delk. The deaf population of the United States. National Association
of the Deaf, 1974

D J Schum. Perceived hearing aid benefit in relation to perceived needs. J American
Academy of Audiology 10, 40-45, 1999

P Sibelle and A Parving. An audit of hearing aid quality in Denmark II: type of
defects. British J. of Audiology 28(3), 141-148, 1994

L Smeeth, A E Fletcher, E S Ng, S Stirling, M Nunes, E Breeze, C Bulpitt, D Jones
and A Tulloch. Reduced hearing, ownership, and use of hearing aids in elderly people
in the UK – the MRC trial of the assessment and management of older people in the
community: a cross-sectional survey. The Lancet 359, 1466-1470, 2002

A W Smith. The World Health Organisation and the prevention of deafness and
hearing impairment caused by noise. Noise and Health 1, 6-12, 1998

M Sorri, B Brorsson, A David, I Mair, K Myhre, A Parving, R Roine, U Rosenhall
and S Stilven. Hearing impairment among adults. Report of a joint (Nordic-British)
project. Finnish Office for Health Care Technology Assessment, Helsinki, 2001.

S D G Stephens, L J Barcham, A L Corcoran and N Parsons. Evaluation of an
auditory rehabilitation scheme. In IG Taylor and A Markides (eds) Disorders of
auditory function III, London: Academic Press, 1980

S D G Stephens, P A Lewis, M C Charny, S C Farrow and M Francis. Characteristics
of self-reported hearing problems in a community survey. Audiology 29, 93-100,
1990

S D G Stephens, R Meredith, D E Callaghan, S Hogan and A Rayment. Early
intervention and rehabilitation: factors influencing outcome. Acta Otolaryngology
Suppl 476, 221-225, 1991

A Q Summerfield and D H Marshall. Cochlear implantation in the UK 1990 – 1994.
London: HMSO, 1995

A Q Summerfield, D H Marshall, G R Barton and K E Bloor. A cost utility analysis of
bilateral. cochlear implantation. Arch. Otolaryngol. Neck Head Surgery 128, 1255-
1262, 2002

R K Surr, G I Schuchman and A A Montgomery. Factors influencing use of hearing
aids. Arch Otolaryngol 104, 732-736, 1978

A Thomas and K G Herbst. Social and psychological implications of acquired
deafness for adults of employment age. British J. of Audiology 14(3), 76-85, 1980


180
181


S Uimonen, K Huttunen, K Jounio-Ervasti and M Sorri. Do we know the real need for
hearing rehabilitation at the population level? Hearing impairments in the 5- to 75-
year old cross-sectional Finnish population. British J Audiology 33(1), 53-59, 1999

V Vesterager, G Salomon and M Jagd. Age related hearing difficulties. II.
Psychological and sociological consequences of hearing problems – a controlled
study. Audiology 27, 179- 192, 1988

V Vesterager and G Salomon. Psychosocial aspects of hearing impairment in the
elderly. Acta Otolaryngologia Suppl 476, 215-220, 1991

M I Wallhagen, W J Strawbridge, R D Cohen and G A Kaplan. An increasing
prevalence of hearing impairment and associated risk factors over three decades of the
Alameda County study. American Journal of Public Health 87(3), 440-442, 1997.

P Walsh, L Sanchez, A Davis, G Tucker, D Wilson, A Taylor and Meagher. The
epidemiology of hearing impairment in an Australian adult population. International J
Epidemiology 28(2), 247-252, 1999

B Weinstein and I Ventry. Hearing impairment and social isolation in the elderly. J.
Speech and Hearing Research 25, 593-599, 1982

T L Wiley, K J Cruickshanks, D M Nondahl and T S Tweed. Self-reported hearing
handicap and audiometric measures in older adults. J American Academy of
Audiology 11, 67-75, 2000

B Y K Wong, Y Hui and A W Wei. Economic evaluation of cochlear implantation. In
C S Kim, S O Chang, D Lim (eds) Updates in cochlear implantation. Adv
Otorhinolaryngol. 57, 377-381, Basel, Karger 2000.

World Health Organisation. Facts about deafness www.who.int/pdb/deafness/facts

World Health Organisation. Report of informal working group on Prevention of
Deafness and Hearing Impairment Programme planning, WHO Geneva, 1991.

World Health Organisation. Report of the first informal consultation on future
programme developments for the Prevention of Deafness and Hearing Impairment.
WHO, Geneva, January 1997.

World Health Organisation. Guidelines for Community Noise, 1999

World Health Organisation. Deafness and Hearing Impairment Survey. Report of
consultative meeting of principal investigators, WHO Project ICP DPR 001, New
Delhi, July 2001. www.who.org

World Health Organisation. Prevention of deafness and hearing impairment. April
2002, www.who.org

J R Wyatt and J K Niparko. Evaluating the cost effectiveness of hearing
rehabilitation. In C W Cummings, J M Frederickson, L A Harker, C J Krause and D E


181
182


Schuller (eds): Otolaryngology – Head and Neck Surgery Update, 2nd edition, St
Louis, Missouri:Mosby Year Book Inc, 112-125, 1995

J R Wyatt, J K Niparko, M Rothman and G deLissovoy. Cost-utility of the
multichannel cochlear implant in 258 profoundly deaf indivduals. Laryngoscope 106,
816-821, 1996


182
183


APPENDIX I            PREVALENCE OF HEARING IMPAIRMENT
                      AMONG CHILDREN AND YOUNG ADULTS

A1.1 Introduction
The main report is concerned with aspects of hearing loss among adults. However, in
the course of the research some related literature concerning prevalence among
children and young adults has been reviewed, and is summarised in this Appendix. It
should be noted that this does not represent an exhaustive search of the literature
concerning prevalence of hearing impairment among children and young people.
There is a great deal of literature on this topic of which only a small sample is
reviewed here. However, it is relevant to the discussion in the main report on
prevalence among adults as hearing impaired children grow into hearing impaired
adults. Also the introduction of neo natal screening for hearing loss will enable more
accurate predictions of the numbers of hearing impaired adults in the future.

Most of the data that is presented here is from studies in the US and UK, but it is
assumed that similar figures would apply to Europe.


A1.2 Babies and children in the US
Data from the US suggest that hearing loss is the most commonly occurring birth
defect affecting three out of every 1000 newborn babies (National Center on Hearing
Assessment and Management (NCHAM)). Of these, 1 in 1000 (that is 33 per day) are
born profoundly deaf and the remainder have partial hearing loss (American Academy
of Audiology).

It is reported that over 12,000 babies in the US leave hospital each year with
undetected hearing loss, and that 500,000 young children develop profound hearing
loss before learning a spoken language (Hear This Organisation, 2002).
Approximately 1,465,000 individuals aged 3 and over are deaf in both ears (ASHA).
Marazita et al (1993) report that in the US, profound early-onset deafness is present in
4-11 per 10,000 children. Children's deafness is attributable to sporadic causes in
37.2% of cases and genetic causes in 62.8% of cases.

The ASHA website reports data from several sources on prevalence of hearing loss
among children. It is estimated that over 1 million children, that is 5% of children
aged 18 and under, have some form of hearing loss. One in every 1000 infants born
has severe or profound hearing loss (NIDCD) while 83 out of every 1000 children
have hearing loss sufficient to affect their education. Earlier research published in
1974 reported severe to profound hearing loss in about 9 of every 1000 school age
children (Schein and Delk, 1974).

ASHA also cites research (Berg, 1985; Lundeen, 1991) which shows that among
every 1000 school age students in US seven have bilateral and 16 to 19 have
unilateral hearing loss that may significantly interfere with their education.

Detailed breakdown of statistical data on hearing impairment among young people is
provided by the annual survey of deaf and hard of hearing children and young people
carried out each year by the Gallaudet Research Institute (GRI). The most recent


183
184


published data is that for the year 2001-2002, which considers statistics relating to
42,361 hearing impaired students (GRI, 2001).

The age distribution of hearing impairment among this age group for 2001-2002 is
shown in Table A1.1 (information available for 41,597 students).

          Table A1.1 Age distribution of hearing impaired students (GRI, 2001)

          Age (years)   <3        3-5      6-9      10-13      14-17     ≥ 18
          Number        1063      3764     9347     12062      11253     4108
          Percentage    2.6       9.0      22.5     29.0       27.1      9.9

The degree of hearing loss (out of a total of 36,701 students for whom information
was available) from the GRI data is shown in Table A2.2.

      Table A2.2 Hearing loss distribution of hearing impaired students (GRI, 2001)

                                                    Moderate
      Hearing loss   Normal    Mild      Moderate               Severe     Profound
                                                    -severe
      dB HL          < 27      27-40     41-55                  71-90      ≥ 91
                                                    56-70
      Number         5945      4307      4714       4446        5681       11608
      Percentage     16.2      11.7      12.8       12.1        15.5       31.6

Note that the biggest percentage of students taking part in this survey is profoundly
deaf.

Information on the frequency characteristics of hearing loss common among children
is provided by Niskar et al (1998) who report the results of audiometric screening of
6166 children aged 6 to 19 between 1988 and 1994. Hearing loss was defined as an
audiometric threshold value of at least 16 dB hearing level based on a low or high
pure tone average. 14.9% of children were found to have low frequency or high
frequency loss, 7.1% had low frequency loss and 12.7% high frequency loss. Most
hearing loss was unilateral and slight in severity, from 16 to 25 dB.


A1.3 Babies and children in the UK
In the absence of a national register of hearing impaired children in the UK it is
thought that studies carried out prior to 1998 have underestimated their number
(Fortnum et al, 2001).

Figures currently published in the UK show that around 20,000 children aged 0 – 15
years are moderately to profoundly deaf (RNID, 2003). Of these, around 12,000 are
born deaf, that is, they are prelingually deaf, and so have special educational needs. It
is suggested that 840 children with moderate to profound deafness are born every year
in the UK, and that the total number of deaf children and young people is over 30,000.

The RNID also states that around 1 in 1000 three year olds are deaf and that this
number rises to 2 in every 1000 at age nine to sixteen. These figures appear to be
based upon the work of Fortnum et al (2001) who in 1998 carried out a large scale
study of the prevalence of hearing impairment among children in the UK. This study
involved surveying over 17,000 cases of children aged 16 and under with permanent


184
185


childhood hearing impairment (defined as a hearing level in the better ear, averaged
over 0.5, 1, 2 and 4 kHz) of more than 40 dB HL.

From their study Fortnum et al estimate the prevalence of hearing impairment to be
1.07% of three year olds, rising to 2.05% for children aged nine to sixteen. They
conclude that the prevalence of confirmed hearing impairment among children
increases until the age of 9 years. Possible reasons for the increase are non-diagnosis
in early screening; post natal acquisition of hearing impairment; and (most likely) late
onset of progressive hearing impairment. For every ten children diagnosed at birth
they estimate that another five to nine will be identified with hearing impairment by
the age of nine.


A1.2 Screening for hearing loss
In both the US and UK newborn hearing screening programmes have gradually been
introduced in recent years.

In 1993 the National Institute of Health recommended that all infants in the US should
be screened for hearing impairment; ideally this should be accomplished by screening
before newborn babies leave hospital (NCHAM). Screening is currently required by
legislation in 37 states, of which it has been implemented in over 20; this number is
increasing.

The NCHAM presents data from the universal newborn hearing screening (UNHS)
programme on the numbers of newborn babies and percentages screened in each state.
Data for January 2003 (published May 2003) showed that percentages varied from
57.7% of newborn babies screened in California to 99.5% in Washington DC. Of the
total number of babies (4,025,933) born in 2002, 86.5% were screened for hearing
impairment. This compares with only 22% of babies being screened before they were
1 month old in 1998 (American Academy of Audiology).

Universal newborn hearing screening has also been started by the UK Department of
Health with pilot implementation in seventeen areas (Davis et al, 2001). The scheme
is intended to cover all areas by 2005 (National Deaf Children’s Society, 2003).
However, Davis et al (2001) consider that more effective screening of school age
children from aged from four to sixteen in the UK is required.

It has been found since the introduction of screening in the US that previous estimates
of the numbers of babies born with hearing loss were inaccurate. The previous
standard estimate was of 1 in 1000 live births with congenital hearing loss whereas, as
seen above, current estimates based on more recent data suggest that the actual figure
is 2 to 3 per 1000 live births (American Academy of Audiology). This number of
course does not include children born with normal hearing who have late-onset or
progressive hearing loss.


A1.3 Age of identification of hearing loss
In 1988, before the widespread introduction of newborn screening in the US, the
Commission on Education of the Deaf, in a report to Congress and President, found
that the average age of identification of hearing loss was 2.5 to 3 years of age.


185
186


However many cases were not identified until the age of 5 or 6, with consequent
effects upon the development of language, social and cognitive skills, according to the
NCHAM. More recent data published between 1987 and 1993 and cited by the
NCHAM suggests that age of identification in that period has been reducing over the
years to around 18 months.

In the 2001-2002 survey of over 40,000 hearing impaired students carried out by the
Gallaudet Research Institute (GRI, 2001) it is interesting to note that approximately
17,000 (42%) had been identified as hearing impaired at birth, and nearly 8000
(19.2%) under the age of 3 years.


186
187


  APPENDIX 2                 PREVALENCE                   DATA          FROM              EUROPEAN
                             STUDIES

  A2.1 Introduction
  This Appendix presents a sample of the data on prevalence of hearing impairment
  from some of the studies reviewed in Chapter 3.

  A2.2 Prevalence of hearing impairment in UK (Davis, 1995)
  Davis (1995) presents the data from the National Study of Hearing according to many
  different categories, eg gender, age, occupation etc.

  Table A2.1 shows the prevalence of hearing impairment among all subjects (N =
  2663) in all age groups, in 5 dB hearing loss bands. Tables A2.2 and A2.3 show a
  subset of the data for male (N = 1277) and female (N = 1386) subjects respectively.

               Table A2.1 Prevalence of hearing impairment among all subjects

                                                Threshold dB HL ≥
Age     0     5     10     15     20      25     30     35     40     45      50    55     65    75    85    95
18-
      93.4   72.1   49.9   32.7   22.6   16.1    11.2   8.2    5.8    3.9    2.9    2.1    1.1   0.7   0.4   0.2
80
18-
      82.6   43.0   18.7   6.9    2.6    1.8     0.6    0.4    0.2    0.2    0      0      0     0     0     0
30
31-
      92.8   60.5   26.9   13.8   5.6    2.8     2.3    1.4    1.1    1.1    1.0    0.8    0.7   0.7   0.6   0.6
40
41-
      97.4   74.6   48.3   25.2   13.5   8.2     6.0    4.0    2.3    1.7    1.2    0.7    0.3   0.3   0.1   0.1
50
51-
      98.7   90.8   68.9   43.3   28.8   18.9    11.0   7.8    5.6    4.0    2.9    2.1    0.9   0.4   0.1   0.1
60
61-
      100    97.7   86.3   65.1   50.8   36.8    25.3   16.2   10.7   7.4    5.7    4.1    2.3   1.4   1.0   0.6
70
71-
      99.6   99.6   95.5   87.1   74.0   60.3    47.0   40.0   29.7   17.6   12.4   9.3    4.0   2.5   1.0   0.1
80


              Table A2.2 Prevalence of hearing impairment among male subjects

                                                  Threshold dB HL ≥
                              Age         25       30     35     45           55
                             18-80       17.9     12.2    8.8    4.0         2.3
                             18-30        0.6      0.1    0.1    0.1         0.1
                             31-40        2.5      2.5    1.6    1.3         1.1
                             41-50        9.6      6.9    4.4    1.8         0.5
                             51-60       24.6     14.1   10.3    5.4         2.8
                             61-70       44.8     31.3   19.6    9.2         4.8
                             71-80       67.7     49.2   41.5   15.4         10.2


  187
188


        Table A2.3 Prevalence of hearing impairment among female subjects

                                              Threshold dB HL ≥
                        Age          25        30     35     45        55
                       18-80        14.6      10.3    7.8    3.7       1.9
                       18-30         2.9       1.2    0.6    0.3       0.0
                       31-40         2.9       2.0    1.2    0.8       0.4
                       41-50         7.1       5.2    3.8    1.7       1.0
                       51-60        12.9       7.9    5.3    2.6       1.5
                       61-70        28.6      18.6   12.9    5.5       3.3
                       71-80        55.5      45.5   38.7   18.7       9.1


A2.3 Prevalence of hearing impairment in Italy (Quaranta et al, 1996)
Quaranta et al (1996) give the prevalence of hearing impairment among 2170 adults,
according to age group, for the better and worse ears. The prevalence according to
BEHL is shown in Table A2.4.

       Table A2.4 Prevalence of hearing impairment in Italy according to age

                                                Better ear hearing
                       Age group                    threshold
                                            ≥25    ≥45      ≥65    ≥90
                       18 – 30             1.85   0.56     0      0
                       31 – 40             3.89   1.11     0.56   0.28
                       41 – 50             8.29   1.46     0.49   0.24
                       51 – 60             18.73 4.13      1.38   0.28
                       61 – 70             37.66 6.65      2.85   1.27
                       71 - 80             69.44 21.11 4.44       0
                       Overall             17.05 4.01      1.20   0.32


A2.4 Changes in hearing from 80 to 90 years in Finland (Hietanen et al, 2004)
Hietanen et al (2004) reported results of a 10 year longitudinal study to investigate
changes in hearing in people aged 80 at start. Hearing was tested three times at five
year intervals. Tables A2.5 and A2.6 show the distributions of grades of hearing
impairment at ages 80, 85 and 90, analysed cross sectionally (Table A2.5) and
longitudinally (Table A2.6).

         Table A2.5 Grades of hearing impairment (cross sectional analysis)

                                        Hearing impairment category
                                                                            Severe-
                             None              Mild       Moderate
                                                                           profound
                       M         F         M      F      M      F        M       F
          80 (n=202)   1.8       13.1      43.9   56.6   50.9   28.3     3.5     2.1
          85 (n=91)    -         10.6      24.0   33.3   64.0   53.0     12.0    3.0
          90 (n=42)    -         3.0       11.1   24.2   88.9   72.3     -       -


188
189


           Table A2.6 Grades of hearing impairment (longitudinal analysis)

                                        Hearing impairment category
                                                                              Severe-
                              None            Mild        Moderate
                                                                             profound
                        M        F         M      F      M       F         M       F
           80 (n=36)    -        11.1      55.6   63.0   44.4    25.9      -       -
           85 (n=36)    -        11.1      33.3   37.0   66.7    51.9      12.0    -
           90 (n=36)    -        3.7       11.1   25.9   88.9    70.4      -       -


A2.5 Prevalence in Finland (Uimonen et al, 1999)
Uimonen et al (1999) examined prevalence of hearing impairment among all age
groups from 2 to 75. They classified their results according to both the 1991 WHO
and the current EU grades, shown in Tables A2.7 and A2.8 respectively.

 Table A2.7 Prevalence as a function of age according to 1991 WHO classification
                                                   BEHL
      Age
               N                     26-40        41-60         61-80
      group            <=25 dB                                               >=81 dB    All HI
                                     dB           dB            dB
      5        397     100
      10       428     99.8          0.2                                                0.2
      15       403     99.3                       0.5                        0.2        0.7
      25       286     99.6          0.4                                                0.4
      35       364     98.9          0.6          0.3                        0.3        1.2
      45       443     98.6          1.1                        0.2                     1.3
      55       421     95.7          3.1          1.0           0.2                     4.3
      65       430     90.0          7.4          2.1           0.5                     10.0
      75       382     67.5          20.8         8.2           2.6          0.8        32.5

       Table A2.8 Prevalence as a function of age according to EU classification

      Age                                          BEHL
               N
      group            <=20 dB       21-39 dB     40-69 dB      70-94 dB     >= 95 dB   All HI
      5        397     98.7          1.3                                                1.3
      10       428     99.8          0.2                                                0.2
      15       403     99.0          0.5          0.2                        0.2        0.9
      25       286     99.3          0.4          0.4                                   0.8
      35       364     98.1          1.7                                     0.3        2.0
      45       443     93.5          6.1          0.5                                   6.6
      55       421     84.1          14.0         1.7           0.2                     15.9
      65       430     62.7          31.2         5.8           0.2                     37.2
      75       382     35.5          45.1         16.7          2.7                     64.5


189
190


A2.6 Prevalence in a rural Danish population (Karlsmose et al, 1999)
Karlmose et al (1999) report results of a questionnaire survey concerning perceived
hearing problems, and audiometric surveys of a rural population aged from 31 to 50 in
Denmark, shown in Tables A2.9 and A2.10.

 Table A2.9 Prevalence (%) of hearing problems as function of age and gender (in
 answer to question ‘Have you experienced any hearing problems in the last year?)

                                                   Age group
                                  31-40               41-50                     31-50            All
                             M         F           M        F              M         F         N=1392
                           N=339     N=368       N=329 N=356             N=668     N=724
              No            85.5      91.0        76.6     88.8           81.1      89.9         85.7
      Problems not
      restricting daily     12.7          6.5      19.5        8.4       16.0           7.5      11.6
      activities
      Problems
      restricting daily     1.8           2.4      4.0         2.8        2.8           2.6      2.7
      activities

Table A2.10 Prevalence (%) of hearing impairment of different grades as function of
                                 age and gender

                                                     Age group
                                   31-40               41-50                 31-50               All
                              M         F            M       F             M       F            N=905
                            N=218     N=238        N=212 N=237           N=430 N=475
       BEHL > 25 dB
                             7.3           1.3      18.4        3.8       12.8           2.5      7.4
      at at least 2 freq
      BEHL >= 25 dB          1.8           1.3      8.5         2.5        5.1           1.9      3.4
      BEHL >= 35 dB          0.9           0.4      2.4         0.4        1.6           0.4      1.0
      BEHL >= 45 dB           0             0       0.5         0.4        0.2           0.2      0.2


A2.7 Prevalence in Sweden (Johanssson and Arlinger, 2003)
Johanssson and Arlinger (2003) present their results of an audiometric survey in two
different formats, according to age and gender. Table A2.11 gives prevalence in
terms of BEHL ranges (the authors also give WEHL results), while Table A2.12 gives
the data classified according to the European grades of hearing loss.

                        Table A2.11 Prevalence in terms of BEHL ranges

                                                    Age
                                                                                                      All
                        20-50            50-60                60-70           70-80
BEHL              M         F        M       F            M       F       M       F            M        F
>= 25 dB          1.5       1.7      14.5    8.0          42.6    42.1    74.5    73.1         16.6     17.2
>= 35 dB          0.8       0.0      5.8     4.0          17.0    8.8     41.8    44.6         7.9      7.5
>= 45 dB          0.0       0.0      1.4     0.0          6.4     5.3     21.8    21.4         3.3      3.4
>= 65 dB          0.0       0.0      0.0     0.0          0.0     0.0     1.8     1.8          0.2      0.2


190
191


       Table A2.12 Prevalence according to European grades of hearing loss.

                                               Age
                                                                                        All
                     20-50          50-60            60-70          70-80
BEHL           M         F      M       F        M       F      M       F        M        F
Mild           5.5       2.9    23.2    12.0     53.2    45.6   60.0    50.0     20.5     16.2
Moderate       0.0       0.0    1.4     1.3      10.6    5.3    29.1    28.6     4.5      4.5
Severe         0.0       0.0    0.0     0.0      0.0     0.0    0.0     1.8      0.0      0.2
Profound       0.0       0.0    0.0     0.0      0.0     0.0    0.0     0.0      0.0      0.0


A2.8 Predicted prevalence of hearing impairment to 2025 (Davis, 1997)
Davis (1997) estimated the numbers of hearing impaired people in the UK, US, world
regions and continents according to severity and gender, for the years 1995, 2005,
2015 and 2025. Predictions for Europe were shown in Chapter 3, Table 3.23. Figures
for 2005 to 2025 for the world, more and less developed regions are shown in Table
A2.13.

  Table A2.13 Estimated numbers (to nearest million) of hearing impaired adults in
                    world regions (adapted from Davis, 1997)

                                                       Hearing threshold
           Region        Year   Gender
                                                ≥25    ≥35    ≥45    ≥65        ≥95
                                Male           295    150    78     26         7
                         2005   Female         267    156    85     25         4
                                Overall        562    305    163    51         11
                                Male           382    195    102    33         9
           Whole
                         2015   Female         335    198    108    32         5
           world
                                Overall        717    393    209    65         14
                                Male           491    254    131    42         10
                         2025   Female         424    253    138    41         7
                                Overall        915    507    269    83         17
                                Male           92     49     26     8          2
                         2005   Female         96     62     36     11         2
                                Overall        188    111    61     19         3
           More                 Male           106    57     30     10         2
           developed     2015   Female         108    71     40     13         2
           region               Overall        214    128    71     22         4
                                Male           121    66     35     11         2
                         2025   Female         122    81     46     14         2
                                Overall        243    147    81     25         4
                                Male           203    101    52     18         6
                         2005   Female         170    93     50     14         2
                                Overall        373    194    102    32         8
           Less                 Male           276    138    71     24         7
           developed     2015   Female         228    127    68     19         3
           region               Overall        503    265    138    43         10
                                Male           170    188    96     31         8
                         2025   Female         302    173    92     27         4
                                Overall        673    360    187    58         13


191
192


APPENDIX 3            SCALES USED IN ASSESSING PSYCHOSOCIAL
                      EFFECTS OF HEARING IMPAIRMENT

A3.1 Introduction
In the studies reviewed in Chapters 4 and 5, many different methods have been used
to assess the effects of hearing impairment. In some cases particular scales have been
used to assess specific areas relating to the quality of life, for example physical or
emotional health. Some of the scales used are ones previously developed for assessing
general health welfare, or in other studies related to hearing; others are modifications
of existing scales. Some authors have designed their own questionnaires for use in a
particular survey. This appendix presents a summary of the most commonly used
scales. The references given are to the papers reviewed in the main report that use the
various scales; earlier papers in which the scale is defined or validated are cited in
those papers.


A3.2    Sickness Impairment Profile (SIP)
        (Bess et al, 1991)
The SIP is a self-administered questionnaire consisting of 136 items which assess
psychosocial functioning through questions relating to behaviour in various contexts.
Individual items are weighted and grouped into 12 subscales as shown in Table A3.1
(Bess et al, 1991). These subscales are also combined as shown to give three main
scales: physical, psychosocial and overall. Bess et al state that the SIP has been used
in many studies to assess sickness related dysfunction, citing papers in the medical
literature in which the scale was validated. The higher the SIP score the greater the
functional impairment.

         Table A3.1 Main scales and subscales of the Sickness Impact Profile

                  Main scales     Subscales
                  Physical        Ambulation
                                  Mobility
                                  Body care and movement
                  Psychosocial    Social interaction
                                  Communication
                                  Alertness behaviour
                                  Emotional behaviour
                  Additional independent measures
                                  Sleep and rest
                                  Eating
                                  Work
                                  Home management
                                  Recreation and pastimes
                  Overall         Combines all of the above subscales


192
193


A3.3   Hearing Handicap Inventory for Elderly (HHIE)
       (Mulrow et al, 1990a, 1990b)
This scale consists of a 25 item questionnaire, scored from 0 to 100, that assesses the
emotional and social effects of hearing loss. A higher score represents greater
handicap. The scale was originally developed to assess the benefits of hearing aids.


A3.4    Quantified Denver Scale of Communication Function (QDS)
        (Mulrow et al, 1990a, 1990b)
This scale also consists of a 25 item questionnaire, scored from 0 to 100, that assesses
perceived communication difficulties due to hearing loss A higher score represents
greater handicap.


A3.5   Short Portable Memory Status Questionnaire (SPMSQ)
       (Mulrow et al, 1990a, 1990b; Carabellese et al, 1993)
This scale is used to assess cognitive function, and consists of 10 items. It is scored
from 0 to 10, a higher score representing greater dysfunction.


A3.6   GDS Geriatric Depression Scale (GDS)
       (Mulrow et al, 1990a, 1990b)
The GDS is a 15 item scale, scored from 0 to 15, that assesses affect (mood, or
depression). A higher score represents greater dysfunction.


A3.7    Self Evaluation of Life Function (SELF)
        (Mulrow et al, 1990a, 1990b; Carabellese, 1993)
This is a large questionnaire, consisting of an overall scale of 54 items (scored from
54 to 216) that assesses six areas of functioning: physical disability, social
satisfaction, symptoms of aging, depression, self-esteem, personal control. A higher
score represents greater dysfunction. For example, on the social satisfaction sub scale,
a score of 12 or less implies poor social relationships, 13-24 middle, and 25-36 high
social satisfaction.


A3.8    Nottingham Health Profile (NHP)
        (Grimby and Ringdahl, 2000; Erlandsson and Holgers, 2001)
This questionnaire assesses Health Related Quality of Life, and is widely used as an
outcome measure in health screening. It consists of two parts. Part I consists of 38
yes/no questions that reflect the degree of discomfort or distress within the
dimensions of lack of energy (5 items), pain (8 items), emotional reactions (5 items),
sleep (6 items), social isolation (6 items) and physical mobility (8 items). Each
dimension is scored from 0 to 100, the higher scores in a particular dimension
reflecting greater numbers and severity of problems. Part II of the NHP comprises
seven yes/no statements referring to health related quality of life. The higher the
value, the more impaired the quality of life.


193
194


A3.9    Hearing Measurement Scale (HMS)
        (Weinstein and Ventry, 1982)
The HMS scale quantifies a respondent’s perception of their situational difficulties
arising from a hearing loss: their ability to hear and understand, their emotional
response to their loss and their personal opinion of the hearing loss.


A3.10 Comprehensive Assessment and Referral Evaluation (CARE)
        (Weinstein and Ventry, 1982)
The CARE scale is used to assess social, emotional and physical problems of elderly
individuals. It comprises 38 scales that measure various dimensions such as physical
disorders, psychiatric disturbances and social problems. There are two scales to
measure social isolation – the subjective isolation scale (19 items which assess
constrictions in social networks, loneliness, reduced interest in leisure activities,
desire to withdraw from others); and the objective isolation scale (31 items which
assess the number of face to face contacts with friends and relatives and others; and
involvement in leisure activities). The higher the score the more isolated the
individual.


A3.11 Beck’s Depression Inventory scale (BDI)
        (Carabellese et al, 1993)
The BDI scale is used to measure mood. A score of 22 or less is ‘normal’; 23-44 is
‘low mood’; and 45-66 ‘very low’. A score above 22 is usually considered to be a
reliable indication of clinically relevant low mood level.


A3.12 Instrumental Activities of Daily Living scale (IADL)
       (Carabellese et al, 1993)
The IADL scale is used to measure the functional status of older people. A score of 0
– 1 indicates that the individual is independent, while a score greater than 1 indicates
dependency.


A3.13 Communication Strategies Scale (CSS)
        (Hallberg, 1999)
This scale is based upon a questionnaire designed to measure three types of coping
strategies: maladaptive behaviour, verbal strategies, and nonverbal strategies. It
consists of 25 items each of which is rated on a five point scale ranging from ‘almost
never’ (1) to ‘almost always’ (5). Typical items are ‘One way I get people to repeat
what they say is by ignoring them’ (maladaptive behaviour); ‘When I don’t
understand what someone has said I ask them to repeat it’ (verbal strategy); and
‘When I must listen in a group, I try to sit where I’ll be able to hear better’ (non-
verbal strategy).


194
195


A3.14 Hearing Disability and Handicaps Scale (HDHS)
        (Hallberg, 1999)
This scale is based upon a questionnaire designed to measure perceived handicap and
disability. The questionnaire consists of 25 items on a four point rating scale from
‘seldom’ (1) to ‘always’ (4). There are four subscales: speech perception, non-speech
sounds, interpersonal distress and threat to self image. Examples of items include ‘Do
you have difficulty following a conversation normally in any of the following
situations: at work, in a bus or a car, or when shopping?’ (speech perception); ‘Do
you have difficulties hearing the footsteps of someone coming into the room without
seeing them?’ (non-speech sounds); ‘Do you feel that your hearing condition has an
influence on the relationship you have with your spouse or a person close to you?’
(interpersonal distress); and ‘Do you ever get the feeling of being cut off from things
because of your hearing difficulty?’ (threat to the self image). The summed scores of
the speech perception and non-speech sounds categories are used to measure
perceived disability, and the sum of the scores on the other two factors measure
perceived handicap.


A3.15 Conclusions
The scales described here represent just a small sample of the myriad of scales that
are used in the assessment of problems arising from hearing impairment. The
diversity of scales used means that detailed, direct comparison of the outcome of
different research projects can be difficult. However, as was seen in Chapter 5, the
results obtained in the different projects, derived using a variety of scales, are on the
whole very consistent and show similar trends relating to the psychosocial
consequences of hearing loss.


195
196


APPENDIX 4           SUMMARIES OF QUANTITATIVE STUDIES
                     OF PSYCHOLOGICAL EFFECTS OF HEARING
                     IMPAIRMENT

A4.1 Introduction
The following pages contain tabulated information on, and summaries of results from,
the studies reviewed in Chapters 4 and 5.


196
197


                                             Subjects
   Author(s), date                                                                                    Results
                      Number         Ages       HL (dB)     Aids   Controls
Thomas and Herbst     211 total   16-64      16% 0- 39 dB   All    410        Psychiatric disturbance
1980                              (66%>50)   66% 40-69 dB   wore   matched              19% (cf 5% general population)
                      120                    12% 70-89 dB   aids                        57% of those with >70 dB HL & sp discrim < 70%
                      male                   6% 90+ dB                        Health problems
                                                                                        28% (cf 13% controls)
                      91                                                      Loneliness
                      female                                                            24% (cf 14% controls)
                                                                              Social isolation
                                                                                        40% (cf 25% controls)
                                                                              Difficulty making friends
                                                                                        40% (cf 15% controls)
                                                                              Lack of emotional support
                                                                                        45% (cf 26% controls)
                                                                              Left out of discussions at home
                                                                                        27% (cf 12% controls)
                                                                              Hearing problem not understood by those closest
                                                                                        42%
                                                                              Hearing problem not understood by spouse
                                                                                        52%
                                                                              Denial of problem to others
                                                                                        59%
Bess, Lichtenstein,   153         > 65       30% 0-16 dB    None   No         All SIP scales increased with increase in hearing loss
Logan, Burger and                            35% 17-25 dB                     Physical SIP scale from
Nelson                                       25% 26-40 dB                               3.3 (no HL) to 18.9 (HL>40 dB)
1989                                         10% > 40 dB                      Psychosocial scale from
                                                                                        4.0 (no HL) to 16.8 (HL>40 dB)
                                                                              Overall scale from
                                                                                        5.3 (no HL) to 17.1 (HL>40 dB)
                                                                              For each 10 dB increase in HL scales increase by
                                                                                        2.8 (physical)
                                                                                        2.0 (psychosocial)
                                                                                        1.3 (overall)
                                                                              Overall SIP scale is
                                                                                        13.4 for all subjects
                                                                                        17.1 for subjects with >40 dB HL
                                                                                        (cf 2 – 3 for unimpaired adults)


197
198


                                                 Subjects
  Author(s), date       Number          Ages        HL (dB)         Aids    Controls                           Results
Mulrow, Aguilar,      204 total      > 64         60% 0- 40 dB      None      98          Overall handicap score
Endicott et al                       (mean 71)    32% 41-55 dB              matched                52 (cf 22 controls)
1990a                 106 HI                      8% 56 -70 dB                            Social handicap score
                                                                                                   26 (cf 11 controls)
                      98% male                                                            Emotional handicap score
                                                                                                   27 (cf 11 controls)
                                                                                          Communication problems score
                                                                                                   62 (cf 40 controls)
                                                                                          Depression score
                                                                                                   3.3 (cf 2.9 controls)
                                                                                          Overall life function
                                                                                                   96 (cf 93 controls)
                                                                                          Social and emotional dysfunction among HI subjects:
                                                                                                   66% severe handicap
                                                                                                   16% mild to moderate handicap
                                                                                                   18% minimal/no handicap
Mulrow, Aguilar,      188                         70% 0- 40 dB      None                  Social and emotional dysfunction
Endicott et al                                    27% 41-55 dB                                     63% severe handicap
1990b                                             3% 56 -70 dB                                     20% mild to moderate handicap
                                                                                          Moderate communication difficulties
                                                                                                   85% of subjects
                                                                                          Depression
                                                                                                   23% of subjects
Carabellese,          1192           70-75       HI based upon      HI no       Can       Depression score
Appollonio, Rozzini                               hearing test      aids    extrapolate            Low 34% (cf 26% controls)
et al                 131 visually               (ability to hear             to give              Very low 11% (cf 6% controls)
1993                  impaired                      3 random                 ‘hearing     Dependent
                                                    numbers)                adequate’              22% (cf 10% controls)
                      126 HI                                                 group of     Cognition impaired
                      (uncorrected                                             1068                6% (cf 3% controls)
                      HL)                                                                 Social relationships score
                                                                                                   Low 37% (cf 28% controls)
                                                                                          Physical health scores
                                                                                                   Good 64% (cf 69% controls)
                                                                                                   Borderline 32% (cf 27% controls)
                                                                                                   Poor 5% (cf 4% controls)

198
199


                                                Subjects
  Author(s), date                                                                                        Results
                       Number        Ages          HL (dB)      Aids   Controls
Gregory, Bishop and   82          Late                                            Family communications
Sheldon               families    teens/early                                              25% best with mother
1995                  with deaf   20s                                                      20% best with sibling
                      child                                                                5% best with father
Gregory                                                                           Dependence on families
1998                  61 deaf                                                              70% (of 20-21 yr olds) living with family
                      children                                                             50% (of 20-21 yr olds) needed help managing
                                                                                           finances
                                                                                           40% unable to go to doctor alone
                                                                                  Sibling relationships
                                                                                           42% got on well with siblings
                                                                                           32% got on quite well with siblings
                                                                                           20% got on with some siblings
                                                                                           2% did not get on with siblings
                                                                                  Lack of family communication
                                                                                           80% experienced lack of communication
                                                                                  Relationships with opposite sex
                                                                                           38% (over 21) had had no boy or girl friend
RNID                  1666                      Deaf and hard                     Isolation and exclusion
1999                                            of hearing                                 71% feel isolated
                                                                                           39% avoid meeting new people
                                                                                           86% find public places difficult
                                                                                           59% think other people perceive them as stupid
                                                                                  Prejudice and abuse
                                                                                           47% made fun of
                                                                                           47% ignored because of deafness
                                                                                           83% experienced impatience
                                                                                           63% patronised
                                                                                           20% victim of abuse
                                                                                           5% victim of violence
                                                                                  Visits to doctor
                                                                                           23% leave doctor’s surgery ignorant of illness
                                                                                           32% need someone to interpret at doctor’s
                                                                                           16% avoid going to doctor


199
200


                                     Subjects
  Author(s), date                                                                            Results
                     Number   Ages       HL (dB)     Aids   Controls
RNID                10,000           Deaf and hard                     15% unemployed (cf 6% hearing population)
2000                                 of hearing                        22% aged 25 to 45 unemployed
                                     (majority                         70% prevented getting job because of deafness
                                     profoundly                        68% seeking work is problem
                                     deaf)                             52% denied training or education at work
                                                                       74% promotion opportunities fewer than for others
                                                                       60% hearing problems not understood by colleagues
                                                                       38% seeking new job because of treatment at work
                                                                       64% communication barriers at work


200
APPENDIX 5           POPULATIONS OF EUROPEAN COUNTRIES

A5.1   Countries in European Union

Data for 1 January 2004 from Eurostat (europa.eu.int/comm/eurostat)

                      Country                  Total population
                                            in 1000s
                      Belgium               10396.0
                      Czech Republic        10211.5
                      Denmark               5397.6
                      Germany               82531.7
                      Estonia               1350.6
                      Greece                11041.1
                      Spain                 42345.3
                      France                59900.7
                      Ireland               4027.5
                      Italy                 57888.2
                      Cyprus                730.4
                      Latvia                2319.4
                      Lithuania             3445.9
                      Luxembourg            451.6
                      Hungary               10116.7
                      Malta                 399.9
                      Netherlands           16258.0
                      Austria               8114.0
                      Poland                38190.6
                      Portugal              10474.7
                      Slovenia              1996.4
                      Slovakia              5380.1
                      Finland               5219.7
                      Sweden                8975.7
                      United Kingdom        59651.5

                      Total                 456814.6
202


A5.2 European countries not in European Union
Data from www.nationmaster.com, taken from CIA World Factbook, December 2003,
unless otherwise indicated.

                     Country                  Total population
                     Liechtenstein            33,900*
                     Switzerland              7,318,638
                     Andorra                  69,150
                     Moldova                  4,439,502
                     Albania                  3,582,205
                     Serbia and Montenegro    10,655,774
                     Romania                  22,271,839
                     Macedonia                2,063,122
                     Ukraine                  48,396,470**
                     Croatia                  4,422,248
                     Bosnia & Herzegovina     3,989,018
                     Belarus                  10,322,151
                     Norway                   4,552,300*
                     Iceland                  288,500*

                                Total         122,404,817
                  *Figures from Eurostat
                  ** July 2002 estimate

Note: Turkey and Russia are partly in Europe but have not been included here. Georgia,
Armenia and Azerbaijan are sometimes considered to be in Europe and also in Asia; they
too have not been included.


202

Hear It Report October 2006

  • 1.
    EVALUATION OF THESOCIAL AND ECONOMIC COSTS OF HEARING IMPAIRMENT A REPORT FOR HEAR-IT Bridget Shield October 2006
  • 2.
    2 CONTENTS CHAPTER 1 INTRODUCTION 1.1 Introduction 1.2 Scope and limitations of the study 1.3 Structure of the report CHAPTER 2 DEFINITIONS OF DEAFNESS 2.1 Introduction 2.2 Qualitative definitions of hearing impairment 2.3 Quantitative definitions of hearing impairment 2.3.1 World Health Organisation 2.3.2 European Commission 2.3.3 American National Standards Institute 2.3.4 RNID 2.3.5 British Society of Audiology 2.3.6 NIDCD 2.4 Summary 2.5 Conclusions CHAPTER 3 PREVALENCE OF HEARING IMPAIRMENT AMONG ADULTS IN EUROPE 3.1 Introduction 3.2 Hearing impairment in developing countries 3.3 General information on prevalence of hearing loss in US and UK 3.4 Prevalence of hearing impairment in Europe 3.4.1 Overall hearing impairment 3.4.2 Prevalence of different grades of hearing impairment 3.5 Prevalence of hearing loss related to age 3.5.1 US data on age and hearing loss 3.5.2 European data on age and hearing loss 3.5.3 Increase of hearing loss with age 3.6 Prevalence related to gender and other factors 3.6.1 Hearing loss and gender 3.6.2 Hearing loss and ethnicity 3.6.3 Hearing loss and socio-economic status 3.7 Predicted increase in prevalence of hearing impairment 3.7.1 Genetic and other causes 3.7.2 Presbycusis and ageing 3.7.3 Effects of noise exposure 3.8 Summary 3.9 Conclusions 2
  • 3.
    3 CHAPTER 4 MAJOR STUDIES OF PSYCHOSOCIAL EFFECTS OF HEARING LOSS 4.1 Introduction 4.2 An early review 4.3 First major study of psychosocial effects 4.3.1 Psychiatric disturbance 4.3.2 General health and wellbeing 4.3.3 Social and family life 4.3.4 Denial 4.3.5 Employment 4.3.6 Summary 4.4 Noise induced hearing loss 4.5 Functional disturbance in elderly people 4.6 Review of effects of acquired deafness 4.7 Hearing impairment and quality of life of elderly people 4.8 Community surveys of hearing problems in England and Wales 4.9 Sensory impairment and quality of life in an elderly population 4.10 Men and women with noise induced hearing loss 4.11 Effects of hearing impairment on young people 4.12 Experiences of deaf people 4.12.1 Deafness, isolation and exclusion 4.12.2 Prejudice and abuse 4.12.3 Visits to doctors 4.13 Psychological aspects of acquired hearing loss 4.14 Conclusions CHAPTER 5 PSYCHOSOCIAL EFFECTS OF HEARING LOSS 5.1 Introduction 5.2 Overall quality of life 5.3 Loneliness and social isolation 5.3.1 Adults of all ages 5.3.2 People of working age 5.3.3 Elderly people 5.3.4 Young people 5.3.5 Women 5.3.6 Conclusions on loneliness and social isolation 5.4 Psychiatric disturbance and depression 5.5 Family relationships 5.6 Stigma and low self esteem 5.7 Education 5.8 Denial 5.9 Difficulties in particular environments 5.10 General health/visiting the doctor 5.11 Cognitive skills and dementia 5.12 Memory 3
  • 4.
    4 5.13 Intimate relationships 5.14 Prejudice and abuse 5.15 Discussion 5.15.1 Types of study 5.15.2 Attitudes towards hearing impairment 5.15.3 Interrelationships between effects 5.15.4 Need for future research 5.15.5 Costs 5.16 Conclusions CHAPTER 6 OWNERSHIP OF HEARING AIDS 6.1 Introduction 6.2 Ownership of hearing aids 6.2.1 Hearing aid ownership in northern Europe 6.2.2 Hearing aid ownership in the United States 6.2.3 Hearing aid ownership among new users 6.3 Non-ownership of hearing aids 6.4 General reasons for non-ownership of aids 6.5 Reluctance to seek help 6.6 Variability in services provided 6.7 Denial of problem and delay in seeking help 6.8 Stigma 6.9 Early screening 6.10 Summary 6.11 Conclusions CHAPTER 7 USE OF HEARING AIDS 7.1 Introduction 7.2 Usage of hearing aids 7.3 Hearing aid usage among young people 7.4 Reasons for non-use and under use of hearing aids 7.5 Analysis of factors related to non-use 7.6 Defective aids 7.7 Hearing aid preferences 7.8 Hearing aid fitting 7.9 Expectations of hearing aids 7.10 Hearing aid handling 7.11 Stigma 7.12 Use of hearing aids by young people 7.13 Other reported problems 7.14 Summary 7.15 Conclusions 4
  • 5.
    5 CHAPTER 8 SATISFACTION WITH HEARING AIDS 8.1 Introduction 8.2 Scales for assessment of hearing aid benefits 8.3 Overall satisfaction with hearing aids 8.4 Satisfaction and benefits in various listening situations 8.5 Adaptation to hearing aids 8.6 Effects of personality on hearing aid assessment 8.7 Summary 8.8 Conclusions CHAPTER 9 IMPACT OF HEARING AIDS ON OVERALL QUALITY OF LIFE 5.1 Introduction 5.2 Psychological function 5.3 Physical health and functioning 5.4 Overall quality of life 5.5 Improvements in particular aspects of quality of life 5.5.1 Australian Office of Hearing Services survey 5.5.2 US National Council on the Aging survey 5.6 Summary 5.7 Conclusions CHAPTER 10 STUDIES OF COSTS OF HEARING IMPAIRMENT 10.1 Introduction 10.2 Methods of evaluating the costs of hearing impairment and interventions 10.2.1 Cost utility analysis 10.2.2 Monetary costings 10.2.3 Incidence/prevalence based studies 10.3 Cost utility analysis of cochlear implants 10.4 Societal costs of moderate hearing impairment 10.5 Monetary costs of hearing impairment 10.5.1 The costs of communication disorders 10.5.2 Cost effectiveness of newborn screening 10.5.3 Societal costs of severe to profound hearing impairment 10.5.4 Costs of deafness caused by noise at work 10.6 Discussion 10.7 Conclusions 5
  • 6.
    6 CHAPTER 11 EMPLOYMENT, EARNINGS AND DISCRIMINATION AT WORK 11.1 Introduction 11.2 Employment and unemployment rates of hearing impaired people 11.2.1 Unemployment in US 11.2.2 Unemployment in Europe 11.3 Underemployment 11.4 Earnings 11.5 Retirement 11.6 Discrimination at work 11.7 Conclusions CHAPTER 12 EVALUATION OF COSTS TO EUROPE OF HEARING LOSS 12.1 Introduction 12.2 Numbers of people in Europe who would benefit from hearing aids 12.2.1 Numbers of hearing impaired people in Europe 12.2.2 Numbers who would benefit from hearing aids 12.3 Evaluation of costs using a quality of life approach 12.3.1 Evaluation of loss of quality of life due to hearing impairment 12.3.2 Quality adjusted life years 12.3.3 Annual cost of hearing impairment per person 12.3.4 Total costs of untreated hearing impairment 12.4 Evaluation of costs of unemployment due to hearing loss 12.4.1 Numbers of unemployed in Europe 12.4.2 Cost of unemployment in UK 12.5 Conclusions CHAPTER 13 CONCLUSIONS AND DISCUSSION 13.1 Introduction 13.2 Main conclusions 13.3 Discussion REFERENCES APPENDIX 1 PREVALENCE OF HEARING IMPAIRMENT AMONG CHILDREN AND YOUNG ADULTS APPENDIX 2 PREVALENCE DATA FROM EUROPEAN STUDIES APPENDIX 3 SCALES USED IN ASSESSING PSYCHOSOCIAL EFFECTS OF HEARING IMPAIRMENT APPENDIX 4 SUMMARIES OF QUANTITATIVE STUDIES OF PSYCHOSOCIAL EFFECTS OF HEARING IMPAIRMENT 6
  • 7.
    7 APPENDIX 5 POPULATIONS OF EUROPEAN COUNTRIES 7
  • 8.
    8 CHAPTER 1 INTRODUCTION 1.0 The study This report presents the results of an extensive study of the social and economic impacts of hearing loss in Europe. The study has been carried out through Internet searches, searches and reviews of literature in academic and professional journals and discussions with professionals in the field. The ultimate aim of the study was to estimate the costs to Europe of hearing impairment. In order to accomplish this detailed studies have been made of the following aspects of hearing loss, with particular (but not exclusive) reference to Europe: • Current definitions of grades of hearing loss • Prevalence of hearing loss among adults • Relationship of hearing loss to factors such as age • Psychosocial effects of hearing loss • Ownership of hearing aids • Use of hearing aids • Benefits of hearing aids • Evaluations of the monetary costs of hearing impairment • Unemployment and low earnings due to hearing loss Following this review, two methods of evaluating costs of hearing impairment in Europe have been derived and costs estimated using these methods. 1.1 Scope and limitations of the study As stated above, the study was concerned with the socio-economic impact of hearing impairment of adults in Europe. Throughout the report the terms 'hearing impairment' and 'hearing loss' are used interchangeably as the report considers impairment only in the form of hearing loss; other hearing impairments such as tinnitus are beyond the scope of the study. The study was concerned with the costs of hearing impairments other than profound deafness, that is impairment that may be treated through the use of hearing aids. Where relevant some studies concerning profound deafness have been cited, but in general only those relating to less severe grades of hearing loss are reviewed. Although the study is focussed on Europe, much of the published research, particularly that on effects of hearing impairment and use of hearing aids, has been carried out in the United States. It may be assumed that the results of this research would be applicable to a European population so the most important of these investigations have been included in this review. A major aim of the study was to determine whether or not there is any published work on the cost implications of hearing impairment, and to apply the results to the hearing impaired population of Europe. The literature search revealed that there is very little relevant information published. A limited amount of work has been published in the 8
  • 9.
    9 United States, mainlywith reference to profound deafness. In the past few years there have been several studies of the cost benefits of cochlear implants, and it is proposed that similar methods could be used to estimate the costs of less severe hearing impairment. Furthermore there was notable lack of information on issues concerning young adults with hearing loss; most of the research that has been carried out, particularly that dealing with the effects of hearing loss, has concerned elderly subjects. There is clearly a gap in knowledge and understanding of how hearing loss affects young people that needs to be addressed. 1.2 Structure of the report The report is arranged as follows. Chapter 2 describes how the many terms used in relation to hearing ('deafness', ‘hearing impairment', 'hearing loss' and so on) are used in different contexts and in different cultures. Current definitions of deafness and hearing ability in terms of hearing level, as used by different organisations, are also given. Chapter 3 reviews studies which have investigated the prevalence of hearing impairment among populations. This chapter also includes discussion of the relationships between hearing loss and age, ethnicity, socio-economic status and gender. The likely increase in hearing impairment, and reasons for the possible increase, are also discussed. Chapter 4 describes some of the major studies of the psychological and social effects of hearing impairment on adults, while Chapter 5 contains a more extensive review of the evidence for particular psychosocial effects. Chapters 6 to 9 concern hearing aids. Chapters 6 and 7 discuss ownership and use of hearing aids. Much of the information presented has been obtained in the United States, and shows how many hearing impaired people who would benefit from hearing aids do not possess them, while others who possess aids do not use them. Chapters 9 and 10 review studies of people’s satisfaction with their aids, and the benefits they obtain. Chapter 10 reviews the limited amount of work concerned with evaluating the costs of hearing impairment; again, most of these studies are American. In Chapter 11 issues related to employment and unemployment, and earnings of hearing impaired people are discussed. Based upon the studies in Chapter 10 and the data presented throughout the report, Chapter 12 describes two methods for evaluating the costs to Europe of untreated hearing loss, and costs are estimated using both methods. The final chapter contains brief conclusions, discussion and recommendations for further work. 9
  • 10.
    10 CHAPTER 2 DEFINITIONS OF DEAFNESS 2.1 Introduction It is important when discussing issues relating to hearing loss to appreciate that many terms relating to hearing impairment, for example 'deaf', 'deafened', 'hard of hearing', 'hearing impaired', 'hearing disabled' and so on, are used in the literature. These terms can be used to refer to different conditions in different contexts and in different cultures. Furthermore, the varying degrees of severity of hearing impairment are defined differently by different organisations. This chapter discusses some of the terms used and gives the definitions of many of the leading bodies concerned with health and/or hearing loss. These generally define deafness in terms of hearing loss related to terms such as 'profound deafness', mild deafness' etc. as described below. The term 'deaf' itself can have different meanings. Many people, for example in Canada and the USA, make a distinction between the expressions 'deaf' and 'hard of hearing', using 'deaf' to refer only to people who have a total hearing loss. Hearing aids alone do not enable such people to understand speech; they need to be used in association with lip reading and consequently many totally deaf people do not use hearing aids (Martin, 2000). In the UK the term ‘deaf’ is often used to include both totally deaf and hard of hearing people. ‘Hearing impaired’ is the commonly used term to describe inclusively deaf and hard of hearing people. However, in other cultures, for example in North America, the use of the word ‘impaired’ is considered to make the expression ‘hearing impaired’ a derogatory term; people are categorised as either ‘deaf’ or ‘hard of hearing’. A further inconsistency is that hearing level is defined differently by different organisations. In some cases it refers to the hearing level in the better ear, and in others to the average hearing level of the two ears. In this report the terms ‘hearing impairment’ and ‘hearing impaired’ are used in relation to hearing loss which may be total or partial. In addition to hearing loss there are many other types of hearing impairment of which tinnitus is probably the most common. Here 'hearing impairment' is taken to refer to hearing loss only; consideration of other conditions such as tinnitus is beyond the scope of this report. Many deaf people communicate using sign language alone. In some countries including the United States they have formed a strong cultural identity and a 'deaf community' has developed (Martin, 2000; Pearson, 2003). Some branches of the deaf community do not welcome any interventions such as hearing aids or cochlear implants (Pearson, 2003). 10
  • 11.
    11 2.2 Qualitative definitions of hearing impairment Many of the studies into hearing loss, its mitigation and effects, particularly those based on population studies using questionnaire data, define hearing ability or loss in terms of self reported qualitative data. These may be based upon a 3, 4 or 5 point scale using descriptors such as 'difficulty hearing normal conversation' (O’Neill, 1999). In their large scale surveys of dental, visual and aural health the US National Center for Health Statistics (NCHS) uses the terms 'good', 'a little trouble', 'a lot of trouble' and 'deaf'. 2.3 Quantitative definitions of hearing impairment Organisations concerned specifically with health or hearing use formal definitions based upon hearing levels. Some of these definitions are discussed below and summarised in Section 2.4. 2.3.1 World Health Organisation The World Health Organisation (WHO) defines disabling hearing impairment in adults as a permanent unaided hearing threshold level (average for frequencies 0.5, 1, 2, 4 kHz) for the better ear of 41 dB or greater (WHO, 2001). In children under 15 years of age, disabling hearing impairment is defined as permanent unaided hearing threshold level (average for frequencies 0.5, 1, 2, 4 kHz) for the better ear of 31 dB or greater. The WHO classifies hearing impairment into 5 grades, as shown in Table 2.1. Table 2.1 WHO grades of hearing impairment Grade of HL in Qualitative description Recommendations impairment better ear 0 25 dB or No or very slight hearing No impairment better problems 1 26 - 40 dB Able to hear and repeat Counselling. Slight impairment words spoken in normal Hearing aids may be voice at 1 metre needed. 2 41 - 60 dB Able to hear and repeat Hearing aids usually Moderate words using raised voice recommended. impairment at 1 metre 3 61 - 80 dB Able to hear some Hearing aids needed. If not Severe words when shouted available, lip-reading and impairment into better ear signing should be taught. 4 81 dB or Unable to hear and Hearing aids may help Profound greater understand even a understanding words. impairment shouted voice Additional rehabilitation including deafness needed. Lip-reading and sometimes signing essential. Prior to 1997 the WHO defined hearing loss in terms of the pure tone average of the three frequencies 0.5, 1 and 2 kHz. The grades of hearing impairment were defined as shown in Table 2.2 (WHO, 1991). 11
  • 12.
    12 Table 2.2 Former WHO definitions of grades of hearing impairment Grade of HI Normal Mild Moderate Severe Profound BEHL (dB) 25 or less 26 - 40 41 - 60 61 - 80 Over 80 2.3.2 European Commission Definitions of grades of hearing impairment for use in Europe were proposed by the European Commission in 1996 (Martini, 1996). In these definitions the better ear hearing loss (BEHL) is defined as the pure tone average of the four frequencies 0.5, 1, 2 and 4 kHz for the better ear. A reason for including the frequency 4 kHz was that it is often a significant frequency in noise induced hearing loss and age related loss. The definitions, in terms of better ear hearing loss (BEHL), are shown in Table 2.3. Table 2.3 EU definitions of grades of hearing impairment Grade of HI Normal Mild Moderate Severe Profound BEHL (dB) 20 or less 21 - 39 40 - 69 70 - 94 95 or more Note that, although the terminology is the same, the hearing loss ranges associated with each grade of impairment differ between the WHO and EU classifications. 2.3.3 American National Standards Institute (ANSI) The American National Standards Institute (ANSI) defines 5 categories of hearing impairment, starting at a hearing level of 27 dB. The ANSI categories are shown in Table 2.4. Table 2.4 ANSI categories of hearing impairment Descriptor of hearing Hearing level Normal Less than 27 dB Mild hearing loss 27 - 40 dB Moderate hearing loss 41 - 55 dB Moderate-severe hearing loss 56 - 70 dB Severe hearing loss 71 - 90 dB Profound hearing loss 91 dB and above 2.3.4 Royal National Institute for Deaf and Hard of Hearing People (RNID) The RNID defines deafness in 4 categories (RNID, 2003) which relate to the quietest sound that can be heard in the better ear, as shown in Table 2.5. Table 2.5 RNID categories of hearing impairment Type of HL in better ear Qualitative description deafness Mild 25 - 39 dB Difficulty following speech 40 - 69 dB Difficulty following speech without a hearing Moderate aid 70 - 94 dB Great reliability on lip reading, even with a Severe hearing aid 95 dB or greater Communication by lip reading, British Sign Profound Language may be first or preferred language 12
  • 13.
    13 In addition, theRNID defines ‘deafened’ people as people who are not prelingually deaf but become profoundly deaf later in life as a result of trauma, infection or ototoxic drugs. 2.3.5 British Society of Audiology (BSA) The British Society of Audiology (1988) bases its general definitions of hearing impairment, shown in Table 2.6, on the average pure tone thresholds at 0.25, 0.5, 1, 2 and 4 kHz (BSA, 1988). Table 2.6 BSA definitions of hearing impairment Descriptor of hearing loss Hearing level Mild 20 - 40 dB Moderate 41 - 70 dB Severe 71 - 95 dB Profound Greater than 95 dB The BSA definitions have been endorsed and adopted by other organisations such as the British Association of Teachers of the Deaf (2001) and the UK National Deaf Children's Society (2003). 2.3.6 National Institute on Deafness and Other Communication Disorders (NIDCD) The NIDCD in the US defines hearing handicap in terms of the pure tone average hearing loss at speech frequencies 0.5, 1, 2, and 3 kHz (see www.nidcd.nih.gov). The categories are shown in Table 2.7. Table 2.7 NIDCD definitions of hearing impairment Type of handicap HL - average at Implications 0.5, 1, 2, 3 kHz Normal hearing 25 dB or less Functional handicap Around 40 dB Some form of amplification beneficial Severe to profound 75 dB or greater Hearing aids provide limited hearing loss benefit 2.4 Summary Table 2.8 summarises the definitions of all the organisations discussed above. It can be seen that there are some differences between the various organisations in the definitions of hearing impairment. In some cases mild hearing impairment is assumed to start at a BEHL of around 20 dB, while other organisations consider hearing losses of up to 26 dB to constitute ‘normal’ hearing. Table 2.8 also shows that the definitions of severe and profound deafness can differ by as much as 14 dB HL. 13
  • 14.
    14 Table 2.8 Summary of definitions of hearing impairment (dB HL) Moderate None Mild Moderate Severe Profound - severe WHO ≤ 25 26 - 40 41 - 60 61 - 80 ≥ 81 (avg. 0.5, 1, 2, 4 kHz) European Commission ≤ 20 21 - 39 40 - 69 70 - 94 ≥ 95 (avg. 0.5, 1, 2, 4 kHz) ANSI ≤ 26 27 - 40 41 - 55 56 - 70 71 - 90 ≥ 91 RNID 25 - 39 40 - 69 70 - 94 ≥ 95 BSA 20 - 40 41 - 70 71 - 95 >95 (avg. .25, .5,1,2,4 kHz) NIDCD <25 ~ 40 ≥ 75 (avg. 0.5, 1, 2, 3 kHz) 2.5 Conclusions It has been shown that there is considerable variation in both qualitative and quantitative descriptions of deafness. Care must therefore be taken when considering or reviewing literature on any aspects of deafness where grades of hearing loss are discussed. It is important to clarify exactly what is meant by the terms used in a particular context. Throughout this report, where possible, the meanings of the particular terms and definitions of hearing impairment used are clarified. 14
  • 15.
    15 CHAPTER 3 PREVALENCE OF HEARING IMPAIRMENT AMONG ADULTS IN EUROPE 3.1 Introduction This chapter reviews the available data on hearing impairment among adults. Although this study is concerned only with Europe, figures on hearing impairment in other parts of the developed world are included as they could be assumed to be comparable with those for Europe. Some literature concerning the prevalence of hearing loss among children and young adults is reviewed in Appendix 1. The data presented in this chapter comes from a variety of sources: Government surveys, organisations concerned with the needs of hearing impaired people, and academic journal publications. Some official data should be viewed with caution. For example, in the UK the number of people registered with social services departments as deaf or hard of hearing (approximately 195,000 in England in 2001) is a very small percentage of the 9 million deaf and hard of hearing people recognised by the RNID. This is because registration is voluntary and many people do not wish to inform the social services of their disability (RNID, 2003). In addition to examining data on the numbers of deaf and hard of hearing people in particular populations, this chapter also investigates relationships between hearing loss and factors such as age, gender, and ethnicity. Estimated increases in prevalence over the next few decades are also discussed. 3.2 Hearing impairment in developing countries In 1995 the World Health Organisation estimated that there were 120 million people with disabling hearing difficulties worldwide (Smith, 1998). In 2001 the WHO estimate was 250 million people worldwide with disabling hearing impairment (defined as moderate or worse hearing impairment in the better ear, that is a BEHL of 41 dB or greater), of whom two thirds live in developing countries (WHO, 2002). The WHO is concerned at the lack of accurate population based data on the prevalence and causes of hearing impairment in developing countries, and is currently undertaking a project to obtain this information (WHO, 2001), with surveys of hearing disability being undertaken in south-east Asia. 3.3 General information on prevalence of hearing loss in US and UK The overall figure normally given for the current prevalence of hearing impairment in the US population is 28 million, or 1 in 10 of the population (see for example websites of the American Academy of Audiology, Hear This Organisation, and the American Speech-Language-Hearing Association (ASHA)). Of these, 738,000 are totally deaf (Dallas Hearing Foundation website). This current figure of 28 million compares with 22 million, estimated from the 1994 US National Health Interview Survey (NHIS) of Disability (O’Neill, 1999) and also 15
  • 16.
    16 given by thewebsites of the Better Hearing Institute and National Institute on Deafness and other Communication Disorders (NIDCD). However, the data presented by the National Centre for Health Statistics in the US (NCHS, 1998) suggest that these figures may be an underestimate. In a 1997 study of hearing, vision and dental problems, of 195,276,000 people over 18 surveyed 34,752,000, that is 18%, rated their hearing according to the categories 'a little trouble', 'a lot of trouble' or 'deaf'. This means that nearly 1 in 5 adults in the US perceive themselves to have hearing difficulties to a greater or lesser degree. The figure generally quoted for prevalence of hearing impairment in the UK is 1 in 7, or approximately 9 million people (RNID, 2003), including around 700,000 who are severely or profoundly deaf. Most of the deaf and hard of hearing people in the UK have developed hearing loss as they become older. The figures includes an estimated 123,000 deafened people in the UK aged 16 or over, who rely heavily on lip reading and written communication. Another interesting statistic from the Hearing Research Trust (Hearing Research Trust, 2001) is that 1 in 3 people in the UK know someone with a hearing loss. (The personal view of the author is that this may be an underestimate.) 3.4 Prevalence of hearing impairment in Europe There have been several European studies in the past 20 years which have investigated the prevalence of hearing impairment in an adult population. However, it is difficult to compare or collate the data from the separate studies to give definitive estimates of the prevalence of the different grades of hearing impairment in a general population, as also found by Sorri et al (2001) in their report on adult hearing impairment in Nordic countries and the UK. This is because the various investigations have used different study populations, different age ranges and different definitions of impairment. Furthermore, the majority of studies have focused on prevalence among older people and there are few detailed reports on the prevalence of hearing impairment of different grades among adults of all ages. However, where reported, the overall figures for the prevalence of adult hearing impairment in various countries are reasonably consistent, and agree with those of other studies in the developed world, although some differences appear when the data is broken down by age and/or degree of hearing loss. 3.4.1 Overall hearing impairment The first large scale survey of hearing impairment among adults in a European country was the UK National Study of Hearing (Davis 1991; 1995), which was carried out in the 1980s and remains the most comprehensive and most cited survey. Since this study there have been further large surveys in Italy (Quaranta et al, 1996), Finland (Uimonen et al, 1999), Denmark (Karlsmose et al, 2000) and Sweden (Johansson and Arlinger, 2003). Summary data from these studies are presented in this chapter; more detailed results are given in Appendix 2. In terms of overall prevalence of hearing impairment of 25 dB BEHL or greater there is good agreement between these studies. Table 3.1 shows the numbers and ages of subjects and the overall levels of hearing impairment found in each survey. 16
  • 17.
    17 Table 3.1 Summaries of surveys of adult hearing impairment in Europe Country UK Italy Finland Denmark Sweden Johansson Davis 1991, Quaranta Uimonen Karlsmose Reference 2001 et al 1996 et al 1999 et al 2000 & Arlinger 2003 No of subjects 2662 2170 3518 705 590 Age of subjects 18-80 18-80 2-75 31-50 20-80 % popln with 16.1 17.1 15 14.3* 16.9 BEHL ≥ 25 dB *Subjective hearing impairment It can be seen that in terms of overall hearing impairment the results of all studies are very consistent. Possible reasons for the minor differences in results between studies are listed below: • The Finnish study included children as well as adults • The Danish study referred only to a rural population in a relatively small age range (30 to 50 years) • All subjects in the Italian study lived in cities • In the Swedish study subjects who had been exposed to industrial noise were excluded • The UK study was carried out in the mid 1980s and the Swedish study in 1998 so there is a difference of around 15 years between the first and last study reported. The overall levels of hearing impairment reported also agree with a similar survey of hearing impairment in Australia (Walsh et al, 1999) which found overall prevalence of 16.6% among subjects aged 16 and over. These results suggest that at the present time approximately 16-17% of the adult population of Europe have a hearing impairment of 25 dB BEHL or greater. 3.4.2 Prevalence of different grades of hearing impairment For the purposes of the current study it is useful to know the prevalence in Europe of different degrees of hearing impairment, but few of the studies present data directly in this format. Davis (1991; 1995) presents the results of the UK National Study of Hearing according to prevalence of losses of 25 dB or more, 35 dB or more, and so on as shown in Table 3.2. The hearing loss refers to the better ear and is an average across the frequencies 0.5, 1, 2 and 4 kHz. Table 3.2 Estimated prevalence of hearing impairment in UK (Davis, 1991, 2001) BEHL ≥25 ≥35 ≥45 ≥55 ≥65 ≥75 ≥85 ≥95 ≥105 Estimated 16.1 8.2 3.9 2.1 1.1 0.7 0.4 0.2 0.1 prevalence The results of the studies in Italy (Quaranta et al, 1996), Denmark (Karlsmose et al, 2000) and Sweden (Johansson and Arlinger, 2003) are presented similarly, which enables comparison of the situations in four European countries. The results of the UK, Italian, Danish and Swedish studies, in terms of BEHL, are shown in Table 3.3. 17
  • 18.
    18 Table 3.3 Comparison of UK, Swedish and Danish studies Study/ UK Italy Denmark Sweden BEHL Davis Quaranta et Karlsmose Johansson & dB 1991, 2001 al 1996 et al 2000 Arlinger 2003 25+ 16.1 17.1 3.4 16.9 35+ 8.2 1.0 7.7 45+ 3.9 4.0 0.2 3.3 65+ 1.1 1.2 0.2 90+ 0.3 Table 3.4 shows that the results of the studies are broadly similar; differences in results are probably due to the reasons given in the preceding section. However, as the study by Karlsmose et al (2000) considered only adults aged between 30 and 50 in a rural population it cannot be directly compared with the data from other countries and will not be considered further here. Johansson and Arlinger (2003) also presented the results of the Swedish study using the current European classifications. Their results are given separately for males and females, from which the overall figures in each category have been calculated, as shown in Table 3.4. The results of the Finnish study (Uimonen et al, 1999) were presented in two ways: using the current European definitions of the four grades of hearing loss (mild, moderate, severe and profound), based upon BEHL averaged across the frequencies 0.5, 1, 2 and 4 kHz, and also using the earlier WHO categories which were based upon the three frequencies 0.5, 1, and 2 kHz. The results for Finland and Sweden for the four European hearing loss grades are compared in Table 3.4. Table 3.4 Comparison of Swedish and Finnish studies in terms of grade of hearing impairment Finland Sweden Study/ Uimonen et Johansson & HI grade al 1999 Arlinger 2003 Mild 11.5 18.1 Moderate 2.8 4.5 Severe 0.3 0 Profound 0.1 0 It is possible, using the published data, to reanalyse the data from the UK National Study of Hearing (Davis, 1995) and the data from Finland (Uimonen et al, 1999) to make them consistent with the results of the other studies. As explained above, the study by Uimonen et al (1999) included subjects aged from 2 to 75. Using the data presented in the paper it is possible to reorganise the data to give results for adults only, in the age ranges 15 to 75 or 25 to 75. These two sets of data are shown in Table 3.5 and compared with the original data. 18
  • 19.
    19 Table 3.5Data on hearing impairment among adults in Finland (extrapolated from data presented by Uimonen et al, 1999) Original Reanalysed Reanalysed data data data HI grade Age group Age group Age group 2 to 75 15 to 75 25 to 75 Mild 11.5 14.7 17.2 Moderate 2.8 3.7 4.3 Severe 0.3 0.4 0.5 Profound 0.1 0.07 0.04 It can be seen that, by considering only the adult information, the results of the Finnish study are consistent with those of the Swedish study, as shown in Table 3.4. In the main report on the UK National Study of Hearing, Davis (1995) presents detailed data giving prevalence in 5 dB bands (see Appendix 2) from which it is possible to estimate the prevalence in the UK of the different EU grades of hearing impairment. Table 3.6 shows the percentages of subjects in the UK aged from 18 to 80 with hearing impairment in the four categories. Table 3.6 Data from UK National Study of Hearing (Davis, 1995) reanalysed into European grades of hearing impairment Age group HI grade 18 to 80 Mild 16.8 Moderate 4.9 Severe 0.7 Profound 0.2 Using the reanalysed UK and Finnish data it is possible to compare the results for the UK, Finland and Sweden, as shown in Table 3.7. Table 3.7 Prevalence of adult hearing impairment in different categories in UK, Finland and Sweden UK* Finland ** Sweden *** Average Age/HI grade 18-80 25-75 20-80 Mild 16.8 17.2 18.1 16.9 Moderate 4.9 4.3 4.5 4.6 Severe 0.7 0.5 0 0.4 Profound 0.2 0.04 0 0.1 TOTAL 22.6 22.04 22.6 22.2 * Figures extrapolated from Davis (1995); ** figures extrapolated from Uimonen et al (1999); ***figures calculated from Johansson and Arlinger (2003) It can be seen that the results of the three studies are very similar, particularly for the mild and moderate grades of hearing impairment. Differences between the studies for the higher grades are probably due to the exclusion of people likely to be suffering from noise induced hearing loss in the Swedish study, and the upper age limit of 75 years for the Finnish study. However, as can be seen the overall prevalence of hearing impairment in the three studies is remarkably consistent. Considering also the 19
  • 20.
    20 similarity between theresults of the UK and Swedish studies and those of the Italian study (Quaranta et al, 1996) shown in Table 3.3, it may be assumed that these prevalence figures are representative of the whole of Europe. Therefore for the purposes of the current study, it is assumed that the figures given in Table 3.8 approximate the current prevalence among adults in Europe of the four grades of hearing impairment in the current study. (The figures from Davis (1995) have been used for the ‘severe' and ‘profound’ categories owing to the likely underestimates in these categories in the Swedish and Finnish data.) Table 3.8 Current prevalence among adults in Europe of different grades of hearing impairment Grade of HI Mild Moderate Severe Profound BEHL 21-39 40-69 70-94 95+ Percentage 16.9 4.6 0.7 0.2 of population It should be noted that these figures may underestimate the prevalence of hearing impairment, particularly in the moderate to profound categories, owing to the upper age limits of 75 and 80 in the studies considered above. 3.5 Prevalence of hearing loss related to age It is well known that hearing loss increases with age and that, as a consequence, there are higher percentages of people with moderate and severe or profound hearing loss in the older age groups than the younger. The changing demographics in Europe, with a gradually ageing population, will lead to ever increasing numbers of hearing impaired people. There are several sources of data on the prevalence of hearing impairment among different adult age groups in the US. In the UK National Study of Hearing Davis (1995) classified data according to age and gender. Other more recent studies in Europe have also examined the prevalence of hearing impairment among different age groups. This section presents general statistics from the USA and more detailed European data on the prevalence of hearing loss related to age. The rate of increase of hearing loss with age is also examined 3.5.1 US data on age and hearing loss In the US more than 9 million Americans over the age of 65 and 10 million aged 45 to 64 are affected by hearing loss (National Council on the Aging, 1999). Among seniors hearing loss is the third most prevalent, but treatable, disabling condition, behind arthritis and hypertension (American Academy of Audiology). Research has shown that presbycusis affects about 30% of the population aged 65 and over (Gates et al, 1990) and that about half of over 75 year olds have significant hearing loss (Cruickshanks et al, 1998). In analysing the 1994 National Health Interview Survey data O'Neill (1999) states that 43% of the hearing impaired population are 65 or older, although only 12% of the population as a whole is within this age group. In addition, people aged 65 and older are more likely than any other age group to have hearing loss. Figures for other age 20
  • 21.
    21 groups are asfollows: 29% of the hearing impaired population are aged from 45 to 64; 23% from 18 to 44; the remaining 5% are under 18. ASHA reports that 4.6% of individuals between the ages of 18 and 44, 14% between the ages of 45 and 64, and 54% of the population over 65 have hearing loss. The latter group consists of 23% of individuals between the ages of 65 and 74 and 31% over 75. These data are from the 1995 National Center for Health Statistics (NCHS) (Benson and Murano, 1998) and differ from the figures extrapolated by the author from the 1997 data set (see Table 3.9). Furthermore the figure of 54% of over 65 year olds having hearing loss is considerably greater than the 1 in 3 figure reported elsewhere (American Academy of Audiology; Gates et al, 1990). A possible reason for these discrepancies is that the NCHS survey is based upon self reported hearing difficulties. The NCHS data set on hearing, vision and dental health is broken down into age groups. The age related hearing data relating to adults in different age ranges (total number 195,276,000) is presented in Table 3.9. Table 3.9 NCHS data on hearing ability in different age groups Self reported hearing descriptor A lot of trouble or Good A little trouble deaf Number* % Number* % Number* % 18 - 44 98155 90.6 8991 8.3 1111 0.1 45 - 64 43045 78.0 10014 18.2 1718 3.1 65 - 74 11918 65.6 4997 27.5 1192 6.6 75 and over 7089 51.2 4786 34.6 1942 14.0 * + Numbers in thousands Percentage of total number of subjects in each category In 2000 results of an audiometric survey of 3471 older adults, aged from 48 to 92, were published (Wiley et al, 2000). Results of this survey are summarised in Table 3.10. The category ‘mild’ refers to a pure tone average hearing loss of 26 to 40 dB, and ‘moderate/marked’ to a loss of greater than 40 dB. Table 3.10 Data on prevalence of hearing loss among older adults (Wiley et al, 2000) Age group 48-59 60-69 70-79 80-92 N % N % N % N % None 1114 90.1 747 71.6 447 51.4 66 20.5 Mild 107 8.7 241 23.1 289 33.2 121 37.6 Mod/marked 15 1.2 55 5.3 134 15.4 135 41.9 3.5.2 European data on age and hearing loss The UK, Italian, Finnish, Danish and Swedish studies discussed above have also looked at the prevalence of differing severities of hearing loss in different age groups. The data in the UK study (Davis, 1995) is presented as the percentages of the population aged from 18 to 80, in 10 year age groups, with better ear hearing losses above particular levels; the full range of data is shown in Appendix 2. The Italian (Quaranta et al, 1996) and Danish (Karlsmose et al, 2000) data is also presented in this way, although with a limited number of hearing loss categories, and, in the 21
  • 22.
    22 Danish study, alimited age range. The Finnish study (Uimonen et al, 1999) presents results according to the current EU (and former WHO) categories, while Johansson and Arlinger (2003) present their results in both formats. The relevant data from the Italian and Scandinavian papers are shown in Appendix 2. The detailed data in the report on the UK National Study of Hearing (Davis, 1995) has enabled reclassification into the EU categories. Some of the studies quoted present data for male and female subjects separately; for the purposes of the analysis here the data has been combined. Tables 3.11 and 3.12 present comparisons of available data according to both types of classification. Johansson and Arlinger (2003) present their data in fewer age groups than in the other studies (20-50, 50-60, 60-70 and 70-80). Therefore, for the purposes of comparison of studies, in Tables 3.11 and 3.12 data in the categories 18-30, 30-40 and 40-50 have been added for comparison with the Swedish data. These sums will not accurately represent the prevalence of hearing impairment in the wider age group which will depend upon the relative numbers of people in the three narrower age ranges. However, they are likely to give a reasonable approximation. Table 3.11 Comparison of age related data from UK (Davis, 1995), Finland (Uimonen et al, 1999) and Sweden (Johansson and Arlinger, 2003) in EU hearing loss categories (Figures given are percentages of sample studied) Hearing loss grade (dBHL) Mild Moderate Severe Profound All Age Study (21-39) (40-69) (70-94) (≥95) grades UK 2.4 0.2 0.0 0.0 2.6 18-30 Finland 0.4 0.4 0.0 0.0 0.8 Sweden UK 4.5 0.4 0.1 0.6 5.6 31-40 Finland 1.7 0.0 0.0 0.3 2.0 Sweden UK 11.2 2.0 0.2 0.1 13.5 41-50 Finland 6.1 0.5 0.0 0.0 6.6 Sweden UK* 18.1 2.6 0.3 0.7 21.7 18-50 Finland* 8.2 0.9 0.0 0.3 9.4 Sweden** 4.0 0.0 0.0 0.0 4.0 UK 23.2 5.0 0.5 0.1 28.8 51-60 Finland 14.0 1.7 0.2 0.0 15.9 Sweden 16.9 1.3 0.0 0.0 18.2 UK 40.1 8.9 1.2 0.6 50.8 61-70 Finland 31.2 5.8 0.2 0.0 37.2 Sweden 48.9 7.6 0.0 0.0 56.5 UK 44.3 26.5 3.1 0.1 74.0 71-80 Finland 45.1 16.7 2.7 0.0 64.5 Sweden 54.5 28.8 1.0 0.0 84.3 * Approximation – sum of three previous age groups ** Figures are for age range 20 to 50 It can be seen from both tables that there is in general close agreement between the results of the UK and Italian studies. However, the figures from the Finnish, Swedish and Danish studies are somewhat lower for the younger age groups. These 22
  • 23.
    23 discrepancies may bedue to the differences between the studies discussed in Section 3.4.1. However, all studies clearly demonstrate the effects of ageing on hearing loss with the older age groups shown much higher prevalence of hearing impairment than the younger groups. Table 3.12 Comparison of age related data from UK (Davis, 1995), Finland (Uimonen et al, 1999), Denmark (Karlsmose et al, 2000) and Sweden (Johansson and Arlinger, 2003) in selected BEHL categories (Figures given are percentages of sample studied.) Age Study ≥25 ≥35 ≥45 ≥65 ≥75 ≥85 ≥90 ≥95 UK 1.8 0.4 0.2 0.0 0.0 0.0 0.0 Italy 1.85 0.56 0.0 0.0 18-30 Denmark Sweden UK 2.8 1.4 1.1 0.7 0.7 0.6 0.6 Italy 3.89 1.11 0.56 0.28 31-40 Denmark 1.5 0.6 0.0 Sweden UK 8.2 4.0 1.7 0.3 0.3 0.1 0.1 Italy 8.29 1.46 0.49 0.24 41-50 Denmark 5.3 1.3 0.04 Sweden UK* 12.8 5.8 3.0 1.0 Italy* 14.03 3.13 1.05 18-50 Denmark Sweden** 1.6 0.4 0.0 0.0 UK 18.9 7.8 4.0 0.9 0.4 0.1 0.1 Italy 18.73 4.13 1.38 0.28 51-60 Denmark Sweden 11.3 4.8 0.6 0.0 UK 36.8 16.2 7.4 2.3 1.4 1.0 0.6 Italy 37.66 6.65 2.85 1.27 61-70 Denmark Sweden 42.3 12.4 5.8 0.0 UK 60.3 40.0 17.6 4.0 2.5 1.0 0.1 Italy 69.44 21.11 4.44 0.0 71-80 Denmark Sweden 73.8 43.4 21.6 1.8 * Approximation – sum of three previous age groups ** Figures are for age range 20 to 50 All of these studies are concerned with people up to the age of 80. The RNID produces figures for the UK for all ages above 16 years, as shown in Table 3.13 (note that the RNID categories are the same as the EU grades, except that ‘mild’ starts at 25 dB HL, rather than 21 dB HL as shown in Chapter 2). 23
  • 24.
    24 Table 3.13 Estimatedpercentages of UK population who are deaf or hard of hearing Age group 16 - 60 61 - 80 81+ Degree of Percentage Percentage Percentage deafness Mild 4.6 28.1 18.4 Moderate 1.6 16.5 57.9 Severe 0.2 1.9 13.2 Profound 0.1 0.4 3.6 All 6.6 46.9 93.2 The RNID figures show that over 90% of people over the age of 80 have some degree of disabling hearing impairment, with well over half of this age group being moderately impaired. This figure agrees closely with that found in an earlier UK study of hearing impairment among elderly people (Herbst and Humphrey, 1980). In this study the hearing of 253 subjects over the age of 70 was studied. Measured hearing levels are shown in Table 3.14. Table 3.14 Hearing levels of 253 subjects in London (Herbst and Humphrey, 1980) Hearing loss dB* Age Total 70-79 80+ No % No % No % 0-34 (not deaf) 88 47 12 18 100 40 35-44 (moderate) 38 20 8 12 46 18 45-69 (substantial) 47 25 34 51 81 32 70+ (severe) 13 7 13 19 26 10 Total 186 100 67 100 253 100 * Better ear hearing loss, average of frequencies 1, 2 and 4 kHz Table 3.14 shows that 53% of the subjects over 70 had some degree of hearing loss (according to the definitions used) and 92% of the subjects over 80. Using current definitions of hearing loss grades these numbers would be higher. Hietanen et al (2004) have recently published the results of a 10 year study designed to investigate changes in hearing between the ages of 80 and 90. The results of this study are tabulated in Appendix 2. The hearing of 291 subjects aged 80, 85 and 90 years were considered both cross-sectionally and longitudinally. The data shows that over 95% of subjects aged 90 are hearing impaired, of whom the majority have ‘moderate’ hearing loss. 3.5.3 Increase of hearing loss with age The previous sections show that both the severity and the prevalence of hearing loss increase with age. Some authors have examined the increase in hearing loss over a period of years (Davis, 1991; Bech et al, 1996; Rosenhall et al, 2000; Hietenan et al, 2004). Davis (1991) compared results of surveys of changes in hearing in the UK and in Denmark. There was good agreement between the results of the two surveys which 24
  • 25.
    25 showed a meanrate of deterioration of 1 dB over 2 years, and around 5 to 6 dB per decade. The rate of deterioration was found to be highly dependent upon age, the older the subject the greater the deterioration. Over the age of 55 the rate is approximately 9 dB per decade, while under 55 the rate is about 3 dB per decade. Bech et al (1996) surveyed the hearing of around 2000 subjects aged 80 and above in Denmark. The median hearing levels for different age groups are shown in Table 3.15. The deterioration is slightly less than that found by Davis (1991). Table 3.15 Median hearing levels of people over the age of 80 (Bech et al, 1996) Age 80-84 85-89 90-94 >= 95 All BEHL 49 51 53 50 50 Rosenhall et al (2000) compared the results of the Danish study by Bech et al (1996) with those of other studies of hearing of people aged 85, 88 and 90 in Sweden, and Wales. The median BEHL for men and women in each study is shown in Table 3.16. Table 3.16 Comparison of results of studies of people aged 85 to 90 in Sweden, Denmark and Wales (Rosenhall et al, 2000) Age Sweden Denmark S Wales, GB All N = 592 N = 188 N = 132 N = 912 M F M F M F M F 85 46 39 49 43 51 48 47 41 88 48 41 48 51 41 58 48 45 90 48 44 59 48 64 63 50 49 The table shows considerable differences between the three countries; the authors suggest that these may be due to small sample sizes and methodological differences. However a consistent pattern of gradual deterioration in hearing over the five years is apparent. Median hearing levels of 80 to 90 year olds in the 10 year study in Finland by Hietanen et al (2004) are shown in Table 3.17. Table 3.17 Median hearing levels of 80 to 90 year olds in Finland (Hietanen et al, 2004) Age 80 years 85 years 90 years M F M F M F Cross sectional 41.2 33.8 47.5 42.5 53.8 47.5 Longitudinal 37.5 32.5 47.5 40.0 53.8 47.5 Table 3.17 shows a slightly smaller deterioration in hearing from 85 to 90 than from 80 to 85, although there is a marked decrease in hearing ability over the decade. 3.6 Prevalence related to gender and other factors While it is well known that older people are more likely than younger people to be affected by hearing loss, there is some evidence of relationships between hearing 25
  • 26.
    26 impairment and gender,plus other social factors such as economic status and ethnicity. The following sections discuss these issues. 3.6.1 Hearing loss and gender In the UK the RNID reports that above 40 years of age more men than women become hard of hearing, probably because more men are exposed to industrial noise. However, over the age of 80 there is a greater number of hard of hearing women than men because the life expectancy of women is higher than that of men (RNID, 2003). The same difference between men and women is found in US data. The American Academy of Audiology reports research by Wallhagen et al (1997) which found that men are more frequently affected than women in the 35 to 60 year age group. In analysing the 1994 NHIS data O’Neill (1999) found that 61% of people with hearing loss were male although only approximately 50% of the population was male. Men of all ages were found to be more likely than women to have hearing loss, but the gap widened with age. In the 0-17 age range 0.6% of the female population was hearing impaired compared with 0.8% of the male population, but in the 65+ age group the percentages have increased to 10% (female) and 19% (male). Data is not given for the 80+ age group for comparison with the UK information. The 1998 National Center for Health Statistics (NCHS) hearing data for male and females is shown in Table 3.18 and is further broken down into age groups in Table 3.19. Table 3.18 NCHS data on prevalence of hearing abilities for males and females Self reported hearing descriptor A lot of trouble Good A little trouble or deaf Number* %+ Number* %+ Number* %+ Male 73544 78.5 16452 17.6 3472 3.7 Female 86663 85.3 12336 12.1 2491 2.5 *Numbers in thousands +Percentage of total number of subjects in each category Table 3.19 NCHS data on hearing ability related to gender and age Self reported hearing descriptor A lot of trouble Good A little trouble or deaf Number* %+ Number* %+ Number* %+ 18-44 years 47823 89.1 5094 9.5 633 1.2 Male 45-64 years 19047 71.7 6320 23.8 1135 4.3 Over 64 years 6673 49.5 5039 37.4 1704 12.6 18-44 years 50331 91.9 3897 7.1 478 0.9 Female 45-64 years 23998 84.7 3695 13.0 583 2.1 Over 64 years 12334 66.5 4745 25.6 1430 7.7 + *Numbers in thousands Percentage of total number of subjects in each category 26
  • 27.
    27 Table 3.18 showsthat, over all ages, the biggest difference between male and female hearing is in the ‘a little trouble’ category, males being one and a half times more likely than females to experience slight hearing difficulties. From Table 3.19 it can be seen that, in the 45 - 64 age group, males are around twice as likely as females to have hearing problems. For people over 64, the ratio is again 1.5. Differences in the prevalence of hearing loss among males and females have also been considered in the European studies discussed in previous sections (see also Appendix 2 for data from these studies). In the Italian study (Quaranta et al, 1996) no significant differences were found between hearing levels of men and women. In comparing Danish, Swedish and Welsh studies of people aged between 80 and 90, Rosenhall et al (2000) found gender differences, particularly in the Swedish study, with men in general having poorer hearing than women. In the Danish study by Karlsmose et al (2000) deterioration in hearing with age was more pronounced in male than female subjects. The earlier Danish study (Bech et al, 1996) considered by Rosenhall et al (2000) found no statistically significant differences between male and female subjects in terms of hearing level from 0.5 to 4 kHz. However, when hearing at higher frequencies was considered, significant differences were found with women having better hearing than men. A similar difference was found by Hietenan et al (2004) in their longitudinal study of hearing impairment among elderly people in Finland. At the age of 90 women had significantly better hearing than men at the 4 kHz frequency. The differences between men and women in deterioration in hearing at the higher frequencies are also illustrated by Davis (1997) in presenting results of the UK National Study of Hearing (Davis, 1995). However, Johansson and Arlinger (2003), in a recently published Swedish study, found gender to be statistically significant only in the 50 to 60 year age group, with women having better hearing than men. This may be due to the exclusion from the study of subjects who had been exposed to industrial noise. 3.6.2 Hearing loss and ethnicity There is conflicting evidence as to whether the prevalence of hearing loss is higher among members of minority ethnic groups than other groups. The RNID suggests that this might be the case (RNID, 2003) and considers that it is especially true of recent immigrants from regions with greater levels of poverty, poor health care and low levels of immunization against diseases such as rubella. However, O'Neill, in his analysis of the 1994 NHIS data (O’Neill, 1999) found that in the US white people were more than twice as likely as black people to have hearing loss. Although white people comprised 83% of the population of the US, 91% of the population with hearing loss is white. White people of all ages were more likely than black people to have hearing loss, but the gap widened with increasing age. (It is not clear, however, what the definition of 'black' is in this context.) The prevalence of hearing impairment among ethnic groups can also be seen from the NCHS data. The NCHS data in Table 3.20 shows the breakdown of the subjects into four racial groupings. 27
  • 28.
    28 Table 3.20 NCHS data on prevalence of hearing abilities among different racial groups Self reported hearing descriptor A lot of trouble Good A little trouble or deaf Number* %+ Number* %+ Number* %+ White non-Hispanic 116567 79.5 24538 16.7 5288 3.6 Black non-Hispanic 19370 89.2 1987 9.0 331 0.2 Other non-Hispanic 6842 89.1 652 8.5 154 2.0 Hispanic 17428 90.5 1611 8.4 191 1.0 * + Numbers in thousands Percentage of total number of subjects in each category The data presented in Table 3.20 supports the findings of the NHIS survey (O’Neill, 1999) that hearing loss is more prevalent among the white population of the US than among other communities. 3.6.3 Hearing loss and socio-economic status Relatively little evidence relating hearing loss to socio-economic status has been found. O'Neill (1999) reports that in the US the prevalence of hearing loss at all ages decreases as family income increases (however, it is possible that this merely reflects the lower grades of work undertaken by hearing impaired people, see Chapter 11). People with family income of less than $20,000 are reported to be more than twice as likely to have hearing loss as those with a family income of $50,000 or more. Related to this is the fact that the prevalence of hearing loss among adults is greater for those who are not high school graduates. The 1997 NCHS data categorises respondents as 'poor', near poor' and 'not poor'. (These definitions are based upon the US Central Bureau's poverty thresholds.) The data on hearing is broken down into the three categories as shown in Table 3.21 and further broken down by age as shown in Table 3.22. Table 3.21 NCHS data on prevalence of hearing abilities related to poverty status Self reported hearing descriptor A lot of trouble Good A little trouble or deaf Number* %+ Number* %+ Number* %+ Poor 16213 81.4 2889 14.5 802 4.0 Near poor 23654 78.9 5071 16.9 1221 4.1 Not poor 90706 82.6 16224 14.8 2853 2.6 * + Numbers in thousands Percentage of total number of subjects in each category 28
  • 29.
    29 Table 3.22 NCHS data on hearing ability related to poverty status and age Self reported hearing descriptor A lot of trouble Good A little trouble or deaf Number* %+ Number* %+ Number* %+ 18-44 years 11604 89.4 1179 9.1 189 1.5 Poor 45-64 years 2925 72.2 874 21.6 250 6.2 Over 64 years 1684 58.4 837 29.0 363 12.6 18-44 years 15405 88.7 1711 9.9 242 1.4 Near 45-64 years 4254 74.6 1224 21.5 221 3.9 poor Over 64 years 3994 57.9 2135 31.0 758 11.0 18-44 years 55653 90.5 5256 8.6 540 0.9 Not 45-64 years 26918 78.0 6588 19.1 1000 2.9 poor Over 64 years 8135 58.8 4380 31.7 1313 9.5 * + Numbers in thousands Percentage of total number of subjects in each category Table 3.21 shows that people of all ages in the ‘poor’ and ‘near poor’ categories are one and a half times more likely to have serious hearing problems than those who consider themselves ‘not poor’. From Table 3.22 it can be seen that this ratio is maintained for people in the 18 – 44 age group, whereas in the 45 – 64 group ‘poor’ people are twice as likely as ‘not poor’ to have severe problems. The differences between the three poverty levels are not so marked for people with slight hearing problems. This again could reflect the employment situations of deaf and hard of hearing people, as discussed in Chapter 11. 3.7 Predicted increase in prevalence of hearing impairment It is generally agreed that the prevalence of hearing loss (in terms of both known/reported cases and actual cases) will increase significantly over the next two to three decades. Reasons for the predicted increase include genetic disposition, presbycusis (related to the demographic changes leading to the 'ageing population'), exposure to noise at work and exposure to environmental/leisure noise. 3.7.1 Genetic and other causes In recent years programmes of screening of new born babies for hearing loss have been introduced in the USA and UK (see Appendix 1). Results of these screening programmes suggest that the previous estimate of 1 in 1000 live births with congenital hearing loss (in the US) is an underestimate, the actual figure being closer to 3 in 1000 (American Academy of Audiology). In addition to children who are born with hearing loss others have later onset or progressive hearing loss, leading to an increase in the prevalence of hearing impairment up to the age of 9 years (Fortnum et al, 2001; see Appendix 1). Little data has been found at this stage to indicate whether the increase is a real increase in the number of children born with or developing hearing loss, or merely a reflection of improved screening and diagnosis techniques. Marazita et al (1993) present data to suggest that the relative proportions of sporadic and genetic causes among children with profound, early-onset deafness in the US have changed in the past 30 years; deafness was attributable to sporadic causes in 49.3% of cases and to genetic causes in 50.6% in 1970, whereas more recent data shows 37.2% of cases to be sporadic and 62.8% genetic. There is a considerable amount of research currently being undertaken to examine the causes of 29
  • 30.
    30 genetic/hereditary deafness butthe examination of this data is beyond the scope of this report. 3.7.2 Presbycusis and ageing In Section 3.5 the increase in prevalence of hearing impairment with age was discussed. The major reason for the anticipated increase in the numbers of hearing impaired people is the demographic changes relating to the general ageing of the population, whereby the percentage of people over the age of 65 will increase dramatically in the next few years. The World Health Organisation fears that, because of the increase in world population and lengthening life expectancy, the numbers with disabling hearing impairment will substantially increase in future unless decisive public health action is taken (WHO, 2002). Data from the WHO also show how the prevalence of hearing impairment has increased world wide in the past few years. In 1995 the WHO estimated that there were 120 million people with disabling hearing difficulties world wide (Smith, 1998) whereas in 2001 the WHO estimate was 250 million people, of whom two thirds live in developing countries (WHO, 2002). (Note that the term 'disabling hearing difficulty' in this context refers to moderate or worse hearing impairment in the better ear.) The WHO also claims that exposure to occupational and urban, environmental noise, is a major (avoidable) cause of permanent hearing impairment worldwide (Smith, 1998). In the US hearing loss is the third most prevalent chronic health condition facing seniors (American Academy of Audiology). It is predicted that in the next 15 years 78 million people in the US will be over 50 years of age, with a resultant increase in the number of hearing impaired persons. As discussed in Section 3.3, the figure currently given in the US for numbers of people with hearing loss is 28 million, that is 1 in 10 of the population. This number is expected to increase rapidly over the next 10 years and to almost double by 2030 (American Academy of Audiology; Hear This Organisation, 2002). At present presbysucis affects about 30% of the population in the US who are aged 65 and over (Gates et al, 1990) and about half those over 75 years have significant hearing loss (Cruikshanks et al, 1998). Figures given for the UK are higher with an estimated 55% of people over the age of 60 currently deaf or hard of hearing (RNID, 2003). Davis (1991) argued that, with no change in prevalence rates among different age groups, demographic changes alone in England and Wales would increase the number of hearing impaired people by 20% over the following 20 years. Davis has also estimated the numbers of hearing impaired people in the UK (Davis, 1997) and in various other areas of the world up to the year 2025. Some of this data is tabulated in Appendix 2. Of particular interest to the current study are his predictions for Europe for years 2005 and later, which are shown (in simplified form) in Table 3.23. 30
  • 31.
    31 Table 3.23 Estimated numbers (to nearest million) of hearing impaired adults in Europe (adapted from Davis, 1997) Hearing threshold Year Gender ≥25 ≥35 ≥45 ≥65 ≥95 Male 40 21 11 4 1 2005 Female 42 27 16 5 1 Overall 82 49 27 8 2 Male 45 24 13 4 1 2015 Female 45 30 17 5 1 Overall 91 54 30 10 2 Male 50 28 15 6 1 2025 Female 50 33 19 6 1 Overall 100 61 34 11 2 3.7.3 Effects of noise exposure In addition to the expected increase in hearing impairment due to the ageing population, there is some evidence of increases in recent years among younger age groups, which will also impact on the total numbers of people with hearing difficulties in the future. O'Neill quotes data which shows a large increase between the years 1971 and 1990 in the number of younger Americans with hearing problems; increases of 26% among 45 to 64 year olds, and 17% in the 18 to 44 age group (O’Neill, 1999; Ries, 1994). Further evidence was provided by Wallhagen et al (1997) who studied over 5000 men and women in Alameda County in the US and found a 150% increase in hearing impairment among the over 50 age group from 1965 to 1994. These increases among the younger age groups are attributed to environmental noise, although the author is unaware of any studies showing a direct causal link between exposure to general environmental noise and hearing loss. The relationship between occupational noise exposure and hearing loss is well known. It is estimated that 30 million people are at risk of noise induced hearing loss (NIHL) in the US where it is the most common occupational disease and the second most self reported occupational illness or injury (American Academy of Audiology; Hear This Organisation, 2002). In the UK it is estimated that between 1.1 million and 1.3 million people are at risk of NIHL and that 170,000 people suffer deafness, tinnitus and other ear conditions as a result of exposure to excessive noise at work (Health and Safety Executive, 2003; Hearing Research Trust, 2001). However, it is to be expected that increased awareness of the hazards of noise in the workplace, plus further tightening of noise at work legislation (for example the new European Directive on noise at work (European Commission, 2003)) will decrease the percentage of the population in the developed world who suffer from NIHL. A major current cause of concern is exposure to loud levels of music. It is estimated in the UK that 20% of young people are regularly exposed to dangerous levels of loud music (Hearing Research Trust, 2001). It is assumed that this is a reason for the increase in deafness among younger adults, as discussed by O'Neill (1999). Unless noise levels are reduced in clubs and other venues where loud music is played the increase of hearing impairment among the younger age group will be increased; this will further increase the prevalence of hearing loss among the middle aged and elderly in 20 to 30 years’ time. 31
  • 32.
    32 It is possiblethat there are links between risk of hearing loss and other (non-auditory) environmental factors. For example, there is evidence that 70% of smokers are at risk of hearing loss in middle or old age (Hear This Organisation, 2002). There is also some evidence of relationships between the adverse effects of noise on hearing and ototoxic drugs or chemicals (WHO, 1999). 3.8 Summary The main findings of this chapter are summarised below. • The WHO estimated that in 2002 there were over 250 million people world wide with disabling hearing impairment, of whom two thirds were in developing countries. • It is estimated that there are 28 million hearing impaired people in the USA (1 in 10 of the population). • It is estimated (2003) that there are 9 million hearing impaired people in the UK (1 in 7 of the population). • In Europe the current prevalence of adult hearing impairment (using current European classification of hearing loss grade) is estimated from various surveys to be approximately 16.9% with mild hearing loss; 4.6% with moderate hearing loss; 0.7% with severe hearing loss; 0.2% with profound hearing loss. • Prevalence and severity of hearing loss increase with age. • Over 90% of people aged 80 or older and over 95% of people aged 90 or older are hearing impaired • In general over a lifetime hearing deteriorates at a rate of 5 to 6 dB per decade. • Over the age of 55 hearing deteriorates at a rate of approximately 9 dB per decade, while under 55 the rate is about 3 dB per decade. • In general women have better hearing than men, the differences in hearing level increasing with age and at the higher frequencies. • In the USA hearing loss appears to be more prevalent among the white population than among other communities. • Data from the US suggests that hearing loss is related to economic status. • There will be a significant increase in the prevalence of hearing loss over the next twenty or thirty years. • It is estimated that there will be approximately 100 million hearing impaired people in Europe by the year 2025. 3.9 Conclusions This chapter has reviewed research concerning the prevalence of hearing impairment among adults, particularly in Europe. Data on prevalence produced by various independent studies is reasonably consistent and allows the current prevalence in the four grades of hearing loss to be estimated (see Table 3.8). These figures are used in Chapter 12 in evaluating the current costs to Europe of hearing impairment. It is important to the hearing aid community to note the extent of the likely increase in prevalence, with a consequent demand for hearing aids over the coming decades. This is due mainly to the ageing population of Europe and also to other factors which may increase prevalence in certain age groups. 32
  • 33.
    33 It can beseen from this chapter that many people in Europe are at risk of suffering detrimental effects on their lives due to hearing loss. The following two chapters review literature concerned with the psychosocial impacts of hearing loss, which reduce quality of life. 33
  • 34.
    34 CHAPTER 4 MAJOR STUDIES OF PSYCHOSOCIAL EFFECTS OF HEARING IMPAIRMENT 4.1 Introduction An extensive literature review of the psychosocial effects of hearing loss has been carried out. The review presented here and in the following chapter has focused on the effects of hearing impairment on adults. There is a body of research concerning the effects of hearing loss on children, in particular on their speech and language development, but this research is beyond the scope of this report. This report focuses on a review of the literature related to the psychological and social effects of hearing impairment. Only literature relating to people with partial, rather than total, hearing loss has been included; literature relating to people who are totally deaf and unlikely to benefit from hearing aids is not reviewed here. However, some of the papers considered in the report also discuss effects of hearing impairment on people who are totally deaf as well as those who are hard of hearing. As the papers considered span the past three decades, there are many different terms used to describe hearing impairment. In particular, the term ‘deafness’ has different meanings. In general, in the earlier papers ‘deafness’ is used to refer to both total and partial hearing loss whereas in the later papers ‘deafness’ means only total hearing loss. Where there is ambiguity the use of the term deafness is clarified. In the studies here and in Chapter 5, many different methods have been used to assess the effects of hearing impairment. In some cases particular scales have been used to assess specific areas relating to the quality of life, for example physical or emotional health. Some of the scales used are ones previously developed for assessing general health welfare or in other studies related to hearing; others are modifications of existing scales. Some authors have designed their own questionnaires for use in a particular survey. The most commonly used scales are summarised in Appendix 3. The studies are presented in this chapter in approximately chronological order. The majority of the research on psychosocial effects of hearing loss relates to the impact on adults of acquired, rather than congenital, hearing loss. The work reviewed here is therefore mainly concerned with the effects of hearing impairment that develops in adolescence or later in life. It can be seen that very little research in this area was undertaken before the mid 1970s. Although since then there has been a large body of research into the psychosocial effects of hearing loss, much of it is concerned with the impact of hearing impairment on the quality of life of elderly people. There is a noticeable gap in the literature concerning the impact of hearing loss on the lives of young adults and people under the age of 50. The larger studies considered here which have used quantitative techniques are summarised in Appendix 4. 34
  • 35.
    35 4.2 An early review (Oyer and Oyer, 1979) In 1979 Oyer and Oyer published a review into the effects of hearing loss for elderly people (Oyer and Oyer, 1979). This was the first publication to discuss in detail the social effects of hearing impairment and it highlighted the need for research on the consequences of hearing loss among older people. The authors considered that hearing loss or the wearing of a hearing aid reinforced the already negative view of elderly people, which often influenced elderly people themselves. They cited experimental work carried out in the 1960s showing that when someone is constrained and sensory input is diminished, then they feel a greater sense of being imprisoned and anxiety, and the authors equated these results with the experiences of many older people. Oyer and Oyer list the following social consequences of auditory deprivation among elderly people: • Embarrassment – caused by mishearing or misunderstanding and leading to withdrawal from communication situations • Fatigue – caused by trying to hear and trying to make oneself understood by others who do not hear well • Increased irritability – associated with experiences of failure • Increased tension – particularly increased marital tension • Avoidance and withdrawal – by the hearing impaired individual due to fear of failure, and by those who must interact with them for fear of being misunderstood (likely to be worse among older than younger adults) • Increased endangerment to bodily safety – caused by failure to hear alarm signals or locating sources • Boredom – the hearing impaired individual may engage in monologue so as to avoid questions, thus becoming a social bore; boredom may also develop as a result of channels of communication being closed to the hearing impaired person • Social rejection – as a result of the inability to understand what is being said • Increased vulnerability to promises of restored hearing – similar to that of any other disabled people who hope for cures for their condition • Depression – hearing loss can lead to suspiciousness and paranoia • Acting upon misinformation – older people with severe hearing loss may respond inappropriately to cues, and others who interact with them may similarly respond inappropriately to cues generated by them • Negativism – slowness to respond or lack of response which may be interpreted as such • Diminished opportunities to assume leadership roles – a result of retirement which is exacerbated by hearing loss • Reduction in amount of information – compounded by hearing loss in older people. 4.3 First major study of psychosocial effects (Thomas and Herbst, 1980) This study by Thomas and Herbst, published in 1980 (Thomas and Herbst, 1980) was one of the earliest investigations into the social and psychological implications of acquired deafness. It was a significant piece of work, and is cited in many of the later publications. The authors concluded that by the time patients attend a hearing aid 35
  • 36.
    36 clinic their lifestylereflects the distressing psychosocial effects of acquired deafness, and warn that the possibly pernicious effects in later life of loneliness and withdrawal caused by uncared for deafness in middle age should not be ignored. The authors discussed earlier studies which had been undertaken to investigate the links between personality, psychiatric disturbance and hearing loss and comment on their limitations. Consistently with Oyer and Oyer (1979), the authors point out the lack of previous research into the effects of acquired hearing loss on employment, social and family life. The study described here was carried out between 1975 and 1978, and investigated the relationships between hearing impairment and psychiatric disturbance, general health and well being, social and family life, and employment as well as the efficacy of rehabilitative provision. The study was based upon a sample of 211 people of employment age (120 males and 91 females) who had owned a hearing aid for between 1 and 7 years, and did not include people with untreated hearing loss. The hearing aids used were either body aids (47% of sample, 100 subjects) or monaural behind-the-ear aids. Of those subjects with body aids 16 rarely and 34 never used them, while 13 rarely and 5 never used their post-aural aids. An important aspect of this study, which does not occur in many of the more recent investigations, is that the results for the hearing impaired sample were compared with those of a matched hearing control group, which consisted of 410 subjects. Another significant feature of this research is that the subjects were of employment age (between 16 and 64 years of age, although 66% of the hearing impaired sample were aged 50 or over) whereas the majority of other studies have concerned more elderly subjects who are usually retired. The distribution of hearing loss among the hearing impaired subjects was as follows: 16% borderline (0-39 dB HL); 66% moderate (40-69 dB HL) and 18% severe to profound (above 70 dB HL). The subjects were interviewed and tested, each interview session consisting of the following: • pure tone air and bone audiometry tests • speech audiometry test using Boothroyd word lists • self-administered psychiatric screening inventory, consisting of anxiety and depression subscales • structured questions on employment, family and social life, general health and well being • structured questions relating to hearing aid use • a cup of tea. The findings of the survey are described below and, where possible, comparisons between the hearing impaired group and the control group are summarised in Table 4.1. 36
  • 37.
    37 4.3.1 Psychiatric disturbance Theassessment of psychiatric disturbance was based upon the measures of anxiety and depression. The study found that 39, or 19%, of the 205 hearing impaired subjects who completed this section of the survey were screened as being disturbed, compared with 5% of the general population. (The authors believe that the figure of 19% may in fact be an underestimate.) There was no simple linear relationship between pure tone hearing loss and speech discrimination ability or psychiatric disturbance but when these latter two effects were combined there was a dramatic increase in the proportion of psychiatric disturbance. Of those with a hearing loss of over 70 dB plus a speech discrimination score of 70% or less with aided hearing, 57% were screened as psychiatrically disturbed (compared with 5% of the general population). The authors therefore conclude that a severe hearing loss constitutes as much of a psychiatric problem as does a severely restricting physical disability. Interestingly, tinnitus did not appear to increase the likelihood of psychiatric disturbance, which was also not related to the duration of deafness. Being screened as psychiatrically disturbed was found to relate significantly to other factors related to hearing loss. These include unhappiness at work, changing jobs due to deafness, being lonely, having no friends, deafness adversely affecting marriage, feeling near to a nervous breakdown and overall dissatisfaction with life. 4.3.2 General health and well being This aspect of the survey covered physical disability, getting to sleep, staying asleep, having enough energy, consulting a doctor about a nervous problem, satisfaction with general state of health and questions relating to worry. In all categories except getting to sleep, there were significant differences between the hearing impaired and the control groups, the former being ‘worse off’ in each case. Of the hearing impaired respondents 28% reported further health problems, while only 13% of the control group reported any health problems at all including hearing loss. The only area in which there was no difference at all was in responses to questions designed to measure suspiciousness. 4.3.3 Social and family life The overriding effect of hearing impairment found in this study was loneliness, 24% of the hearing impaired group describing themselves as lonely, compared with 14% of the control group. The authors highlight the fact that extreme loneliness (feeling lonely all the time or very often) appeared to be more prevalent among hearing impaired people of employment age than among retired and elderly populations in general. Of those who said they felt extremely lonely 60% were also screened as psychiatrically disturbed, indicating the stress that may be caused by loneliness. The extent of loneliness did not appear to be related to degree of hearing loss, suggesting that any perceived breakdown in communication is likely to cause feelings of loneliness. This implies that people who are moderately deaf are likely to feel as lonely as those who are severely deaf, or that any degree of hearing impairment is likely to lead to feelings of loneliness. The authors divided loneliness into two categories: social isolation (concerning relationships outside the home) and emotional isolation (concerning family relationships). 37
  • 38.
    38 Of the hearingimpaired respondents 40% suffered from social isolation (had no friends at all or fewer than most people) compared with 25% of the control group, while 40% of the hearing impaired group found it quite or very difficult to make friends, compared with 15% of the controls. 45% suffered from emotional isolation (had no or only one person to turn to for support in daily life) compared with 26% of the control group; while 27%, compared with 12% of the controls, felt that they were left out of discussions and decision-making at home. 42% of hearing impaired subjects felt that their hearing problem was not understood by those closest to them. Less than half (48%) felt that their spouse understood what it was like to be hearing impaired. 4.3.4 Denial Of the hearing impaired sample 125 (59%) admitted that they tended not to tell other people of their deafness. The reasons given were that they felt embarrassed or ashamed (40 subjects, 19%); they had found that if they did admit their hearing problem then the public treated them badly (27 subjects, 13%); they felt they did not need to reveal their deafness (53 subjects, 25%); while 5 subjects did not know the reason. Thus at least 67 subjects (32% of the sample) could identify negative social responses to their hearing impairment and so took steps to conceal it. 4.3.5 Employment It was found that hearing impaired people were neither more nor less likely to be at work than those with normal hearing (this finding contradicts those of subsequent surveys which are discussed in Chapter 12), although it is possible that the situation has changed in the past 20 years.) However, 11% of the hearing impaired sample had changed their job due to their deafness. The authors found no evidence that duration of deafness affects employment or that hearing impaired people felt that their prospects of promotion differed from those with normal hearing. However, there was some evidence that severe deafness may deter people from remaining at work. Severely deaf people who were not at work appeared to be happier with life than those who were, while hearing impaired subjects were significantly less happy at work than a comparable group of hearing people. There is thus some evidence to suggest that hearing loss lowers the quality of working life. 4.3.6 Summary This study provided much evidence to show that hearing impairment has a detrimental effect upon the quality of life. The differences between the hearing impaired group and the control group are summarised in Table 4.1. 38
  • 39.
    39 Table 4.1 Significant differences between hearing impaired and control groups Category of effect Hearing Control impaired % group % Psychiatric 19 5** disturbance 57* Health problems 28 13 Loneliness 24 14 Social isolation 40 25 Difficulty making 40 15 friends Lack of emotional 45 26 support Left out of family 27 12 life ** Figure for the general population, not the control group * Refers to those with >70 dB HL and speech discrimination < 70% 4.4 Noise induced hearing loss (Hetu et al, 1990; Hetu, 1996) Hetu, together with colleagues, has carried out many studies into the effects of occupational hearing loss on workers and their families (Hetu et al, 1990) and, in particular, has addressed the issues of denial and stigma associated with hearing loss (Hetu, 1996). In order to examine further the issue of denial of hearing problems, found in previous studies to be a particular characteristic of men suffering from noise induced hearing loss (NIHL), Hetu et al (1990) carried out interviews with workers who suffered from NIHL, and their spouses. Previous evidence of the reluctance of men to acknowledge hearing difficulties included denial, minimisation of the problem, uneasiness in talking about the problem and attempts to appear ‘normal’ in order to protect their self image. The authors suggested three possible reasons (with references cited) why men may deny the existence of their hearing loss: • For centuries deafness has been associated with mental illness • Deafness is associated with ageing and the approach of the end of life • Admitting deafness implies perceiving oneself as belonging to an inferior social category. A group interview was held with three workers who had already participated in a rehabilitation programme, and their spouses. The workers reported being stigmatised, particularly by co-workers (usually male), and by relatives and significant others. They also experienced various psychosocial disadvantages that result directly from the inability to listen and communicate, such as fear of reduced promotion and job opportunities and difficulties in group conversations. Some regarded deafness as a sign of ageing. Thus the self image of hearing impaired workers is very vulnerable, justifying their unwillingness to acknowledge their hearing difficulties to others. Hetu et al regard this reluctance as an adaptive means to try to prevent being rejected or denied normality, and to maintain mental integrity and the capability of being a spouse. Hetu et al (1990) list the effects of revealing hearing difficulties to others, as expressed by the hearing impaired workers as follows: 39
  • 40.
    40 1 Experience of responses of scepticism and denial or surprise 2 Experience of being stigmatised by co-workers, relatives, other participants to an organisation Consequences of the stigma: i. fear of revealing hearing difficulties to others ii. reluctance to use aids iii. avoidance of contact with co-workers, isolation 3 Fear of psychosocial disadvantages: i. fear of reduced promotion or job opportunities ii. fear of being ignored in a group conversation 4 Experience of adjustment on the part of others Making others aware of the hearing difficulties i. people are more careful about the difficulties of the hearing impaired person ii. people speak with a louder voice iii. people adjust but only for a short period of time after a demand is made by the hearing impaired person. Interviews with another three hearing impaired workers who had not received any rehabilitative help, and their spouses, were also analysed. There emerged some discrepancies between the reports of difficulties by the workers and their wives. One regarded himself as capable, ‘perfectly normal’, and able to overcome any problems caused by hearing loss, but his wife cited certain difficulties (of which he might not be aware) such as not hearing the phone ring, and not hearing his wife when his back was turned. The second appeared threatened, as if he had been accused of having a hearing problem, against which he strongly defended himself, blaming other for his problems (for example, other people mumbling). The third did not consider his hearing loss to be a particular problem, regarding it as a normal occupational hazard. As with the first subject, he and his wife disagreed over his difficulties, he denying problems that were disclosed by his wife. In a review of evidence of the stigma attached to hearing impairment Hetu (1996), in addition to giving examples from his own studies, cites other research which has found evidence of embarrassment, lack of confidence, sense of inferiority, or shame. A study of women had found that they disguised their hearing loss outside the home, particularly at work and in leisure activities. They wished to hide any manifestation of hearing impairment as it is perceived to be associated with a lack of intelligence, mental health problems, weakness, disability, and old age. The women felt less feminine, and became the objects of jokes or pity. This is in contrast to the work of Hallberg and Jansson (1996) who found women more accepting than men of their hearing impairment. Hearing impairment is a threat to social identity and can lead to self-stigmatisation. A hearing impaired person has to anticipate difficult communication situations, for example social gatherings, group conversation, interactions with salespersons, in banks, or with medical personnel. Hetu considers that this anticipation is itself fraught with anxiety and frustration, and leads to avoidance of social interactions. 40
  • 41.
    41 The lengthy periodthat often occurs between the onset of difficulties and seeking help had previously been found to be between 5 and 15 years; this is a further indication of the negative stigma attached to hearing loss. Hetu (1996) points out the need for hearing impaired role models in the media. Finally, Hetu concludes that, as stigmas combine, people who are already discredited because of some other characteristic will experience the stigma of hearing loss more acutely. This may typically occur in the case of elderly people (stigmatised because of both hearing impairment and age) and of women (stigmatised because of hearing impairment and lower social status and self image). 4.5 Functional disturbance in elderly people (Bess et al 1989, 1991) Bess has carried out many studies into the effects of noise on both adults and children. His work with adults, which is reviewed here, has concerned mainly elderly people. In 1989 results of a study were published in which the relationship between the amount of hearing loss and functional disturbance (both physical and psychosocial) in elderly people was examined. Bess at al (1989) analysed the impact of hearing loss on 153 patients over the age of 65, using the Sickness Impact Profile (SIP, see Appendix 3) to measure functional and psychosocial impairment. The subjects were people who had been referred to clinics for audiological assessment, but had not yet been prescribed hearing aids. In order to examine the relationship between degree of hearing loss and effect, the hearing levels of the subjects, measured using pure tone audiometry, were grouped into four categories as follows: no loss (0 – 16 dB HL); slight loss (17 – 25 dB HL); mild loss (26 – 40 dB HL); moderate, severe and profound loss (greater than 40 dB HL). The researchers found that with increase in hearing impairment there was a trend for subjects to be older, less well educated, on slightly more medication and to score slightly higher on a mental status questionnaire. The three mean SIP scores – physical, psychosocial and overall – were calculated for each of the four categories of hearing impaired subjects. Figures 4.1 to 4.3 show the increases in the SIP scales with hearing loss category (data extrapolated from Bess et al, 1989). Figures 4.1 to 4.3 show that all three SIP scores increased across the four categories of hearing loss, as follows: the physical scale from 3.3 for the group with no hearing loss to 18.9 for those with hearing loss greater than 40 dB; the psychosocial scale from 4.0 to 16.8; and the overall scale from 5.3 to 17.1. 41
  • 42.
    42 Physical SIP scale related to hearing loss 20 18 16 14 SIP score 12 10 8 6 4 2 0 0-16 17-25 26-40 >40 Average better ear HL (dB) Figure 4.1 Relationship between physical SIP scale and hearing loss (extrapolated from Bess at al, 1989) Psychosocial SIP scale related to hearing loss 20 18 16 14 SIP score 12 10 8 6 4 2 0 0-16 17-25 26-40 >40 Average better ear HL (dB) Figure 4.2 Relationship between psychosocial SIP scale and hearing loss (extrapolated from Bess at al, 1989) 42
  • 43.
    43 Overall SIP scale related to hearing loss 20 18 16 14 SIP score 12 10 8 6 4 2 0 0-16 17-25 26-40 >40 Average better ear HL (dB) Figure 4.3 Relationship between oveall SIP scale and hearing loss (extrapolated from Bess at al, 1989) The authors carried out multiple regression analysis in order to determine which areas on the SIP scale in particular were related to hearing, and how the extent of hearing loss affected the SIP scales. The data was controlled for demographics and other confounding variables (age, race, sex, education level, number of illnesses, presence of diabetes and ischemic heart disease, number of medications, near visual acuity and mental status). The authors investigated the changes in SIP scores associated with changes in category of hearing loss (0-16 dB, 17-25 dB etc) and with a 10 dB increase in hearing loss. These changes are shown in Table 4.2. It can be seen from Table 4.2 that there are increases in all SIP scales associated with increase in hearing loss category and with each 10 dB increase in hearing loss. The relationships between hearing loss and change in SIP score were statistically significant, except for the SIP scales related to alertness, sleep/rest, work and communication. (The authors point out that communication was mainly in terms of writing and speech production rather than speech perception, which explains the lack of a statistically significant relationship with SIP.) Regression analysis showed that, for each 10 dB increase in hearing loss, the physical SIP scale increased by 2.8, the psychosocial scale by 2.0, and the overall scale by 1.3, as seen in Table 4.2. This survey therefore suggests that progressive hearing impairment in elderly patients is associated with progressive physical and psychosocial dysfunction, and that there is a continuous association between degree of hearing loss and functional disability. The closest associations are between hearing loss and the physical scales of the SIP; the causal mechanisms are unknown but the results suggest that auditory clues are important for successful physical interactions with the environment. The average SIP scores overall, and for those with hearing losses of over 40 dB are shown in Table 4.3, which includes average SIP scores reported for other conditions. 43
  • 44.
    44 Table 4.2 Changes in SIP scores related to changes in hearing (Bess et al, 1989) Changes in SIP scales Per change Per 10 dB SIP scales in category increase in of hearing hearing loss Ambulation 5.9 4.3 Physical Mobility 4.0 3.3 subscales Body care/ movement 3.0 1.9 Overall physical dimension 3.9 2.8 Social interaction 2.9 2.7 Psychosocial Communication 1.4 1.0 subscales Alertness behaviour 2.4 1.1 Emotional behaviour 3.8 2.9 Overall psychosocial dimension 2.6 2.0 Sleep and rest 2.6 3.1 Eating 1.2 1.0 Work * * Home management 6.4 4.9 Recreation/ pastimes 4.4 2.7 Overall SIP scale 2.4 1.3 * Not given The authors conclude that efforts to improve the hearing of elderly patients could result in a significant and meaningful improvement in the life quality of older people. Table 4.3 Average SIP scores for various conditions (Bess et al, 1989) Condition SIP score Unimpaired adults 2–3 Heart transplant recipients 9 – 10 (after 1 year) Hearing impaired elderly 13.4 Elderly with >40 dB HL 17.1 Patients with advanced 24 – 25 chronic obstructive pulmonary disease Terminally ill cancer and 30 – 40 stroke patients 4.6 Review of effects of acquired deafness (Rutman, 1989) A review of the psychosocial impact of acquired deafness was published by Rutman (1989). (In Rutman’s paper, the term ‘deafness’ includes partial hearing, and in this summary is used as in the original paper.) As with other authors, Rutman comments on the (then) lack of research into the problems, experiences, functional limitations and coping strategies which affect hearing impaired people. Although the paper is mainly concerned with acquired deafness, Rutman includes a comparison of the effects of congenital and later acquired deafness. The effects of congenital deafness which are discussed by Rutman are listed in Table 4.4. 44
  • 45.
    45 Table 4.4 Effects of congenital deafness Type of effect Specific effect Effects on language acquisition Effects on information processing Developmental effects Effects on reading and writing skills Assimilation into mainstream culture Limitations on career choices and aspirations Effects on life style Effects on socio-economic status Effects on standard of living Over protection Effects on personality Dependence on others Immaturity Effects on social interaction Aggressiveness, impulsiveness, frustration The main difference between congenital and acquired deafness, according to Rutman, is that, although congenital deafness has many negative effects, in general people who are congenitally deaf experience their deafness as a difference, rather than a loss as is the case with people who become hearing impaired later in life. Congenitally deaf people are also more likely to interact socially with other deaf people which leads to feelings of competency and self worth, and freedom from stigmatisation. In relation to acquired deafness, Rutman writes ‘Acquired deafness is a social and psychological loss which affects all communication and interpersonal interactions and which deprives the individual of the type of social relationships, occupational goals and overall quality of life to which they were accustomed and which gave life meaning. Studies are inconclusive about whether adjustment to hearing loss is easier or more difficult at various ages; each period of life gives rise to different problems. There is consistent agreement, however, that acquired deafness puts the individual at greater psychiatric risk and is likely to result in more significant psychological and social problems than expected in cases of congenital deafness.’ As stated above, the main difference between congenital and acquired deafness, which explains many of the psychological effects associated with the latter, is that acquired deafness constitutes a loss for sufferers, and is perceived by them as a loss and deprivation. She quotes Jack Ashley, the former British Member of Parliament, who was suddenly profoundly deafened, as writing that the congenitally deaf are… ‘…spared the desolating sense of loss. I had enjoyed natural acquisition of speech and language and had a knowledge of the hearing world. These are priceless assets in attempting to cope with total deafness. But I was painfully and permanently aware of what I had lost. My perception of that loss is a lifelong burden.’ Rutman quotes several authors who have likened the loss of hearing to other traumatic experiences in life, such as bereavement or terminal illness. All human relationships are affected by hearing impairment as it causes problems in communication, which may lead to a strong sense of isolation and withdrawal. These in turn, together with the sense of loss, may lead to depression. 45
  • 46.
    46 Rutman also addressesthe question of denial, which she considers one of the most common and potentially unhealthy responses to loss of hearing, particularly when the hearing loss is progressive. She cites references which have shown that the denial stage may last for decades in some cases, so that the hearing loss may be undetected for years with resulting unusual behaviour attributed to other causes. Denial occurs regardless of age. Adolescents deny their loss as it creates differences with their peers; working adults because of its impact on employment and career aspirations; and the elderly because of connotations with senility. Denial seriously impedes adjustment to the hearing loss as it delays the acquisition of new communication skills resulting in further social isolation. For successful adjustment to hearing loss it is necessary to recognise and accept auditory problems. Denial is often the initial response to hearing loss, and the first of several stages of adjustment, leading ultimately to acceptance of the loss, according to some authors cited by Rutman. The stages, together with the consequence of each, are listed in Table 4.5. Table 4.5 Stages of adjustment to hearing loss, as described by Rutman (1989) Stage Description Symptoms of the stage Refusal to learn communication skills 1 Denial Isolation Immobilisation At physician who made diagnosis 2 Anger At friends and family who may be impatient and unsupportive At general public who may stigmatise and misunderstand 3 Bargaining Remorse 4 Guilt Embarrassment at causing others inconvenience 5 Acceptance Unlikely to be complete Rutman cites a body of early work which showed that there was a link between acquired deafness and psychotic illness, and later work which found flaws in this original research. She therefore asserts that, while there is no conclusive evidence that late-deafened adults are more likely to suffer from psychotic illness, acquired hearing impairment can result in a devastating sense of loss giving rise to disrupted interpersonal relationships, social isolation and depression. In considering the impact of acquired deafness on elderly people in particular, Rutman cites papers which suggest that hearing loss is the most problematic sensory loss for older people which can be especially traumatic when it is mistaken for absent mindedness or senility. For older people it can have a devastating effect on their role within the family who may perceive them as less able to function independently, and so their opportunities to exercise personal control diminish. Many older people regard the problems of not hearing a speaker to be their own fault, leading to anger, fear, embarrassment and withdrawal. In old age hearing loss can have a cumulative effect with depression. Rutman reports that older men have been found to be more vulnerable to the effects of hearing loss than older women, forcing them to become more dependent on others, possibly to retire, and to relinquish the traditional male role. Older women on the other hand are better able to admit to and deal with their loss. 46
  • 47.
    47 Denial of deafnessis more common among elderly than younger people. There is some evidence that hearing loss in old age is not related to loneliness, but to isolation. Nevertheless, hearing loss in old age can have extremely serious psychological and social implications. Rutman considers the impact of acquired deafness at different stages of life. For adolescents and young adults it may have considerable effects upon career choice and goals, and on an individual’s identity development which may lead to lower self esteem. Denial in order to maintain peer acceptance may further depress self esteem and hinder the coping and adjustment process. In middle adulthood hearing impairment may disrupt professional achievements and interpersonal relationships; career goals may be ruined and marriages and friendships threatened. Denial is likely in an attempt to preserve the individual’s established lifestyle. The main problems for older people are the social isolation and withdrawal which result from communication problems, and further deterioration in relationships which may follow from misattributions of senility. 4.7 Hearing impairment and quality of life of elderly people (Mulrow et al, 1990a, 1990b) The results of two studies on elderly people were published by Mulrow and colleagues in 1990 (Mulrow et al 1990a, 1990b). The aims of both studies were to identify the types and extent of dysfunction experienced by elderly individuals with hearing loss. In both studies the quality of life of subjects was assessed using a combination of the following five scales (briefly described in Appendix 3): Hearing Handicap Inventory for the Elderly (HHIE), Quantified Denver Scale of Communication Function (QDS), Short Portable Memory Status Questionnaire (SPMSQ), Geriatric Depression Scale (GDS) and Self Evaluation of Life Function (SELF). The first study (Mulrow et al, 1990a) involved 204 subjects, of whom 106 were hearing impaired (defined fairly crudely initially as having a better ear threshold of 40 dB or more at 2000 Hz). The subjects were almost all male, and were non hearing aids users who had been referred to audiology clinics. Of the hearing impaired subjects, 60% were subsequently found to have minimal hearing loss (< 40 dB HL); 32% to have moderate hearing loss (41-55 dB HL); and 8% moderately severe loss (56-70 dB HL). None of the subjects had severe to profound loss (> 70 dB HL). All subjects were over 64 years of age, the mean age being 71 years. The individuals with hearing loss were in general found to be older, more often retired, less well educated and more likely to suffer from depression than the other subjects, which is consistent with the findings of Bess et al (1989; 1991) described above. Table 4.6 shows the mean scores of hearing impaired and unimpaired subjects on the various quality of life scales. A higher score indicates greater dysfunction. 47
  • 48.
    48 Table 4.6 Mean quality of life measures associated with hearing impairment (Mulrow et al, 1990a) Hearing Not hearing Quality of life measure impaired impaired Overall hearing handicap (HHIE) 52.2 22.2 HHIE social subscale 25.7 11.1 HHIE emotional subscale 26.9 10.6 Communication (QDS) 61.8 40.0 Depression (GDS) 3.3 2.9 Life function (SELF) 94.5 92.9 After adjusting for confounding variables there were significant relationships between hearing impairment and • functional handicap as measured by the HHIE scale • social and emotional handicap as measured by the HHIE scale • communication as measured by the QDS scale. Relationships between hearing impairment and depression or dementia were not significant, nor those between hearing impairment and life function scores. However, the self esteem and social satisfaction subscales of the SELF scale were statistically significantly related to hearing impairment. The degree of hearing loss was statistically significantly correlated with the quality of life areas measured by HHIE and QDS but not with those of the GDS and SELF scales. In agreement with the work of Thomas and Herbst (1980) and Bess et al (1989; 1991), greater hearing loss was associated with greater dysfunction. Overall, the extent of social and emotional dysfunction was considerable: 66% of hearing impaired subjects reported severe handicap; 16% mild to moderate handicap and 18% minimal to no handicap. The authors found significant social, emotional and communication difficulties associated with hearing loss, even those whose loss was mild to moderate reporting social and emotional handicaps. The authors believe that in this study the effects of hearing loss may be underestimated owing to possible incorrect initial classification of individuals with some hearing impairment. They also point out that 98% of their subjects were male and that the results should not necessarily be generalised to women. In a second study Mulrow et al (1990b) examined the effects of hearing loss on the quality of life of 188 subjects who were candidates for hearing aids. The study used the same five scales as before for assessing quality of life. Hearing loss was mild (0 to 40 dB HL) in 70% of subjects; moderate (41 to 55 dB HL) in 27% of subjects; and moderately severe (56 to 70 dB HL) in 3% of subjects. In a baseline study, before hearing aids were provided, 63% of the subjects reported severe social and emotional handicap due to hearing impairment; and 20% mild to moderate handicap. Moderate communication difficulties were reported by 85% of the sample, and depression was identified in 23% of subjects. Thus, as in the previous 48
  • 49.
    49 study severe handicapsin social, emotional and communication were found even among people with mild to moderate hearing loss. Hearing impairment was also related to both cognition and depression. Changes following the provision of hearing aids are discussed in Chapter 9. 4.8 Community surveys of hearing problems in England and Wales (Stephens et al, 1990, 1991; Herbst et al, 1991) Stephens has carried out many studies with colleagues into the prevalence and effects of hearing impairment, communication strategies, and use of hearing aids. In 1986 the Cardiff Health Survey questioned 5145 residents, randomly sampled from the electoral register, about general health issues. Hearing difficulty was reported by 14.7% of the 4266 respondents, the response to the hearing question being one of the highest in the survey. (This is consistent with the estimate of 1 in 7 people in the UK being hearing impaired, as discussed in Chapter 3.) Some of the respondents wore hearing aids, but the number is not reported in the paper. People with hearing difficulties described the main problems that they experienced, the reports subsequently being analysed by Stephens et al (1990). The commonest complaints were difficulty hearing radio and TV (22.4% of hearing disabled respondents) and with general conversation (20%). The numbers of people with each of these complaints increased markedly with age. However, the oldest age group (> 75 years) was the least likely to complain of difficulty with hearing speech in noise. When the data was analysed by social class it was found that younger individuals in social class I (professional classes) were disproportionately represented among the complainants of difficulty hearing in noise; this may be because this problem interferes with their professional needs and also their readiness to articulate the problem. Older individuals and those in poor general health were less likely to be involved in social activities so less likely to report this as a major difficulty. General conversational difficulties were reported by those who had been ill within the previous 2 weeks; the authors postulate that this could be because such problems had been exacerbated recently through the need to communicate with unfamiliar health care professionals and other strangers (the findings of the RNID survey on doctors described in Section 4.12 suggests that this could well be the case). A subsequent paper by Herbst et al (1991) compared the experiences of hearing impaired elderly people in London with a similar group in rural Wales. A sample of 253 people aged 70 and over in London, and 99 similar subjects in rural Wales were screened for hearing loss, dementia, and depression and interviewed about general health, use of health and welfare services, loneliness and social contacts, and the experience of hearing impairment. The incidence of hearing impairment was higher in Wales but that sample had mostly worked in heavy and noisy industry such as mines and the steel works. In both areas hearing impairment was significantly associated with a desire to reduce outdoor activity (after controlling for sex, age, and poor health of subjects). In both areas 25% of the hearing impaired subjects said they had not noticed any problems with their hearing. They also showed little desire to identify or socialise with others with the same handicap. Of those who admitted to a hearing loss (100 subjects in London and 52 in Wales), 29% in London and 33% in Wales had hearing aids. 49
  • 50.
    50 Those for whomthe onset of hearing impairment occurred before retirement were significantly more likely than others to describe their hearing as bothersome. This was to be expected since its advent was untimely, and because of the associated stigma they had done nothing about it. 4.9 Sensory impairment and quality of life in an elderly population (Carabellese et al, 1993) An interesting study into the effects of both visual and hearing impairment on the quality of life of elderly people living at home in a town in Italy was carried out by Carabellese et al (1993). The hearing and visual acuity of 1192 subjects aged between 70 and 75 were tested. It was found that 131 subjects had uncorrected visual impairment and 126 uncorrected hearing impairment, with 20 subjects being uncorrected for both visual and hearing impairment. Subjects for whom hearing or visual impairments were successfully corrected were grouped with ‘adequate’ subjects. Thus the term ‘hearing impaired’ in the following refers to people who were hard of hearing and did not wear hearing aids. The subjects were divided into four groups, according to visual and hearing function: adequate auditory and visual functions (n = 948); uncorrected hearing impairment but adequate visual function (n = 106); uncorrected visual impairment but adequate hearing function (n = 118); and uncorrected visual and hearing deficits (n = 20). A limitation of this study is that the hearing impairment was not measured using audiometry, or even self assessment of hearing handicap; a relatively crude hearing test of subjects (based on ability to hear three random numbers) was carried out. The quality of life of subjects was evaluated using four scales: Beck’s Depression Inventory scale (BDI), Mental Status Questionnaire (MSQ), Instrumental Activities of Daily Living (IADL) scale and the SELF social relationships scale (see Appendix 3 for definitions of the scales). An assessment of health was made through considering the number of days in bed and use of health services by subjects. The frequency distribution of the psychosocial and physical health variables for the four groups of subjects is shown in Table 4.7. The presence of a single sensory impairment (hearing or visual) was associated with significantly higher prevalence of subjects with low mood level or depression (but female gender and few social relationships were more strongly related to mood than sensory impairment); with loss of self-sufficiency in daily living activities; and with poor social relationships. Visual impairment doubled the risk of a low social relationships score, however, mood level and male gender were more important factors. Among subjects with adequate visual function, hearing impairment increased the risk of poor functioning in daily living activities by a factor of 2.1. The mood level was found to be significantly higher in those with both adequate sensory functions than those with a deficit in either. Similar results were found for the IADL and SELF scores. 50
  • 51.
    51 Table 4.7 Frequency distribution of psychosocial and health variables ( Carabellese et al, 1993) Vision Vision Vision Vision adequate adequate impaired impaired Hearing Hearing Hearing Hearing adequate impaired adequate impaired n = 948 n = 106 n = 118 n = 20 No % No % No % No % Normal 677 71.4 60 56.7 57 48.3 9 45.0 Mood Low 224 23.7 37 34.9 49 41.5 6 30.0 Very low 47 4.9 9 8.4 12 10.2 5 25.0 Self- Dependent 87 9.2 22 20.8 21 17.1 6 30.0 sufficiency Independent 861 90.8 84 79.2 97 82.9 14 70.0 Impaired 28 3.0 5 4.7 6 5.1 3 15.0 Cognition Unimpaired 920 97.0 101 95.3 112 94.9 17 85.0 Low 237 25.0 36 34.0 57 48.4 10 50.0 Social Middle 464 48.9 54 50.9 44 37.2 7 35.0 relationships High 247 26.1 16 15.1 17 14.4 3 15.0 Good 648 68.3 69 65.1 83 70.3 11 55.0 Physical Borderline 263 27.7 32 30.2 25 21.2 8 40.0 health Poor 37 4.0 5 4.7 10 8.5 1 5.0 Thus the results of this study suggest a significant worsening in most quality of life measures (affective, functional and social), which is independently associated with functional deficit in either vision or hearing. The presence of impairment in either vision or hearing approximately doubled the risk of being impaired in each quality of life measure. Visual impairment had the stronger effect on depression and social relationships whereas hearing impairment had the stronger effect on self sufficiency in daily living. The data presented by the authors, see Table 4.7, can be reanalysed as shown in Table 4.8, to divide subjects into those who are hearing impaired and those who are not. Table 4.8 Differences between hearing impaired and non-impaired samples in survey of Carabellese et al (1993) Hearing adequate Hearing impaired n = 1066 n = 126 No % No % Normal 734 68.9 69 54.8 Mood Low 273 25.6 43 34.1 Very low 59 5.5 14 11.1 Self- Dependent 108 10.1 28 22.2 sufficiency Independent 958 89.9 98 77.8 Impaired 34 3.2 8 6.3 Cognition Unimpaired 1032 96.8 118 93.7 Low 294 27.6 46 36.5 Social Middle 508 47.7 61 48.4 relationships High 264 24.8 19 15.1 Good 731 68.6 80 63.5 Physical Borderline 288 27.0 40 31.7 health Poor 47 4.4 6 4.8 51
  • 52.
    52 Table 4.8 highlightsdifferences between the hearing and hearing impaired subjects. It can be seen that, among the hearing impaired subjects the percentages with ‘very low’ mood (that is with depression), who are dependent and whose cognition is impaired are approximately double those of the hearing subjects. It is possible that the figures shown here underestimate the effects of hearing impairment as the category ‘hearing adequate’ includes people who are hearing impaired but wear hearing aids. It could be argued that this is likely to reduce the scores of the ‘adequate’ category while increasing the scores of the ‘impaired’ group, thereby reducing the differences between the two groups. It should also be remembered that this research was primarily aimed at investigating the differences between visual and hearing impairment in terms of psychosocial effects, and not at determining the effects of hearing impairment per se. 4.10 Men and women with noise induced hearing loss (Hallberg, 1996, 1999; Hallberg and Janssen, 1996) Hallberg has published several papers describing how people adjust to and cope with noise induced hearing loss (NIHL). Most studies into the effects of noise induced hearing loss have focused on men, but Hallberg has looked specifically at the differences between men and women in perceived disability and coping with NIHL. As with other hearing disabilities, NIHL causes problems of interaction (an ‘invisible barrier’) between a person and their environment, largely due to difficulties in communicating with other people. Hallberg (1996) considers that people suffering from NIHL may be confused about their hearing status as the capacity to converse may vary depending upon the background noise. She cites research which shows that a person with moderate NIHL hears 90% of what is said in a quiet environment but only 40% in a noisy environment; for severe hearing loss the proportions are 65% and 10%; whereas a person with normal hearing hears 98% of speech in a quiet environment and 75% in a noisy environment. Hearing impaired people believe that people with normal hearing do not understand their problems which leads to frustration and aggression. Hallberg describes various methods of adjustment to hearing loss, and strategies for coping with day to day situations. One method of adjustment is to exclude potentially demanding situations such as parties, group meetings, or restaurant visits, and to choose to socialise only with small groups of close friends. Avoiding certain social situations can lead to loneliness, isolation, a lower self image and decreased quality of life. Avoiding strategies such as this are more often employed by men than by women. It has been found that men who have tinnitus in addition to NIHL are more likely to adopt avoiding strategies. Many people adopt strategies to enable them to cope with situations they find difficult. The main motivation for coping strategies is to maintain a positive self image and to appear to be ‘normal’ in dealing with others. Controlling strategies where hearing impaired people attempt to take control of a situation are often adopted by people at work. Typical examples of controlling strategies include asking for repetition, or informing others in advance about a hearing disability. In her paper Hallberg (1996) reviews literature which shows that NIHL can cause marital and family difficulties, and discusses interviews which she carried out with hearing impaired men and their wives. Hearing impairment can affect the relationship 52
  • 53.
    53 between couples. Communicationbetween a couple may be minimised or hardly exist at all in some cases. A spouse is often described as the ‘least understanding person’, and there may be contradictions between a hearing impaired person and their spouse (Hetu et al, 1990; Hallberg, 1996). A spouse often becomes irritated and frustrated by requests to repeat what is said. Men with hearing loss are often unwilling to go out to the theatre, cinema or a party; the spouse may either stay at home too or go out on their own thereby engendering further negative effects on the relationship. A spouse described living with a man with NIHL as a ‘demanding and exhausting task’. Participating in social gatherings can put additional stress upon a partner; in many cases the wife takes responsibility for the husband’s inability to hear, and responds or advises the husband on how to behave and cope. Overall, it is difficult for a couple to preserve the social image of a ‘normal’ couple. Hallberg cites references which show that interpersonal relations within a family may also be affected, for example through less intimate talking and joking. A hearing impaired parent may become less involved in family matters as children will turn towards the normally hearing parent (usually the mother in cases of NIHL). Hearing impairment can be a source of annoyance, with hearing impaired individuals showing more aggression and irritation at home than at work. The interviews with wives highlighted ‘the husband’s reluctance or unwillingness to acknowledge hearing difficulties’ and ‘the impact of hearing loss on the couple’s intimate relationship’. Most of the wives interviewed by Hallberg described frequent misunderstandings and irritation within a family, which might have a further negative impact on a couple’s intimate relationship. According to one woman ‘a hearing disability has many consequences on the close relationship...even in the bedroom’. In a study to examine the experiences of women with NIHL, Hallberg and Jansson (1996) interviewed ten women with NIHL of whom nine wore a hearing aid. The average better ear hearing loss was 60 dB HL. The women showed ambivalent attitudes to their hearing loss although most accepted and acknowledged their hearing difficulties. They strove to maintain social relationships and to take part in social activities, although they often avoided or withdrew from situations such as group discussions or meetings, and attempted to avoid bothering others. In social situations various coping strategies were used. Controlling strategies included asking people to speak up, informing people about their hearing loss, asking for repetition or dominating in conversations. Avoiding strategies such as minimising hearing difficulties, pretending to hear, or guessing what has been said were also used. The women felt stigmatised by their hearing loss and quoted negative attitudes of other people, including being viewed as mentally retarded or prematurely aged, or being defined as an abnormal person. Family and friends were cited as the people most openly showing and expressing irritability. The unwillingness of other people to adjust to their problems caused emotional distress and irritation. Unknown people tended to view them as stupid, and lacked knowledge of hearing impairment in general. A more detailed investigation into the differences between men and women with noise induced hearing loss involved a comparison of 60 male (mean age 55) and 33 female (mean age 71) NIHL sufferers (Hallberg, 1999). Both groups had a mean high 53
  • 54.
    54 frequency hearing lossof 61 dB in the better ear, while the low frequency loss for females (37 dB) was greater than that of the males (22 dB). All subjects rated their hearing loss as ‘moderate’ to ‘severe’ on a four-point scale ranging from ‘mild’ to ‘very severe’. The Communication Strategies Scale (CSS) and Hearing Disability and Handicaps Scale (HDHS) were used to measure coping and perceived disability and handicap respectively (see Appendix 3 for definitions of the scales). It was found that in communication women used maladaptive behaviour (for example, pretending to ignore people so that they repeated what was said) and verbal strategies (for example, asking people to repeat) significantly more often than men. There was no significant difference in the use of non-verbal strategies (for example, sitting where it will be easier to hear) which were the strategies most often used by the group as a whole. There were also no significant differences between men and women in perceived disability and perceived handicap, as measured by the HDHS scale. The reluctance of men to acknowledge hearing handicap might indicate a need to avoid stigmatisation and preserve a positive self image. 4.11 Effects of hearing impairment on young people (Gregory, 1998) In a chapter in Marschark and Clark (1998), Gregory writes of the consequences of deafness of young people in late adolescence and early adulthood, focusing mainly upon their social and family relationships. No definition of ‘deafness’ is given and the paper appears to relate to young people with partial hearing loss as well as total deafness. In the study by Gregory et al (1995) upon which much of the chapter is based, it was considered irrelevant and inappropriate to define hearing loss clinically and to identify individuals in terms of their hearing loss, but it is clear that the term ‘deafness’ is used to refer to both profound and partial hearing loss (see below). Gregory writes that, whereas language and communication are taken for granted in most young people, the young deaf person has a different experience. Language is important for establishing, maintaining and sustaining social relationships, and has a more general significance in the development of a young person as much of the understanding of rules of social interaction comes though incidental, overheard or overseen communication. Gregory also states that, while much has been written about the social development of young deaf children and their mothers, less attention has been paid to the social life of the deaf adolescent and young person. There is also a lack of knowledge about the impact of deafness on the mother-child relationship for older children. Family relationships can be affected by difficulties in communication within a family, which may have consequences for identity and social relationships. Gregory cites the earlier (1995) study carried out by herself and colleagues in which they interviewed 82 hearing families and 61 of their deaf sons and daughters in their late teens and early twenties (Gregory et al, 1995). This was part of a longitudinal study following the progress of deaf children and their families since early childhood (Gregory, 1976). In this study, individual hearing losses are not given for the reasons described above. However, both parents and the young people themselves were asked to describe their hearing loss. Responses are shown in Table 4.9. Interestingly, as noted by Gregory, apart from profound deafness there was little agreement between the responses of parents and young people. However, it can be seen that a sizeable proportion of the sample of young people were partially hearing. 54
  • 55.
    55 Table 4.9Degrees of hearing loss reported by parents and young people (Gregory, 1998) Degree of hearing loss Percentages reported Parents Young people Profound 63 53 Severe 11 7 Moderate 0 2 Partially hearing 11 12 Don’t know 15 25 Not answered 0 3 Most of the young people interviewed (95%) possessed hearing aids although only 67% of the sample wore them regularly. Issues concerning the use of hearing aids are examined in Chapter 7. The research team found that 25% of deaf young people communicated best with their mother, 20% with a sibling but only 5% with their father, communication with a father being found difficult in many instances. Seven per cent said that there was no one in the family with whom they could communicate. Research cited by Gregory has also shown that deaf young people are more dependent on their families, both financially and in terms of leaving home, than their hearing counterparts. Parents may be asked to help in dealing with colleagues and in obtaining employment, and may need to explain financial and other matters. In Gregory’s 1995 study, of forty 20-21 year olds 70% were still living in the family home and half of them needed help with managing their finances. Although most could cope with travelling on their own fewer than half (16) were able to go to the doctor alone. They also found that parents felt they took a greater role in organising their children’s social arrangements than they would for hearing children, a situation that was not always satisfactory for either party, and sometimes a cause of concern for parents. Gregory considers that the study of sibling relationships is a neglected area. Family relationships may be affected by differences in the treatment of hearing and deaf siblings, for example there may be resentment when a parent spends more time with a deaf sibling. There can be a negative impact on sibling relations when hearing siblings, who are unable to communicate with a deaf sibling, look outside the family for relationships. However, in their study Gregory and colleagues found that relationships with siblings were described in positive terms, with 42% of the deaf young people saying they got on very well with their siblings, 32% quite well, 20% with some and not others, and only 4% (2 subjects) saying they did not get on well at all (Gregory et al, 1995). Communication within a family may be difficult. In Gregory’s study young people reported feeling either left out of family gatherings or embarrassed by attempts to include them. There is a danger that young deaf people miss out on access to information which is part of general family conversation. Often parents assume that the deaf child is aware of information when they are not. Of the young people questioned, 80% said that a lack of communication had occurred to them, including 55
  • 56.
    56 the communication ofmajor events such as deaths in the family, pregnancy and marital breakdown. Some young people enjoy a rich and varied social life, a number travelling long distances to meet deaf friends. However, some are extremely lonely at times, feel isolated and have difficulty making and sustaining friendships. In Gregory’s survey young people described themselves as seeing friends often or sometimes, but parents described the majority of young people as having difficulty making friends. Many of the young people interviewed experienced periods of loneliness or feelings of not belonging. Gregory discusses other studies which have examined the impact of educational setting on social life. Many have found that deaf students experience social difficulties in mainstream educational settings, including loneliness, isolation and social rejection. Gregory notes the importance of being able to communicate in a group when deaf people are educated with hearing peers. In Gregory’s own study (Gregory et al, 1995), of the 34 deaf young people who had hearing friends 19 said they had great difficulty communicating in a group setting, 5 had some difficulty and only 10 said they could converse easily. Apart from the obvious difficulty in following conversation in a group, a secondary effect is that information that is conveyed informally in such situations may be missed. Gregory also found that some young people were isolated at work or college, around one third being considered by their parents to have no friends there. Parents suggested this could be due to difficulties in carrying on conversations at the same time as doing their work. They also perceived their children to be reluctant to join groups of hearing people because of the possibility of their being excluded. When young people went out with hearing friends, they needed to be doing something positive, and tended to be invited to relatively structured occasions such as weddings or sports matches, possibly because more informal gatherings are difficult as they involve more verbal negotiation. Work is cited which suggests that deaf young people regard establishing boy/girl relationships to be difficult. Of the 48 young people over 21 in the study by Gregory et al (1995), 18 (38%) were reported by their parents never to have had a boy or girl friend. 4.12 Experiences of deaf people (RNID, 1999) In 1999 the RNID (Royal National Institute for Deaf and Hard of Hearing People) published the results of a survey of its members, the aim of which was to quantify deaf and hard of hearing people’s experiences of social exclusion, isolation and prejudice. The report also investigated access to and the quality of services provided by local doctors and health centres. The RNID is unaware of exactly how many of its members are totally deaf and how many are hard of hearing. In a survey of its members in 2001, of the approximately 1000 who responded, 54% were hard of hearing, 22% deaf, 9% deafened and 9% hearing. The hearing profiles of respondents to this survey are also unknown but, if these figures are typical of RNID membership and if respondents to this survey are a representative group of RNID members, then it 56
  • 57.
    57 may be assumedthat approximately half of the survey respondents were hard of hearing. The survey of RNID members was conducted by post and the survey of doctors through face to face interviews with GPs. In total, the responses of 1666 deaf and hard of hearing people (54% female, 44% male, 17% working full time, 8% working part time) and 422 GPs were analysed. The main findings of the survey are presented below. 4.12.1 Deafness, isolation and exclusion Large numbers of respondents reported problems of social isolation or communication, as follows: • More than seven out of ten (71%) felt isolated because of their hearing loss. • More than one third (39%) avoided meeting new people. • Almost half (46%) had given up trying to explain how to make communication easier. • The vast majority (86%) had difficulty coping in public places such as shops and restaurants (typical problems included ordering an incorrect item or meal). • The vast majority (91%) thought hearing people failed to appreciate their difficulty, and that therefore other people did not make adequate compensation for their hearing loss. • Almost half (46%) had given up trying to explain to people how to make it easier for them to communicate. • Over half (59%) believed that hearing people think they are stupid. • Over half (55%) believed people think they are stupid if they ask them to repeat a question. • Almost 9 out of 10 had to ask people to repeat what they had said. • More than one in five admitted that they were embarrassed about wearing a hearing aid. • More than one in five avoided informing people of their hearing loss. 4.12.2 Prejudice and abuse A shocking finding is the extent of prejudice, intolerance and abuse experienced by deaf and hard of hearing people. The survey found that having a hearing loss at least doubles the likelihood of experiencing abusive language in most situations. The most common problems experienced were other people being impatient and not taking time to communicate with a deaf person; patronising a deaf person and treating them as stupid; and using abusive language because of frustration or malice. The statistics relating to prejudice and abuse experienced by the respondents are as follows: • The vast majority (83%) had experienced impatience, with almost one quarter of under 25s experiencing impatience on a weekly basis. • Almost two thirds (63%) had been patronised by a stranger because of their hearing loss. • Nearly half (47%) had been made fun of because of their deafness. 57
  • 58.
    58 • Nearly half (47%) claimed to have been ignored because of their deafness. • One in five had been the victim of abusive language and gestures. • One in 20 had experienced physical violence. 4.12.3 Visits to doctors The survey of RNID members found that visiting the doctor is a particular problem for many deaf and hard of hearing people. The difficulties experienced may have serious consequences, for example illness may be undiagnosed or untreated. Particular problems experienced by respondents are listed below: • Almost a quarter (23%) had left a doctor’s surgery unsure of what was wrong with them. • Almost a third (32%) were dependent on friends and family interpreting for them at a medical appointment. • One in six (16%) avoided going to the doctor’s because of communication problems. • One in six (16%) found communicating at GP surgeries a barrier to getting an appointment. • Almost two thirds (63%) thought GP surgeries could be improved. • More than two thirds (68%) thought hospitals could be improved. In contrast to the reports by the RNID members, the survey of GPs found that 87% of them felt that they could communicate effectively with their deaf and hard of hearing patients. However, more than half (52%) of the GPs were unaware of what facilities they had to support deaf and hard of hearing people; only 12% of them used any form of communication support (including interpreters); only 12% provided deaf awareness training for staff; only 5% had an induction loop installed at reception; and only 4% had a text phone. 4.13 Psychological aspects of acquired hearing loss (McKenna, 2001) McKenna writes about the emotional consequences of hearing loss, including the relationships between hearing loss and emotional disorder and cognitive functioning, in the sixth edition of Ballantyne’s Deafness, edited by Graham and Martin (2001). He points out that, despite the widespread nature of hearing loss, the popular image of people with hearing impairment is not flattering as it is associated with old age and with frailty of body and mind, and has connotations of stupidity. In the past psychiatrists involved in the care of deafened people often described patients as neurotic or paranoid, leading to reports of negative emotional consequences of hearing impairment. The prevalence of psychological disorder among hearing impaired people has been examined in various studies, some of which have shown a high prevalence of emotional disorder. However, the methods used to reach these conclusions have often been flawed in terms of psychiatric classification. Studies using questionnaire techniques to quantify particular types of psychosocial disturbance have reported elevated levels of psychopathology and maladjustment, including depression, neurotic symptoms, anxiety and social isolation. A study by McKenna himself and colleagues in 1991 found that 27% of people attending a neuro- otology clinic with hearing loss suffered from significant psychological disturbance. 58
  • 59.
    59 This is considerablyhigher than the prevalence of psychological disturbance among the general population (5%) but lower than prevalence rates associated with conditions such as tinnitus and vertigo. The relationship between hearing loss and mental health has also been studied by examining the extent of hearing loss among patients with psychiatric disorders. Results suggest that hearing loss increases the chance that a patient will have a diagnosis of schizophrenia, and that it is one of a number of factors that distinguishes patients with paranoid psychosis from those with affective psychoses. However, these studies did not properly account for confounding factors such as health, age and noise exposure. Other studies have produced conflicting results, and when other health problems are taken into account correlations between hearing loss and anxiety and depression become weaker. There is likely to be more significant psychological distress when multiple symptoms, for example hearing loss and tinnitus, are present. Several studies have found a strong association between hearing loss and confusion or dementia. However, in some cases the association has been lost when age is taken into account. Complaints of difficulty in concentration are found among hearing impaired people, including younger people. It has been assumed that difficulties in concentration are due to fatigue, resulting from the effort of listening and lip reading, or from emotional distress. However, recently subtle difficulties in information processing, which can not be explained in terms of fatigue or emotion, have been noted, including evidence that the degree of difficulty was related to the duration of hearing loss. These studies suggest that some people with hearing loss may be less able to process certain types of verbal information. The complexity of the relationship between hearing loss and psychological disturbance, in particular between the degree of hearing loss and extent of disturbance is not well understood. McKenna cites the work of Kerr and Cowie (1997) who described the multidimensional nature of hearing loss in terms of 6 factors: • communication problems • social restrictions such as employment difficulties and strained family relationships • poor interactions on the part of others, for example use of gestures rather than speech or ignoring, which undermine confidence • distress associated with interactions such as anticipating and trying to avoid communication breakdown • sense of loss and bereavement, and feeling that hearing people do not understand • positive experiences such as social support and inner resources. McKenna concludes by listing areas, in addition to depression and isolation, in which hearing loss may interact with a person’s psychological state, all these factors also being influenced by age, social circumstances and education: • the individual’s own image of a deafened person • the fact that deafness has the power to make people less socially capable • the fact that deafness may make the processing of verbal information harder and so slow up the normal flow of interaction 59
  • 60.
    60 • people’s differing tolerance of, and compensation for, their disability • the fact that a person’s handicap from deafness can be related to his or her own attitude to the disability. 4.14 Conclusions This chapter has described in some detail a selection of studies of psychosocial effects of hearing loss that have been carried out in the past 30 years. It can be seen that most of the studies provide conclusive evidence of the negative effects of hearing loss, with many of them identifying similar effects. The results of the studies discussed in this chapter which have produced quantitative data are summarised in Appendix 4. In the next chapter each of the psychosocial effects found in the various studies is discussed separately, drawing together the evidence from the studies examined in this chapter, plus some other studies. In Chapter 11 studies concerning the effects of hearing loss on employment are considered. 60
  • 61.
    61 CHAPTER 5 PSYCHOSOCIAL EFFECTS OF HEARING LOSS 5.1 Introduction It is evident from the papers described in Chapter 4 that hearing impairment can have significant psychosocial effects, with a detrimental impact upon an individual’s quality of life. This chapter describes the psychosocial effects of hearing loss that have been identified by various research studies, some of which were reviewed in the previous chapter; inevitably, in this chapter there is some repetition of results already presented. As pointed out in Chapter 4 most of the studies have been carried out in the past 30 years; very little research on the psychosocial effects of hearing loss appears to have been carried out before the 1970s. In this chapter, in addition to general effects of hearing loss on quality of life, specific effects such as loneliness, memory loss and so on are discussed. The main categories of the effects identified from the papers reviewed in Chapter 4 are listed in Table 5.1. This chapter discusses each of the categories, other than employment which is addressed in Chapter 11, individually and cites the evidence of (or against) a relationship between hearing loss and the particular effect. The references that are cited in each category are tabulated in Table 5.2. Table 5.1 Categories of effects of hearing impairment Overall quality of life Loneliness/social isolation/exclusion Psychiatric disturbance and depression Family relationships Stigma and low self esteem Education Denial Difficulties in particular environments General health/visiting the doctor Cognitive skills and dementia Memory loss Intimate relationships Prejudice and abuse Employment In reviewing the literature on adults it has become obvious that, while there has been a great deal of research, particularly in the past 25 years, in this area, most of this research has focused on the effects of acquired hearing loss on elderly people. There is a gap in the literature concerning the experiences of young and middle aged hearing impaired adults and the effects of hearing loss on their lives. There is also a great deal more research concerning the impact of hearing loss on men than on women; this is largely due to a number of studies of the effects of noise induced hearing loss, which 61
  • 62.
    62 mainly affects men,and because in many cases a large proportion of a sample of elderly hearing impaired individuals are men who have been deafened at work. Table 5.2 References for each psychosocial effect of hearing loss Effect References which discuss effect Overall quality of life Bess et al (1989); Carabellese et al (1993); Cheng and Niparko (1999); Erlandsson and Holgers (2001); Espmark et al (2002)*; Grimby and Ringdahl (2000); Hallberg (1996); Mulrow et al (1990a, 1990b); Oyer and Oyer (1979); Rutman (1989); Sorri et al (2001); Thomas and Herbst (1980); O’Neill (1999); Vesterager and Salomon (1991)* Loneliness/social Arlinger (2003); Barnett (2002); Carabellese et al (1993) isolation Committee on Disabilities of the Group for the Advancement of Psychiatry (1997); David and Trehub (1989); Davies et al (2001); Lalande et al (1998); Erlandsson and Holgers (2001); Espmark et al (2002)*; Gregory (1998); Grimby and Ringdahl (2000); Hallberg (1996); Hallberg (1999); Hallberg and Jansson (1996); Hauland and Gronninguter (2003); Herbst et al (1991); Joore et al (2003)*; Knutson and Lansing (1990); Oyer and Oyer (1979); RNID (1999); Rutman (1989); Thomas and Herbst (1980); Vesterager and Salomon (1991) *; Weinstein and Ventry (1982); Chen (1994) Psychiatric Barnett (2002); Bess et al (1991); Carabellese et al (1993); Committee on disturbance and Disabilities of the Group for the Advancement of Psychiatry (1997); David depression and Trehub (1989); Dye and Peak (1983); Grimby and Ringdahl (2000)*; Herbst et al (1991); Knutson (1990); McKenna (2001); Mulrow et al (1990a, 1990b); Oyer and Oyer (1979); Rutman (1989); Thomas and Herbst (1980); O’Neill (1999); Chen (1994) Family relationships Barnett (2002); David and Trehub (1989); Gregory (1998); Hallberg (1996); Hauland and Gronninguter (2003); Knutson and Lansing (1990); Rutman (1989); Thomas and Herbst (1980); Vesterager and Salomon (1991)* Stigma and low self David and Trehub (1989); McKenna (2001); Mulrow et al (1990a); Noble esteem (1996); Oyer and Oyer (1979); Hallberg (1999); Hallberg and Jansson (1996); Herbst et al (1991); Hetu et al (1990); Hetu (1996), Lalande et al (1998); Chen (1994) Education Bess et al (1989); Danermark et al, 2001); Hauland and Gronninguter (2003); Gregory (1998); Mulrow et al (1990a); Rutman (1989) Denial David and Trehub (1989); Hetu et al (1990); Hetu (1996); Herbst et al (1991); Rutman (1989); Thomas and Herbst (1980) Employment David and Trehub (1989); Herbst et al (1991); Joore et al (2003); RNID (2000); RNID (2002); Thomas and Herbst (1980)*; Chen (1994); O’Neill (1999) Difficulties in Breadin (2000); Davies et al (2001) particular environments General health/ Breadin (2000); Gregory (1998); RNID (1999); O’Neill (1999); visiting the doctor Cognitive skills and Bess et al (1989); Bess et al (1991); Committee on Disabilities of the Group dementia for the Advancement of Psychiatry (1997); Hallberg (1999); Hetu (1996); Noble (1996); McKenna (2001); Mulrow et al (1990b) Memory loss Dye and Peak (1983); Rabbit (1991) Intimate relationships Gregory (1998); Hallberg (1996); Rutman (1989); Thomas and Herbst (1980); Hetu et al (1993) Prejudice and abuse Hetu et al (1990); Hetu (1996); RNID (1999) * These references show no or little relationship between hearing loss and the effect 62
  • 63.
    63 Hearing impairment causesdifficulty in hearing and interpreting sound, to a greater or lesser extent depending upon the severity of the loss, the efficacy of any hearing aids, and the environment in which aural functioning is taking place. Most of the psychosocial effects of hearing loss discussed here are direct consequences of the problems experienced in interacting with other people and the individual’s environment. Arlinger (2003), in a review of the negative consequences of uncorrected hearing loss, noted that the commonest complaints among hearing impaired people concern problems in recognising speech, especially in difficult environments. Other complaints include the reduced ability to detect, identify and localise sounds, including warning signals, music, and birds, quickly and reliably. In addition to affecting hearing impaired people the disability also affects other people in their environment, such as family and work colleagues. However, hearing impaired people themselves are not always aware of the consequences of the impairment as they do not always know what they are missing in terms of sound. Consistent with the findings of much of the research reviewed in Chapter 4, Arlinger (2003) also points out that uncorrected hearing loss can give rise to isolation, reduced social activity, the feeling of being excluded and increased symptoms of depression, and that there is some evidence of correlation between hearing loss and loss of cognitive functions. All these aspects of hearing impairment, which are discussed in the following sections of this chapter, contribute to a poorer quality of life. 5.2 Overall quality of life Many papers describe hearing loss as causing a significant impact upon overall quality of life. They then go on to examine the occurrence of particular effects of hearing loss such as loneliness or depression, which have an impact upon the general quality of life of an individual. There are few studies in which a direct comparison has been made between the overall quality of life of a hearing impaired person and that of a hearing person. The only paper identified so far in which an overall quality of life score is given is that of Cheng and Niparko (1999), who used the quality of life factor ‘health-utility’ to evaluate the impact of cochlear implants in adults. The health-utility factor is a quantitative value expressed on a linear scale from 0.00 (death) to 1.00 (perfect health). By pooling nine studies involving a total of 619 subjects aged 18 and over, Cheng and Niparko calculated the health-utility of profoundly deaf adults without cochlear implants to be 0.54. (This paper is discussed in more detail in Chapter 10) The report into the joint Nordic-British project on hearing impairment among adults (Sorri et al, 2001) compares this figure of 0.54 with a mean quality of life value of 0.85 for a representative group of the British population under the age of 60, for whom the mean did not fall below 0.8 until the age of 70. Chapter 4 reviewed other work that considered several factors which contribute to general quality of life. For example, Oyer and Oyer (1979) defined 13 consequences of hearing loss (listed in Chapter 4) and showed that hearing impairment can have severe psychosocial consequences, particularly among older people. The first major study into the psychosocial effects of hearing impairment was carried out by Thomas and Herbst (1980). They examined relationships between hearing loss and psychiatric disturbance, general health and well being, social and family life, and 63
  • 64.
    64 employment among peopleof working age, and found that hearing loss impacted upon all these areas. Rutman (1989) also considered the overall impact of hearing loss on quality of life, writing that ‘Acquired deafness is a social and psychological loss which affects all communication and interpersonal interactions and which deprives the individual of the type of social relationships, occupational goals and overall quality of life to which they were accustomed and which gave life meaning’ (Rutman, 1989). Other studies in the 1980s focused mainly on the impact of hearing loss on the lives of elderly people. Bess at al (1989) found that progressive hearing loss in elderly patients is associated with progressive physical and psychosocial dysfunction, the greater the hearing loss the greater the functional disability. The authors concluded that efforts to improve the hearing of elderly patients could result in a significant and meaningful improvement to their quality of life. Similar conclusions to those of Bess et al were reached by Mulrow et al (1990a, 1990b) who investigated many quality of life measures among elderly people using different scales to those used by Bess et al (1989). They found that hearing loss was associated with important adverse effects on the quality of life and, consistent with the work of Bess et al, that greater hearing loss was associated with greater dysfunction. Severe handicaps in social, emotional and communication aspects of life were found even among people with mild to moderate hearing loss. In another study of elderly people in Italy, Carabellese et al (1993), using different scales again, found that both visual impairment and hearing impairment independently have a detrimental effect upon most quality of life measures. They concluded that the presence of either disability approximately doubled the risk of being impaired on each of the quality of life measures used. Studies into the impact of hearing loss on the quality of life of other age groups have found similar detrimental effects. For example, Hallberg (1996) found that a consequence of noise induced hearing loss is to avoid potentially demanding auditory situations such as parties, group meetings, or restaurant visits, with a resultant cost in terms of loneliness, isolation and decreased quality of life. Lalande et al (1988) found that noise induced hearing loss affected the quality of life of workers both at home and at work. Erlandsson and Holgers (2001) examined the impact of tinnitus on health-related quality of life of adults of all ages (> 25 years) in Sweden, using the Nottingham Health Profile. Although for all subjects tinnitus was more of a problem than hearing loss, it emerged that the more severe the hearing loss the more negative the impact on day to day living (work, social relationships, family life, sexual life, leisure time etc.). An analysis by O’Neill of data from the 1992 US Health and Retirement Study (HRS) of people aged 51 to 62 also showed that adults in this age group with hearing loss were less satisfied with life in general than those without (O’Neill, 1999). Table 5.3 compares the percentages of those dissatisfied with various aspects of their lives. 64
  • 65.
    65 Table 5.3 Percentages of adults aged 51 to 61 with and without hearing loss dissatisfied with various aspects of life (figures taken from O’Neill (1999)) With HL Without HL Life as a whole 9 4 Health/physical condition 28 12 Financial situation 37 22 Friendships 6 3 Family life 7 3 Handling of problems 9 4 It can be seen that in all the aspects considered, the percentages of hearing impaired people who are dissatisfied is approximately twice that of the hearing population. Thus there is a large body of published work which shows that hearing loss has a negative effect upon overall or individual quality of life measures, whatever scales are used to assess the impact of hearing loss. However, it must be pointed out that some studies disagree with these findings. Salomon and colleagues (Salomon et al, 1988; Vesterager et al, 1988; Vesterager and Salomon, 1991), in studies of elderly people in Denmark, have found no correlation between hearing disability and general satisfaction with life. For example, Vesterager and Salomon (1991) found seventy four percent of their subjects were satisfied with life, had positive perceptions of the ageing process, and preserved their mental ability in old age independently of their ability to communicate. These authors conclude that hearing disability is not an obstacle to active life in old age. Another study which found little impact of hearing impairment on quality of life is that of Grimby and Ringdahl (2000). These authors used the Nottingham Health Profile and other scales to examine the quality of life of 35 Swedish adults (aged between 22 and 64), all with severe to profound hearing impairment, who were employed full time. A particular aim of this study was to see whether having a job mitigated any of the effects of hearing loss. They found that subjects working full time were considerably more satisfied with life than other hearing impaired people working part time or retired, and that, apart from lack of energy and social isolation, there was little difference between the hearing impaired subjects who were working and hearing people. The authors do however point out that this study involved a small sample size and that subjects tended to have the mental and physical prerequisites for good adaptation at work. They may therefore not be representative of hearing impaired people in general. Furthermore all but one subject wore a hearing aid, which would probably have alleviated much of the impact of hearing loss. (The wearing and benefits of hearing aids are discussed in Chapters 6 to 9.) Finally, another study, also in Sweden, of hearing disability and handicap among 154 elderly people aged from 70 to 91 (Espmark et al, 2002) found that, apart from problems of communicating in background noise, the subjects experienced only minor problems in most everyday activities. Only 21 of the subjects were fitted with hearing aids. The conclusion of this study was that the quality of life of the subjects was in general only mildly affected by hearing loss. It is noted that both the study by Vesterager and Salomon (1991) and the study by Espmark et al (2002) involved subjects from urban areas in Scandinavia; in the latter 65
  • 66.
    66 study the subjectswere city centre residents and the authors report that they were all relatively well off. In the work of Vesterager and Salomon the subjects were town dwellers with stable housing arrangements, the majority of whom were satisfied with their living conditions. This suggests that the subjects in these two studies enjoyed a high quality of life, and may not be representative of hearing impaired elderly people in Europe in general. Thus, although some studies have found little effect of hearing loss on overall quality of life, the major part of the research that has been carried out in the past 25 years shows that hearing impairment has a significant detrimental effect upon the quality of life of adults of all ages. The remaining sections of this chapter consider other aspects of the psychological and social effects of hearing impairment individually, although many of the effects are of course interrelated. 5.3 Loneliness and social isolation As can be seen in Chapter 4, much of the research into the psychosocial impact of hearing loss has found social isolation and loneliness to be major effects of hearing impairment. Uncorrected hearing loss, which causes difficulties in communication, can give rise to isolation, reduced social activity and the feeling of being excluded, all of which may lead to depression (Arlinger, 2003). This is especially true of postlingually deaf patients who lost their hearing in adolescence or adulthood (Rutman, 1989). Social isolation is a problem that affects all age groups although some reports suggest that the elderly have the greatest risk of social isolation (Oyer and Oyer, 1979; Committee on Disabilities of the Group for the Advancement of Psychiatry, 1997). Furthermore, much of the research shows that loneliness and social isolation can occur regardless of the severity of the hearing loss (Thomas and Herbst,1980). Possible reasons are fear of being stigmatised, or of being misunderstood (Oyer and Oyer, 1979), or a general wish to avoid demanding auditory situations (Hallberg, 1996). In this section the occurrence of loneliness and social isolation among different groups of people/age groups is considered. 5.3.1 Adults of all ages It has been found that isolation and loneliness as a result of hearing loss occur in adults of all ages. In a study of deafened adults of all ages in Canada, David and Trehub (1989) found subjects experienced anxiety about social contact and so withdrew from social situations. The average age of subjects in this study was 44.9 years, and the average age of onset of hearing loss was 24.9 years. Knutson and Lansing (1990) studied problems of adults aged from 22 to 71, all of whom suffered from profound hearing loss (≥ 95 dB). They found their sample to be more socially introverted and more suspicious than the general population, with most suffering from loneliness, ranging from being somewhat lonely to being extremely lonely. Loneliness is also found among adults with less severe hearing impairment. For example, Hallberg (1996) reports loneliness and isolation to be a consequence of noise induced hearing loss in workers. Important evidence on the prevalence of social isolation among hearing impaired people comes from the RNID survey of over 1600 deaf and hard of hearing people 66
  • 67.
    67 (RNID, 1999) whichfound that 71% of those surveyed felt isolated because of their hearing loss, while 39% avoided meeting new people. Similarly, O'Neill (1999) in analysing the 1992 US HRS data on 51 to 61 year olds found that people with hearing loss were less likely to participate in social activities than people without. For example, in this age group around 10% of people with hearing loss reported that they had done 100 or more hours of voluntary work compared with 18% of those without hearing loss. In another American study (Chen, 1994) hearing loss was found to be a cause of distress and to lead to psychological withdrawal in social situations, resulting in feelings of isolation, lack of self confidence and depression. However, in contrast to the results of previous studies, a survey by Joore et al (2003), of 80 hearing impaired people aged 18 years and older, found moderate hearing loss caused little impediment in social relationships. Patients being fitted with a hearing aid for the first time scored quite highly on a social functioning scale before being fitted with hearing aids, although there was a slight improvement in self perceived social functioning after hearing aid fitting. 5.3.2 People of working age As described in Chapter 4, loneliness was found to be the overriding effect of hearing impairment in the early study of Thomas and Herbst (1980). Among a group of hearing impaired subjects of working age, 24% describing themselves as lonely compared with 14% of the (unimpaired) control group; furthermore, extreme loneliness was experienced by many of the hearing impaired group. Of the ‘extremely lonely’ subjects, 60% were screened as psychiatrically disturbed, indicating the stress that may be caused by loneliness. Significantly, they found that loneliness was not related to degree of hearing loss, suggesting that people who suffer from moderate deafness are likely to feel as lonely as severely deaf people. Difficulty in making and keeping friends is also a common effect of hearing impairment. Thomas and Herbst (1980) found that 40% of their hearing impaired sample suffered from social isolation, with few or no friends, compared with 25% of the hearing control group. The same percentage also found it difficult to make friends, compared with 15% of the control group. Two middle aged working people are included among the case studies of David and Trehub (1989), in their paper on the adjustment to hearing loss by deafened adults in Canada. A 54 year old man whose loss started at the age of 25 and was profoundly deaf by the age of 43 described how he changed from an extrovert to an introvert, avoiding big social events and preferring reading and carpentry (although he appears to have adapted well to his loss and continues to see his hearing friends and to make new friends). On the other hand, a 49 year old woman who had sudden onset of deafness at the age of 44 said that ‘the worst part is isolation and the loss of friends’. Lalande et al (1988), in a study of 65 workers, two-thirds of whom suffered some degree of hearing loss, found isolation and low self esteem to be associated with noise induced hearing loss. The survey of the effects of hearing loss among working people by Grimby and Ringdahl (2000) (see Section 5.2) found that social isolation was one of only two 67
  • 68.
    68 areas in whichthe responses of hearing impaired subjects differed from those of hearing adults. Thus, even among groups for whom general quality of life appears to be relatively unimpaired by hearing loss, social isolation is still a factor. 5.3.3 Elderly people Studies of the effects of hearing impairment amongst elderly people have shown similar results to those above. Weinstein and Ventry carried out an early study to examine the relationship between hearing impairment and social isolation among elderly people (Weinstein and Ventry, 1982). They studied 80 male subjects, aged 65 to 88, with a mean age of 74. Subjects assessed their hearing handicap using the HMS scale, and hearing ability was also assessed using word lists and audiometric testing. Information on social, emotional and physical problems experienced was obtained using the CARE scale. (See Appendix 3 for details of the scales used.) The subjects were divided into four groups according to hearing ability: 13% of the sample had normal hearing (0-25 dB HL); 30% mild hearing loss (26-40 dB HL); 41% moderate hearing loss (41-55 dB HL); and 16% moderately severe hearing loss (56-70 dB HL). The average age of onset of hearing loss was 68 years. The researchers found, in contrast to the study by Thomas and Herbst of younger people (see above), that hearing ability was related to isolation. The greater the (self assessed) hearing handicap, the greater the sense of isolation, loneliness and inferiority. Weinstein and Ventry found that (self assessed) hearing handicap was more closely related to reduction in the quality of social contact (reflected by fewer social networks, loneliness, reduced interest in leisure activities etc) than to the amount of social contact (number of face to face contacts with friends and relatives and other contacts, involvement in leisure activities etc). Similar results were found in a comparison by Herbst et al of two populations of hearing impaired elderly people living in London and Wales (Herbst et al, 1991). The hearing losses of 253 subjects aged 70 and over in London, and 99 similar subjects in a rural area of Wales were measured. Three other aspects of their lives were studied: general health, use of primary and secondary health services, and contacts with friends and relations. In both areas the authors found that hearing impairment was significantly associated with a desire to reduce outdoor activity (after controlling for sex, age, poor health), and concluded that hearing impairment in old age reduces outdoor activity and predisposes to isolation, withdrawal and depression. A similar pattern of behaviour emerges in a qualitative study of the difficulties experienced by elderly hearing impaired people (Davies et al, 2001). Diaries of activities kept by sixty subjects showed that subjects tended to shop in the mornings when shops were less crowded, and not to go out the evening except for special occasions such as weddings. Overall there was very little evidence of them taking part in group social situations. An individual case study described by Barnett (2002) is also consistent with this behaviour pattern. He describes the case of an elderly patient who was unaware of his hearing problem, as was his family, the problem manifesting itself as a reluctance to go out and to engage in social activities. A few studies however have found no relation between hearing impairment and loneliness or isolation in the elderly. Vesterager and Salomon (1991) investigated the 68
  • 69.
    69 psychological and sociologicaleffects of hearing impairment in elderly people, in a study of 71 subjects aged 70 to 75. They found no correlation between hearing disability and general satisfaction with life, and concluded that hearing disability was not an obstacle to active life in old age. In particular they found no evidence of loneliness or isolation among their subjects. They did however find one effect which could possibly lead to isolation: the more pronounced the hearing handicap the less the individual showed initiative to make new social contacts. Possible reasons for the differences between the results of this study and those of other studies have been discussed in Section 5.2. 5.3.4 Young people As stated before, there has been little research into the general impact of hearing impairment on the lives of young people. However, the research that has been carried out finds that they too experience the same effects of loneliness and social isolation due to hearing impairment as older adults. This may be very significant for young people embarking upon adulthood, at an age where social networks and an active social life are very important to self esteem. David and Trehub (1989), in their paper on the adjustment to hearing loss by deafened adults (with ≥ 80 dB HL in better ear) in Canada, include two cases of the experiences of young people. A 21 year old woman who lost her hearing at the age of 16 following surgery ‘stayed at home and did nothing for 3 years’ and ‘felt isolated’. A man, aged 29 years for whom the onset of deafness occurred at the age of 15, and who was profoundly deaf by the age of 20, described how he became, a ‘loner’ as he was afraid to go to school for fear of being laughed at by the other children and misunderstanding the teacher. However, this latter subject subsequently accepted and adapted to his hearing disability. Research on the effects of hearing impairment on the lives of young adults was carried out by Gregory and colleagues (reported in Gregory, 1998). It appeared that while some deaf young people enjoyed a rich and varied social life, some were very lonely at times, felt isolated and had difficulty making and sustaining friendships. It was parents, rather than young people themselves, who described the majority of young people as having difficulty making friends. One third of young people were considered by their parents to have no friends at work or at college. The parents also perceived their children to be reluctant to join groups of hearing people because of the possibility of their being excluded. Gregory (1998) cites other studies which have shown that deaf students may experience social difficulties such as loneliness, isolation and social rejection in mainstream educational settings. This may have an impact upon their education, as discussed in Section 5.7. 5.3.5 Women Although most studies of the effects of hearing impairment have involved mainly or only male subjects, a few have considered the response of women to hearing loss. Hallberg and Jansson (1996) found that, unlike men, women suffering from noise induced hearing loss strove to maintain social relationships and to take part in social activities. Hallberg, in a subsequent study (Hallberg, 1999), found that women were more likely than men to use various strategies (such as asking people to repeat) to ease communication. However, in a Swedish study of the impact of tinnitus on health-related quality of life, Erlandsson and Holgers (2001) found that, in the 35-44 69
  • 70.
    70 year age group,women with tinnitus experienced more social isolation than women or men of the same age in a normal hearing control group. In general, studies suggest that women adapt to their hearing loss more readily than men. However, this is not always the case. For example, of the four case studies quoted by David and Trehub (1989) the two female subjects, aged 21 and 49, appear to have adapted less well to their hearing loss than the two male subjects. Thus there appears to be conflicting evidence about the attitudes of women to hearing impairment, among the small number of studies available. 5.3.6 Conclusions on loneliness and social isolation Loneliness and social isolation are the consequences of hearing impairment cited most frequently in the literature. The reviewed papers have shown that these effects occur among subjects of all ages, regardless of the extent of hearing loss. Obviously, to experience social isolation or loneliness can have a devastating impact upon one’s happiness and quality of life, and lead to other effects such as depression or loss of self esteem, as discussed below. 5.4 Psychiatric disturbance and depression Much has been written about the links between hearing impairment and psychiatric disorders or depression, research into this area predating that into other psychosocial effects of hearing loss. It has been recognised for many years that hearing impairment may be associated with depression, which may be a consequence of social isolation and withdrawal (Rutman, 1989). Many of the studies reviewed here cite references to earlier work which has investigated links between hearing loss and depression, including suspiciousness or paranoia (Oyer and Oyer, 1979; Dye and Peak, 1983; Rutman, 1989; Mulrow et al, 1990a; Bess et al, 1991; Herbst et al, 1991; Carabellese et al, 1993). In most cases a link has been established although research described in some of the cited papers has found no statistically significant evidence that hearing loss is related to depression or psychiatric problems. Most of the literature reviewed in this section has established a relationship between hearing loss and depression, through comparison of hearing impaired subjects with a control group of hearing people, or with the general population, or provides anecdotal evidence of such a relationship. Other studies have found incidence of depression among hearing impaired subjects but when the data is controlled for confounding factors such as age or visual acuity, no significant relationship is established. In the study by Thomas and Herbst (1980) 19% of 205 hearing impaired subjects were screened as psychiatrically disturbed, based upon measures of anxiety and depression, compared with 5% of the general population. The authors believe that the figure of 19% may be an underestimate as the survey only identified those with recent symptoms, and some respondents with problems had already been excluded from the sample. They found no evidence of a simple linear relationship between pure tone hearing loss or speech discrimination ability and psychiatric disturbance, but when the two were combined there was a dramatic increase in the proportion of psychiatric disturbance. Of those with hearing loss of over 70 dB plus a speech discrimination score of 70% or less when wearing hearing aids, 57% were screened as psychiatrically disturbed. When compared with the figure of 5% for the general population, it 70
  • 71.
    71 appears that severehearing loss may be a major contributor to psychiatric problems. The authors concluded that a severe hearing loss constitutes as much of a psychiatric problem as does a severely restricting physical disability. Psychiatric disturbance was not related to the duration of deafness, and the presence of tinnitus did not appear to increase its likelihood. However, being screened as psychiatrically disturbed was found to relate significantly to unhappiness at work, changing jobs due to deafness, being lonely, having no friends, deafness adversely affecting marriage, feeling near to a nervous breakdown and overall dissatisfaction with life. Similarly, McKenna and colleagues, in a study published in 1991 and cited in McKenna (2001), found that 27% of people with hearing loss who attended a neuro- otology clinic suffered from significant psychological disturbance. In contrast to the work of Thomas and Herbst (1980), the more recent study of a similar age group by Grimby and Ringdahl (2000) found persistent worry and depression to be rare among a group of employed hearing impaired subjects. This may be because, as the authors point out, the subjects were an elite group of severely to profoundly hearing impaired people who had mental and physical prerequisites for good adaptation at work, so they may be unlikely to suffer from depression, and may not be typical of the hearing impaired population of that age. In addition, as explained in Section 5.2, almost all of these subjects wore hearing aids, the benefits of which may help to prevent feelings of depression. Studies which have found higher incidence of depression among hearing impaired subjects, or some evidence that depression may be related to severity of hearing loss include those of Dye and Peak (1983), Knutson and Lansing (1990), Mulrow et al (1990a, 1990b) and Carabellese et al (1993). Dye and Peak (1983) found that, of 58 male subjects, aged 45 to 83, those with more severe hearing loss (greater than 35 dB HL) were more paranoid and depressed than those with less severe loss (35 dB HL or less). In a study of 27 individuals with profound hearing loss (≥ 95 dB HL), aged from 22 to 71 (Knutson and Lansing, 1990) the sample were found to be more depressed, more socially introverted and more suspicious than the general population. However, the authors qualify their results by stressing that all their subjects were awaiting cochlear implants and so were unhappy with their status as deaf persons and highly motivated to change their situation. Mulrow et al (1990a) found evidence of depression in 24% of 194 elderly hearing impaired subjects who were due to receive hearing aids. In a second study Mulrow et al (1990b) identified depression in 27% of 106 subjects with hearing loss, compared to 16% of the other subjects. However, the relationship between hearing loss and depression was not significant when data was corrected for factors such as age and visual acuity. In the study of nearly 2000 elderly subjects in Italy, Carabellese et al (1993) found that depression was associated with deficits in both vision and hearing. In their investigation, 43% of the subjects with adequate vision and impaired hearing had a low or very low mood score compared with 29% of those with neither visual nor hearing impairment, 52% with adequate hearing and visual impairment and 55% of those with both sensory impairments. 71
  • 72.
    72 Weaker evidence, butsome suggestion, of depression among hearing impaired subjects was found in the study by Herbst et al (1991) of two groups of hearing impaired elderly people in London and rural Wales. There was a greater tendency to depression in Wales, although as the authors point out this may have been due to socio-economic problems in that community. However, in both areas hearing loss was found (after controlling for sex, age, and poor health) to be significantly associated with a desire to reduce outdoor activity, which the authors suggest predisposes to isolation, withdrawal and depression. O’Neill (1999) found similar results in analysing the 1993-1994 Asset and Health Dynamics among the Oldest Old (AHEAD) study of people aged 70 and over. The occurrence of depression was almost twice as high for the hearing impaired as for the non-hearing impaired group, with 26% of the hearing impaired group having experienced four or more symptoms of depression during the week prior to the survey, compared with 15% of the hearing group. Again it is likely that the loss of independence and reliance on others, plus less social activity, are contributory factors to the feelings of depression in this age group. There are many other references in the literature to depression associated with hearing loss. David and Trehub (1989), in their qualitative study of profoundly postlingually deaf adults in Canada, found evidence of depression among the 25 subjects interviewed. It is commonly reported that those who become deafened postlingually are more prone to depression than people who lose their hearing earlier in life (Rutman, 1989; David and Trehub, 1989; Committee on Disabilities of the Group for the Advancement of Psychiatry, 1997; Barnett, 2002). The case studies and interviews described by David and Trehub (1989) and by Barnett (2002) are consistent with this. Barnett (2002) also points out that there is under diagnosis of acquired hearing loss and depression, particularly in older adults. A reason given by Rutman (1989) for the greater psychiatric risk in the case of acquired deafness is that it represents a loss and deprivation for sufferers. She quotes the British former Member of Parliament Jack Ashley who was suddenly profoundly deafened: ‘I was painfully and permanently aware of what I had lost. My perception of that loss is a lifelong burden.’ Rutman cites many other authors who have written about the loss, grief and deep depression which may arise as a result of acquired deafness. Finally, McKenna (2001), in discussing the psychological effects of hearing impairment, states that early reports of negative emotional consequences of hearing impairment came from observations of psychiatrists involved in the care of deafened people, who were often described as neurotic or paranoid. Since then some studies of hearing impaired people attending clinics have shown a high prevalence of emotional disorder, with elevated levels of psychopathology and maladjustment, including depression, neurotic symptoms, anxiety and social isolation being reported. The link between hearing loss and mental health has also been studied by approaching the problem in reverse and examining the extent of hearing loss among patients with psychiatric disorders. The results suggest that hearing loss increases the chance that a patient will have a diagnosis of schizophrenia, and that hearing loss is one of a 72
  • 73.
    73 number of factorsthat distinguishes patients with paranoid psychosis from those with affective psychoses. However, McKenna points out that these studies did not control for confounding factors such as general health, age and noise exposure. McKenna reports that overall there is conflicting evidence on the association of hearing loss and emotional disturbance. Nevertheless, the presence of multiple symptoms, for example hearing loss with tinnitus, leads to a greater likelihood that a person will suffer significant psychological distress. He concludes that, in addition to depression and isolation, the following factors may also interact with a person’s psychological state, depending upon age, social circumstances and education: • the individual’s own image of a deafened person • the fact that deafness has the power to make people less socially capable • the fact that deafness may make the processing of verbal information harder and so slow up the normal flow of social interaction • people’s differing tolerance of, and compensation for, their disability • the fact that their present handicap from deafness can be related to their own attitude to the disability. Thus, overall, work published in the past 30 years has shown substantial evidence that depression and possibly other psychiatric disorders are more prevalent among hearing impaired people than among the general, hearing, population. These results suggest that hearing loss can be a cause of depression among sufferers. 5.5 Family relationships The impact of hearing loss on family relationships has been discussed in several papers, including those detailed in Chapter 4. As mentioned by Barnett (2002) relationship difficulties can arise as a result of not talking or not allowing others to talk, which are two strategies sometimes employed by hearing impaired people to disguise their hearing loss. Thomas and Herbst (1980) in their detailed study of psychosocial effects of hearing impairment on people of working age divided loneliness due to deafness into two categories: social isolation (concerning relationships outside the home) and emotional isolation (concerning family relationships). They found that 45% of their hearing impaired subjects suffered from emotional isolation, defined as having no or only one person to turn to for support in daily life, compared with 26% of the control group. In addition, they found that 27% of those with hearing loss felt that they got left out of discussions and decision-making at home, compared with 12% of the controls. There is also anecdotal evidence of typical problems that may occur in the family. One of the case studies included in the paper by David and Trehub (1989) mentions the impact of his profound deafness on his relationship with his sons; he feels he does not know them as well as he would like and notices that at meals, they chat with their mother while he remains silent. This exemplifies the view of Hallberg (1996) that the hearing impaired parent becomes less involved in family matters as children turn 73
  • 74.
    74 towards the normallyhearing parent. Hallberg also states that noise induced hearing loss can lead to frequent misunderstandings and irritation within a family. Rutman (1989) reports that hearing impairment can have a devastating effect on family relations – the hearing impaired person worries that their family may regard them as less able to function independently so opportunities to exercise personal control diminish. Knutson and Lansing (1990), in their study of people with profound acquired deafness, found that difficulties in family communication were associated with perceptions of isolation and loneliness. This is consistent with the work of Gregory (1998) who, in her research into deaf children and young people and their families, has found that difficulties in communication in a family can have consequences for identity and social relationships. The work of Gregory and others (Gregory, 1998; Hauland and Gronninguter, 2003) provides evidence of the attitudes and treatment of young hearing impaired people in a family, and the impact of a deaf child on family relationships. Gregory and colleagues (Gregory, 1998) interviewed 82 hearing families who had deaf children, and 61 of the hearing impaired children. The study found that 25% of deaf young people communicated most readily with their mother, 20% with a sibling but only 5% communicated most easily with their father. Seven per cent said that there was no one in the family with whom they could communicate. (Gregory does not report what the corresponding figures would be for children with normal hearing.) Also considered was the question of relationships between hearing impaired children and their siblings. Overall the relationships were felt to be positive, with often a special understanding developing between the siblings. However, Gregory (1998) quotes other research which found that there can be a negative impact on sibling relationships when hearing siblings turn outside the family for relationships as they are unable to communicate with a deaf sibling. Differences in the treatment of hearing and deaf siblings, and the need to spend more time with the latter can cause additional problems. Deaf young people in their late teens and early 20s are more dependent than their hearing peers on their families, both financially and in terms of leaving home. For example, parents may be asked to help in communications with colleagues or in obtaining employment, and may need to explain financial matters because the hearing world is not adapted to the needs of deaf people. The study found that, of forty hearing impaired 20-21 year olds, 70% lived in the family home and half needed help with managing their finances. Although most could cope with travelling on their own, only sixteen were able to go to the doctor alone. Parents of hearing impaired children also had a greater role in organising their children’s social arrangements than they felt they would have done for hearing children, a situation that may be less than satisfactory for both parties (Gregory, 1998). In the study young people reported feeling either left out of family gatherings or embarrassed by attempts to include them. Gregory (1998) reports that they therefore miss out on access to information which is part of general family conversation, and which parents assume the deaf person to be aware of. Of the young people questioned 74
  • 75.
    75 80% said sucha lack of communication had occurred to them, in some cases relating to major events such as deaths in the family, pregnancy and marital breakdown. Similar problems were reported by young people in a recent paper by Hauland and Gronninguter (2003) who examined the lives of 77 deaf and hard of hearing students aged 16 to 20 in Norway. Helene (16) said in an interview ‘I am quite left out, compared to my sisters. I am in one sense one of them but there have always been problems with me who am hard of hearing. I do not understand what they are talking about when we are eating dinner. I am quarrelling a lot with my little sister since there are so many misunderstandings. I have always felt left out at home.’ Problems with siblings and feeling left out were also reported by Frode (20): ‘I am not very close to my siblings. They were all talking at once even though I asked them again and again what they were talking about. I often ran away and walked out for hours or I sat in my room and listened to music. I do not like to be hard of hearing, it is better to be hearing. I do not understand what people are talking about.’ These reports are not consistent with the reports by Gregory (1998) of generally good sibling relationships. The studies of the impact of hearing loss on elderly people have not usually considered family relationships. However, Rutman (1989) in her review of the impact of acquired deafness points out that hearing impaired older adults may become concerned that their family thinks they are less able to function independently and responsibly, and that, due to communication problems, older people themselves may feel less able to maintain a responsible family role. In contrast, Vesterager and Salomon (1991) detected no impact of hearing loss on friendships or on family life in their study of elderly hearing impaired people. Thus the general consensus of the reviewed research is that hearing impairment can have significant negative effects upon family relationships, affecting general communication within a family; affecting the relationship between a hearing impaired parent and their children; causing hearing impaired children to feel ‘left out’; and generally making the hearing impaired individual feel less able to function as a family member. 5.6 Stigma and low self esteem Several authors have written of the stigma attached to hearing loss and the low self esteem often experienced by hearing impaired individuals. Noble (1996) writes that the stigma attached to hearing is not only to do with lack of hearing but with what it signifies more broadly. The popular image of people who are hearing impaired is not flattering – hearing loss is associated with old age and, as a consequence, with frailty of body and mind (McKenna, 2001). Deafness has long had a connotation with stupidity; this may be compounded by someone who cannot hear not responding immediately, and this being interpreted as being due to rudeness, slowness or stupidity. The stigma attached to hearing impairment and the attitudes of others, together with one’s own perceptions, can lead to low self esteem among hearing impaired persons. Oyer and Oyer (1979) suggested that low feelings of self worth are a particular 75
  • 76.
    76 problem among elderlypeople. This was confirmed by the work of Mulrow et al (1990a) who, in their study of the quality of life of older people, found that the self esteem subscale of the SELF scale (see Appendix 3) was statistically significantly related to hearing impairment. Other studies suggest that it may be people of working age who are particularly susceptible to low self esteem. David and Trehub (1989) found fragile self esteem to be a common symptom among the deafened adults in their survey. It was cited as a problem by some of the case studies in their paper. For example, a 49 year old woman who had to leave her job after sudden onset of deafness at the age of 44 suffered from loss of self esteem due to her inability to obtain another good job. In the study by Herbst et al (1991) of over 350 hearing impaired subjects in Wales and London, many of those whose impairment had commenced before retirement had reportedly done nothing about it because of the associated stigma. In studies of patients suffering from noise induced hearing loss Hallberg (1999) suggests that the reluctance to acknowledge hearing handicap among men might indicate a need to avoid stigmatisation and preserve a positive self image. Similarly low self esteem was reported as an effect of noise induced hearing loss in the earlier study by Lalande et al (1988). Hetu et al (1990), in their qualitative study of men suffering from noise induced hearing loss, found strong symptoms of denial and attempts to minimise the problem and to appear ‘normal’. He gives the following examples of the stigma attached to hearing loss which explain why people wish to deny their hearing impairment: • For centuries deafness has been associated with mental illness • Deafness is associated with ageing and the approach of the end of life • Admitting deafness implies perceiving oneself as belonging to an inferior social category. The workers interviewed by Hetu et al reported being stigmatised, particularly by co- workers (usually male), and by relatives and significant others in their lives. The stigmatisation attached to hearing loss has several important and potentially damaging consequences, listed by Hetu et al as fear of revealing hearing difficulties to others, reluctance to use aids, avoidance of contact with co-workers and isolation. Further evidence of the stigma attached to hearing loss at work is provided in the study by Herbst et al (1991) which compared a group of hearing impaired elderly people in London with a similar group in Wales. Those for whom the onset of hearing impairment had occurred before retirement were significantly more likely than others to describe their hearing as bothersome. The authors suggest that this was to be expected since the onset of hearing loss was untimely, and because of the associated stigma they had done nothing about it. Hallberg and Jansson (1996) found stigmatisation to be a major issue affecting the attitudes of women with noise induced hearing loss; they adopted coping strategies (for example pretending to hear) intended to prevent or minimise the risk of stigmatisation. The women perceived that other people viewed them as stupid, mentally retarded or prematurely aged. 76
  • 77.
    77 In 1996, Hetupublished a major overview of the stigma attached to hearing impairment (Hetu, 1996). (See Chapter 4 for a full description of this paper.) He cites his own and other research which shows that hearing loss causes embarrassment, lack of confidence, a sense of inferiority, and shame. Women perceived their hearing impairment to be associated with a lack of intelligence, mental health problems, weakness, disability, and old age. According to Hetu, as well as being stigmatised by others, hearing loss is a threat to social identity and can lead to self-stigmatisation. Hetu also explains that, as stigmas combine, people who are already discredited because of some other characteristic will experience the stigma of hearing loss more acutely. This may typically occur in the case of elderly people (stigmatised because of both hearing impairment and age) and of women (stigmatised because of hearing impairment and lower social status and self image). The lengthy period that often occurs between the onset of difficulties and seeking help, which may be up to 15 years, is a further indication of the negative stigma attached to hearing loss, which may exacerbate the difficulties experienced by the hearing impaired person. The overwhelming view among research workers and writers on hearing impairment is therefore that it can lead to stigmatisation by others, plus self stigmatisation and loss of self esteem. These problems seem to occur among all age groups and types of sufferers – people at work being stigmatised by colleagues, and elderly people and women being particularly sensitive to stigmatisation and loss of self esteem. 5.7 Education There is a large body of research showing that hearing impairment affects children’s development at school (Bess et al, 1998), although the effects of hearing impairment on children are beyond the scope of the present report. However, hearing loss also has an impact at secondary and university level. The studies by Bess et al (1989) and by Mulrow et al (1990a) found that, with increasing hearing loss, the educational status of their hearing impaired subjects decreased, and that individuals with hearing loss had on average less education than hearing subjects. The reasons for these differences are not known, all the subjects were elderly and the hearing impaired subjects also tended to be older than those with normal hearing. Nevertheless it is possible that this may illustrate the difficulties experienced by hearing impaired people in pursuing education at higher levels, which have been found in other research. A study in Sweden investigated the educational expectations and achievements of a group of young people with hearing loss (Danermark et al, 2001), citing research which showed that the number of hearing impaired students who continue their education as a post secondary level in Sweden is much lower than for their normal hearing peers. The authors reported that, in addition to educational difficulties related to hearing problems, it is much more difficult for hard of hearing students in upper secondary education to cope with changes in intentions and educational goals than their hearing peers. All 16 of their subjects, average age 28 years, had been educated at hard of hearing school. Almost all reported low expectations from their parents regarding their education. Half of the group had gone to university and half had entered the labour market. Of the latter group, all were in low paid, unskilled jobs or had earlier experience of such work. The ones in this group who were now 77
  • 78.
    78 considering post secondaryeducation had great difficulties. However, the authors found that hearing level did not seem to be related to educational performance and choice. Low expectations of deaf and hard of hearing students were also found in the study by Hauland and Gronninguter (2003), who surveyed students aged 16 to 20 in Norway. They found that teachers had low expectations of hearing impaired students, and that consequently levels of instruction were low. Furthermore, many deaf and hard of hearing students are limited in their choice of subjects. For example, people with a hearing loss will in general have more problems communicating verbally in foreign spoken languages, since lip-reading a foreign language is significantly more difficult than lip-reading a native language. Rutman (1989) also states that hearing impairment has considerable effects upon career choice and goals for younger people. Social factors may also contribute to difficulties for deaf and hard of hearing students. Gregory (1998) cites research which shows that deaf students experience social difficulties such as loneliness, isolation and social rejection in mainstream educational settings. Hearing impaired students also have problems in conversing in group settings, and may be isolated at college with no friends. There is thus evidence, of an anecdotal rather than statistical nature, to suggest that hearing impairment impacts in both direct and indirect ways upon educational experience and achievement. 5.8 Denial A common feature of the onset of hearing impairment, especially in the early stages, is denial of the problem (both to oneself and to others), which is mentioned explicitly or implicitly in many of the studies into the psychosocial effects of hearing loss. This is often related to fear of stigmatisation (Hetu, 1996). It is easier to deny existence of hearing impairment than of many other disabilities, as it is an invisible impairment. Rutman (1989) regards denial as a potentially unhealthy response, which occurs particularly when the hearing loss is progressive. A result is that the loss may be undetected for many years with the changing behaviour of the individual being attributed to other causes such as senility. Rutman (1989) cites references to show that denial occurs at any age, although it is more common among the elderly than among young people. Adolescents deny their hearing problems so as not to appear different from their peers; working adults because of the impact on employment and career aspirations; and the elderly because of connotations with senility. Some authors cited by Rutman show that denial is the first stage of adjusting to hearing impairment, the period of denial lasting from days to years in some cases. Obviously denial has a serious effect on adjustment to hearing loss as it delays the acquisition of new communication skills, leading to further social isolation. As Rutman states, for successful adjustment to hearing loss it is necessary to recognise and accept one’s auditory problems. Denial has been found in many of the surveys of hearing impaired people discussed in Chapter 4. In the study by Thomas and Herbst (1980), 125 (59%) of their subjects said that they tended not to tell other people of their deafness. The reasons given 78
  • 79.
    79 were as follows:because they felt embarrassed or ashamed (40 subjects, that is 19% of sample); because they had found that if they did the public treated them badly (27, or 13%); they felt it unnecessary (53, or 25 %); while five did not know the reason. At least 67 subjects (32% of the sample) could identify negative social responses to their hearing impairment and so took steps to conceal it. Denial was also a common feature of the survey of adjustment to acquired hearing loss among deafened adults in Canada, carried out by David and Trehub (1989). Similar reluctance to acknowledge their hearing difficulties was found in the qualitative study of the effects of noise induced hearing loss upon workers and their spouses (Hetu et al, 1990). This reluctance was expressed through various forms of denial, minimisation of the problem, uneasiness in talking about problems and in attempts at normalisation (Hetu, 1996). Denial was also found in the study by Herbst et al (1991) of hearing impaired people in London and Wales. In both areas a quarter of the sample denied having any hearing problems, although the majority of both groups had better ear hearing losses of over 35 dB. Denial is generally reported as being more common among men than women. In his paper on the stigma attached to hearing loss Hetu (1996) cites several references which show that men are less able than women to accept physical disability of any kind. However, there is evidence, cited by Hetu, of women concealing their hearing impairment outside the home, particularly at work and in leisure activities, as it made them feel less feminine and was perceived as a sign of lack of intelligence, of mental health problems, weakness, disability, and old age. Also, in the four case studies included in the paper by David and Trehub (1989) the two male subjects (aged 29 and 54) seemed eventually to accept and adapt to their hearing loss, unlike the two female subjects (aged 21 and 49). In summary, denial of a hearing problem, more or less consciously, has been found to be common among all age groups. It can obviously have serious consequences and exacerbate the problems of hearing impairment, not least because it delays an individual seeking help to mitigate the problem to a greater or lesser extent. 5.9 Difficulties in particular environments Two recent studies have investigated particular problems that hearing impaired people have in using public spaces (Breadin, 2000; Davies et al, 2001). Breadin used a combination of semi-structured interviews and questionnaires to ask 15 hearing impaired people, aged from 40 to over 80, about difficulties they experienced in particular types of space in the built environment. They reported having difficulties with conversation in cafes, with staff at supermarkets, and in general when large numbers of people were present. As well as reverberant spaces, spaces with lots of sound absorption that are regarded as pleasant and quiet by people with normal hearing cause problems because people speak quietly in such places. Particular difficulties were reported in places with high noise levels, for example near a busy road, in church when the organ is playing, and hearing announcements in stations and airports etc. Several respondents reported that they no longer visited particular pubs or hotels because of the noise levels, and that they feared their hearing would be further damaged in noisy environments. 79
  • 80.
    80 Breadin also carriedout a questionnaire survey of 40 people, of whom 21 had (self reported) normal hearing and 19 some degree of hearing impairment. The hearing impaired group cited coaches, churches, doctors’ surgeries, lecture theatres and public halls, and adult education centres as places where more loop systems should be installed. Differences between the hearing impaired and the hearing groups included the following: • More of the hearing impaired group than the hearing sample reported it was easier to hear a woman’s voice • None of the hearing impaired group reported no difficulty in hearing in noise, compared with 14% of the hearing group • 42% of the hearing impaired group found piped music very annoying, compared with 14% of the hearing sample. • 16% of the hearing impaired group regarded live music as pleasant compared with 43% of the normal hearing • 42% of the hearing impaired group reported amplified music in shops to be very annoying, compared with 14% of the hearing group. A similar but more extensive study was carried out by Davies et al (2001). In this survey the activities and daily lives of 207 elderly hearing impaired people, 84% of whom were over 65 and 67% over 75, were examined. The survey consisted of interviews, focus groups and examination of weekly diaries kept by 60 of the subjects. Many of the subjects said they avoided crowded spaces and tended to shop in the mornings when shops are less crowded. Many described problems of socialising in groups when there were other voices in the background. Subjects reported particular difficulties when using transport, for example hearing was made more difficult by the noise of the engine of a car or bus. Churches were also identified as spaces where hearing was difficult although the problems were often attributed to the person speaking. Interestingly there was some evidence that, in completely routine social interactions, poor speech communication was tolerated. For example, some people attended lectures regularly even though they often missed part of what was said. Respondents seemed to prefer to take part in the activity and not be able to hear than to avoid the activity altogether. It seemed that the process of conversation was more important than hearing every word. 5.10 General health/visiting the doctor There appears to be a limited amount of information regarding the relationship between general health and hearing loss. In his analysis of the 1994 NHIS data O’Neill (1999) found that, overall, 39% of those with hearing loss reported being in 'excellent or good health' compared with 68% of those without hearing loss. For those over 65 years of age, the percentages were 29% (with hearing loss) and 41% (without hearing loss). Nearly one third of the population with hearing loss reported being in 'fair or poor health' compared to 9% of population without. These figures are consistent with those from the 1992 Health and Retirement Study, also reported by O’Neill (1999) which show that, among the retired population, poor health was a 80
  • 81.
    81 factor in thedecision to retire for 70% of those with hearing loss compared with 44% of those without. There is some evidence in the literature of problems experienced by deaf and hard of hearing people when visiting doctors’ surgeries. Gregory found that, of 40 hearing impaired 20-21 year olds only 16 were able to go to the doctor alone (Gregory, 1998). In the study by Breadin (2000) the hearing impaired subjects questioned felt there was a need for more loop systems in doctors’ surgeries. These comments are supported by the large survey of its members and GPs carried out by the RNID (RNID, 1999) which provides evidence of the difficulties faced by deaf and hard of hearing people when visiting their GP. Problems included leaving a doctor’s surgery without understanding what is wrong (23%), relying on other people to interpret (32%), and being unable to make an appointment because of communication problems (16%). Two thirds of the people surveyed thought GPs surgeries could be improved. In the survey of over 400 GPs it was revealed that very few surgeries had appropriate facilities to support deaf and hard of hearing people. This survey is described in more detail in Chapter 4. Thus it can be seen, from Section 5.9 and this section, that hearing impairment can cause difficulties in day to day life through difficulties in using commonly visited environments. 5.11 Cognitive skills and dementia Evidence on the relationship between hearing impairment and cognitive or mental skills is confused. As pointed out by Hetu (1996), for many years deafness has been associated with mental disability and reduced cognitive skills. This is partly because hearing loss is associated with old age and, as a consequence, with frailty of body and mind. McKellin, cited in Hallberg (1999), also refers to the cultural association of hearing disability with impaired cognitive skills. In some cases the symptoms of hearing loss, especially in elderly people, can be sufficiently debilitating to mimic dementia (Committee on Disabilities of the Group for the Advancement of Psychiatry, 1997). This may be the reason for some of the findings suggesting that dementia is related to hearing loss. Several authors refer to papers which show a link between hearing impairment and dementia, confusion or decline in cognitive function in old age (Bess et al, 1991; Noble, 1996; McKenna, 2001). However, in some of these studies the association is lost when age is taken into account (McKenna, 2001). Mulrow et al (1990b) report that research into an association between hearing impairment and dementia is inconclusive and cite several studies which show a relationship and others which do not. An aim of the study by Mulrow et al was to examine this aspect further but, using the SPMSQ scale to assess the cognitive status of their hearing and hearing impaired subjects, almost all subjects in both groups had unimpaired mental function so they were not able to progress this investigation (see 81
  • 82.
    82 Appendix 3 fordetails of the scale). The study by Bess et al (1989) in fact found that as hearing impairment increased there was a trend for subjects to score slightly higher on a mental status questionnaire. McKenna (2001) reports that some people with hearing loss, including young people, find difficulty in concentrating. It has been assumed in the past that this is a result of fatigue, due to the effort of listening and lip reading, or from emotional distress. However, recent research has found subtle difficulties in information processing which can not be explained in terms of fatigue or emotion. One study found that the degree of difficulty in information processing was related to the duration of the hearing loss. It is suggested that, in some people, hearing loss may lead to changes in the way the brain processes information, and that they may be less able to process certain types of verbal information. This appears to be the only study to provide definitive evidence of a relationship between hearing loss and some aspect of cognitive function. 5.12 Memory There has been a limited amount of research investigating whether or not hearing loss affects memory. Dye and Peak (1983) found that of 58 male subjects, aged 45 to 83, those with more severe hearing loss HL (>35 dB HL) were less alert to information from the environment, and less capable at memory tasks and learning new material than those with a less severe loss. A study by Rabbit (1991) found that mild hearing loss can cause apparent memory failures which increase with age and reduce with IQ. Screening, using word tests, of 960 individuals aged 50 to 79 suggested that changes in memory efficiency could be a secondary effect of age related mild hearing loss. Words were presented both visually and aurally in quiet and in noise. For young adults recall is better for spoken words but for the older subjects in this study the reverse was true. The disparity between auditory and visual presentation increased with age and was significantly greater for those in the 70-79 age group than for those aged 50-69 years. The number of words recognised decreased with age and hearing loss. Rabbit suggests that older people with hearing loss are therefore at a double disadvantage in following speech – they may not hear or may mishear words, and may remember less well words which they do identify correctly. This can have a significant social effect, as they may appear to be much less competent than they actually are in everyday social interaction, and therefore appear less rewarding companions than they may potentially be. 5.13 Intimate relationships Hearing loss can cause problems in establishing and maintaining relationships with the opposite sex. Gregory (1998) reports that young deaf people perceive problems in establishing such relationships. Of 48 over 21 year olds in the study by Gregory, 18 (38%) were reported by their parents as never having had a boy or girl friend. Hearing impairment can also put a strain upon marital relationships. In the study by Thomas and Herbst (1980) less than half the hearing impaired subjects (48%) felt that their hearing problem was understood by their spouse. 82
  • 83.
    83 In an articleon the impact of acquired deafness, Rutman (1989) describes how hearing impairment in middle adulthood may disrupt interpersonal relationships and threaten marriages. Hetu et al (1993) reviewed the available literature concerning the impact of hearing impairment on intimate relationships and noted the lack of research in this area. The authors list reported effects on the unimpaired partner of a hearing impaired person; these include stress, tension, irritation, fatigue, frustration, anger, resentment and guilt. These highlight how vulnerable intimate relationships may be to the effects of hearing impairment. However, in most rehabilitative programmes the focus is on the needs of the impaired partner while those of the unimpaired partner are often not considered. Effects of hearing impairment on couples were also discussed by Hallberg (1996) who found that a hearing impaired person often describes their spouse as the least understanding person, and that hearing impairment can cause contradictions between couples and affect their relationship. Communication between a couple may be minimised or hardly exist at all in some cases, and there may be frustration and irritation on the part of the hearing partner. A couple’s social life may be disrupted and social gatherings may cause additional stress. Misunderstandings and irritation within a family may have a further negative impact on intimate relationships, and, according to one of Hallberg’s interviewees, ‘a hearing disability has many consequences on the close relationship...even in the bedroom’. It is therefore possible, although no quantitative evidence has yet been found, that hearing loss can lead to a break up of marital and other close relationships, which will in turn cause further depression, loneliness and so on. 5.14 Prejudice and abuse The main evidence on prejudice towards and abuse of hearing impaired people is provided by the RNID report of 1999, summarised in Chapter 4, although Hetu et al (1990) describe hearing impaired workers as being the victims of jokes by male colleagues, and also being stigmatised by relatives and others. Hetu (1996) also reports research which has found that hearing impaired women have been the objects of jokes or pity. The RNID report (RNID, 1999) showed a great extent of prejudice, intolerance, patronising and abuse experienced by deaf and hard of hearing people. The survey found that having a hearing loss at least doubles the likelihood of experiencing abusive language. Nearly half the respondents reported having been made fun of or ignored because of their deafness, while the vast majority had been ignored, patronised or had experience of others becoming impatient with them. One in five had been the victim of abusive language and gestures, and one in 20 had experienced physical violence. (However, the proportion of the general population who experience such behaviour is not given for comparison.) 83
  • 84.
    84 5.15 Discussion This andthe preceding chapter have presented an extensive review of literature relating to the psychological and social effects of hearing impairment. Nearly all the literature shows that hearing impairment has a significant psychosocial impact upon sufferers. Some of the effects are more serious than others, but all lead to a reduction in the quality of life of the hearing impaired person. This section discusses the evidence which has been presented. in Chapter 4 and this chapter. 5.15.1 Types of study The studies which have been reviewed are of various different types: some are qualitative studies, where the findings are based upon interviews with hearing impaired subjects; others have involved more quantitative research in which subjects are ‘scored’ in various dimensions. To an extent however, all the studies are qualitative in nature, most involving some sort of questionnaire survey and self assessment in areas such as hearing handicap, personality and social relationships. Of the qualitative studies based entirely upon interviews, some have involved interviews and discussions with a small number of individuals or small groups and the outcomes have been analysed in detail to discover common patterns of experience and behaviour in dealing with hearing impairment and its effects. Other studies such as those carried out by the RNID have involved large scale interview surveys from which figures relating to different experiences have been obtained. The quantitative surveys are of two kinds. Some studies present data relating to the percentages of a hearing impaired sample who experience particular kinds of effects; in some cases the figures for a hearing impaired group are compared with those of a matched control group. Other studies have attempted to investigate in more detail the exact relationship between impairment and an effect, that is, to determine whether the effect is greater if the degree of hearing loss is greater. However, whatever the methods used, with very few exceptions, all the reviewed studies arrive at the same conclusion: that is, that hearing impairment, at any age, has significant detrimental psychosocial effects. 5.15.2 Attitudes towards hearing impairment While the negative attitudes towards deaf and hard of hearing people are not as strong as they were a century ago – Davis et al (1991) quote Jackson who in 1902 recommended that deaf people should withdraw from society so they would no longer notice their deafness – they still exist among both hearing people and hearing impaired people themselves. This review has shown how these attitudes can affect hearing impaired people who may be abused, discriminated against at work and in seeking employment (see Chapter 11 for discussion of employment issues) or have family problems, and can lead to low self esteem. The medical profession also often has an ambivalent attitude towards deafness. Several authors comment on the fact that loss of hearing in old age may be under diagnosed or not taken seriously by doctors as it is often regarded as a natural consequence of old age and therefore as a relatively benign problem (Bess et al, 1989; Barnett, 2002). 84
  • 85.
    85 5.12.3 Interrelationships betweeneffects Some of the effects that have been reported, such as memory loss or difficulty understanding conversation, may be considered as direct and independent effects of hearing loss. However, many of the effects described in this chapter can be regarded as indirect, or secondary, effects which may be interrelated, for example depression could be caused by loneliness or poor family relationships which are themselves a consequence of the hearing loss. Results of different surveys are also strongly related. For example, several surveys of older people found that greater hearing loss was associated with less education. Other papers have suggested that young people may have difficulties coping with mainstream education and also that their choice of subjects for study can be restricted. It is possible that the lower level of education is a direct consequence of these problems, or of the anticipation of such problems which may deter hearing impaired people from pursuing their studies. 5.15.4 Need for future research It can be seen that much of the research that has been reviewed is concerned with elderly adults, or with men suffering from noise induced hearing loss. Even in studies which have examined effects of hearing loss across the age range, the majority of subjects tend to be on the older side. However, the work of Gregory (1998) and others shows that hearing impairment has many important effects on adolescents and young adults. These young people will be affected throughout their lives. There is therefore an urgent need for more research with people of this age. This is particularly important in view of a likely increase in the prevalence of hearing loss among this age group as a result of listening to personal stereos and loud music. This is also likely to lead to an increase in the number of people in their 30s and 40s with serious hearing loss. As with younger adults, apart from anecdotal evidence, data on the effects of hearing impairment on this age group is scarce. Similarly, there is a need for further research into the impact of hearing impairment upon the lives of women of all ages. 5.15.5 Costs Apart from the personal cost to the individual in terms of their quality of life, many of the effects described in these two chapters will have costs to the state for health care, treatment of depression, social benefits for unemployed people, marriage break ups and so on. The costs to society and the individual of hearing impairment are addressed in Chapters 10 and 12. 5.16 Conclusions This chapter has considered the many psychosocial effects of hearing impairment on adults of all ages. It can be seen that most of the papers and articles reviewed provide converging and conclusive evidence that hearing impairment, whether moderate or severe, has a serious impact upon a person’s social and/or emotional life, and reduces their quality of life. In Chapter 12 specific issues relating to the impact of hearing loss upon employment are considered. Chapters 6 to 9 examine the provision of hearing aids and evidence of 85
  • 86.
    86 the benefits thatare provided by aids, which may mitigate some of the effects reported in this and the preceding chapter. 86
  • 87.
    87 CHAPTER 6 OWNERSHIP OF HEARING AIDS 6.1 Introduction Many people who are hearing impaired do not own a hearing aid. This chapter reviews literature concerning the prevalence of hearing aid ownership and non- ownership among the hearing impaired population. Data concerning ownership in different countries is presented and reasons for people not seeking help or not accepting a hearing aid are discussed. This review covers a period of approximately 40 years, and therefore refers to different types of aids including body-worn devices, behind-the-ear and in-the-ear aids. It might be expected that ownership would increase as technology advanced and hearing aids became smaller and less obvious. However, the data presented in this chapter shows that in fact this has not been the case. 6.2 Ownership of hearing aids There is a significant amount of recent reliable data on the prevalence of hearing aid fitting and non-use in the US and northern Europe. The main sources of data reviewed here are a report by the National Institute of Clinical Excellence (NICE) in the UK, which is part of the National Health Service, published in 2000 (NICE, 2000), and a report comparing hearing services in the UK and Scandinavian countries published in 2001 (Sorri et al, 2001). Detailed data on hearing aid ownership and use in the US is published regularly by Kochkin in a series of reports of MarkeTrak surveys which have been carried out by Knowles Electronics for the Hearing Industries Association since 1989 (Kochkin 1993, 1994, 1998, 2001, 2002, 2003). It will be seen that there is considerable variation in the number of hearing aids prescribed in different countries. 6.2.1 Hearing aid ownership in northern Europe In England and Wales it is estimated that approximately 8.1 million of the population have a hearing impairment, of whom around 90% have a sensorineural hearing loss and would benefit from a hearing aid. Approximately 1.4 million, or 3.4% of the population, have a hearing aid prescribed, although around 10.4% of the population could benefit (NICE, 2000; Davis, 2003). Thus only around one in three of those who could benefit from a hearing aid owns one. The number of aids supplied annually is around half a million, of which one third are given to new users. Interestingly, the ratio of the number of aids fitted to the number of people who could benefit has not changed over a period of many years. The National Institute of Clinical Excellence reported in 2000 that this ratio had not changed in the preceding 15 years (NICE, 2000), and there is some evidence that it might have remained the same for the past 40 years (Gilholme-Herbst et al, 1991), see Section 6.3. This is surprising in view of the evidence, discussed below, which suggests that technical improvements and changes in the appearance of hearing aids would increase their usage. Sorri et al (2001) report that of the several million hearing impaired people in Nordic countries (Denmark, Finland, Iceland, Norway, Sweden), around 60-70%, possibly up 87
  • 88.
    88 to 85%, couldbenefit from hearing aids. It is estimated that around 5% of the total population have a hearing loss of 45 dB or above in both ears, while around 20% have a bilateral loss of 25 dB or above. Sorri et al tabulate the number of hearing aids provided in each of the countries they considered, including the UK, as shown in Table 6.1. The table shows considerable variation between countries in the numbers and proportions of hearing aids provided. This is partly because some countries, eg Denmark, prescribe a greater proportion of bilateral aids, as seen in Table 6.2. The UK and Finland provide fewer bilateral aids than Denmark and Norway and in Finland a lower number of people than elsewhere have a hearing aid. It should also be noted that hearing aids dispensed privately are not included in this data. Table 6.1 Numbers of hearing aids provided in various countries (data from Sorri et al, 2001) Country Estimated number of Average number of hearing aids provided hearing aids provided annually annually per 1000 people Denmark 65,000 12.30 Finland 14,000 2.72 Norway 40,000 9.10 Sweden 62,000 7.00 UK 560,000 9.32 Notes: All except Sweden include hearing aids provided to both adults and children Hearing aids dispensed privately are not included A hearing aid for each ear counts as two hearing aids Using a figure of 3.5% for the percentage of the population of the UK who own a hearing aid, and taking account of the numbers of people who have bilateral hearing aids, Sorri et al have estimated the percentages of the populations of Nordic countries who have a hearing aid as shown in Table 6.2. Table 6.2 Estimated numbers and percentages of hearing aid users (Sorri et al, 2001) Country Estimated % of Average no. of people Estimated % of bilateral hearing prescribed hearing population who have aids aid(s) annually per 1000 hearing aid(s) Denmark 50-60 7.7-8.2 3.35 Finland 20 2.27 0.96 Norway 60 5.69 2.40 Sweden 30 5.38 2.27 UK 10-15 8.1-8.5 3.50 Average 2.5 From Table 6.2 it can be seen that the percentages of people with hearing aids are very much lower than the 20% of the population predicted to have a hearing loss of 25 dB or greater, and even lower than the 5% estimated to have a hearing loss of 45 dB or more. On average 2.5% of the population in Europe have a hearing aid; that is 1 in 8 of the 20% of the population with a hearing impairment, or 1 in 4 of the population who would benefit form an aid according to Davis (2003). There are thus many more people who could benefit from the use of hearing aids than are currently doing so. 88
  • 89.
    89 A recent surveyof older people in the UK aimed to estimate the numbers of them who were hearing impaired, and the levels of ownership and use of hearing aids (Smeeth et al, 2002). Of 32,656 subjects aged at least 75 years 8% reported a lot of difficulty hearing and 42% a little or a lot of difficulty. Thus half the study group reported some hearing difficulty. However, only 26% of the subjects owned a hearing aid. Of these, 60% said they used their aids regularly, implying that 40% of the hearing aid owners in the study do not wear their aids regularly. Nearly 15,000 subjects were given a whispered voice test, the results of which are shown in Table 6.3. It can be seen that the test was failed by 26% of the participants. Of those who failed the hearing test 48% owned a hearing aid and 26% were wearing their hearing aid at the time of testing. Thus 52% of the subjects with hearing difficulties did not own an aid. Table 6.3 Numbers failing hearing test and owning hearing aid (Smeeth et al, 2002) % who failed % who failed test % who failed test Age hearing test wearing aid who own aid 75-79 19 23 44 80-84 31 26 53 Men 85-89 41 31 52 ≥90 56 26 49 All 27 26 49 75-79 15 20 39 80-84 25 26 49 Women 85-89 38 29 49 ≥90 55 37 51 All 25 27 47 This is one of the few studies to investigate the relative ownership and use of hearing aids by men and women. Of the subjects with reduced hearing, after adjustment for age, women were less likely than men to own a hearing aid. However, after adjustment for age women were found to be slightly more likely than men to use their aids regularly. 6.2.2 Hearing aid ownership in the United States A similar pattern of ownership to that in Europe emerges in the US. The most recent MarkeTrak survey was the Marke Trak VI, carried out in late 2000. Following a survey of 80,000 US households, detailed demographic data was obtained on 15,800 hearing impaired individuals. Of these, 3000 hearing aids owners were studied in more detail and the results published in the following year (Kochkin, 2001). Kochkin presents detailed data showing the variation in numbers of hearing impaired people and hearing aids owned and used in the US since 1984, as shown in Table 6.4. Table 6.4 Hearing aid ownership in the US since 1984 (data from Kochkin, 2001) 1984 1989 1991 1994 1997 2000 Number of hearing impaired (millions) 16.4 24.68 25.84 26.12 27.21 28.62 Hearing aid owners (millions) 3.9 5.65 5.84 5.56 5.55 6.35 Hearing impaired non-owners (millions) 12.5 19.03 20.00 20.56 21.66 22.27 No of hearing aids owned (millions) 4.8 7.76 8.79 8.45 8.88 10.43 No of hearing aids used (millions) 4.15 6.71 7.73 6.94 7.44 9.20 Percentage of hearing impaired 23.8 22.9 22.6 21.3 20.4 22.2 who own aid(s) 89
  • 90.
    90 It can beseen that although the numbers of hearing impaired people have increased consistently since 1984 the numbers of people owning hearing aids decreased between 1991 and 1997. The percentages of hearing impaired people owning hearing aids also decreased consistently from 1984 to 1997. However, between 1997 and 2000 both the number of hearing aid owners and the percentage of hearing impaired people with aids increased. Kochkin analyses the ownership of hearings aids from 1984 to 2000 according to various demographic factors such as age, household income and educational level. He found that the age group with the largest increase in reported hearing impairment in the 10 years from 1991 to 2000 was the 45 to 54 year old group. In the period 1997 to 2000 this group, and the 75+ age group, showed the greatest increases in incidence of hearing impairment. Kochkin suggests that a reason for the increase in the 45 to 54 age group is the revelation in 1997 by President Clinton of his hearing loss and use of hearing aids. This factor may also explain the overall increase in percentage ownership of hearing aids. The percentage of hearing impaired people who own hearing aids in the US is around 22%; thus approximately one in five of those who would benefit own a hearing aid, compared with one in three in the UK. A possible reason for the difference between the US and UK is that hearing aids are provided free of charge under the National Health Service in the UK, whereas there is a cost involved in having a hearing aid fitted in the US. 6.2.3 Hearing aid ownership among new users Table 6.5 shows the numbers of new users as a percentage of all hearing aids sold in the US from 1989 to 2000 (Kochkin, 2001). It can be seen that there was a considerable drop in the number of new users during the period 1997 to 2000 (31.6% of hearing aid sales in 2000 compared with 39% in 1997). However, the number in 1997 was a large increase over the 1994 figure, again suggesting that the ‘Clinton factor’ may have encouraged hearing loss sufferers to acknowledge their loss and to request hearing aids. The high percentage of new users in 1989, decreasing continually until 1997, also suggests that users may have been motivated to purchase a hearing aid as a result of hearing aid TV commercials in 1988 and 1989. Kochkin’s analysis also shows that the age of new users is increasing, being 68.8 years in 2000 compared with 66.3 in 1997. This is surprising given the increase of hearing impairment among younger age groups and suggests either that there is a lack of awareness of hearing impairment or a reluctance to use aids among these age groups. Table 6.5 First time ownership in the US since 1989 (data from Kochkin, 2001) 1989 1991 1994 1997 2000 New hearing aid owners 53.4 40.5 29.0 39.0 31.6 (percentage of all aids sold) Average age of new owners 66.0 68.4 67.8 66.3 68.8 Kochkin also discusses the factors influencing first time users to purchase hearing aids. Of the 19 factors mentioned, the three most prevalent in 2000 were awareness of deterioration in hearing (68.5%); pressure from family member (45.2%); and audiologists (40.5%). The percentage of first time hearing aid users in the US is very similar to that in the UK where it is estimated that about one third of hearing aid provision is to new users 90
  • 91.
    91 (Davis, 2003). Theage of first time use in the UK has also increased as in the US although the age of new users is higher than in the US, the median having increased from about 70 years in the early 1980s to around 74 in 1999. The average age of first time users is approximately the same as that of all users. This further implies a delay between diagnosis of hearing impairment and wearing of an aid, possibly caused by denial of the hearing loss. 6.3 Non-ownership of hearing aids The data presented in Section 6.2 shows that (in Europe) only about one third of those who would benefit from a hearing aid actually own one, while this ratio is lower in the US. As reported by the National Institute for Clinical Excellence (2000), the ratio of owners to non-owners did not change in England and Wales over the fifteen year period leading up to 2000. In fact, the ratio appears to have remained constant, certainly in the UK, for an even longer period. Gilholme Herbst et al (1991) found, in a comparison of elderly people in London and a rural community in Wales, that only around one third of those admitting to hearing loss (29% in London and 33% in Wales) possessed hearing aids, and reported that these figures were consistent with those of previous surveys carried out in 1962 and 1972. As the authors comment ‘It is rather a sad reflection on the state of the art and attitudes to hearing impairment that things have not improved in so many years.’ (Gilholme Herbst et al, 1991). How much more depressing it is that the situation remains the same after yet another decade. The surveys carried out by Kochkin (2001) and discussed in Section 6.2 show similar consistency in the US, where the percentage of the hearing impaired population owning hearing aids has remained at around 22% for the past 20 years, see Table 6.4. This is despite the reasonable supposition, supported by some studies and expressed by several authors (for example Thomas and Herbst, 1980; Dye and Peak, 1983; Robillard and Gillain, 1996), that with improvements in the technology and appearance of hearing aids, an increasing number of people would accept and wear aids. There are many reasons why people do not seek help for hearing loss or, having sought advice, decide against wearing a hearing aid. Research which has been carried out to examine these issues over the past twenty five years is reviewed in the following sections. 6.4 General reasons for non-ownership of aids Several papers, in addition to carrying out research into particular aspects of non-use of hearing aids, discuss the general reasons why people do not seek help or refuse to wear an aid. An early study to examine the reasons why elderly (65 and over) people reject the use of hearing aids was carried out by Franks and Beckmann (1985) among a group of 100 subjects in the US. The subject group was divided evenly into four categories: those with normal hearing; those with hearing impairment who had never worn an aid; those who had worn an aid for at least one month but no longer wore one; and those who currently used hearing aids. Subjects were presented with 36 possible reasons for non-use of aids and asked to rank them. A disadvantage of this method is that it ‘leads’ respondents and, in the report of the study, some of the questions appear 91
  • 92.
    92 to be repetitiveor not appropriately worded. Nevertheless important insights were provided into the reasons for non-ownership of aids, which have subsequently been confirmed by other studies. The two most important reasons given for non-use were cost and the fear that having a hearing aid will draw attention to the hearing loss. Other highly ranked reasons among the groups without aids were that aids are inconvenient and uncomfortable to wear, ignorance of where to buy aids, the belief that aids are only for the most severe problems, and being influenced by the poor reports of others. Interestingly, reasons concerning attitudes of family and friends are ranked the lowest which suggests that the reasons for non-use relate solely to users and potential users themselves. Dissatisfaction with dispensers of aids also contributed to their non-use. Kochkin (1993) compared the reasons given for not purchasing hearing aids in two studies of the Hearing Industries Association focus groups in 1984 and 1990. The reasons commonly given in the earlier survey were the following: • Hearing loss not severe enough • Physicians do not recommend hearing instruments • Hearing instruments cannot solve specific hearing problems In the 1990 survey the stated reasons, in order of importance were: • Hearing instruments have a stigma attached to them • The person’s hearing loss is not serious enough to warrant getting hearing instruments • Hearing instruments are uncomfortable or do not perform well • Hearing instruments cannot solve specific hearing problems • Hearing instruments cost too much, especially in relation to their value It is interesting to note than in the earlier survey stigma, cost and performance did not feature as reasons for non-ownership of aids. The reasons emerging from the 1990 study however agree strongly with those of the study by Franks and Beckmann (1985) described above. In 1993 Kochkin carried out a similar but much more extensive survey using a larger group of subjects (Kochkin, 1993). He analysed the responses of 2306 hearing impaired non-owners of hearing aids, having presented them with a list of 60 possible reasons why they might not own a hearing aid and asked them to score the importance of each reason. He divided the reasons into six categories: hearing loss issues; consumer/personal issues; stigma; hearing healthcare professionals; social network; and product. The most important reasons which emerged within each category are listed in Table 6.6. 92
  • 93.
    93 Table 6.6Reasons for non-ownership of hearing aids within categories defined by Kochkin (1993) Percentage Category of reasons Reason non-owners Loss not severe enough 43.3* Hearing loss issues Mild hearing loss 40.6* Total 96% Hear well enough in most situations 39.5* Hearing loss not disruptive 26.9* Cannot afford 44 Consumer/personal issues More serious priorities 43 Total 68% Hearing not tested yet 34 Do not want to admit loss in public 27 Embarrassment about wearing 27 Stigma Hearing aids are noticeable 25 Total 44% Hearing aids make you look old 22 Hearing aids make you look disabled 20 Advice of ENT specialist 33 Hearing healthcare professionals Distrust of hearing aid specialists 29 Total 44% Opinion of family doctor 27 Opinion of audiologist 26 Social network Opinion of spouse 20 Total 34% Opinion of hearing aid owner 20 Poor performance and low value 55 Product feature Amplification of background noise 36 Total 48% Maintenance expense 32 Hassle to use 30 * Percentage giving factor as ‘definite’ reason only; elsewhere numbers refer to percentages marking factor as ‘definitely’ or ‘somewhat’ a reason. Consistent with the findings of Franks and Beckmann (1985), cost, stigma, and a belief that hearing aids are only for those with a severe problem feature as important reasons why people do not own hearing aids. As in the Franks and Beckmann study, Kochkin found that issues related to social networks and opinions of spouses and other family members were of relatively low importance. These two studies therefore suggest several possibilities: non-owners do not respond to the views of others close to them; the families of non-owners are not bothered by the hearing loss; family members are unaware of the benefits that could be obtained using hearing aids; or many non-owners are not close to other people (for example, single or widowed and living on their own). An interesting finding relating to stigma in the study by Kochkin is that it is the 35 to 44 year age group who are most affected by stigma-related issues. Over 50% of non- owners in this age group report not purchasing hearing aids because of some stigma attached. This is of particular interest as this is the age group with the largest number of non-owners. Several of the issues contributing to the non-use of hearing aids which have been raised in the studies reviewed in this section have been examined individually in other studies and are discussed in the following sections. 93
  • 94.
    94 6.5 Reluctance to seek help Several studies have examined the reasons why people who are aware that they have a hearing loss are reluctant to seek help for that loss. The survey by Kochkin discussed above (Kochkin, 1993) found that over one third of hearing impaired subjects had not had their hearing tested. After reviewing the literature concerning the lack of help seeking for hearing impairment Brink et al (1996) suggest that the main factors which influence help seeking are related to: 1 The severity of hearing problems 2 A presumed passive acceptance of hearing problems by the elderly 3 Clinical experience that many hearing impaired elderly people believe that the problem is external 4 The stigma attached to hearing impairment and its association with mental disorder and old age 5 The poor image of hearing aids as ‘ineffective’ crutches 6 Mobility and financial barriers to help seeking 7 Lack of knowledge and misconceptions about hearing loss and hearing aids 8 Professionals who regard hearing problems as a normal part of ageing and doubt the ability of hearing aids to help the elderly 9 Social pressure from significant others to seek help It can be seen that these factors reflect in general the reasons given in the surveys discussed above concerning the non-ownership of hearing aids. Two surveys have been carried out in the Netherlands by Brink and colleagues (Brink et al, 1996; Duijvestijn et al, 2003) to establish more precisely the attitudes of mature hearing impaired people towards help seeking. In the earlier study 144 hearing impaired subjects, aged 57 and above and selected randomly from various general practices, answered an attitude questionnaire and a hearing disability and handicap questionnaire. Forty one percent of the sample used a hearing aid. Over one quarter (27%) had not seen a doctor; over one quarter (26%) had seen a doctor but not tried an aid and 3% had not taken an aid after a trial. The authors found that help seeking was related to the perceived seriousness of the hearing problem. Those who had not consulted a doctor perceived their hearing loss as relatively inconsequential, while those who saw a doctor but would not try an aid saw the most stigma related barriers to wearing hearing aids (for example making the hearing loss obvious to others or making a wearer feel old). The second Dutch study (Duijvestijn et al, 2003) investigated the importance of the following four factors which influence help-seeking behaviour: hearing disability, perceived social pressure from significant others; hearing aid image; and willingness to try hearing aids. Two groups of hearing impaired subjects who did not possess hearing aids were compared: 166 who had not consulted a doctor about their hearing loss and 115 who had consulted their doctor. Significant differences were found between the two groups in the subjective impressions of hearing and social pressure to obtain a hearing aid, but there was no difference in their images of hearing aids. Significantly more people in the ‘consulter’ group were willing to try a hearing aid. The researchers found that awareness of hearing impairment alone was not sufficient 94
  • 95.
    95 to seek aconsultation with the doctor; help seeking behaviour was strongly dependent on the degree of difficulty, social pressure and willingness to try a hearing aid. However, the results of this study may not be widely applicable as subjects volunteered to take part and were not typical of the hearing impaired population being generally younger (55 and over), healthy and predominantly male. Also the questionnaire described in the paper is short and limited in scope and in some cases the interpretation of responses does not appear to be consistent with the wording of questions (this may be due to translation of the questionnaire). 6.6 Variability in services provided Once someone has decided to seek advice or help for a hearing loss, there is a wide variety in the provision of audiological services. In particular, there is significant variation in waiting times, for example within the UK as reported by NICE (2000) where some centres have unacceptably long waiting times. There is also wide variation across countries. The study of services in the UK and Nordic countries (Sorri et al, 2001) also found a high variation in waiting times across and within countries, from less than 3 months in Sweden to up to 18 months in Finland. It is possible that the long waiting time in Finland is a reason for the low provision of hearing aids in that country. In some countries certain groups have priority, for example in Denmark and Norway employed people and children are prioritised to have shorter waiting times. (However, there is no evidence to suggest that older people receive an inferior service in these countries.) Nevertheless, it is possible that, within a long waiting period, some of those who are reluctant to seek help in the first place might change their mind and decide to continue without a hearing aid. In 1991 Gilholme Herbst et al suggested that services in the UK were likely to be worse in areas of greater socio-economic deprivation where in fact there was a greater need of services. In their study of hearing impaired subjects in Wales and London the authors found that less than half of those who had consulted their doctor ended up in possession of a hearing aid ((29/66 in London; 17/39 in Wales) suggesting that the process of procuring an aid was equally problematic in both areas, due to the attitude of both the patient and their doctor to hearing loss and ageing. 6.7 Denial of problem and delay in seeking help Many researchers have reported that hearing impaired people wait as long as possible before seeking help, sometimes as a result of denying to themselves and to others the existence or the severity of a problem, or because, as seen above, they believe that hearing aids are only used to benefit people with more serious hearing problems. Dye and Peak (1983) report that seeking help is often delayed until the problems caused by hearing loss outweigh the perceived stigma of wearing an aid. Brink et al (1996) report two studies, by Brooks (1979) and Stephens et al (1980) which found periods of several years (medians of 8 and 12 years respectively) between the onset of awareness of hearing difficulties and seeking help. Thomas and Herbst (1980) found an even longer delay in seeking help to be common; of 211 hearing aids owners in 95
  • 96.
    96 their study, over40% had known they had a hearing loss for 20 or more years before obtaining an aid. One possible reason for the delay in seeking help given by Eriksson-Mangold et al (1990) is the association of hearing problems with getting old; this leads people to ignore their problems for as long as possible. There is some evidence that elderly people may have more difficulty acknowledging their hearing loss than younger persons (Committee on Disabilities of the Group for the Advancement of Psychiatry, 1997). A study by Wiley et al (2000) suggests that one reason why the elderly may apparently not acknowledge their loss is that they are less likely to consider themselves handicapped by hearing loss. In examining the likelihood of self reporting of hearing handicap among over 3000 participants aged from 48 to 92 in America, although the prevalence of hearing loss increased with age, the self reporting of hearing handicap decreased. Only 40% of participants with a measured hearing loss reported having a hearing handicap. In the same study population Popelka et al (1998) found that hearing aids were used by only 15% of those with a measured hearing loss, and that only 21% of older adults with any degree of hearing loss had tried aids. Other reasons why older individuals may delay seeking help include depression and social withdrawal which may prevent them from making use of available services (Aguayo and Coady, 2001; Barnett, 2002). Also, older people who do not participate in a great deal of activity outside the home may genuinely have little awareness of their impairment, particularly as they may have learned to cope with it, possibly unconsciously (Duijvestin et al, 2003). As Espmark et al (2002) report, it is not until elderly people experience lack of sound as lack of contact with life that they show any interest in hearing technology. 6.8 Stigma It is apparent from the papers reviewed above that stigma plays an important role in preventing many hearing impaired people from wearing a hearing aid. Indeed, as stated above it may be that help is not sought until problems of hearing loss outweigh the perceived stigma of wearing an aid (Dye and Peak, 1983). Hetu (1996) has addressed at length the issue of stigma attached to hearing impairment and considers it to be the major obstacle to rehabilitation, contributing to the length of time between onset of difficulties and seeking professional help and to the reluctance to adopt and use hearing aids when prescribed. Many papers identify particular aspects of the stigma attached to hearing loss and hearing aids as being reasons for non-ownership of aids. For example: • Association with ageing (Dye and Peak, 1983; Eriksson-Mangold, 1990; Kochkin, 1993; Brink 1996) • Association with mental disorder (Brink, 1996) • Unsightliness of hearing aids (Dye and Peak, 1983) • Drawing attention to hearing loss (Dye and Peak, 1983; Rutman, 1989; Kochkin, 1993; Hetu, 1996) • Embarrassment (Kochkin, 1993; RNID, 1999) 96
  • 97.
    97 It is thereforevery important in order to increase the wearing of hearing aids that the perceived stigma attached to the wearing of a hearing aid is overcome. One way in which this might be achieved is by the use of ‘success stories’ as suggested by Gilholme Herbst et al (1991). The use of role models would also encourage people to use a hearing aid, as evidenced by the increase in the wearing of aids following the revelation by President Clinton of his hearing impairment (Kochkin, 2001). Hetu (1996) also suggests that the visual appearance of hearing aids should be enhanced so they become a ‘fashion aid’ as happened a few years ago with spectacles; this would also help to reduce the stigma attached to wearing an aid. 6.9 Early screening There is some evidence from studies in the UK that early intervention or screening of the population for hearing loss might lead to an uptake in the acceptance of hearing aids. A survey of the pre retirement population in South Wales found that of 662 subjects aged 50-65 around half reported a hearing disability; of these 7.3% already possessed a hearing aid (Stephens et al, 1991; Davis et al, 1992). All those reporting a disability were offered rehabilitation including hearing aids. Twenty three percent of those reporting hearing problems and found to have a hearing loss of 30 dB or more accepted an aid and were still using it 6 months later. Furthermore, after 2 years 90% of the newly fitted remained users and were satisfied with their aids. Acceptance of an aid was not dependent on sex, social class, hearing level or exposure to occupational noise, but was found to be more likely by those who complain of both tinnitus and hearing disability together. However those reporting the greater handicap were more likely to accept an aid which suggests, as would be expected, that those prepared to accept an aid are those who are more disturbed by their hearing loss. In a more recent study (Davis, 2003) 2466 subjects aged 55 to 74 were screened for hearing loss and those with a worse ear hearing loss of greater than 25 dB were offered an aid. Forty percent of those offered aids accepted them, whereas normally only approximately 6% of this age group possess aids although around half have a hearing loss of over 25 dB. These studies suggest that active intervention aimed at identifying those who would benefit from an aid would increase ownership of aids. It is possible that early and active intervention might help to counter the negative consequences of the stigma attached to hearing impairment and the wearing of hearing aids. 6.10 Summary The main points that arise from the research reviewed in this chapter are as follows: • Around 10% of the population of the UK could benefit from a hearing aid • Around 3.5% of the population in the UK and in Denmark own a hearing aid • Around 2.3% of the population in Sweden and Norway own a hearing aid • Around 1% of the population in Finland own a hearing aid • In Europe on average around 2.5% of the population own a hearing aid 97
  • 98.
    98 • In the UK only around one in three of those who would benefit own a hearing aid • In the US only around one in five of those who would benefit own a hearing aid • In the UK and US the ratio of those who possess hearing aids to those who need them has not changed for 40 years • Revelation of hearing impairment and use of hearing aids by high profile figures increases acknowledgement of hearing impairment and ownership of aids • Awareness of deterioration of hearing and family pressure increase motivation to obtain a hearing aid • Around one third of hearing aids supplied each year are to new users • The age of new users is increasing • Reasons for non-ownership of aids include the belief that hearing loss is not severe enough to benefit from an aid; stigma; cost; discomfort; reported poor performance of aids • Over 1 in 3 hearing impaired people do not seek help for a hearing loss • There is wide variety in the provision of services and waiting times • People delay seeking help because of association with ageing • Active intervention would increase ownership of aids 6.11 Conclusions The research reviewed in this chapter shows that there are still many people around the world who would benefit from a hearing aid but do not own one. There are many reasons for this, including the cost of aids in some countries, the stigma attached to wearing a hearing aid, and refusal to acknowledge hearing loss. It is surprising, particularly in view of the technological advances leading to improved performance of aids, more in-the-ear aids and smaller, less obvious, aids that the percentage of hearing impaired people who own an aid has not increased for many years. This suggests that society in general still has a negative and ignorant view of hearing impairment, and that the hearing aid industry and the medical profession are failing to convince both the general public and the hearing impaired population of the availability and benefits of wearing hearing aids. Evidence concerning relatively low ownership of hearing aids among those who need them has been available for many years, yet the situation has not improved. In order to improve the quality of life of a large number of the population, it is necessary to address the reasons for the low ownership so that more hearing impaired people can benefit from the assistance provided by hearing aids. However, ownership of a hearing aid does not necessarily guarantee that it will be used. The following chapter discusses issues concerning no, or little, use of aids among hearing aid owners. 98
  • 99.
    99 CHAPTER 7 USE OF HEARING AIDS 7.1 Introduction The previous chapter discussed the prevalence of hearing aid ownership and non- ownership among the hearing impaired population, and examined reasons why some hearing impaired people do not own a hearing aid. This chapter considers the amount of time hearing aids are used by their owners, and possible reasons why some hearing aid owners do not use their aids or use them for only a small amount of time. In considering the research reviewed in this chapter it must be remembered that the quality, design and performance of hearing aids has changed over the past 40 years. The earlier papers were concerned predominantly with body worn aids whereas later papers discuss behind-the-ear and/or in-the-ear aids. There is an additional body of research in which preferences for different types of aids have been investigated. This is beyond the scope of this report. However, in this chapter, if these factors impinge upon the issues being discussed they will be referred to; otherwise papers discussing solely that aspect of hearing aid use have been omitted from this report. 7.2 Usage of hearing aids Several studies have reported on the usage of hearing aids, for example in terms of how often they are worn, or number of hours per day for which they are worn, and have attempted to relate this to factors such as age or degree of hearing loss. This section reviews some of the data that has been presented, from which it can be seen that many hearing aids are used very little or not at all. An early study into factors affecting hearing aid use was carried out by Surr et al (1978). The authors cite research carried out in the 1970s which reached contradictory conclusions regarding the relationship of hearing aid use to age and to severity of hearing loss. They cite previous research by Ewertsen (1974) in which a follow up study of 1006 patients found that a greater percentage of patients with severe hearing loss for speech used their aids always, compared with those with less severe losses. There was no apparent relationship between usage and age. However, in contrast to the findings of Ewertson, Surr et al report that Jerger and Hayes (1976) found that the mean age of dissatisfied users was higher than that of the satisfied group. Consistently with Ewertson, Kapteyn (1977a, 1977b, 1977c) found no age effect, but he also found no consistent relationship between hearing loss and use. However, he did find that the longer it takes to acclimatise to the aid, the lower the daily usage, which suggests that the longer it takes to adjust to an aid the less likely a patient is to wear it. (It was reported in Chapter 6 that early intervention increases ownership of aids; these two aspects may be related in that it is possible that the earlier the intervention the shorter the adjustment period.) Surr et al themselves surveyed 666 US army members who wore hearing aids. A difference between this study and others was that the subjects were, on the whole, younger than those used elsewhere, and also had a wide age range from the 20s to the 80s, the majority being in their 40s and 50s. The subjects suffered from predominantly noise induced hearing loss and all had worn their aids for at least 6 months. A variety of aids were in use; no in-the-ear aids were included in the analysis. The responses of 439 subjects were analysed to investigate use related to age, to hearing loss, to length of training programme, and in different situations. 99
  • 100.
    100 It was foundthat around 75% of respondents used their hearing aid for at least 50% of the time, regardless of the type of aid. In examining the relationship between hearing loss and usage, the authors found that more than 70% of those with normal or mildly impaired hearing for speech wore their aids always or often; this figure increased to 80% of those with more severe hearing loss for speech. However, when other audiometric data was examined there was little variation with hearing impairment across the usage categories. The factor that most strongly correlated with use was age. Table 7.1 shows the number and average age of subjects within the following four usage categories: Never Hearing aids used 0% of the time Occasionally Hearing aids used 1% to 50% of the time Often Hearing aids used 51% to 99% of the time Always Hearing aids used 100% of the time Table 7.1 Frequency of use of hearing aid compared with age (Surr et al, 1978) Categories of usage Always Often Occasionally Never Number of subjects 95 (22%) 227 (53%) 99 (23%) 9 (2%) Mean age 47.3 50.3 55.4 67.0 More detailed analysis of the data by age is shown in Table 7.2 which shows the usage within different age groups. Table 7.2 Hearing aid use of different age groups (Surr et al, 1978) Percentages in different categories of usage Total Age Always Often Occasionally Never number 21-30 30 44 26 0 23 31-40 31 61 8 0 74 41-50 26 60 14 0 104 51-60 15 53 30 2 112 61-70 16 43 36 5 67 71-80 21 47 26 6 38 81-90 0 38 50 12 8 It can be seen from Tables 7.1 and 7.2 that the use of hearing aids among these subjects decreased with age, Table 7.2 showing a marked drop in use after the age of 50. The authors suggest that this may be due to the high incidence of mild impairment in this study, possibly resulting in selective hearing aid use after people retire. The authors also found that the length of training post fitting affected use (as has been found in subsequent studies, see Section 7.4). Subjects who attended longer training programmes used their aids more frequently than those who attended a short period of training. This may have contributed to the higher usage among the younger age groups as they tended to have received the longer training programmes. However, when the younger age groups were eliminated from the analysis the length of training was still found to have a significant effect upon usage. At around the same time as the study by Surr et al, Thomas and Herbst (1980) carried out a study of 211 hearing aid owners in the UK to determine whether the 100
  • 101.
    101 introduction of behind-the-earaids improved usage compared with body worn aids. Their subjects had owned aids for between one and eight years, with an average period of hearing aid ownership of three years. Nearly half (47%) of their sample had body worn aids. Table 7.3 shows the amount of time each type of aid was worn. Table 7.3 Effect of introduction of post-aural (behind-the-ear) aid on usage (Thomas and Herbst, 1980) Hearing aid usage Always Often Sometimes Rarely Never Body-worn 10 (10%) 17 (17%) 21 (21%) 16 (16%) 34 (35%) N = 98 Post-aural 42 (38%) 23 (21%) 28 (25%) 13 (12%) 5 (5%) N = 111 Table 7.3 shows that post-aural aids were worn very much more than body-worn aids. Only 5% of post-aural aid owners did not use their aids at all, compared with 35% of those with body-worn aids. Comparing usage with hearing loss the authors found that the introduction of post-aural aids had increased hearing aid use dramatically, especially among those with profound or severe hearing losses. Such people were twice as likely to wear a post-aural aid as a body-worn aid. However, it can be seen that, of the whole sample, 32% rarely or never wore their hearing aids, compared with 24% of people wearing their aids occasionally or never in the study by Surr et al (1978). There appears to be little other detailed study of hearing aid usage until the work of Kochkin and others in the 1990s (Kochkin, 2000, 2001, 2002; Arlinger and Billermark, 1999). Much of this more recent research has focused on determining the reasons why hearing aids are not used, as discussed in Section 7.5. Some studies published during the 1990s refer to incidence of non-use or reduced use of hearing aids. For example, Hallberg (1996) in a discussion of the impact of noise induced hearing loss (NIHL) on family life in Sweden observes that the use of hearing aids has a low priority among men with NIHL. In studies by Hallberg only 7% to 26% of those with moderate to severe hearing loss were found to possess hearing aids, and only 7% of the men in one study wore aids. It is possible, as suggested by Surr et al (1978), that as people become older they tend to use their hearing aids selectively. The Committee on Disabilities of the Group for the Advancement of Psychiatry (1997), discussing issues relating to deaf and hard-of- hearing patients, reports that elderly patients use hearing aids inconsistently (for example, only at work or in social situations). Elderly people interviewed by Davies et al (2001) reported similar, intermittent, patterns of usage. A Swedish study carried out by Arlinger and Billermark (1999) found that digital aids were preferred by owners and used more frequently than analogue aids. Of 29 subjects fitted with digital aids (mean age 65 years) who had previously worn analogue aids, the average usage was for 11 hours a day, with 20 subjects using their digital aids for 10 or more hours a day. (Analogue aids had previously been worn for on average 6 hours per day.) 101
  • 102.
    102 In the 2001survey of hearing aid users carried out by the Australian Office of Hearing Services (Office of Hearing Services 2001; 2002), 91% of respondents (out of 1014) reported using their hearing aids on a daily basis (for one or more hours a day) although use was found to be higher among refitted clients than new clients (45% of return clients reported using their aids for over 8 hours a days, compared with 19% of new clients). This therefore suggests that 9% of the population who own hearing aids do not wear them at all. This figure is very much lower than that reported in other countries. However, at present insufficient information has been acquired on other aspects of hearing aid provision in Australia to suggest possible reasons for this difference. It is possible, and to be expected, that only regular wearers responded to the questionnaire survey. In the UK it is generally accepted that around one third of hearing aids prescribed on the National Health Service are never used (NICE, 2000). The large scale survey by Smeeth et al (2002) of hearing aid ownership and use among elderly people in the UK found that, of those who owned a hearing aid, 60% said that they used their aids regularly, thus implying that 40% of the hearing aid owners in the study did not wear their aids regularly. In comparing the data for men and women and adjusting for age, it was found that, although women were less likely than men to own a hearing aid, they were slightly more likely than men to use their aids regularly The Marke Trak VI survey, reported by Kochkin (2001) gives data on unused hearing aids (or ‘in-the-drawer’ aids as they are referred to by Kochkin). Table 7.4 shows the percentages of aids not used since 1984 (where the data is available), for aids less than 4 years old which Kochkin gives as the effective life of a hearing aid. Table 7.4 US data on unused hearing aids since 1984 (data from Kochkin, 2001) 1984 1989 1991 1994 1997 2000 Percentage of aids not used Total 13.5 12.0 17.9 16.2 11.7 Aids less than 1 year old 3.0 3.5 4.6 3.1 Aids less than 4 years old 7.7 11.1 8.8 6.8 The numbers of unused aids appear to be much less in the US than in the UK, and to be decreasing. The difference between the US and UK is again probably due to the fact that hearing aid owners in the US will probably have paid for their aids, whereas most UK aids are provided free of charge through the National Health Service (and may not be the most suitable for a particular patient). Kochkin does not provide any data on frequency of use of aids for comparison with other studies. He does explore at length reasons why hearing aids are not used, and customer satisfaction with aids, as discussed in Section 7.5. Two surveys carried out in Australia in 2001 and 2002 (Office of Hearing Services 2001; 2002) found an increase in the number of respondents saying that they never use their aids. In 2002 7% of respondents reported using their aids less than one hour per week or never whereas in 2001, the figure was 3%. The percentages reporting never using their aids were 1% in 2001 and 5% in 2002. A possible explanation is 102
  • 103.
    103 that there wasa higher percentage of new clients in the second survey and they tend to use hearing aids less than return clients as, on average, they have milder hearing loss and also they are not so experienced in using the aids (Office of Hearing Services, 2002). It can be seen from the papers reviewed here that there is considerable variation between countries and studies in the numbers of hearing aids that are reported as being not used, and that it is not easy to gain a general picture of the extent of non- use. 7.3 Hearing aid usage among young people The only study found which has investigated usage of hearing aids among young people is that of Gregory et al (1995). Details of this study are included in Chapter 4. Of the 58 young people interviewed by Gregory, 55 (95%) had hearing aids although the number who wore them regularly was much less as is shown in Table 7.5. Table 7.5 Extent of use of hearing aids by young people (Gregory et al, 1995) Hearing aid usage Always Usually Rarely Never No aid Number of 32 7 5 11 3 subjects Percentage 55 12 9 19 5 of subjects It can be seen that almost one third of the young people in this study who possessed aids used them rarely or not at all. Interestingly in some cases there was a discrepancy between the reports of the young people themselves regarding their hearing aid use, and those of their parents. For example, one young person reported wearing the aid rarely, while the parents claimed the aid was worn all the time; another young person reported wearing their aid all the time but the parent said it was rarely worn. Gregory et al also related the use of hearing aids to severity of hearing loss. Dividing the usage into two groups – regular (always, usually) and little use (rarely, never, no aid) – the numbers with varying degrees of hearing loss in each group are as shown in Table 7.6. Table 7.6 Hearing aid usage of young people related to hearing loss (Gregory et al, 1995) Degree of hearing loss Profound Severe Moderate/partial Regular use 6 20 13 Little use 10 5 4 Table 7.6 shows that the less severe the hearing loss the more likely the young people are to wear their aids. The use of aids is also related to choice of language, with those preferring the use of oral language rather than signing making greater use of aids, as 103
  • 104.
    104 would be expected.Reasons given by young people for not using aids are discussed in the next section. 7.4 Reasons for non-use and under-use of hearing aids While the problems of non-use and under-use of hearing aids have been recognised and researched for many years, there appears to have been little advance in addressing many of the issues; as shown in the previous section the use of hearing aids by those who need them has barely increased over the years. The same reasons have been repeatedly cited and appear to be well recognised in the literature. For example, the National Institute for Clinical Excellence (NICE) (2000) list the following general reasons why in the UK approximately one in three hearing aids is hardly ever used: • Inadequacy of device • Poor handling skills • Poor initial user information and instruction • Absence of timely follow up to ensure user’s specific needs being met and problems resolved • Possibly social stigma and cosmetic problems The long waiting times at some audiology centres, mentioned in Section 6.6, may also deter people from seeking help if they are experiencing problems with their aids. The reasons cited by NICE (2000) for non-use of aids in the UK are paralleled by a similar list given by Kochkin (2002) following a survey of 3000 hearing aid owners in the US: • Poor benefit and listening experiences • Inability to hear in noise • Poor fit and comfort • Negative side effects • Price and cost of repairs Some of these factors are examined in more detail in subsequent sections. The following section, Section 7.5, summarises surveys which have attempted to quantify the importance of various factors related to non-use. Sections 7.6 to 7.11 consider some factors individually. 7.5 Analysis of factors related to non-use Several studies have sought to examine in detail the reasons why people who own hearing aids either do not use them at all, or do not use them as often as they might in order to obtain maximum benefit from the aids. Many of the reasons given are the same as those given for not seeking help or not owning a hearing aid (see Chapter 6). The most detailed reports on the causes of non-use of hearing aids are those by Surr et al (1978), Franks and Beckmann (1985) and those in the Marke Trak series by Kochkin (1993, 2000, 2001, 2002). 104
  • 105.
    105 In their surveyof hearing aid users in the US army (see Section 7.2), Surr et al (1978) asked those who wore their aid less than 50% of the time to indicate the reasons for the limited use of the aid. A total of 179 reasons were given by 125 patients. The most common reasons, and percentage of users indicating each one, are listed in Table 7.7. Table 7.7 Reasons for reduced hearing aid use (Surr et al, 1978) Reason % of respondents Background noise 32 Lack of need 31 Earmould problems 9 Eyeglass problems 6 Other (non-specified) 5 Not effective 4 Cosmetic 4 Too loud 4 Mechanical problems 3 Poor quality of sound 2 The fact that 31% of respondents gave ‘lack of need’ as a reason for using their hearing aid for less than half the time may be due to many subjects having only mild hearing loss, or being retired. The authors conclude that, for older patients suffering from presbycusis, psychosocial factors such as need, motivation and length of training may be more important than audiometric factors in relation to the wearing of aids. In the study by Franks and Beckmann (1985) (see Section 6.4), a group of subjects who had rejected their hearing aid after wearing it for at least a month were asked to indicate the importance of 36 possible reasons for their non-use of the aid. This group showed consistently negative attitudes to hearing aids compared with other subjects, for which the authors suggest two possible explanations: the negative attitudes arise directly as a result of experiences with hearing aids, or people within this group already have negative psychosocial attitudes which may influence their dissatisfaction with their hearing aid. For this group, of the 36 possible reasons the 11 highest ranking are listed below, in order of importance: • Cost too much • High pressure from dealers • Amplify noise • Dealers use deceptive practices • Dealers not trained • Difficulty manipulating aid • Make sound too loud • Dealers’ interest is only in money • Not instructed in use • Little or no help from aid • Aids only for most severe problems 105
  • 106.
    106 It can beseen that four of these reasons relate to dealers in hearing aids. They would therefore not necessarily be applicable in countries where hearing aids are supplied free of charge. Such reasons also do not appear in the study by Surr et al (1978), as their subjects had been provided with their hearing aids by the US Army. Kochkin (2000), in his detailed study of owners of ‘in-the-drawer’ hearing aids reported that only 10.6% of these owners are satisfied with their aids; 27.1% are neutral and 62.3% are dissatisfied. The older the aid the more likely it is to be unused, with one third of aids 8 years or more old unused. In examining the reasons for non-use of aids, Kochkin analysed 348 letters from non- users in which they described in narrative form their hearing aid experiences. The top eight reasons and percentages of respondents citing each reason, together with some typical comments quoted in Kochkin’s paper are shown in Table 7.8. This survey shows that nearly one third of these owners claim to receive no benefit from the aid. Similar dissatisfaction with performance of aids, in particular increasing background noise, has been found to be a major cause of non-use in the previous surveys described above. Kochkin advises that in order to increase benefits of aids and quality of listening as many consumers as possible should be fitted with advanced programmable aids. Table 7.8 Top eight reasons for non-use of hearing aids in survey by Kochkin (2000) Estimated % of Reason no. Comments respondents of owners Inability to distinguish words Poor benefit from HA 29.6 268,510 Amplify everything Do not improve hearing Increase background noise Background 25.3 229,407 Everything amplified noise/noisy situations Cause pain Too big Fit and comfort 18.7 169,448 Uncomfortable Fall out Ears hurt Negative side effects 10.9 99,062 Itching, sweating ears Dizziness, headaches Price and cost of Too expensive 10.3 93,848 repairs Not worth cost Socially isolated so no longer Do not need help 8.0 72,993 need aids HL too mild Repeated breakdowns Hearing aid is broken 7.8 70,386 Repairs too expensive Lack of clarity Sound quality is poor 6.3 57,352 Distorted sound Hissing The findings related to noise and sound quality are corroborated by a subsequent survey of 3000 hearing aid users to determine what improvements they would most like to see in hearing aids (Kochkin, 2002). It was found that improving speech 106
  • 107.
    107 intelligibility in noisewas the highest rated improvement wanted, with better sound quality rated second. The following sections consider some individual aspects of hearing aids and hearing aid fitting which may contribute to their non-use. 7.6 Defective aids A problem that may be the cause of many people ceasing to wear an aid is that hearing aid components are often defective (Sorri et al, 2001). Sorri et al base this observation upon the work of Parving et al (1992) and Sibelle and Parving (1994) who in 1994 published a report of a two year audit of hearing aid quality in Denmark. They found that 11% of aids were defective at the time of fitting, while many other aids became defective within two years of fitting. The survey showed that 12% of behind-the-ear aids became defective within 1 year, while after two years all in-the- ear aids had become defective and only 33% of them remained intact. Of the defects 30% were due to faults in internal components while over 60% had problems in external components. Of 4450 people who attended hearing aid services, over 60% of the visits were due to defective hearing aids. Of these aids, 21% had been used for less than 1 year; and over 91% for less than 4 years. Overall 8% of aids were defective within the first year of use although examining specific types of aid, the defect rates varied from 6.6% to 70.9% in the first year. These figures are surprisingly high when viewed in light of the percentages of, and reasons for, non-use discussed in the preceding sections, and the relatively low citations of poor performance as a reason for non-use. However, they do highlight the importance of maintaining high standards of quality and robustness of aids in order to maximise usage. 7.7 Hearing aid preferences There have been some studies examining individual preferences for type of hearing aid which have provided contradictory results (Sorri et al, 2001). These studies are beyond the scope of the current review; however, according to Sorri et al, due to funding constraints, patients are often not provided with the hearing aid which is most likely to give them maximum benefit. This could be a contributory factor to people not wearing aids once they have received them. As Arlinger and Billermark (1999) showed, see Section 7.2, a change from analogue to digital aids in a group of 29 subjects increased daily use significantly. Robillard and Gillain (1996) and Smeeth et al (2002) also consider that increased use of in-the-ear and non-linear aids would encourage higher levels of use among older people. However, it would seem from the US surveys carried out by Kochkin that overall satisfaction with hearing aids has not increased in recent years, suggesting that the introduction of digital and programmable aids has not improved user satisfaction. This may suggest that in fact the more advanced aids might not encourage higher usage, and that reasons other than those connected directly to the performance of the hearing aid itself may contribute to non-use. This issue is explored further in Chapters 8 and 9. Nevertheless, in order to increase the likelihood of people wearing their aids, individuals should be fitted with models which they personally find the most comfortable and provide the most benefit for their particular hearing problem. 107
  • 108.
    108 7.8 Hearing aid fitting Both psychological and practical factors influence the outcome of hearing aid fitting. The surveys described in Section 7.5 showed that several issues connected to fitting contribute to the reduced wearing of aids. Inadequate fitting may result in aids being inconvenient to wear, or fitting incorrectly. In the UK 27% of wearers find them awkward, uncomfortable or badly fitting (Sorri et al, 2001). Aids may also be rejected because they are difficult to manipulate (see Section 7.10) and unattractive (Eriksson-Mangold et al, 1990). A factor discussed by Eriksson-Mangold et al (1990) which is relevant to the successful outcome of hearing aid fitting is that of ‘passivity’. Fitting of aids in a hospital context means that patients feel they have a passive role, accepting help and care, so that they are not responsible themselves for the outcome. To examine this aspect, Eriksson-Mangold et al (1990) investigated the benefits of an ‘active fitting’ programme where patients were more actively involved in their hearing aid fitting. They found that participants in this programme had a more positive approach to their hearing aids, used their aids more frequently and felt more psychologically secure with them. In a trial of early screening and intervention Davis et al (1992) found increased satisfaction with aids and a low incidence of non-use after fitting. It is possible that the participants in this study felt more involved in their fitting, leading to a successful outcome in most cases, as in the study by Eriksson-Mangold et al (1990). Another aspect of hearing aid fitting which can affect the ultimate success of wearing an aid is the provision of adequate training in their maintenance and use. Often too little instruction is provided (Eriksson-Mangold et al, 1990) and this is often cited as a reason for non-use or reduced use of aids (Franks and Beckmann, 1985; National Institute for Clinical Excellence, 2000). Surveys such as that by Surr et al (1978) have shown that those given longer periods of training wear their hearing aids more often. 7.9 Expectations of hearing aids It has been suggested in some studies that another factor that may influence the outcome of hearing aid fitting is that of unrealistic expectations of the use and benefits of a hearing aid (Eriksson-Mangold et al, 1990; Schum, 1999). If people expect too much of an aid, they may feel let down and disappointed if it does not perform as well as expected, which may lead to rejection of the aid. Cox & Alexander (2000) have recently developed a new scale specifically to investigate this aspect of hearing aid fitting, the Expected Consequences of Hearing aid Ownership (ECHO) scale. The scale was initially used with a group of new users and compared with the views of experienced users to see if the expectations of new users were unrealistic; and then with a second group to see whether their expectations affected the eventual outcome of their fitting. The first group were found to expect more improvements in performance and function, and better service and value than they were likely to receive. They also did not fully appreciate potential negative issues such as problems with feedback. There was also a tendency for them to have more concerns about stigma issues than the experienced users. 108
  • 109.
    109 However, in comparingexpectations with subsequent satisfaction with aids, only one aspect of the ECHO scale was related to eventual satisfaction. Those who expected psychological and psychoacoustic benefits tended to report greater improvement from their aids. However, there was some evidence that unrealistic advertising of hearing aids has had a negative impact on patient satisfaction. 7.10 Hearing aid handling A feature of aids that can be problem, particularly for elderly people, especially those with large or arthritic fingers, is difficulty in handling them (Salomon et al, 1988; Barnett, 2002). Ironically, one of the main features of modern aids and the one which is likely to encourage use, particularly among those who are conscious of a stigma attached to wearing an aid, is their small size; however this also makes them increasingly difficult to handle. Small aids also mean small batteries which add to the difficulties. This problem has been mentioned to the author in interviews with hearing impaired persons in their 20s and 50s, and was included in the lists of reasons for non- use given by Franks and Beckmann (1985) and NICE (2000). 7.11 Stigma Although stigma and negative perceptions of hearing aids play a large role in affecting the ownership of aids, as discussed in Chapter 6, it does not appear to feature as a major factor in non-use or reduced use of aids. Once the barrier of obtaining an aid has been passed, it appears to be more practical matters concerned with the aid itself – the actual fit of the aid, its ease of use, and performance – that determine how often it will be used. 7.12 Use of hearing aids by young people In the only survey of hearing aid use among young people, Gregory et al (1995) asked their subjects to describe their experiences with aids. Some of the problems described by the young people could equally well apply to older users, while reasons for non- use or little use are similar to those given by older users. Those with mild loss who did not use aids said they heard better without them. Of those who had aids some had always liked them while others appreciated them more as they became older. Sometimes aids were used not primarily for listening to speech, but to maintain contact with their environment, for example for awareness of cars or of music. Some young people who wanted to wear their aids experienced difficulty in getting leads and batteries once they had left school. The distance to a fitting centre sometimes caused problems as it meant having to take time off work to visit the centre. The main reasons given for not wearing aids were similar to those given in the studies discussed in Section 7.5. For example aids were of no use, were intrusive or embarrassing, caused headaches, made ‘noises’, or were inconvenient to wear. As a result of such problems some aids were discarded in adulthood. It was found that the age at which aids were first worn (less than 1 year to over 2 years) did not affect later 109
  • 110.
    110 use. However, theamount they were worn early in life and the person’s attitude to their aid as a child – whether the aid was tolerated or not – affected the amount it was worn when older. Nevertheless, some children, even if encouraged to wear aids, never grew to accept them. 7.13 Other reported problems Although not related to non-use of aids, two large scale surveys of hearing aid users across Australia (Dillon et al, 1999; Office of Hearing Services, 2001) reported the percentages of users reporting specific problems with their aids. In the survey of over 4000 users by Dillon et al subjects reported an average of 0.9 problems per person. This would suggest that most people experience one problem, with a small number of subjects experiencing none or more than one. The percentage of respondents in the two surveys reporting particular problems are shown in Table 7.9. Table 7.9 Problems with hearing aids reported by subjects in two Australian surveys (Dillon et al, 1999; Office of Hearing Services, 2001) % reporting problem Dillon et al OHS Problem (1999) (2001) N = 4421 N = 1014 Quality of own voice sound 27.8 52 Whistling (feedback) 19.1 52 Adjusting controls 13.2 47 Shell or mould discomfort 12.4 30 Positioning or removing aid 8.7 43* Loud noises unbearable 6.1 20* *estimated from figure in report It can be seen that there are large difference between the numbers of people reporting the various problems in the two surveys. The reason for this are unclear but are interesting as, as discussed in Section 8.3, there was a very high incidence of user satisfaction reported in both surveys. In the Office of Hearing Services survey the numbers given are those reporting the problem some, most or all of the time; perhaps, due to phrasing or interpretation of the relevant question in the survey by Dillon et al, only those who experienced problems frequently would have responded. Also, in the survey by the Office of Hearing Services, under 30% of those who experienced problems had reported the problems to their practitioner. This may indicate that many of the reported problems in this survey were not serious, as suggested by the high overall rate of user satisfaction. 7.14 Summary The main points from the research reviewed here concerning usage of hearing aids are as follows: • There is no consistent relationship between amount of use of a hearing aid and hearing loss or age • There is some evidence that hearing aid usage declines after the age of 50 • Older people tend to use their aids selectively and intermittently 110
  • 111.
    111 • The longer the training programme the greater the usage of aids • The introduction of behind-the-ear aids increased usage • Digital aids are preferred to analogue aids • There is wide variation in the reported numbers of aids not used in different countries • Around one third of hearing aids owned in the UK are not used • Around one third of hearing aids owned by young people in the UK are not used • Around 12% of aids owned in the US are not used • There appears to be a high rate of usage of aids in Australia • Reasons for not using aids include poor performance, problems of noise, inadequate fitting and training, little benefit, poor fit and discomfort, stigma, defective aids, too high expectations, handling difficulties • A high proportion of hearing aid components become defective within a short time • Manipulating small hearing aids and their batteries presents problems for some people 7.15 Conclusions The research reviewed in this chapter has shown that, even when people own hearing aids, the amount of usage varies considerably. The problems of non-use and under- use of hearing aids have been recognised and researched for many years, and the same reasons for reduced use have been repeatedly cited in the literature. Yet there appears to have been little advance in addressing many of the issues, as the use of aids by their owners has not increased significantly over the years. Chapter 6 showed that, on average, only 25% of people in Europe who need a hearing aid own one. If only two thirds of hearing aid owners use their aids then only 1 in 6 people who would benefit from an aid are doing so. The research highlights the importance of good fitting and acclimatisation to aids. Without this the user will not appreciate the benefits of wearing aids and may stop wearing them; good fitting will aid acclimatisation to the aids leading to benefits (see Chapters 8 and 9) and hence continuing use. It is also important that users have realistic expectations of the advantages of wearing hearing aids as if expectations are met continuing use is likely; if a user’s expectations are not realised then the aids may cease to be used. Defects in hearing aids may be an important factor in non-use, and also cause anxiety and frustration for a hearing impaired person. Failure of an aid has serious consequences for the individual who has to spend time and possibly money in resolving the problem. There is therefore a need for the reliability of hearing aids to be as high as possible. The following two chapters show the high rates of satisfaction among hearing aid users and the benefit to listening and to overall quality of life that can accrue from wearing a hearing aid. It is therefore doubly important to address the reasons for 111
  • 112.
    112 irregular use toensure that those who need hearing aids obtain and wear them to achieve maximum benefit. 112
  • 113.
    113 CHAPTER 8 SATISFACTION WITH HEARING AIDS 8.1 Introduction Over the years there have been many studies into the benefits provided by hearing aids, in terms both of improvements to listening and more general quality of life issues. Some studies have investigated overall satisfaction with aids, or satisfaction in particular situations, whereas more recent studies have used a variety of scales to assess the impact of hearing aids on various aspects of life which contribute to overall quality of life. In assessments of the subjective outcome of hearing aid fitting in the past Cox (2003) reports that the emphasis has been on the importance of technical characteristics of outcome measures rather than non-technical issues. However, it is increasingly recognised that the latter may be more important in terms of the ultimate success of a hearing aid as the outcome of hearing aid fitting is multidimensional (Cox, 2003; Gatehouse et al, 2003). As Cox (2003) points out the reason why people seek hearing aids is because they cannot carry out daily activities as they want or cannot participate fully in family, social and cultural lives. It is therefore to be expected that the extent to which the wearing of a hearing aid improves their participation in such activities will have an important bearing on their overall opinion of the benefits provided. Cox (2003) lists seven categories of relevant subjective areas in which it is important to seek outcome data: satisfaction, quality of life, benefit, use, impact on others, activity limitations, participation restrictions. All of these issues are addressed in the studies reviewed in this and the following chapter. Some studies have investigated just one of these aspects while others have addressed several areas simultaneously. Table 8.1 lists the studies reviewed in this chapter and in Chapter 9 and indicates which of the following areas each addresses: satisfaction with aids, general quality of life issues, psychological functioning, social functioning, physical health, and benefits to listening. It can be seen a) that the majority of this work has been carried out in the United States, and b) that the majority of the research has been published since 1995. While overall satisfaction with hearing aids depends on a range of factors, reported benefits of hearing aids are also strongly influenced by listeners’ characteristics such as motivation, expectations and personality, and also the various auditory environments in which they are normally required to function (Gatehouse et al, 2003). This chapter reviews studies which have evaluated satisfaction with hearing aids, either overall or in relation to specific listening environments, and those which assess the benefits of hearing aids in terms of listening. 113
  • 114.
    114 Table 8.1 Studies reviewed in Chapters 8 and 9 Satis- Psych Social Listen Phys Scales Authors Date Country QoL faction func func benefit health used* Office of 2001/ HAUQ Hearing Australia X X 2002 SADL Services Thomas & Sp 1980 UK X Herbst Discrim Harless & 1982 USA X TSCS McConnell Dye & Many 1983 USA X Peak psych HHIE QDS Mulrow 1990a USA X SPMSQ et al GDS SELF HHIE Mulrow QDS 1990b USA X X et al SPMSQ GDS APHAB Crandell 1998 USA X? X X SIP SF-36 Bridges & GDS 1998 USA X? X Bentler SWLS Robilliard & 1996 Belgium X X Gillain Golabek et 1988 Poland X al Salomon 1988 Denmark X et al Kochkin & 2000 USA X Rogin Kochkin 2002 USA X X EQ 5D Joore et al 2003 Netherlands X X X SF 36 AI Cox et al 1996 X Dillon et al 1999 Australia X X HAUG Cox et al 1999 X APHAB * See text for definitions and descriptions of scales 114
  • 115.
    115 8.2 Scales for assessment of hearing aid benefits In the studies reviewed in this and the following chapter many different scales are used to assess benefits of, satisfaction with, and various aspects of functioning using hearing aids. Most of these scales, some of which are described in Appenmdix 3, have been developed specifically to assess these areas. Much of the work in the development of these scales has been carried out by Cox and colleagues (Cox and Rivera, 1992; Cox et al, 1999; Cox and Alexander 1999b, 2000, 2001). Other scales have been developed by Gatehouse (1999). Joore et al (2003) confirm that many of the scales used in the assessment of hearing aids are recognised examples of generic health related quality of life (HRQOL) questionnaires. 8.3 Overall satisfaction with hearing aids Salomon et al (1988), in a Danish study of the relationship between age and hearing difficulties asked 25 people aged 70 to 75 years, who had worn hearing aids for between 4 and 30 years (average 16 years), to rate their overall satisfaction with their hearing status. The results, related to usage of their aids, are shown in Table 8.2. Table 8.2 Numbers of subjects reporting satisfaction with hearing status and use of hearing aids (Salomon et al, 1988) Hearing aid use (N = 25) Hearing status 8-10 hr 1 – 7 hr Less than once Constant daily daily a week Very satisfied 4 1 1 Satisfied 8 2 2 Less satisfied 1 1 1 2 Dissatisfied 2 From Table 8.2 is can be seen that the majority of subjects (18 out of 25, or 72%) were satisfied or very satisfied with their aids, and that this was reflected in the amount of time the aids were used, as would be expected. A few years later Mulrow et al (1992) carried out a study to examine the long term benefits of hearing aids for elderly people (average age 72). All 162 subjects were tested 4 months, 8 months and 12 months after fitting. Use of aids and satisfaction reported at each test are shown in Table 8.3. Table 8.3 Use and satisfaction with hearing aids (data from Mulrow et al, 1992) Time after fitting 4 months 8 months 12 months % using HAs more than 4 90 83 76 hours daily % ‘very satisfied’ with aids 71 80 70 % ‘unsatisfied’ with aids 5 5 5 % ‘uncertain’ or ‘very 0 0 0 unsatisfied’ with aids It can be seen that after 12 months of use a small percentage remained unsatisfied with their aids while the large majority of subjects remained very satisfied. 115
  • 116.
    116 The subjects inthe study by Mulrow et al are of similar age to those in the study by Salomon, but have worn hearing aids for a shorter period. This may partly explain why the percentage of subjects ‘very satisfied’ with their aids is much higher in the study by Mulrow et al than in the one by Salomon et al. Also, all the subjects in the Mulrow et al study wore in-the-ear aids. Salomon et al do not specify the types of aids in their study but it is possible that some body worn aids were in use which may have affected user satisfaction. A group of slightly younger patients was studied by Robillard and Gillain (1996) in the early 1990s. The age range of subjects was predominantly 50 to 90, and most subjects were fitted with behind-the-ear aids. Approximately half the group had worn an aid for over a year. Of all subjects, 74% were generally satisfied with their aid, 10% were dissatisfied, and 3% had discarded their aid. Thus from the three studies above it appears that around 72% of subjects, on average, were satisfied or very satisfied with their hearing aids. A higher rate of satisfaction with aids was found in two nationwide studies in Australia. In a study of over 4000 hearing aid users (Dillon et al, 1999) 58% of wearers reported being ‘very satisfied’ with their aids and 40% ‘satisfied’. In addition, 92% reported being ‘very satisfied’ with the hearing aid service, and 8% ‘satisfied’. Another study, of over 1000 Australian users (Office of Hearing Services, 2001) showed similar high levels of satisfaction with both aids and practitioners. Results of this survey are shown in Table 8.4. Table 8.4 Satisfaction of respondents with hearing aids and practitioners in Australia (Office of Hearing Services, 2001) Percentage of respondents Very Very satisfied Satisfied Dissatisfied Not reported dissatisfied Hearing aid 43 46 7 2 3 Practitioner 74 23 2 1 1 In the recent study in the Netherlands by Joore et al (2003), 80 first time hearing aid users aged over 18, the majority of whom were fitted with behind-the-ear aids, were asked to rate their overall satisfaction with their aids approximately 6 weeks after fitting and 25 weeks after fitting. Satisfaction was rated on a three point scale: ‘very satisfied’ (3), ‘moderately satisfied’ (2) and ‘not satisfied’ (1). Overall satisfaction was high with an average score of 2.44 after 6 weeks and 2.54 after 25 weeks, implying that more people were ‘very satisfied’ at the second time of testing. The results of the Australian and Dutch studies, which were carried out around a decade after the earlier studies, suggest that satisfaction with hearing aids among users may be increasing. 8.4 Satisfaction and benefits in various listening situations It is now recognised that the cognitive abilities of listeners influence speech understanding and the auditory benefits of hearing aids (Gatehouse et al, 2003). 116
  • 117.
    117 However, in mostof the studies reviewed here this aspect of listening is not considered. An early study to assess the benefits of hearing aids was that of Thomas and Herbst (1980) who used speech discrimination tests with 211 subjects, 47% of whom had body worn aids, the reminder wearing post aural aids. It was found that 48% of the sample gained little or no benefit when listening to recorded speech, while more of those who used their aids ‘always’ or ‘often’ obtained some benefit. Obviously the amount of use and amount of benefit are related, as will be seen in other studies discussed. However, what is not known is whether those who obtain most benefit use their hearing aids more often as a result, or whether greater use of the aids leads the user to obtain more benefit. The amount of benefit recorded in this study is comparatively small and it must be noted that the performance of hearing aids in relation to listening to speech can be assumed to have improved in the 25 years since this study was carried out. A detailed study of the benefits of wearing hearing aids in normal living environments was undertaken by Golabek et al in Poland in 1988. A further aim of this study was to see if there were significant differences between people who worked and a non- working group. A total of 169 adults (average age 52) took part in the study, of whom approximately half were working (average age 40) and half were retired (average age 65). The questionnaire used was open ended in that subjects were asked to report all benefits of their hearing aids in order of importance. The number of benefits reported per patient ranged from one to nine with a mean of four. The most common, reported by over 20% of subjects are shown in Table 8.5. Table 8.5 Most common benefits reported by subjects in study by Golabek et al (1988) % subjects Benefit reporting Conversation at home 78.7 TV/radio 75.1 Conversation at work 43.2 Meetings 42.6 Shopping 38.5 Traffic 33.1 Church 29.0 Conversation in the street 24.3 Table 8.6 shows the most important benefits together with a weighted score indicating the importance of the benefit (1=lowest ranking, 5 = highest ranking) for the two groups of working and non-working subjects separately, indicating where there is a significant difference between the two groups. 117
  • 118.
    118 Table 8.6 Benefitsreported by working and retired subjects in study by Golabek et al (1988) Working group Non-working group (N = 83) (N = 86) No. % Score No. % Score Conversation at work* 66 79.5 4.7 7 8.1 4.9 Conversation at home 65 78.3 3.9 68 79.1 3.6 TV and radio 64 77.1 3.4 63 73.3 3.6 Meetings 36 43.4 3.3 36 41.9 2.8 Traffic 30 36.1 1.9 26 30.2 2.3 Shopping 26 31.3 2.1 39 45.3 3.9 Conversations in the street 20 24.1 2.2 21 24.4 2.2 Cinemas and theatre 20 24.1 2.1 12 13.9 2.7 Social gatherings 10 12.0 3.5 15 17.4 3.6 Church* 10 12.0 2.8 39 45.3 2.9 Conversation in offices* 6 7.2 2.3 15 17.4 2.9 Other forms of conversation 3 3.6 4.0 Doorbell, knocking at door 2 2.4 2.5 Embarrassment 2 2.4 1.5 Conversation with doctors 2 2.4 1.0 10 11.6 2.5 Other listening 1 1.2 1.0 Telephone bell 1 1.2 1.0 *significant difference between groups It can be seen that all subjects reported most benefit from their hearing aids in various types of conversation, while listening to radio or television, in church, and hearing traffic and warning signals. It was further found that the number of reported benefits in both groups was related to amount of use of the aids (being greater for regular users than for infrequent users) but not to degree of hearing loss. Similar benefits were reported by over 130 subjects in a Belgian study by Robillard and Gillain (1996). The majority of subjects were in the age range 60 to 90, and wore behind-the-ear aids. The authors also investigated differences between those fitted with monaural aids and those fitted binaurally. The percentages of subjects reporting satisfaction with their aids in different listening situations are shown in Table 8.7. There were no statistically significant differences in satisfaction between subjects with monaural and binaural aids. It can be seen from Table 8.7 that only about one third of subjects were satisfied with the performance of their aids in group situations. Dissatisfaction in this situation was high even among those with binaural aids, of whom half were dissatisfied in group situations. 118
  • 119.
    119 Table 8.7 Percentagesof subjects reporting satisfaction in various listening situations (Robillard and Gillain, 1996) % of Situation subjects In quiet environment 93 In front of television 77 Outdoors 69 Enhanced ability to localize sound 67 In large auditorium (conference, church, theatre) 51 Answering telephone 54 In group situation 38 An alternative method of assessing improvements to listening provided by hearing aids was used by Dillon et al in the large scale survey of hearing aid users in Australia described earlier (Dillon et al, 1999). In this study the Client Oriented Scale of Improvement (COSI) was used to investigate the most important listening needs of hearing aid users, and to quantify both the improvements provided by hearing aids and the final listening ability when wearing aids in 16 common listening situations. The assessment was carried out with 1770 subjects approximately 4 weeks after their hearing aid fitting. Most of the aids fitted were digital programmable aids. ‘Change’ is rated from 1 (worse) to 5 (much better); the ‘listening ability’ scale which assesses ability to hear in the 16 listening situations also ranges from 1 (hardly ever) to 5 (almost always). Table 8.8 shows, for each of the COSI listening situations, the percentage of subjects identifying it as a need, the average change scores, and the final listening ability score. The average change scores, and the final listening ability score have been estimated from histograms in the original paper. It can be seen from Table 8.8 that the most commonly mentioned need was listening to TV and/or radio, followed by conversation with one or two in quiet. The greatest changes in listening occurred for listening to TV/radio, hearing traffic and conversation with one or two in quiet. These three situations also score highest on the ‘final listening ability’ scale, plus listening in church or a meeting. The overall mean scores across all subjects and all 16 categories were 4.47 for change and 4.45 for final listening ability. 89% of subjects reported mean improvement ratings of ‘better’ or greater and 40% of ‘much better’. It appears from these results that users’ needs are being satisfied by their hearing aids. Furthermore, the scores are consistent with the high degree of user satisfaction found in this and the more recent Australian hearing aid survey (Office of Hearing Services, 2001). 119
  • 120.
    120 Table8.8 COSI listening situations, needs, change and ability scores (data from Dillon et al, 1999) Listening category % identifying Change Final listening need score* ability score* Conversation with 1 47.4 4.54 4.48 or 2 in quiet Conversation with 1 24.1 4.32 4.29 or 2 in noise Conversation with 31.9 4.36 4.3 group in quiet Conversation with 23.5 4.21 4.2 group in noise TV/radio at normal 74.8 4.68 4.71 volume Familiar speaker on 10.9 4.31 4.42 phone Unfamiliar speaker 5.0 4.22 4.43 on phone Hear telephone from 9.3 4.6 4.6 another room Hear front doorbell 1.8 4.51 4.31 or knocker Hear traffic 1.5 4.6 4.30 Increased social 1.8 4.46 4.44 contact Feel embarrassed 2.4 4.36 4.26 or stupid Feel left out 0.4 4.3 4.30 Feel upset or angry 0.6 3.9 4.11 Listening in church 19.8 4.51 4.56 or meeting Other 21.2 4.38 4.31 *estimated In the most recent survey discussed in this section, Kochkin (2002), in analysing responses from nearly 3000 hearing aid users in the US, reports both satisfaction and dissatisfaction with aids in various listening environments, as shown in Table 8.9. Kochkin also estimates that 11% of users are dissatisfied in all listening situations while 35% are satisfied in only 25% or less; and 25% of users are satisfied in over three quarters of listening situations. It is difficult to compare directly the results of the various surveys discussed in this section, owing to the disparate scales used, questions asked, and general methodologies employed. However, overall it would appear that hearing aids greatly improve listening for users in the majority of listening situations. In particular, they improve listening in some of the situations that are regarded as the most important, such as listening to TV or radio. However, there tends to be a lack of satisfaction when listening in group situations. 120
  • 121.
    121 Table8.9 Percentages of users satisfied and dissatisfied with their hearing aids in various listening situations (data from Kochkin, 2002) Percentage of users Dissatisfied Satisfied One to one 3 87 Listening to music 7 72 TV 11 68 Leisure activities 9 63 Small groups 14 62 Outdoors 13 59 Car 17 54 Places of worship 14 54 Workplace 11 47 Restaurant 25 43 Concert/movie 22 42 Telephone 30 41 Cell phone 30 27 Large group 44 26 8.5 Adaptation to hearing aids Salomon et al (1988) state that habituation towards amplification does not take place. However, there has been some discussion in the literature as to whether or not benefit from hearing aids in a noisy environment might increase over the first few months of use (Cox and Alexander 1992; Cox et al, 1996). An investigation into this aspect of hearing aid benefit was undertaken by Cox et al (1996) but results were inconclusive. The authors suggest that apparent increases in benefit after a longer period of time may be due solely to a progressive decline in unaided hearing. In a study aimed primarily at investigating the effect of hearing aids on health and physical functioning, Crandell (1998) also evaluated hearing aid benefit using the Abbreviated Profile of Hearing Aid Benefit (APHAB) scale (Cox and Alexander, 1995). The subjects were 20 elderly individuals (mean age 75) with mild to severe hearing loss, all of whom were new hearing aid users. The questionnaire was administered pre fitting, 3 months and 6 months after fitting. Crandell reports that, 3 months after fitting, the APHAB showed significant improvements with amplification in three of the four subscales: the Ease of Communication scale (21% improvement), Background Noise scale (23.1% improvement) and Reverberation scale (13.4% improvement). He does not however present any results concerning the assessment 6 months after fitting so it is possible that the lack of data concerning the 6 months assessment shows no further improvement or even a decline in improvement. No further improvement would be consistent with the findings of Cox and Alexander (1992) described above. 8.6 Effects of personality on hearing aid assessment As discussed earlier, it has become increasingly recognised in recent years that assessment of hearing aids involves many dimensions and that various psychosocial factors affect the perceived benefit provided by a hearing aid. Cox et al (1999) investigated the influence of a patient’s personality on their assessment of a hearing aid, and found several interesting effects. They used the APHAB and three 121
  • 122.
    122 psychological tests with83 subjects aged 60 to 89, most of whom were in their 70s, and almost all of whom had worn a hearing aid for over a year (25% for over 10 years). The psychological tests were used to establish extroversion/introversion; anxiety; and locus of control (that is, a person’s perception of whether what happens to them is due to their own actions (internal control) or to the actions of others or fate or chance (external control)). The results showed that there was a strong relationship between personality and ease of communication, the more extroverted patients tending to report more hearing aid benefit in all speech communication situations. Patients with more external locus of control tended to have more negative reactions to loud environmental sounds, both with and without amplification. The attitudes to problems also varied between extroverted and introverted subjects. There was a tendency for the more extrovert to report more problems when unaided, and fewer problems when aided, than more introverted subjects. There was only a limited relationship with anxiety although higher anxiety was related to more communication difficulties. However, people with external locus control found environmental sounds more unpleasant both with and without aids. There was also a significant relationship between age and aversiveness (that is negative reaction to sound) of amplified sounds – rather unexpectedly, older subjects reported less unpleasant reactions to amplified sounds than younger subjects. The authors give possible reasons for this such as older people being fitted with less powerful aids or having lower expectations than younger patients. Note that, in this case ‘younger’ refers to people in their 60s as all subjects were over the age of 60. Gender also had an effect, with men reporting more communication difficulty in noise than women and greater increase in ‘aversiveness’ after amplification than women. This may explain the finding by Smeeth et al (2002), discussed in Section 6.2.1, that men are more likely to own a hearing aid than women but women are more likely than men to use their aids. The conclusion of the study by Cox et al (1999) shows that, when using self assessment tools, it is important to remember that the results will reflect, to some extent, the psychological characteristics of subjects, independently of the quality and performance of their hearing aids and hearing aid fitting. 8.7 Summary The most important points arising from the work discussed in this chapter are summarised below: • Over 70% of hearing aid wearers are satisfied or very satisfied with their aids • Around 90% of hearing aid wearers in Australia are satisfied or very satisfied with their aids • Benefits of hearing aids are influenced by the user’s personality and psychological characteristics, and by their cognitive abilities 122
  • 123.
    123 • The perceived amount of benefit provided by an aid is related to the amount of use • The perceived amount of benefit provided by an aid is not related to the degree of hearing loss • The most common reported benefits tend to be in conversation in small groups and listening to radio or watching TV • The situation in which least benefit is obtained is conversations in groups 8.8 Conclusions The surveys reviewed in this chapter have found that there is a very high rate of satisfaction with their aids among hearing aid users, despite the problems with aids that were discussed in Chapter 7. This suggests that, if only non-owners and non- users could be persuaded to obtain aids and to use them regularly, they would perceive significant benefits to their listening in many of their day-to-day activities. This therefore provides further impetus for increasing the numbers of hearing aid owners and users around the world. 123
  • 124.
    124 CHAPTER 9 IMPACT OF HEARING AIDS ON OVERALL QUALITY OF LIFE 9.1 Introduction As discussed in Chapter 8, the overall impact of hearing aids on a user is a multidimensional issue involving many more factors than just improvements in listening. Many of these factors are, of course, an indirect result of the hearing benefits described in Chapter 8, but they also reflect improvements in various physical, social and psychological areas, all of which contribute to the overall quality of an individual’s life. This chapter reviews papers that have investigated these other aspects of the benefits of hearing aids. Some papers have considered individual aspects such as effects of hearing aids on psychological or physical health function, while others have used several tests simultaneously to examine quality of life issues in more detail. Also included in this review is the major study carried out in the United States by the National Council of the Aging in 1998 (National Council on the Aging, 1999; Kochkin and Rogin, 2000). 9.2 Psychological function Two relatively early papers published in the early 1980s (Harless & McConnell, 1982 and Dye & Peak, 1983) investigated the relationship between various psychological factors and hearing aid use. Harless & McConnell (1982) studied the issue of ‘self-concept’, or self-esteem, among hearing aid users by comparing a group of successful users with a matched hearing impaired group who had never worn aids. In total 86 subjects took part in the study, all over the age of sixty (mean age of the two groups was 69 years) and with mild to moderate hearing loss (average 44 dB). The groups answered two standard questionnaires on self concept and speech intelligibility, the aided group rating items on both scales as applicable when wearing their aids. Those with hearing aids were shown to have overall higher self esteem, scoring higher than the other group on subscales representing such dimensions as behaviour, self satisfaction and identity. Consistency of responses was also greater for the group with aids, indicating greater confidence and stronger self-image. In areas relating to personality such as maladjustment, personality disorder, and neurosis there was no difference between the groups. The hearing aid users also perceived themselves to have better communicative function than the other group. Correlation of the two questionnaires showed that those with greater communication efficiency had the higher self esteem. However, the results of this study could imply, as the authors suggest, that those who are willing to wear a hearing aid have higher self esteem before using aids than non-wearers. Dye and Peak (1983) took a different approach in exploring the relationship between severity of hearing loss to psychological functioning pre and post amplification. They gave 58 male subjects a battery of psychological tests, including assessments of mood, memory, and paranoia, on the day they were fitted with hearing aids and six weeks later, the tests being performed while wearing the aids. The subjects were divided into two groups – those with ‘more’ and ‘less’ severe hearing loss – based upon hearing thresholds and speech discrimination scores. In almost all tests, the more severely impaired group performed less well at both times of testing, being less alert 124
  • 125.
    125 to information fromtheir environment, less capable of remembering meaningful information, less capable of learning new tasks, more paranoid and more depressed than those with less severe hearing loss. Both groups showed improvements in scores over the six weeks after fitting. However, whereas there were significant differences between the two groups at fitting, the more severely impaired showed greater improvements afterwards resulting in no significant difference between the groups after six weeks. These results show that the use of hearing aids can go some way towards reversing deterioration in psychological functioning as a result of hearing impairment. It is therefore important that hearing loss is diagnosed and treated with hearing aids as soon as possible to prevent further psychological deterioration, particularly for those with more severe losses. 9.3 Physical health and functioning A study by Crandell in the mid 1990s aimed to examine the effects of amplification on physical health status, as few studies in this area had been carried out previously (Crandell, 1998). Crandell used two scales to assess health status, the Sickness Impact Profile (SIP), described in Appendix 3, and the Short Form-36 Health Survey (SF-36). The SIP is a 146 item standardised questionnaire designed to assess physical and psychosocial functioning. It consists of 12 subscales, some of which are grouped together to provide three main scales: physical, psychosocial and overall. The higher the SIP score, the greater the functional impairment. The SF-36 is a standardised form consisting of 11 questions. It includes eight multi- item sub scales (physical functioning, role limitations due to physical and/or emotional difficulties, social functioning, bodily pain, mental health, vitality, general health perceptions) each of which contain between two and ten items. The form also includes a single-item measure of reported health transition. The lower the total SF-36 score, the greater the functional impairment. There were 20 subjects in Crandell’s study, aged 65 to 91 years (mean 75 years), all with mild to severe hearing loss and no previous experience of using hearing aids. The questionnaires were administered to the subjects pre hearing aid fitting, 3 months after fitting and after 6 months of use. The mean SIP and SF-36 scores are shown in Table 9.1. It can be seen that there were significant reductions in SIP scores within three months of fitting, all three scores showing statistically significant decreases. There were no further improvements in the following three months. In the first three months there were improvements in all subscales except those for eating, body care/movement, ambulation and work. In contrast to the SIP scores there were no statistically significant differences in the overall SF-36 scores (or in any of the subscales) although they show a positive trend. There were also no differences in the overall health transition scale. 125
  • 126.
    126 Table 9.1 Mean SIP and SF-36 scores (Crandell, 1998) Hearing aid use Pre-fitting 3 months 6 months Total 14.8 9.1 8.9 SIP scale Physical 15.8 9.9 10.4 Psychosocial 21.3 11.8 11.0 SF-36 scale 95.2 95.3 97.3 These results suggest that the use of hearing aids can reduce functional health difficulties in elderly hearing impaired subjects after only three months use, although there is no further improvement after this time. Crandell purports that the health improvements occur because of the enhancement in communicative function. He observes that the SIP assesses behavioural consequences of physical health difficulties while the SF-36 is more indicative of objective health problems. It could therefore be that the wearing of hearing aids leads to an improved perception of health, rather than actual physiological manifestations. 9.4 Overall quality of life The first major study to investigate the impact of hearing aids on overall quality of life was carried out by Mulrow and colleagues in the late 1980s (Mulrow et al 1990a, 1990b, 1992). The scales used in this study, which are briefly described in Appendix 3, are listed below. • Hearing Handicap Inventory for the Elderly (HHIE) 25-item questionnaire scored from 0 to 100 that assesses emotional and social effects of hearing loss • Quantified Denver Scale of Communication Function (QDS) 25-item questionnaire scored from 0 to 100 that assesses perceived communication difficulties due to hearing loss • Short Portable Mental Health Status Questionnaire (SPMSQ) 10-item scale scored from 0 to 10 that assesses cognitive function • Geriatric Depression Scale (GDS) 15-item scale scored from 0 to 15 that is used to indicate depression • Self Evaluation of life Function (SELF) 54-item global scale scored from 54 to 216 that assesses six areas of functioning: physical disability, social satisfaction, symptoms of aging, depression, self-esteem, personal control. For all the scales used, a higher score indicates greater dysfunction. The HHIE and QDS scales are specific to hearing loss, while the other scales are generic quality of life measures. The initial study (Mulrow et al 1990a) involved a group of nearly 200 hearing impaired subjects aged 64 and over (mean age 72), none of whom were hearing aid users. The subjects were divided into two groups, one of which was fitted with hearing aid immediately, while the other group was placed on a waiting list and fitted with an aid after 4 months. The battery of tests was administered to all subjects at the start of the project (baseline), and after 4 months. This enabled the test scores of the group with hearing aids to be evaluated 4 months after fitting, and to be compared 126
  • 127.
    127 with a matchedcontrol group who were not wearing hearing aids. Table 9.2 shows the scores of both groups at baseline and after 4 months. Table 9.2 Quality of life scores for group wearing hearing aids (HA) and waiting list group (WL) at baseline and after 4 months (Mulrow et al, 1990a) Baseline After 4 months HA group WL group HA group WL group HHIE 48.7 51.2 14.7 51.2 QDS 58.7 61.0 35.7 62.2 SPMSQ 0.47 0.18 0.29 0.28 GDS 3.1 3.5 2.6 3.8 SELF 92.7 95.6 92.0 96.8 There were no statistically significant differences between groups at baseline on any of the quality of life measures except the mental health status questionnaire (the hearing aid group being slightly worse). The table shows that, while there was no change in the quality of life measures for the group without hearing aids, the scores on all scales for the group with hearing aids improved after four months of wearing aids. The HHIE and QDS scales were also administered to both groups six weeks after fitting. Whereas at baseline there was no difference in the two scores between the groups, after six weeks the group with aids had scores similar to those at the four month testing, while the scores for the other group remained roughly constant throughout the four month period. This shows that improvements occurred in the first six weeks of use, after which there was no further change. Family members in 162 cases were also asked to assess improvements in social and communication function after six weeks. Marked improvements were reported by the subjects with hearing aids and their families, compared with the waiting list group. This study therefore showed that hearing aids can reverse social, emotional and communication dysfunctions caused by hearing impairment, and lead to improvements in cognition and mood. Furthermore, the benefits are experienced as early as six weeks after fitting of aids. At the end of the first project subjects in the waiting list group were fitted with aids and all subjects, where possible, were followed up four months, eight months and twelve months after fitting (Mulrow et al 1992). All tests except the SELF scale were used at each assessment. The scores for all 162 subjects who completed all tests are shown in Table 9.3. Table 9.3 Quality of life scores for subjects wearing hearing aids at intervals after fitting (Mulrow et al, 1992) Baseline 4 months 8 months 12 months HHIE 50.6 21.3 20.6 23.3 QDS 60.8 41.9 40.3 39.9 SPMSQ 0.4 0.3 0.3 0.4 GDS 3.5 2.8 2.8 2.7 127
  • 128.
    128 The table showsstatistically significant improvements in all measures from baseline to four months, the greatest improvements being for the social, emotional and communication measures (HHIE, QDS, GDS). The scores remain approximately stable for the rest of the period of testing. Thus it appears that psychosocial improvements to quality of life occur in the first few months after being fitted with hearing aids, and are sustained over a one year period. The authors do comment that, as their subjects were elderly and retired, the findings may not be generally applicable to other populations of hearing aid users. Nevertheless the results do strongly suggest that hearing aids play an important role in improving the quality of life of elderly hearing impaired individuals. Bridges and Bentler (1998) attempted to examine not only the effects of hearing aids on well being and satisfaction with life, but also whether their impact was related to the amount of use. The quality of life assessment they used was shorter than in other studies, consisting of the Geriatric Depression Scale (GDS) (as in the studies by Mulrow et al described above) and the Satisfaction with Life Scale (SWLS). The version of the GDS used by Bridges and Bentler consisted of 30 items, a score above 11-15 suggesting a need for further evaluation for clinical depression. The SWLS is a 5-item self-report questionnaire which indicates subjective well being. The assessment is based on an overall judgement of life, rather than specific areas or points in time. Each item is scored from 1 (strongly disagree) to 7 (strongly agree) so that higher scores indicate greater satisfaction with life. The average score of elderly people completing the SWLS is typically 25.8. Responses of 251 elderly people (mean age 74.2 years) were analysed, just over half the group (51.4%) having a hearing loss although only 29.5% said they had ever worn an aid. Of those who had ever worn an aid around 73% reported successful use. Table 9.4 shows the ages and quality of life scores of various categories of subjects. Table 9.4 Ages, GDS and SWLS scores related to hearing loss and hearing aid use (Bridges and Bentler, 1998) Mean GDS Mean SWLS Subject groups Mean age score score All subjects 74.2 5.4 25.3 With hearing loss 76.6 6.1 25.0 No hearing loss 71.8 4.6 25.6 Has worn hearing aid 77.4 5.8 25.3 Has not worn hearing aid 72.9 5.2 25.2 Has worn aid but does not 76.3 7.8 23.4 wear successfully now Now wears aid 77.9 5.1 26.1 successfully Now wears aid but not 73.3 5.5 25.0 successfully The authors found, as in other studies of the effects of hearing loss on quality of life, that subjects with hearing loss were in general older, suffered more depression and were slightly less satisfied with life (although this difference was not statistically significant) than those without. Subjects who had worn hearing aids were older and 128
  • 129.
    129 scored higher onboth scales (not significantly) than those who had not. Among those who had previously worn an aid there was significantly less depression for those who reported success than for those who did not. Successful users, both past and current, were more satisfied with life than unsuccessful users and tended to have less depression. However, it should be noted that, although there was some evidence of a relationship between hearing aid use and depression, all the GDS scores were well below the levels indicating serious depression. 9.5 Improvements in particular aspects of quality of life Some surveys have investigated how use of hearing aids has had an impact on particular areas of day to day life which affect overall quality of life. Kochkin (2002), in reporting results of the MarkeTrak VI survey, found that, of 1764 hearing aids users, 66% reported improvement in their overall quality of life due to their hearing aids. The percentages reporting improvements in specific areas are shown in Table 9.5. The table shows that hearing aids have had beneficial effects in several areas, the most reported improvements being to users’ social lives and ability to join in groups, and on family relationships. These are areas that are particularly adversely affected by hearing loss, as reported in Chapter 5. Table 9.6 Percentages of hearing aid wearers reporting improvements in various aspects of quality of life (Kochkin, 2002) % reporting Area improvement Social life 51 Ability to join in groups 50 Relationships at home 49 Feelings about self 46 Confidence in self 43 Sense of safety 43 Relationships at work 39 Sense of independence 39 Mental/emotional health 36 Mental ability 31 Physical health 22 Two major surveys investigating similar issues in detail were carried out in Australia in 2001 (Office of Hearing Services, 2001) and in the US in 1998 (Kochkin and Rogin, 2000), for the National Council on the Aging (NCOA). Both studies were large, the Australian study involving over 1000 respondents and the American one almost 4000, and both were nationwide. In both studies the average age of subjects was in the early 70s. A major difference between the two studies is that the Australian study consisted of a survey of hearing aid users only, whereas the American study involved hearing aid users, their families, and a control group of hearing impaired non-users of aids. 129
  • 130.
    130 9.5.1 Australian Officeof Hearing Services survey The large scale study of approximately 1000 hearing aid users in Australia used the Satisfaction with Amplification in Daily Life (SADL) scale devised by Cox and Alexander (1999; 2001) to measure the overall satisfaction of people with their hearing aids. The scale is based upon 15 questions related to four different areas: positive effect, service and cost, negative features and personal image. Responses to questions within these categories are based upon a seven point scale, from 'not at all' to 'tremendously'. Scores (from 1 to 7) are calculated for each of the four domains and an overall global score is also calculated. In the Australian study the question on cost was omitted, as recommended by Cox and Alexander (1999), as it was not relevant. The domain and global scores are shown in Table 9.7 where they are compared with US norms published by Cox and Alexander (1999). (The numbers are the numbers of respondents with valid scores for each subscale.) Table 9.7 Comparison of Australian and US SADL scores (Office of Hearing Services, 2001; Cox and Alexander, 1999) Australia (2001) USA (1999) Number Mean Number Mean Global 813 5.27 44 4.9 Positive effect 953 4.98 257 4.9 Service 835 5.7 101 5.4 Negative features 940 4.74 256 3.6 Personal image 953 5.86 103 5.6 It can be seen that in the Australian survey respondents reported relatively high levels of satisfaction in all areas, with higher levels of satisfaction in all domains than the US figures. The domain and global scores in the Australian study were analysed with reference to hearing loss, age, and experience with aids. The mean global score was found to increase with hearing loss up to 75 dB HL, when a slight decrease was observed. This suggests that satisfaction with hearing aids is higher the greater the hearing loss, except for those with severe hearing loss. Return clients were found to have slightly higher SADL scores in all areas than new clients; this is reported to possibly reflect greater familiarity of return clients with their hearing aids. There was relatively little difference in the global score across the age groups although the score for the younger age group (21 to 54 years) was very slightly lower than that for the higher age groups (5.1 compared with 5.3). This difference is mainly due to slightly lower scores for 'personal image’ and ‘negative features’ among the lower age group. The percentages of respondents giving each score for each question are shown in Table 9.8. It can be seen that in all areas the majority of respondents are ‘considerably’, ‘greatly’ or ‘tremendously’ satisfied with their aids and the impact on their lives. 9.5.2 US National Council on the Aging survey This American study (Kochkin and Rogin, 2000) comprised a very extensive investigation into the impact of hearing aids on physical, emotional, mental and social well-being. In total nearly 4000 people were surveyed, 2069 hearing impaired 130
  • 131.
    131 individuals from across the United States and 1710 of their family members. In the analysis presented by Kochkin and Rogin (2000) five categories of hearing loss are used. Matched groups of hearing impaired users and non-users in each category were identified. The paper reports and analyses many of the effects of hearing loss, comparing users and non-users of hearing aids, and also analyses the responses of family members. Hearing impaired respondents completed questionnaires consisting of over 300 questions while the questionnaires of the family members comprised 150 questions. Table 9.8 Responses to all questions on SADL scale (data from Office of Hearing Services, 2001) Response Not at A Some- Med- Consid Tremen- Not Greatly all little what ium -rably dously stated Aids help 2 5 6 12 30 23 16 6 understanding Purchase was in 2 4 5 4 19 27 35 5 best interests Aids reduce asking Positive effect 7 11 10 8 26 22 9 7 for repetition Aids worth trouble 4 4 4 5 19 27 32 5 Aids improve self 13 10 9 8 18 21 14 7 confidence Natural sound 2 4 7 26 25 19 9 10 Competence of 1 0 1 2 13 25 52 6 provider Service & cost Dependability of 9 4 3 7 17 26 19 15 aids Pick up sounds 26 23 16 7 9 7 4 7 Feedback 44 16 10 6 6 4 3 11 Negative features Help with 26 11 6 13 13 11 4 17 telephones Seem less capable 76 7 4 2 2 1 0 8 with aids Personal image Others notice loss 48 16 10 6 5 4 2 9 when wearing aids Appearance of aid 5 4 5 11 19 30 18 7 Hearing ability was self assessed using the five minute hearing test of the American Academy of Otolaryngology-Head and Neck Surgery, which has been shown to be significantly correlated with standard audiological measures of hearing. Based upon these subjective measures of hearing, subjects were divided into 5 quintiles from Quintile 1 representing the 20% of subjects with the least severe hearing loss to Quintile 5 consisting of the 20% of subjects with the most severe loss. The categories correspond to mild/moderate; moderate; moderate/severe; severe; and severe/profound hearing loss. The numbers and the average ages of users and non-users in each quintile are shown in Table 9.9. 131
  • 132.
    132 Table 9.9 Numbersand ages of subjects in NCOA survey (Kochkin and Rogin, 2000) Quintile 1 Quintile 2 Quintile 3 Quintile 4 Quintile 5 Non Non Non Non Non User User User User User user user user user user No. HI subjects 74 336 147 247 208 226 281 136 327 86 No. family members 63 253 125 207 168 184 237 122 280 71 Age of HI subjects 75.2 70.4 73.6 71.3 72.9 71.7 72.6 72.5 74.3 72.9 Hearing aid users and non-users were compared across the hearing categories in the following areas: activity level (participation in solitary and social activities); interpersonal relationships; social effects (including stigma, over compensation for hearing loss, difficulty in communication; sociability); emotional effects (including anger and frustration, anxiety, emotional instability, denial); personality assessment (including cognitive state, introversion, locus of control); and health impact (including arthritis, heart problems, high blood pressure). Respondents and their families were also asked to rate changes which they believed were due to using hearing aids in 16 areas of their lives. Key results from the study are summarised below. Activity level Participation in activities was assessed by asking how many times a month subjects engaged in 13 different activities, six of which were solitary (eg reading, gardening) while seven involved others (eg attending church or sports). There was little difference between users and non-users in participation in solitary activities. However, users were more likely to engage in activities involving other people. Non- users with severe hearing loss participated least in all social activities specified. Interpersonal relationships Personal relationships were assessed by 12 questions concerning quality of relationships within the family (eg how much can you relax around them) and 12 concerning negativity (eg arguments, criticism) in the relationships. For both groups interpersonal warmth declined as hearing loss got worse, but in each hearing loss category users had greater warmth in relationships than non-users. In all hearing loss categories hearing aid users showed less negativity than non-users, although the differences were not significant among those with more severe loss. Social effects The social impact of hearing loss and hearing aid use was assessed by 47 items in the survey. Among non-users stigma increased across the hearing loss quintiles while it was significantly lower and relatively constant among users. The authors suggest that this could be due to hearing aid users having resolved their concerns about the stigma attached to hearing aids. The high stigma scores for non-users are likely to be a reason why they do not use aids. As hearing loss increases both groups compensate for their loss, for example by lip reading or attempting to conceal their impairment, and the extent to which this occurs increases with the severity of the loss. However, in all hearing loss categories non- users compensated significantly more than users. Safety concerns increased as hearing loss increased for all respondents. However, in the three lower hearing loss 132
  • 133.
    133 groups users showedgreater concerns with safety than non-users, whereas there was no difference between the users and non-users with more severe hearing loss. This may reflect the personality differences between those who do and do not wear aids for milder loss, or may indicate that users tend to have experiences that make them worry about safety; alternatively it could reflect the reasons why some people choose to wear hearing aids in the first place. Sociability was evaluated by assessing phone contact and meetings with family and friends and showed little difference between the two groups. Hearing aid use also appeared not to affect issues such as negative effects on the families of hearing impaired people, adapting to the individual’s hearing loss, and rejection of, or withdrawal by, the hearing impaired person. Emotional effects Emotional effects were assessed by 80 items in the questionnaire. Many aspects of emotional life were found to be improved by the wearing of hearing aids in most of the hearing loss categories, including anger (less anger and frustration displayed by users), depression (fewer symptoms of depression among users), anxiety (fewer symptoms of anxiety among users) paranoia (fewer feelings of paranoia among users) and phobias (users less likely to exhibit social phobias). Reduction in anxiety and phobias with hearing aids was more pronounced among the subjects with the most severe hearing impairment. Furthermore, the survey showed that, among both users and non-users, emotional instability, anger, depression and paranoia all increased with the severity of the hearing loss. Denial of hearing loss was very much more prevalent among non-users than users, as would be expected, but decreased with increased severity of hearing loss. Emotional factors that were not affected by hearing aids included sense of independence, experience of traumas and overall satisfaction with life. This latter finding is surprising in view of the other studies, discussed above, in which hearing aids were found to improve satisfaction with life. However, it is not known how the questions relating to this aspect were phrased and scored, so it is possible that it does not measure the same characteristic as in the previous studies. Personality In addition to personality traits assessed by the scales on emotional effects, 79 further items were used to assess personality. Family members were of the view that the hearing impaired individual’s cognitive state decreased with increased hearing loss. However, those without aids were perceived by their families to be more confused, disorientated, arrogant or inattentive than hearing aid users. Family perceptions of introversion were also related to hearing loss, those with greater losses being more introverted than the less severely impaired, although users of hearing aids were perceived to be less introverted than non-users. Health Health status was assessed by six questions, by asking respondents to indicate whether they suffered from specific health problems, and by overall assessments of health. In every hearing category users scored higher on the overall assessment of health than non- users, although for both groups overall health scores decreased with increased hearing loss. 133
  • 134.
    134 In most hearingcategories there was higher incidence of arthritis, high blood pressure and heart problems among non-users than users of hearing aids, although this was not consistent for all conditions across all categories. The differences could reflect a tendency for people who are visiting a doctor or hospital for some condition other than hearing impairment to have their loss diagnosed and treated. Perceived changes in life due to hearing aid use The percentages of users and their families reporting improvements in various aspects of their lives, with the users divided into groups of ‘milder’ and ‘more severe’ loss are shown in Table 9.10. The numbers are those who rated the improvement due to hearing aids to be between ‘somewhat’ and ‘a lot’ better. Table 9.10 Percentages of users and family members reporting improvements Percentages reporting improvement All Milder loss More severe loss Users Family Users Family Users Family Relationships at home 56 66 44 59 60 68 Feelings about self 50 60 40 54 53 61 Life overall 48 62 33 53 53 64 Relations with children 40 52 28 44 43 53 and grandchildren Self-confidence 39 46 28 35 42 48 Mental health 36 39 29 37 38 35 Willing to participate in 34 44 23 33 37 47 group activities Sense of 34 39 27 30 36 41 independence Sense of safety 34 37 25 32 37 38 Ability to play 31 47 25 39 33 49 card/board games Social life 34 41 27 28 36 45 Physical health 21 24 21 21 21 25 Dependence on others 22 31 17 26 24 32 Relations at work 26 43 19 37 28 45 Ability to play sports 7 10 8 11 7 9 Sex life 8 N/A 4 N/A 9 N/A When the data for each hearing loss quartile is examined it can be seen that, in most categories, there is a consistent increase in the percentage reporting improvement as the hearing loss increases. This is reflected in the higher scores for those with more severe loss in every category shown in Table 9.10. The most striking improvements were among those with the most severe hearing loss; for quintile 5 the top six categories in Table 9.10 were rated as improved by at least 50% of users, and 10 categories by at least 50% of family members. It can be seen from the table that people with mild or severe hearing loss report significant improvements in many aspects of their lives due to the wearing of hearing aids. The most widely reported improvements were in family relationships, self esteem, mental health, and life overall, Overall, the results of this important study show that the wearing of hearing aids has a beneficial impact on social, emotional, psychological and physical well being. It is 134
  • 135.
    135 not possible todirectly attribute the beneficial effects to the wearing of hearing aids; it may be that hearing aids are sought by the more well balanced, healthy and emotionally stable members of the hearing impaired community. Nevertheless, the results are consistent with those of the smaller studies described above and provide powerful evidence that hearing aids are associated with improvements in many areas which contribute to the quality of life. 9.6 Summary From the studies reviewed in this chapter the key points regarding the impact of hearing aids on quality of life, together with their sources, are summarised below. • Hearing impaired people with aids have greater self confidence, stronger self- image and better communicative function resulting in overall higher self esteem than those without aids (Harless and McConnell, 1982). • Among elderly hearing impaired people there are no differences in personality between hearing aid users and non-users (Dye and Peak, 1983). • Hearing aids help to reduce deterioration in psychological functioning as a result of hearing impairment (Dye and Peak, 1983). • Hearing aids help to reduce functional health difficulties in elderly hearing impaired subjects, improvements taking place in the first three months of use (Crandell, 1998). • Hearing aids can reverse social, emotional and communication dysfunctions caused by hearing impairment (Mulrow et al, 1990a). • Psychosocial improvements to quality of life occur in the first few weeks after being fitted with hearing aids, and are sustained over a one year period (Mulrow et al, 1990a, 1990b). • Successful hearing aid users are more satisfied with life than unsuccessful users and tend to have less depression (Bridges and Bentler, 1998). • Hearing aids improve overall quality of life for most users (Kochkin, 2002). • The areas where hearing aids have the most beneficial effects are in users’ social lives and taking part in group activities, and family relationships (Kochkin, 2002). • The majority of hearing aid users in Australia are very satisfied with their aids and the impact they have on their lives (Office of Hearing Services, 2001). • Hearing aid users in Australia exhibit higher levels of satisfaction with quality of life than those in the US (Office of Hearing Services, 2001). • Satisfaction with hearing aids is higher the greater the hearing loss, except for those with severe hearing loss (Office of Hearing Services, 2001). • Satisfaction with hearing aids does not depend on age (Office of Hearing Services, 2001). • Hearing aid users are more likely than non-users to engage in activities involving other people (Kochkin and Rogin, 2000). • Hearing aid users have greater warmth and less negativity in personal relationships than non-users (Kochkin and Rogin, 2000). • Perceptions of stigma attached to wearing hearing aids are higher among non- users than users of hearing aids (Kochkin and Rogin, 2000). • Non-users of hearing aids are more likely to disguise their hearing loss than users (Kochkin and Rogin, 2000). 135
  • 136.
    136 • Hearing aid users are more concerned about safety than non-users (Kochkin and Rogin, 2000). • Hearing aids improve most aspects of emotional life (Kochkin and Rogin, 2000). • Denial of hearing loss is more prevalent among non-users than users of hearing aids (Kochkin and Rogin, 2000). • Hearing aid users are perceived by their families to have better cognitive functioning than non-users and to be less introverted (Kochkin and Rogin, 2000). • Hearing aid users have greater overall health status than non-users (Kochkin and Rogin, 2000). • Benefits to day to day life as a result of wearing hearing aids, in particular improvements in family relationships, self esteem, mental health and overall, are greatest among those with the most severe hearing loss (Kochkin and Rogin, 2000). 9.7 Conclusions This chapter has shown that there is overwhelming evidence that the use of hearing aids causes significant improvement to the quality of life of hearing impaired people. The use of hearing aids benefits many aspects of people’s lives, having a positive effect upon their social, emotional, psychological and physical well being, and many of their day to day activities. In most areas the benefits occur early on in the wearing of aids, in some cases within a few weeks of fitting, and are then sustained throughout the period of wearing aids. The outstanding aspect of the research in this area is that the results of all the different studies are remarkably consistent. This is despite the many differences in methodologies employed, such as sizes and types of subject groups, different assessment techniques and scales, use of subjective and objective data, and comparisons with control groups in some studies and not in others. However, it must be noted that almost all the studies concerned groups of elderly hearing aid users; as in the previous chapters, there is a notable lack of evidence concerning the use and impact of hearing aids on younger age groups. This is likely to be a reason for the overwhelming consistency of results between studies. In view of the increasing prevalence of hearing impairment among younger age groups, it is essential that this area is addressed and that similar research to that described in this chapter is carried out with younger subjects. There has been much discussion in earlier chapters about the stigma attached to hearing impairment because of its association with ageing. The hearing research community itself and the hearing aid industry are in some ways perpetuating this perception through failing to address the concerns of younger people; in reviewing the literature the impression obtained is that hearing loss is an impairment experienced by only elderly individuals. 136
  • 137.
    137 CHAPTER 10 STUDIES OF COSTS OF HEARING IMPAIRMENT 10.1 Introduction This chapter reviews studies of the costs of hearing impairment that may be relevant to the evaluation of the societal costs in Europe of hearing impairment. No comprehensive studies evaluating the costs of hearing loss in general have been carried out. The paucity of information on the costs of hearing impairment is commented upon in several of the papers that have been reviewed (Mohr el al, 2000b; Joore et al, 2003). Thus no papers have been found that are directly applicable to the current project but within the few published papers on costs, there are some concepts and methods that may be applicable to the evaluation of the costs of hearing impairment in general. In this chapter different methods used in the studies reviewed are outlined, and the studies of interest described. 10.2 Methods of evaluating the costs of hearing impairment and interventions Although there is very little work on the costs of hearing impairment in general, there is a relatively large body of literature concerning the cost effectiveness of cochlear implants. This is usually evaluated using a method of cost benefit analysis that could possibly be adapted to the evaluation of hearing loss in general (see reviews in Cheng and Niparko, 1999; Niparko et al, 2000; Wong et al, 2000). Further studies have attempted to cost other aspects of deafness (Mohr el al, 2000b; Ruben, 2001; Keren et al, 2002; Joore et al, 2003). However, the most detailed and rigorous of these studies is concerned only with the costs of severe to profound deafness (Mohr el al, 2000b), although it suggests a possible approach to the evaluation of the socio-economic costs of less severe hearing loss. Another report which suggests a method of evaluating hearing loss gives an evaluation of the costs to the UK of new noise at work legislation (Health and Safety Executive, 2003). It is possible that some of the concepts and methods used in these studies may be applicable to the evaluation of the costs of hearing impairment in general. 10.2.1 Cost utility analysis A method that has commonly been used in the past ten years for evaluating the cost effectiveness of cochlear implants is that of cost utility analysis. This method is increasingly used for evaluating and comparing the societal costs of various medical interventions. It is particularly appropriate for evaluating interventions which have little effect upon survival or longevity, but enhance the quality of life following the intervention. Cost utility analysis is based upon the concepts of health utility and quality adjusted life years (QALYs). Health utility is a factor between 0 and 1 which represents a subjective evaluation of a person’s quality or life or state of health. On the health utility scale 0 corresponds to death and 1 to perfect health. QALYs are calculated as the number of years in a particular health state, multiplied by the health utility of that state. Thus, for example, ten years at a health utility of 0.5 or five years at a health utility of 1.00 would both be equivalent to five QALYs. 137
  • 138.
    138 The cost utilityof an intervention is evaluated by calculating the cost utility ratio, that is the ratio of the total costs associated with the intervention to the net benefit in QALYs arising from the intervention. In the case of cochlear implants the total costs include costs of diagnosis and evaluation, surgery, rehabilitation, maintenance of the implants etc., while the benefits (expressed as QALYs) may reflect changes in physical function, bodily discomfort, social function and mental health. Improvement in quality of life resulting from an intervention decreases the cost incurred per QALY. The lower the cost per QALY, or the greater the number of QALYs obtained at a given cost, the greater the cost effectiveness of the treatment. In the studies of cost utility analysis of cochlear implants described below, various recognised and standardised methods have been used to evaluate the QALYs provided by implants. To obtain the health utility indices associated with health states pre and post implantation, health related questionnaires or visual analogue scales are generally used. These may result directly in a health utility index between 0 and 1, or in a score which is then translated into the equivalent value on the health utility scale. The concept in these studies of assigning health utility indices to the quality of life before and after implantation suggests a possible method of evaluating hearing loss. This idea is explored further in Chapter 12, where the method is used in a calculation of the costs of hearing impairment in Europe. 10.2.2 Monetary costings Other studies have provided direct monetary values to various socio-economic costs of hearing impairment, for example loss of earnings and medical costs, either on an individual or total population basis. However, these studies do not include any evaluation of the social and psychological aspects of hearing impairment. In assigning monetary values the costs obtained from previous studies or reports are generally updated to the current year using some recognised indicator such as (in the USA) increase in Consumer Price Index over the intervening period. Where lifetime costs are considered, future costs are discounted to the ‘net present value’, again using a recognised factor, for example the inflation adjusted return on long term investment bonds. 10.2.3 Incidence/prevalence based studies Two different approaches, either incidence or prevalence based, can be taken in evaluating the costs associated with a medical condition or cost effectiveness of medical interventions. In an incidence based approach the number of new cases of a condition in a given year is determined. The lifetime costs associated with each case, which will depend on the severity of the case and age of onset, are then evaluated. In a prevalence based approach the number of people experiencing a particular condition in a given year are estimated and the total costs of the condition for that year are evaluated. 138
  • 139.
    139 10.3 Cost utilityanalysis of cochlear implants In the past ten years there have been several studies of the cost effectiveness of cochlear implants in both adults and children. This section is concerned only with those studies involving adults. As cochlear implants affect the quality of life but do not extend life, the method commonly used is cost utility analysis. These studies therefore quantify, by means of a health utility value, the quality of life before and after implantation. A meta analysis of nine previous studies (Cheng and Niparko, 1999; Niparko, 2000) shows that the results are remarkably consistent, particularly in assigning a value to the loss in health utility experienced before implantation, that is, as a result of profound deafness. The studies reviewed by Cheng and Niparko (1999) were published between 1995 and 1999, and included different methods of assessing the health indices pre and post implantation. Most of these studies were carried out in the UK or USA; a more recently published study in Hong Kong (Wong et al, 2000) showed similar results. In pooling the results of nine studies, involving a total of 619 subjects, Cheng and Niparko (1999) calculated the health utility of profoundly deaf adults without cochlear implants to be 0.54, that is profound deafness resulted in an average loss of health utility of 0.46. (The average gain in health utility following implantation was 0.26, resulting in a health utility value of 0.8 with cochlear implants.) The health utility losses in each of the studies considered by Cheng and Niparko (1999) are shown in Table 10.1. Table 10.1 Loss in health utility from profound deafness in adults (Cheng and Niparko, 1999) Study Patients No of Health patients utility loss Palmer et al, 1999 Implant 40 -0.42 Palmer et al, 1999 No implant 14 -0.42 Wyatt et al, 1996 No implant 32 -0.41 Wyatt & Niparko, 1995 Implant 229 -0.47 Summerfield & Marshall, 1995 Implant 105 -0.63 Summerfield & Marshall, 1995 Implant 103 -0.42 Summerfield & Marshall, 1995 No implant 52 -0.41 Summerfield & Marshall, 1995 No implant 37 -0.38 Harris et al, 1995 Implant 7 -0.36 Overall 619 -0.46 More recent studies by Summerfield et al (2002) have also found a loss in health utility of approximately 0.44 prior to cochlear implantation. However, when the scores were adjusted to overcome the possibility of other conditions contributing to health utility loss, an average loss of 0.26 was obtained for profoundly deaf people who get no benefit from hearing aids. The adjustment of scores in this way has not been considered in any other studies. 139
  • 140.
    140 10.4 Societal costsof moderate hearing impairment The only study to address the socio-economic benefits of hearing rehabilitation of moderately impaired people is that of Joore et al (2003) (the ‘Maastricht study’). This study considered those aspects of hearing aid fitting and benefits which have an economic impact: changes in health related quality of life; effects on social functioning; productivity in paid and unpaid labour; and use of medical services. However, although these factors were assessed using various scales and questionnaire data, the results were not translated into monetary costs. The authors decided against the use of a health utility index in their assessments as they did not consider it valid in this case owing to the clustering together of all sensory problems. Of the 80 Dutch subjects involved in the study only 10 were in paid employment. The results suggest that hearing aids may improve the situation at work for some moderately hearing impaired individuals, thereby reducing productivity losses. However, as discussed by the authors, the number of subjects is too small for firm conclusions to be drawn. With regard to medical costs, the results presented suggest that following hearing aid fitting, numbers of visits to medical practitioners decreased; however the authors report that following fitting use of medical services remained relatively stable. Although a health utilities approach was not used in this study, the authors do tabulate among their results a ‘hearing-specific health state valuation’, rated on a visual analogue scale from 0 to 100. However, this item is not mentioned or discussed in the paper. The tabulated values of the mean score are 52.00 before hearing aid fitting (n = 80); 77.14 six weeks after initial fitting (n = 77); and 78.00 approximately six months after fitting (n = 80). To be consistent with the cochlear implant studies, these scores could be translated into a health utility index of 0.52 before hearing aid fitting and 0.78 after fitting. It can be seen that there is close agreement with the average health utility values of 0.54 and 0.8 before and after cochlear implantation, determined by Cheng and Niparko (1999). In both cases the gain in health utility is 0.26 following hearing rehabilitation. There therefore seems to be some similarity in health utility scores, and gains following rehabilitation, between profound and moderate deafness. 10.5 Monetary costs of hearing impairment There have been some recent evaluations of the costs to society, in dollars, of hearing loss in the USA. The most detailed evaluation of the total costs to society caused by hearing impairment is that carried out by Mohr et al (2000b), which considered the costs of severe to profound hearing loss in the USA. Other studies have been carried out by Ruben (2001) and Keren et al (2002). All three studies have included the costs of some or all of the following factors in their calculations: unemployment, underemployment or lost productivity (Ruben, 2001; Keren et al, 2002; Mohr et al, 2000b); special education (Ruben, 2001; Keren et al, 2002; Mohr et al, 2000b); vocational rehabilitation (Keren et al, 2002; Mohr et al, 2000b); and assistive devices and medical costs (Keren et al, 2002; Mohr et al, 2000b). 140
  • 141.
    141 10.5.1 The costsof communication disorders (Ruben, 2001) Ruben (2001) considered the costs to the US economy of different types of communication disorder. He shows that the US economy relies increasingly on communication based (rather than manual) employment, particularly in urban areas. Thus the losses to the economy caused by disorders of hearing, voice, speech and language have an increasingly significant impact. Ruben tabulates the prevalence of these disorders in the US, together with the unemployment rates in the various categories (1997 data), as shown in Table 10.2. Table 10.2 Employment and unemployment rates and communication disorders Employed Unemployed Condition Number No. % No. % Working age population with 138,142,000 103,330,26 74.8 34,811,780 25.2 employment and without disability With non-severe disability 16,497,000 12,224,277 74.1 4,272,723 25.9 With severe disability 14,392,000 3,669,960 25.5 10,722,040 74.5 Difficulty hearing 5,837,000 3,759,028 64.4 2,077,972 35.6 Unable to hear 430,000 216,700 50.4 213,280 47.6 Difficulty in speaking 1,520,000 492,480 32.4 1,027,520 67.6 understandably Unable to speak understandably 172,000 41,968 24.4 130,032 75.6 Total communication disorders 7,959,000 4,510,196 56.7 3,448,804 43.3 Ruben also presents data to show that communication disorders are more prevalent among the lower social classes, both in the US and UK, thus establishing a further relationship between hearing and other problems and economic status. Comparing the economic status of hearing impaired people with that of disabled people in general, Ruben shows that income for hearing impaired people is 40% to 45% of that of the non-hearing impaired population (in Chapter 11 it is argued that the current figure is probably higher than this) whereas for people with disabilities of all kinds income is 85% of that of the non-disabled population. Table 10.2 shows that 43.3% of people with communication disorders are unemployed, compared with 25.9% of those with non-severe disabilities. Ruben also presents data which show that low income is more common among people with hearing or speech impairments than in the rest of the population, as can be seen from Table 10.3. Table 10.3 US income level from 1994 to 1995 for persons aged 22 to 64 Income level (%) Disability Low Middle High None 16.7 63.7 19.6 Any 30.4 58.4 11.2 Not severe 19.3 64.9 15.9 Difficulty hearing normal conversation 24.7 61.3 14.0 Inability to hear normal conversation 21.4 60.0 18.6 Difficulty having speech understood 43.7 48.1 8.2 141
  • 142.
    142 Table 10.3 showsthat 21.4% to 43.7% of persons with communication disorders are in the lowest income group, compared with 19.3% of those with non-severe disabilities. An example of the relative incomes of the hearing impaired and general populations in California in 1983 can be seen in Table 10.4. Table 10.4 Family income in California related to severity of hearing loss in 1983 Median income $ General population 21,479 Hearing impaired 11,738 Unilateral 12,907 Ruben uses the data presented to calculate (in 1999 US$) the economic impact of communication disorders, as shown in Table 10.5. However, there is some inconsistency among the figures presented, and an apparent error. Furthermore it is not made clear whether or how the costs have been inflated to 1999 values. Table 10.5 Economic impact of communication disorders (1999 US$) 5% prevalence 10% prevalence Education 0 – 18 31,700,000,000 63,400,000,000 Unemployed 79,500,000,000 Underemployed 43,100,000,000 Total employment 122,600,000,000 Total employment + education 154,300,000,000 186,000,000,000 Ruben thus estimates the costs to the US economy to be between $154.3 and $186 billion per year, that is 2.5% to 3% of the 1999 GNP. He further predicts that a shortage of skilled workers will cause a 5% drop in the growth rate of the GNP. Amelioration of communication disorders would contribute significantly to meeting the demand for skilled workers and thus assist in adding to the US GNP. As a corollary, the increasing need for communication skills in the 21st century means that people with communication disorders are becoming increasingly unemployable, more so than people with other disorders. Thus there is an urgent need for rehabilitation of those with communication disorders. The other two studies discussed in this section calculate lifetime costs associated with deafness. 10.5.2 Cost effectiveness of newborn screening (Keren et al, 2002) The study by Keren et al (2002), which analyses the cost effectiveness of statewide universal newborn hearing screening, was the first such study to include lifetime societal costs of deafness. In order to determine the cost effectiveness of early diagnosis and intervention the authors compare the lifetime societal costs of congenital deafness for a deaf child with normal language (resulting from early intervention) and delayed language. The lifetime costs in the two cases are shown in Table 10.6. The costs were adjusted to 2001 US dollars using the appropriate components of the US Consumer Price Index. 142
  • 143.
    143 Table 10.6 Comparisonof societal lifetime costs for deaf children with delayed and normal language (2001 US$) Delayed Normal language language Lost productivity 486,100 121,500 Special education 549,600 493,700 Vocational rehabilitation 12,500 3,100 Assistive devices and medical costs 79,100 79,100 Total 1,126,300 697,500 This study thus shows that early diagnosis and intervention is cost saving in the long term. However, the authors point out that a limitation of the study is the lack of consideration of the long term social and psychological benefits of normal communication for deaf children and adults, which would be captured using a quality of life approach. 10.5.3 Societal costs of severe to profound hearing impairment (Mohr et al, 2000b) The most comprehensive study to evaluate the costs to society of hearing impairment is that by Mohr et al (2000b), in which the societal costs of severe to profound hearing impairment were calculated. The authors estimated that severe to profound hearing loss in the USA costs society $297,000 over the lifetime of an individual. Most of these costs are due to reduced work productivity, although special education for children contributes an additional 21%. For those with prelingual onset of deafness the lifetime costs exceed $1 million. In calculating the costs Mohr et al included direct medical (diagnosis, medical visits associated with hearing loss, audiological testing, fitting of hearing aids, costs associated with other assistive devices) and non medical (special education and rehabilitation) costs, and indirect productivity costs (reduction of lifetime earnings). Costs were inflated to 1998 dollars using the Urban Consumer Price Index, future costs were discounted at a rate of 3%, the inflation adjusted return on long term treasury bonds. The authors used an incidence based approach, considering five different age cohorts in their calculations. Table 10.7 shows their estimate of the number of incident cases in 1991. Table 10.7 Estimate of incident cases in 1991 (calculated from 1990/1 NHIS and US Census 1991) Age cohort Synthetic incidence No of incident Distribution by (rate per 10,000 pop) cases age cohort (%) 0-2 1.4 1,638 11 3-17 0.03 167 1 18-44 0.2 2,524 16 45-64 1.1 5,216 34 65+ 1.9 5,897 38 Total 0.6 15,442 100 143
  • 144.
    144 Using data fromvarious sources the authors derive estimates for the costs of the different components in their analysis, as shown in Table 10.8. Table 10.8 Lifetime costs of severe to profound HL by component Absolute and relative costs of various components Age Lost Special Vocational Assistive Total cohort productivity education rehabilitation devices, costs medical etc 0-2 Cost $ 433,400 504,900 11,500 70,200 1,020,000 % of total 42 50 1 7 100 3-17 Cost $ 444,300 401,000 12,600 61,100 919,000 % of total 48 44 1 7 100 18-44 Cost $ 382,900 20,200 6,700 43,200 453,000 % of total 85 4 1 10 100 45-64 Cost $ 220,300 0 1,800 30,900 253,000 % of total 87 0 1 12 100 65+ Cost $ 24,600 0 0 18,400 43,000 % of total 57 0 0 43 100 To arrive at an average figure, the total costs for each age group are weighted according to the relative incidence for that age group shown in Table 10.7. The conclusion is that, averaged across age of onset, severe to profound hearing loss is expected to cost society an additional $297,000 over the lifetime of an individual. The magnitude of the cost is directly related to age of onset, as would be expected. Table 10.8 shows that the largest component of societal lifetime costs (67%) is due to reduced productivity. People who experience severe to profound hearing loss before retirement age lose between $220,000 and $440,000 in earnings over their working life, depending on when the onset of hearing loss occurs. The table also shows that, apart from the over 65 age group, medical costs are a relatively small proportion of the total. The authors show how their estimate of the lifetime cost of profound hearing loss compares with that of other conditions, see Table 10.9 (all figures represent 1998 costs). It can be seen that, calculated in this way using a human capital approach, hearing loss is one of the most expensive conditions. Table 10.9 Lifetime costs of various conditions (data taken from Mohr et al, 2000b) Cost Condition (1998 US$) Accidents with firearms 89,100 Near drowning 98,500 Strokes 129,200 25 year costs for young woman with 130,500 rheumatoid arthritis Epilepsy among non-institutionalised persons 172,900 with frequent seizures Schizophrenia 295,000 Severe to profound hearing loss 297,000 Family where member has multiple sclerosis 593,000 144
  • 145.
    145 The authors pointout that a limitation of their study is that by adopting a human capital approach, heavy emphasis is placed on earnings potential and intangible losses such as social isolation and psychological stress are not accounted for. Among elderly people who represent nearly 40% of new cases (see Table 10.7), the total costs are therefore especially undervalued; although hearing loss significantly reduces their quality of life the implications in terms of earnings or medical costs are relatively minor. 10.5.4 Costs of deafness caused by noise at work A slightly different approach, which incorporates an aspect of quality of life evaluation in estimating remaining lifetime costs, has been used by the UK Health and Safety Executive (HSE) in calculating the cost to industry of introducing new noise at work legislation. A new European Directive concerning noise at work was published in February 2003 (European Commission, 2003). In anticipation of the Directive the Health Directorate of the HSE carried out a regulatory impact assessment to determine the cost to industry of implementing the Directive in the UK (HSE, 2003). This would require more stringent Noise at Work Regulations than those currently in force in the UK. The main changes to the regulations would be a lowering of the noise levels at which hearing protection must be worn. In calculating the resultant costs to industry the HSE estimated the monetary worth of different levels of hearing loss. The costs were calculated in 2000/1 prices over a 10 year period, the base year for appraisal being 2000/1. In arriving at 10 year cost figures earnings were assumed to rise by 1.8% per year in real terms (based on the observed increase of the economy over the past 25 years). Costs and benefits were discounted using the UK Treasury recommended discount rate of 3.5%. Health benefits were assumed to increase in value by 2% per year in line with the annual increase in real GDP per capita. Estimates were made of the numbers of people currently exposed to different levels of noise in industry, and the median hearing loss associated with each level after 10 years’ exposure. The HSE also estimated the percentages of the population with 30 dB and 50 dB HL after 40 years’ exposure to various levels. The HSE used a QALY approach to evaluate hearing loss, using information from the Department of Health and Social Security to quantify the loss in QALY for differing degrees of hearing loss, see Table 10.10. The monetary value of the loss was based upon the assumption that a full quality life year has a value of £42,000. This is the UK Department of Transport road safety estimate of the value per year of preventing a fatality (VPF), which includes loss of earnings as well as an allowance for pain and suffering. The monetary values associated with varying hearing losses are also shown in Table 10.10. 145
  • 146.
    146 Table10.10 Reduction in quality of life and corresponding value of hearing loss Reduction in QoL Hearing loss Value % dB £ 10 50 4,200 5 30 2,100 2.5 20-30 1,050 1 15-20 420 0.25 10-15 105 0 <10 0 It can be seen that the assumed reduction in quality of life is very much less than that found in the other studies reviewed above. This is presumably based upon the amount of compensation awarded to sufferers of noise induced hearing loss, in relation to other industrial injuries, and will therefore underrepresent the true reduction of quality of life due to hearing loss. The report goes on to evaluate the total costs over the remaining working life of an individual. Assumptions are made about the relationships between years of noise exposure, remaining years of work and severity of hearing loss, to give the resultant monetary values of hearing loss over the remaining working life of an individual. In these calculations values are discounted to present value, and are shown in Table 10.11. Table 10.11 Monetary values of hearing loss over remaining working life Hearing loss Value dB £ 50 96,000 30 48,000 20-30 24,000 15-20 9,6000 10-15 2,400 <10 0 In view of the fact that the assumed reductions in quality of life are so much smaller than those found in studies of the impact of hearing loss, these figures are likely to be underestimates. However, the HSE report suggests a possible method for approaching the evaluation of hearing loss in general, as discussed further in Chapter 12. 10.6 Discussion It has been shown that there are few studies in which the economic costs of hearing impairment have been addressed. The most detailed study is that by Mohr et al (2000b), but this refers only to people with severe to profound deafness. Joore et al (2003) attempted to address the costs of moderate hearing impairment but their study was limited by a relatively small number of subjects of whom only ten were in employment; furthermore no monetary costs are reported in their paper. Other authors have examined a particular aspect of hearing loss, for example the cost effectiveness of neonatal screening (Keren et al, 2002) or the economic impact of a range of 146
  • 147.
    147 communication disorders (Ruben,2001); however neither of these studies includes any discussion of psychosocial effects of hearing impairment. It is recognised (Keren et al, 2002; Mohr et al, 2000b) that the lack of consideration of psychosocial effects may lead to an underestimation of the costs of hearing impairment. This is especially true in the case of elderly people for whom psychosocial effects may be considerable yet for whom the costs of lost productivity and medical costs are not high relative to other age groups. An assessment by the Health and Safety Executive in the UK (HSE, 2003) evaluated noise due to industrial hearing loss in the UK. Although the reduction in quality of life due to hearing loss is significantly underestimated in this analysis, the report suggests a quality of life approach that may be appropriate to the evaluation of hearing impairment in general. Health utility indices to assess quality of life are commonly used in the analysis of the cost effectiveness of cochlear implants in many studies. The health utility scores reported in these studies could also be of use in the evaluation of the costs of hearing impairment. 10.7 Conclusions A comprehensive literature review has revealed that there have been no previous studies of the socio-economic costs of hearing loss which can be directly applied to the evaluation of the costs of hearing impairment in Europe. However, the literature suggests some methods of evaluating hearing loss which it is thought could usefully be applied to the European hearing loss data presented elsewhere in this report, in order to give an estimate of the costs to Europe of varying degrees of hearing impairment. The monetary cost studies reviewed in this chapter showed that loss of earnings were a major component of the overall costs of hearing impairment. The next chapter reviews data on employment and underemployment, and relative earnings of hearing and hearing impaired people. The methods discussed in this chapter are used with the data from the next chapter in an evaluation of the costs of hearing impairment in Chapter 12. 147
  • 148.
    148 CHAPTER 11 EMPLOYMENT, EARNINGS AND DISCRIMINATION AT WORK 11.1 Introduction The studies on costs of hearing impairment reviewed in the preceding chapter showed that, in economic terms, the value of lost earnings/lost productivity is a major component of the total cost to society of hearing disorders. In this chapter information relating to the impact of hearing impairment on employment is presented. This includes data on the incidence of unemployment or underemployment among deaf and hard of hearing people, plus some information on typical earnings of hearing impaired people. There is also discussion of discrimination experienced by hearing impaired people while at work. Most of the data in this chapter is from studies carried out in the UK by the RNID, or from American surveys, but, given the consistency of the data from the two countries it is assumed that the results would be applicable to Europe. 11.2 Employment and unemployment rates of hearing impaired people In the relatively early study by Thomas and Herbst (1980) of the social impact of hearing impairment among people of working age, no difference was found in employment rates between the hearing impaired and control subjects. (Problems at work were evident among the hearing impaired subjects, as discussed further in Section 11.6.) However, there is now a significant amount of more recent data to show that a greater proportion of deaf and hard of hearing people is unemployed than of the hearing population. Furthermore among those who are employed, a higher percentage of hearing impaired people than of the general workforce are in the lower grades of employment 11.2.1 Unemployment in the US Two of the studies in the preceding chapter included details of employment and unemployment rates of hearing impaired people in the US. A major study of the impact of severe to profound hearing impairment was carried out in the US in the late 1990s (Mohr et al, 2000a, 2000b). The grade of hearing was based upon self-reported data; Mohr et al estimate that, in this context, ‘severe to profound’ hearing loss corresponds to a better ear hearing loss of over 70 dB. It was found that people with severe to profound hearing loss earn 50 - 70 % of their non- hearing impaired peers and lose between $220,000 and $440,000 in earnings over their working life, depending on when their hearing loss occurs. The labour force participation rates of severe to profoundly hearing impaired persons and of the non- hearing impaired population, in three age groups, are shown in Table 11.1 (figures taken from (Mohr et al, 2000b) based upon an analysis of 1990/1 data. 148
  • 149.
    149 Table 11.1Comparison of labour participation rate in severe to profoundly hearing impaired and non-hearing impaired (Mohr et al, 2000b) Severe to profoundly Non-hearing impaired hearing impaired Age Sample Percentage Sample Percentage size employed size employed 18-44 149 59 97737 77 45-64 273 49 45299 68 65 and over 851 7 28443 13 From figures in Table 11.1 it is possible to calculate the percentages of all those of working age (18 to 64 years) who are employed, as shown in Table 11.2. Table 11.2 Labour participation rate in severe to profoundly hearing impaired and non-hearing impaired people of working age Severe to profoundly Non-hearing impaired hearing impaired Age Sample Percentage Sample Percentage size employed size employed 18-64 422 53 97737 74 The study by Ruben (2001) into the economic impact of communication disorders detailed the employment and unemployment rates of people with various types of communication disorder, including hearing impairment. The table of Ruben’s data from Chapter 10 is reproduced here as Table 11.3. Table 11.3 Employment and unemployment rates and communication disorders (Ruben, 2001) Employed Unemployed Condition Number No. % No. % Working age population with 138,142,000 103,330,26 74.8 34,811,780 25.2 employment and without disability With non-severe disability 16,497,000 12,224,277 74.1 4,272,723 25.9 With severe disability 14,392,000 3,669,960 25.5 10,722,040 74.5 Difficulty hearing 5,837,000 3,759,028 64.4 2,077,972 35.6 Unable to hear 430,000 216,700 50.4 213,280 47.6 Difficulty in speaking 1,520,000 492,480 32.4 1,027,520 67.6 understandably Unable to speak understandably 172,000 41,968 24.4 130,032 75.6 Total communication disorders 7,959,000 4,510,196 56.7 3,448,804 43.3 From this table it is possible to calculate the percentages of people with any form of hearing impairment who are employed and unemployed, as shown in Table 11.4. Table 11.4 Employment and unemployment rates of hearing impaired people Employed Unemployed Condition Number No. % No. % Difficulty hearing 5,837,000 3,759,028 64.4 2,077,972 35.6 Unable to hear 430,000 216,700 50.4 213,280 47.6 Any hearing impairment 6,267,000 3,975,728 63.4 2,291,252 36.6 149
  • 150.
    150 In his analysisof data from the 1994 National Health Interview Survey (NHIS), O'Neill (1999) found that labour force participation rates of the working age population (18 - 64 years of age) with hearing loss (67%) were lower for this group than for non-hearing impaired people (75%). In Table 11.5 the figures extrapolated from the data of Mohr et al (2000b) and Ruben (2001) are compared with those of O’Neill (1999). Table 11.5 Employment rates of people with and without hearing impairment Degree of hearing impairment Profound/ Any None severe O’Neill (1999) 67 75 Mohr et al (2000b) 53 74 Ruben (2001) 63.4 50.4 74.8 Table 11.5 shows good agreement between the three studies, with on average 65% of hearing impaired people being in employment, compared with 75% of the general population. For those with severe to profound hearing loss, around 52% are in employment. 11.2.2 Unemployment in Europe The major source of literature on levels of employment and unemployment among hearing impaired people is Europe is provided by the RNID in the UK. The major part of this section concerns data arising from a survey carried out by the RNID in 1999 (RNID, 2000; Bradshaw, 2002). As stated above, in the 1980 UK study of the impact of hearing impairment by Thomas and Herbst, no evidence was found of increased levels of unemployment among hearing impaired people. However more recently the RNID surveys of its members (RNID, 2000; Bradshaw, 2002) plus official government statistics, have shown that there are significantly higher rates of unemployment among hearing impaired people than among the general working age population, and that the difference is increasing. In the earlier report (RNID, 2000) the RNID quotes figures from the UK Government Labour Force Surveys which show that in 1999 the overall level of unemployment amongst deaf and hard of hearing people was 15% compared with 6% of the hearing population. More significantly, 22% of hearing impaired people between the ages of 25 and 45, were unemployed. That is, when most of the hearing population is at its most economically active, a deaf or hard of hearing person is four times more likely to be unemployed than a hearing person. Furthermore, according to government statistics, in 1997 and 1998 a deaf or hard of hearing person was twice as likely to be unemployed as a hearing person. This suggests that the gap between the proportion of deaf and hard of hearing people in work and the rest of the population is widening. In 2002 the results of a comprehensive survey of RNID members aged 16 to 64, carried out in 1999, were published. The figures relating to unemployment in this survey were higher than those derived from government statistics. However, as pointed out in the report, the majority of the 1099 respondents were profoundly deaf 150
  • 151.
    151 so the datamay not be representative of the hearing impaired population as a whole. The main findings concerning unemployment rates are as follows. (Note that ‘unemployment rate’ is defined as the percentage of those who are economically active, rather than of the whole sample.) • The unemployment rate of all respondents was 19% (compared with 5% of the non-disabled population and 10% for disabled people). • Of those unemployed, 57% had been unemployed for over a year and 20% for over 20 years. • Deaf people from ethnic groups or with other disabilities experienced even higher levels of unemployment, as did people who were profoundly or severely deaf. • The unemployment rate for deaf people from ethnic groups was 28%, compared with 18% for the rest of the sample. • The unemployment rate for deaf people with other disabilities was 32%, compared with 16% for the rest of the sample. • The unemployment rate for profoundly or severely deaf people was 20% compared with 12% for the rest of the sample. • The unemployment rate for sign language users was slightly higher (21%) than for those with English or another spoken language as their first language (18%). • The high levels of unemployment are despite the fact that the survey population was more highly qualified (33% with higher qualifications) than the general working population (23% with higher qualifications). Overall, of the 1099 respondents to the survey 668 (61%) were in employment; 122 (11%) were students and 309 (28%) were unemployed. In the RNID report, as in Government statistics, a distinction is made between those who are unemployed and looking for work (and therefore considered ‘economically active’) and those who are unemployed and not seeking work. In the summary of the results presented here this distinction is not made. Table 11.6 shows the numbers and percentages of respondents of different employment status classified by age. Table 11.6 Employment status classified by age (RNID, 2002) Age Employment status Under 25 25-54 55-65 N % N % N % In work 59 34 539 69 56 46 In education/training 78 45 35 4 3 2 Unemployed 35 20 204 26 64 52 The respondents are also categorised according to their own description of the severity of their hearing loss. Employment status according to degree of hearing loss is shown in Table 11.7. As can be seen, the categories are not mutually exclusive. Nevertheless there is a clear indication that the greater the degree of deafness the higher the unemployment rate. ‘Deafened’ refers to people who have lost their hearing as an adult relatively suddenly. It can be seen that this group also experiences a high rate of unemployment. 151
  • 152.
    152 Table 11.7 Employment status according to degree of hearing loss Degree of hearing loss Economic activity Hard of Deaf with Profound Severe Deafened hearing tinnitus No % No % No % No % No % Employed 448 59 100 63 45 70 26 58 55 59 In education/training 88 12 18 11 4 6 6 13 7 7 Unemployed 219 29 41 26 15 23 13 29 31 33 Total respondents 755 159 64 45 93 It is possible from the data in Table 11.7 to calculate the percentages of people with all degrees of hearing loss, and with severe to profound hearing loss, who are employed for comparison with the US data presented in the preceding section. Considering all degrees of hearing impairment, 61% are employed, which is lower than the US figures shown in Table 11.5. However, of those with severe to profound hearing loss 60% are in employment, which is higher than the comparable figures from the US. These differences, plus the similarity between the RNID figures for all hearing impairment and severe/profound impairment, suggest that, as stated in the RNID report, the overall data is not representative of the hearing impaired population as a whole. 11.3 Underemployment In addition to higher rates of unemployment among hearing impaired people than among the hearing population, it also appears that those in employment tend to be in the lower skill jobs. This is reflected in the average earnings of hearing impaired people, which are discussed in the next section. Capella (2003) reviews work showing that deaf and hard of hearing people are overly concentrated in ‘blue-collar’ positions and significantly underrepresented in professional, managerial and technical occupations. In the 1994 NHIS data in the US, analysed by O’Neill (1999), approximately 13% of hearing impaired workers aged 51 to 61 reported that hearing loss limited the type or amount of paid work carried out. Workers with hearing loss were more likely than those without to list their occupation as farming, craft and repair, machine operator or transportation and less likely to cite administrative, professional, service, or sales. Ruben (2001) showed that in the year 2000, in the US, 62% of the total labour force worked in ‘white collar’ jobs, based upon communication of some sort, while 37% were in farming or ‘blue-collar’ employment. He presents tables showing the percentages of men and women with and without hearing disorders across the social classes in America. This data was acquired from a survey of over 8000 people aged 33 and is shown Table 11.8. 152
  • 153.
    153 Table 11.8Percentages of men and women across US social classes (Ruben, 2001) Hearing I, II III, not manual III, manual IV, V impairment M F M F M F M F None 41 33 13 32 31 8 15 22 Some 34 31 12 29 34 9 17 25 Handicap 23 28 9 34 40 8 25 20 In the UK data from the 1999 RNID survey was analysed (Bradshaw, 2002) to examine the type of work undertake by deaf and hard of hearing people. Table 11.9 shows a breakdown of the respondents’ occupation types, using UK Government classifications. Table 11.9 Occupation types of respondents to RNID survey (Bradshaw, 2002) Occupational group No % Professional 72 11 Intermediate 167 26 Skilled (non-manual) 158 25 Skilled (manual) 100 15 Partly skilled 89 14 Unskilled 57 9 Total respondents 643 100 It is possible to reanalyse the data provided in Table 11.8 to give approximate overall data for any degree of hearing loss, as shown in Table 11.10, in order to compare it directly with the RNID data. This has been done by recalculating the percentages as percentages of those in the labour force, assuming equal numbers of men and women in the sample, and equal numbers of those with ‘some’ hearing impairment and with a ‘handicap’. Table 11.10 Overall percentages of employed people in US across social classes Hearing Social class impairment I, II III, not manual III, manual IV, V None 38 24 20 19 Some 34 22 23 22 Handicap 26 22 25 23 Any HI 30 22 24 23 Assuming the US social class categories correspond to the occupational groups listed in Table 11.9 the US and UK data can be directly compared as shown in Table 11. Table 11.11 Comparison of US and UK data on types of employment of hearing impaired people Social class Occupational group US UK (US) (UK) % % I, II Professional/Intermediate 30 37 III (non-manual) Skilled (non-manual) 22 25 III (manual) Skilled (manual) 24 15 IV, V Partly skilled/unskilled 23 23 153
  • 154.
    154 The data forthe US and UK show a very similar pattern, especially considering that the US figures are necessarily approximate in the absence of the original data set. A possible further reason why higher percentages of people in the UK survey than in the US are in ‘white-collar’ employment is that the educational level of the sample in the RNID was high. The results suggest that in general around 30% of hearing impaired people are in ‘white-collar’ work, compared with around 38% of the general population (Ruben, 2001). 11.4 Earnings A consequence of the differential in types of employment between hearing and hearing impaired people discussed above is that hearing impaired people in general earn less than their hearing peers. There is a small amount of data to confirm this, again mainly from studies carried out in the US and UK. Capella (2003) showed that, even among groups with similar education level, in the 1990s deaf and hard of hearing adults earned substantially less than hearing workers. Capella cites work by Mowry (1988) which found that, even after rehabilitation, deaf people earned on average 19% and hard of hearing people 8.5% less than others in the same occupational category. A study of the General Labour Force data in the US showed that over twenty occupations including agriculture, clerical, management, professional, sales and service, deaf and hard of hearing workers earned 83% and 84% respectively of the average median earnings. The income of full time and part time employees in the 1999 RNID survey of people of working age (RNID, 2002; Bradshaw, 2002) was analysed. Full time earnings are shown in Table 11.12. At the time of the survey the national minimum wage in the UK was £3.60 per hour, equivalent to £126 per week for a 35 hour week, with 1.1% of full time employees earning below this. Table 11.12 Weekly income of RNID survey respondents working full time Weekly income £ Male Female Total N % N % N % <50 4 2 5 2.5 9 2 50-99 1 1 5 2.5 6 2 100-149 12 6 26 13 38 10 150-199 30 16 42 21 72 19 200-299 68 36 74 38 142 37 300-399 37 20 26 13 63 16 400-499 19 10 7 4 26 7 >=500 16 9 11 6 27 7 Total respondents 187 100 196 100 383 100 Table 11.12 shows that 4% of full time employees in the survey earned less than £100 per week, while approximately 8% earned less than the minimum wage. Thus respondents were approximately seven times more likely than the national average to be earning less than the minimum wage. In the general population at this time, 11.8% earned less than £10,000 per year; Table 11.12 shows that 61% of the sample earned less than £15,600 per year and around 154
  • 155.
    155 25% earned lessthan £10,000. Respondents were far less likely than then the general population to be in a higher income bracket. At the time of the survey around 27% of the general population earned more than £460 per week, while the table shows roughly 10% of the sample earned this amount. The study by Mohr et al discussed in Chapter 10 took account of earnings of severe to profoundly deaf people in estimating the costs to society of deafness. Table 11.13 shows the mean monthly earnings of people with severe to profound hearing loss compared with the hearing population for the year 1990-91. Table 11.13 Comparison of mean monthly earnings of severe to profoundly hearing impaired and non-hearing impaired people (Mohr et al 2000b) Severe to profoundly HI earnings as Non-hearing impaired Age hearing impaired % of non HI Number Earnings $ Number Earnings $ 18-44 90 1301 75244 1930 67% 45-64 137 2044 30727 2357 87% 65 and over 59 969 3720 3720 77% Combining the age ranges 18-44 and 45-64 gives the figures shown in Table 11.14 for people of working age. Table 11.14 Mean monthly earnings of severe to profoundly hearing impaired and non-hearing impaired people of working age Severe to profoundly Non-hearing impaired HI earnings as hearing impaired % of non HI Age Number Earnings $ Number Earnings $ 18-64 227 1749 105971 2054 85 Table 11.14 shows that the earnings of severe to profoundly deaf people are approximately 85% of those who are not hearing impaired. This figure is consistent with the figures of 83% and 84% given by Capella (2003) for deaf and hard of hearing people in the twenty occupations considered. Ruben (2001) presents data from California, dating from 1983, which compares the median income of hearing impaired people with the general population, see Table 11.15. Table 11.15 Family income in California related to severity of hearing loss in 1983 Median income $ General population 21,479 Hearing impaired 11,738 Unilateral 12,907 This table shows a much wider discrepancy between the earnings of hearing impaired people and the general population, but it is difficult to interpret the data without further information. Also, the figures quoted are median values rather than mean values. However, as the data is considerably older than the other figures quoted, it may no longer be applicable. As pointed out by Capella (2003), although earnings of 155
  • 156.
    156 hearing impaired peopleare still well below those of other workers, in recent years post secondary education has been shown to have a positive effect on earning of deaf and hard of hearing adults. Therefore the discrepancy between the earnings of the two groups could have reduced since the California data was published. 11.5 Retirement In discussing employment and earnings of hearing impaired people, the possibility of hearing impairment and its effects as possible reasons for early retirement, and the implications of early retirement need to be considered. The only discussion of issues relating to retirement was found in the analysis by O’Neill of the 1992 US Health and Retirement Study (HRS) (O’Neill, 1999). O’Neill compared retirement data for people with and without hearing loss, as shown in Table 11.16. Table 11.16 Percentages of adults aged 51 to 61 concerned with various aspects of retirement With hearing loss Without hearing loss Completely retired 18 12 Poor health a factor in 70 44 deciding to retire Wanted to retire 23 42 Satisfaction with 29 42 retirement It can be seen that a higher percentage of hearing impaired than hearing people are retired, which will contribute to the higher percetages of hearing impaired people of working age who are unemployed. However, the data suggest that many of the people with hearing loss who are retired did not retire for positive reasons, and were in poorer health at the time of retirement than their hearing peers. These factors, plus consequent lower economic status, would probably be the reasons for the larger percentage among the hearing impaired who are not satisfied with their retirement. The HRS also found that, among 51 to 61 year olds, the median net worth of an individual with hearing loss was $65,575 compared with $102,000 for someone without hearing loss. 11.6 Discrimination at work Among deaf and hard of hearing people who are in work, there are many reports of discrimination at work. The two reports by the RNID concerning employment (RNID, 2000; Bradshaw, 2002) provide evidence of discrimination, both while seeking work and at work. The figures relating to employment and discrimination among respondents to the RNID survey are as follows: 156
  • 157.
    157 • Over two thirds (70%) said their deafness had prevented them from getting a job. • Over two thirds (68%) felt that seeking work was a problem because their communication problems were not understood. • Over half (52%) said that they had been prevented from pursuing further training or education because of their deafness or lack of communication services. • Nearly three quarters (74%) said opportunities for promotion were fewer than for hearing colleagues. • Over half (60%) said their colleagues did not understand their hearing problems. • Over a third (38%) in employment said they were looking for another job because of the way they were treated at work. • Nearly two thirds (64%) experienced communication barriers at work. • Over half said they were unable to communicate with hearing colleagues. • Over a third (38%) in employment said they moved jobs more often than they liked because of the way they were treated at work. A further survey of employers carried out by the (RNID, 2002b) provided possible reasons for the discrimination experienced by deaf and hard of hearing people in the workplace. There was a lack of awareness and ignorance of the needs of disabled staff in general, and of the support available to employers. The employers also showed poor knowledge of their legal responsibilities towards disabled people. There was little employer support or adjustments for disabled staff; only one third of the companies with deaf or hard of hearing staff had made adjustments for them in the work environment; and only three out of the 400 companies had provided any deaf awareness training. Employers also lacked knowledge of government support which is available to employers of disabled people. Although Thomas and Herbst in their 1980 study found no evidence of different rates of employment between hearing impaired and hearing people, they did find that 11% of their hearing impaired subjects had changed their job due to their deafness (Thomas and Herbst, 1980). However, unlike the RNID survey there was no evidence that hearing impaired subjects felt that their prospects of promotion differed from those with normal hearing. Nevertheless, Thomas and Herbst found that the hearing impaired subjects were significantly less happy at work than a comparable group of normal hearing people, and concluded that there is some evidence to suggest that deafness lowers the quality of working life. There is some other evidence, more recent than the Thomas and Herbst study, which supports the RNID findings. The workers interviewed by Hetu et al (1990) spoke of the fear of reduced promotion and job opportunities and, in the study by Joore et al (2003), of 10 moderately impaired subjects in work, 6 said that their deafness caused problems at work. 11.7 Conclusions This chapter has provided evidence, mainly from the US and the UK, which shows that hearing impairment and resulting discrimination cause problems in all aspects of working life including obtaining work, functioning at work, communicating with colleagues and being stigmatised by co-workers. There is a consistent pattern of lower employment rates among the hearing impaired population than the general population, employment rates decreasing with increased severity of impairment. It 157
  • 158.
    158 appears that thegap between the employment rates of hearing and hearing impaired people is widening. Ruben (2001) considers that, with the increasing importance of work requiring communication skills, this gap will increase in the 21st century. The outcomes of research studies concerning employment are related. It may be the discrimination at work which leads to less job satisfaction and to people changing jobs. Of those surveyed by the RNID 38% were looking for another job because of discrimination. This represents a significant cost to employers in terms of lost expertise and recruitment expenditure. As pointed out "Employment opportunities are critical to individual prosperity and happiness. The exclusion of deaf and hard of hearing people from such opportunities results in individual misery and a heavy social cost in terms of lost skills and extra strain on an over-stretched welfare system." (RNID, 2002). Not only is the employment rate of hearing impaired people lower than that of the rest of the population, but more hearing impaired than hearing people are employed in jobs with less status and lower earnings. This could also contribute to lower job satisfaction among deaf and hard of hearing people. Studies of the relative earnings of hearing and hearing impaired people show that, on average, the latter earn around 85% of the former, representing a further cost to society. In the following chapter data presented in this chapter is used in the overall evaluation of hearing loss. 158
  • 159.
    159 CHAPTER 12 EVALUATION OF HEARING IMPAIRMENT IN EUROPE 12.1 Introduction This chapter brings together the information presented in the previous chapters in order to estimate some costs to Europe of hearing impairment. The data on prevalence of various grades of hearing loss contained in Chapter 2 are used to estimate the current numbers of hearing impaired people in Europe. Two approaches are then used in estimating costs. The first uses a ‘quality of life’ approach, suggested by some of the studies in Chapter 10. Information on the effects of hearing loss presented in Chapters 4 and 5 is used to assign a health utility index to different grades of hearing impairment, from which overall costs of hearing loss in the European population can be estimated. The second approach calculates the financial loss in terms of loss of earnings of hearing impaired people, using information from Chapter 11. The choice of method of evaluation has to be based upon the data which are available. Sufficient information has been obtained for a full quality of life evaluation. However, there is insufficient information available at the present time for a full and accurate monetary evaluation. Further research is needed across Europe in order to obtain the necessary data, as discussed in the next chapter. In order to evaluate the costs using both methods the following information is required: • Numbers of people in Europe with hearing loss of differing degrees of severity • Numbers of people in Europe who would benefit from a hearing aid • Quality of life values associated with each degree of hearing loss • A monetary value associated with a full quality of life year • Numbers of people in Europe who are unemployed or underemployed as a result of hearing loss • Average earnings of population of Europe As will be seen ‘Europe’ is taken to mean both the European Union (25 states) and also the whole continent including countries not in the EU but excluding Turkey and Russia. Countries included in both definitions, together with their current populations are listed in Appendix 5. The evaluations using both methods are carried out for the total numbers of people in Europe who would benefit from hearing aids. In addition, the numbers are adjusted to consider only those people who would benefit from hearing aids but do not own one, thus giving a more conservative estimate of the costs of hearing impairment. 12.2 Numbers of people in Europe who would benefit from hearing aids The total numbers of hearing impaired people in the current four EU hearing loss grades have been calculated. Of these, the numbers who would benefit from hearing aids is also estimated. 159
  • 160.
    160 12.2.1 Numbers ofhearing impaired people in Europe Using the information on prevalence of hearing loss in Europe, discussed in Chapter 3, it is possible from the population data to calculate how many European adults currently have hearing impairment of different grades. In Chapter 3 it was deduced that the current prevalence in Europe was as shown in Table 12.1 (reproduced from Section 3.4.2). Table 12.1 Current prevalence among adults in Europe of different grades of hearing impairment Grade of HI Mild Moderate Severe Profound BEHL 21-39 40-69 70-94 95+ Percentage of 16.9 4.6 0.7 0.2 population The populations of individual countries of Europe (2003/4 data) are listed in Appendix 5. From these the populations of the European Union, the rest of the Europe and Europe as a whole can be calculated, as shown in Table 12.2. This report is concerned with adults aged 18 and over. Davis (1997) estimated the total population of Europe in 2005 to be 530,803,000 of whom 412,573,000, that is 77.7%, would be over 18. (Note that the total population estimated by Davis, which was based upon United Nations predictions, agrees with the total population in Table 12.2 less the population of Ukraine.) Assuming that 77.7% of the current population is over 18 gives the numbers of adult populations in regions of Europe also shown in Table 12.2. Table 12.2 Estimate of total population of Europe Total Adult population population European Union 456,814,600 354,944,940 Rest of Europe 122,404,817 95,108,530 Total Europe 579,219,417 450,053,470 Using the prevalence figures shown in Table 12.1, the numbers of people with hearing impairment in the four categories are as shown in Table 12.3 (to nearest million). Table 12.3 Estimates of numbers of adults in Europe in four categories of hearing impairment Grade of HI Mild Moderate Severe Profound Percentage of population 16.9 4.6 0.7 0.2 No. of people in EU 59,985,694 16,327,467 2,484,615 709,890 No. of people in rest of Europe 16,073,341 4,374,992 665,760 190,217 No. of people in all Europe 76,059,036 20,702,459 3,150,375 900,107 12.2.2 Numbers who would benefit from hearing aids The four categories in Table 12.3 reflect the current European definitions of hearing impairment. The category ‘mild’ refers to hearing impairment of from 21 to 39 dB BEHL. However, it is usually assumed that those with hearing impairment of 25 dB BEHL or greater would benefit from hearing aids. As evident from Chapter 3, Davis 160
  • 161.
    161 (1995) found that6.5% of adults in the UK had BEHL of between 20 and 25 dB. In estimating the costs of untreated hearing impairment only those who would benefit from hearing aids should be considered. If those in the ‘mild’ category with BEHL between 20 and 25 dB are not considered, then 10.4% of the population remain in the ‘mild’ category. Table 12.4 shows the numbers of adults in Europe who would benefit from hearing aids, considering only those with BEHL of 25 dB and above. Table 12.4. Estimates of numbers of adults in Europe in four categories of hearing impairment who would benefit from hearing aids Grade of HI Mild* Moderate Severe Profound Percentage of population 10.4 4.6 0.7 0.2 No. of people in EU 36,914,273 16,327,467 2,484,615 709,890 No. of people in rest of Europe 9,891,287 4,374,992 665,760 190,217 No. of people in all Europe 46,805,560 20,702,459 3,150,375 900,107 * 25 to 39 dB BEHL For the purposes of the following analysis, given the relatively small numbers of those with profound HL, the severe/profound categories have been combined as shown in Table 12.5. Table 12.5. Estimates of numbers of adults in Europe in three categories of hearing impairment who would benefit from hearing aids Grade of HI Mild* Moderate Severe/ Profound No. of people in EU 36,914,273 16,327,467 3,194,505 No. of people in rest of Europe 9,891,287 4,374,992 855,977 No. of people in all Europe 46,805,560 20,702,459 4,050,482 * 25 to 39 dB BEHL 12.3 Evaluation of costs of hearing impairment using a quality of life approach It has been seen in Chapter 10 that some studies of the costs of hearing impairment have used a quality of life approach to evaluate the benefits that may be derived from treatment such as cochlear implants (Cheng and Niparko, 1999; Wong et al, 2000; Summerfield et al, 2002) or in estimating the costs of new legislation to protect workers’ hearing (HSE, 2003). Other studies have estimated the direct costs of various issues connected with hearing loss such as employment, treatment, or education (Mohr et al, 2000; Ruben, 2001; Keren et al, 2002). However, authors of these studies have pointed out that using a purely monetary approach ignores the important psychosocial costs of hearing impairment (Mohr et al, 2000; Keren et al, 2002). Chapters 4 and 5 have illustrated the significant psychosocial effects that even mild and moderate hearing impairment can have upon individuals and their families, while Chapter 9 shows how many of these effects may be mitigated by the use of appropriate hearing aids. Given the extent of psychosocial problems which may be attributable to an individual’s hearing loss it is important that these factors are accounted for in any evaluation of hearing impairment. This section therefore describes an approach to evaluation based upon a quality of life method. A prevalence based approach is used, based upon the prevalence data in the previous section, in which the costs for a particular year are evaluated. 161
  • 162.
    162 12.3.1 Evaluation ofloss of quality of life due to hearing impairment Chapter 10 reviewed studies which have taken a quality of life approach in estimating the cost effectiveness of cochlear implants. In these studies a health utility index (HUI) value has been assigned to a patient’s condition before and after implantation. The value of the index before implantation may be regarded as an indicator of the quality of life due to profound deafness. In the studies reviewed the average value of the HUI associated with profound deafness was 0.54, indicating that profound deafness causes a loss of 0.46 in the quality of life index. Sorri et al (2001) also regard this value, derived from cochlear implant studies, as being indicative of the loss of quality of life due to profound deafness. Cochlear implantation was found to increase the HUI by approximately 0.3 on average, to around 0.8. Sorri et al (2001) cite a study which found that for a representative group of the British population, the value of the HUI was above 0.85 until after the age of 60, and above 0.8 until the age of 70. It therefore seems reasonable to associate a HUI value of 0.6 to severe/profound deafness and 0.8 to mild hearing impairment. Chapters 4 and 5 discussed many studies showing the impact of hearing impairment on quality of life. It was seen that the detrimental psychosocial effects of hearing impairment increased, and overall quality of life decreased, with an increase in hearing loss. In particular, the study by Bess (1989; 2000) shows an approximately linear relationship between hearing loss and psychosocial effects as measured using the Sickness Impact Profile. It therefore seems reasonable to assume a linear increase in HUI with increase in severity of hearing loss. Therefore HUI values have been assigned to the three grades of hearing loss as shown in Table 12.5. If it is assumed that the ‘average’ value of HUI is 0.85 for an adult in Europe (Sorri et al, 2001) then the loss in HUI caused by each grade of hearing loss is as also shown in Table 12.6. Table 12.6 Health utility indices assigned to grades of hearing loss Severe/ Grade of HI Mild Moderate Profound Health utility index 0.8 0.7 0.6 Loss in HUI due to HI 0.05 0.15 0.25 12.3.2 Quality adjusted life years In health economics it is common practice to evaluate in monetary terms the effectiveness of a health policy in terms of quality adjusted life years (QALY). A quality adjusted life year allocates a value to one full quality year of life, and adjusts it by a factor reflecting the change in quality of life due to a health effect. This method has been used in evaluating the cost effectiveness of cochlear implants, as described in Chapter 10. As was also discussed, this approach was used by the Health and Safety Executive (HSE) in the UK to evaluate the costs of implementing the new EC Directive on noise at work (Health and Safety Executive, 2003). The HSE assigned loss of quality of life factors to noise induced hearing loss of different severities, and evaluated an annual cost of the hearing loss. The value of a full quality of life year was assumed to be £42,000, which was based upon the ‘value of preventing a fatality’ used by the UK Department of Transport, in assessments of road safety. The value of 162
  • 163.
    163 a full qualityof life year used in health assessments includes consideration of loss of earnings, plus allowances for pain and suffering (Health and Safety Executive, 2003). The most recent figure proposed for use in Europe to represent the value of one year of life is 44,000 euros (European Commission Environment DG, 2003). This is the value used in Section 3.3 in evaluating an annual cost of hearing impairment. 12.3.3 Annual cost of hearing impairment per person Assuming 44,000 euros as the value of a full quality life year, then the values in euros per person per year for the different categories of hearing impairment are as shown in Table 12.7. Table 12.7 Annual cost of hearing impairment in euros per person Severe/ Grade of HI Mild Moderate Profound Loss in HUI due to HI 0.05 0.15 0.25 Cost in euros 2,200 6,600 11,000 12.3.4 Total costs of untreated hearing impairment Combining the estimates in Table 12.5 of population numbers with hearing impairment with the values shown in Table 12.7 gives the total annual costs of each grade of hearing loss; these are shown in millions of euros in Table 12.8. Table 12.8 Costs in millions of euros of four categories of hearing impairment Severe/ Grade of HI Mild* Moderate Profound Total cost in EU 81,211 107,761 35,140 Total cost in rest of Europe 21,761 28,875 9,416 Total cost in all Europe 102,972 136,636 44,556 * 25 to 39 dB BEHL Thus the total annual costs of untreated hearing impairment in each area are the sums of the values for the three categories shown in Table 12.8. These overall figures, in billions of euros, to the nearest billion, are shown in Table 12.9. Table 12.9 Total costs, in billions of euros, of hearing impairment in Europe Cost (billions of euros) European Union 224 Rest of Europe 60 Total Europe 284 12.4 Evaluation of costs of unemployment due to hearing loss The studies by Mohr et al (2000) and Keren et al (2002), described in Chapter 10, showed that a major contribution to the lifetime costs of hearing impairment was the loss of earnings of people with hearing loss. Mohr et al found that reduced productivity, expressed as loss of earnings, contributed 67% of the societal lifetime costs of severe to profound hearing impairment. The following sections estimate the 163
  • 164.
    164 numbers of peoplewho are unemployed in Europe as result of their hearing loss, and illustrate the costs of unemployment in one European country by calculating the lost productivity, expressed as loss of earnings, in the UK. 12.4.1 Numbers of unemployed in Europe The data presented in Chapter 12 on rates of employment and unemployment among hearing impaired people in the US and UK can be used to estimate the numbers of people in Europe who are unemployed as a result of their hearing loss. It is possible to estimate the lost earnings for the current year in the UK, but there is insufficient data available for a full consideration of other European countries. The data that is required is information on employment rates of deaf and hard of hearing people across Europe, and average earnings in different European countries. The studies reviewed in Chapter 11 suggest that 65% of all hearing impaired people are employed, compared with 75% of the general population. That is, hearing impairment causes an additional 10% of unemployment over the unemployment. Table 12.10 shows the total numbers of hearing impaired people in Europe, with hearing loss of 25 dB or more, derived from the figures in Table 12.4. Table 12.10 Total numbers of hearing impaired people in Europe (BEHL≥25) No. with BEHL ≥25 European Union 56,436,245 Rest of Europe 15,122,256 Total Europe 71,558,501 The figures in Table 12.10 are somewhat lower than the predictions by Davis (1997;1999) of 81,536,000 people in Europe with hearing loss of over 25 dB by the year 2005. Davis’ predictions were based upon population estimates and predicted demographic changes in the population. In addition the figures in Table 12.10 are based upon prevalence studies that did not include people over the age of 80, whereas the estimates by Davis included people of all ages. It is therefore possible that the following figures underestimate the extent of unemployment in Europe. Assuming that 10% of the hearing impaired population are unemployed as a result of their hearing impairment gives the figures shown in Table 12.11. Table 12.11 Numbers of people in Europe unemployed as a result of hearing impairment No. unemployed due to HL≥25 European Union 5,643,625 Rest of Europe 1,512,226 Total Europe 7,155,850 With data on average earnings in Europe it would be possible to calculate the loss of earnings in a year due to hearing impairment, as calculated for the UK in the following section. It can be seen that this would represent a very substantial cost. 164
  • 165.
    165 12.4.2 Cost ofunemployment in UK Current data on average earnings is available for the UK. The current population of the UK is 59,651,500; therefore the adult population (77.7%) is 46,349,215. The numbers with hearing impairment of differing severities, calculated in the same way as the European prevalence figures in Table 12.4, are as shown in Table12.12. Table 12.12 Estimates of numbers of adults in UK in four categories of hearing impairment who would benefit from hearing aids Grade of HI Mild* Moderate Severe Profound Total Percentage of population 10.4 4.6 0.7 0.2 No. of people in UK 4,820,318 2,132,064 324,445 92,698 7,369,525 * 25 to 39 dB BEHL As with the European data the total number of hearing impaired people in the UK shown in Table 12.12 is less than that predicted by Davis (1997; 1999), for the same reasons as discussed above. (The figure predicted by Davis was 9,282,000.) From Table 12.12 it can be seen that approximately 736,953 people in the UK may be unemployed due to their hearing impairment. The average earnings in the UK in 2004 was approximately £24,500 (Office of National Statistics, 2005). Thus the loss in earnings due to hearing impairment in 2004 in the UK, using this method of calculation, is estimated to be approximately £18 billion, or 25.5 billion euros. This figure represents only those who are unemployed. However, Chapter 11 showed that many hearing impaired people are employed in lower status jobs and earn less than hearing people with equivalent qualifications. Thus the total loss in earnings would be considerably more than the calculated figure. 12.5 Costs of unaided hearing impairment The studies of employment discussed in Chapters 11 do not give any information about use of aids, and whether or not they decrease the likelihood of unemployment. In this section the numbers of hearing impaired people used to estimate costs in the sections 12.3 and 12.4 have been adjusted to disregard those who wear hearing aids. In the quality of life approach this implies that the use of a hearing aid restores quality of life to an unimpaired level, which is not the case. In evaluating the costs of unemployment it suggests that a hearing aid user is as likely as a non hearing impaired person to be employed, which is probably also an unreasonable assumption. Thus these adjusted costs will be underestimates of the total costs of hearing impairment especially as, in the case of unemployment costs, as discussed in section 12.4.2, they do not allow for underemployment and lower earnings of deaf and hard of hearing people. In order to eliminate people who wear aids from the calculations, the conclusion in Chapter 6 that less than 1 in 4 people in Europe who need a hearing aid own one is used to adjust the numbers in the previous sections. The numbers of unaided hearing impaired people are thus assumed to be 75% of the total numbers of those who are hearing impaired. From the discussion in Chapter 7 concerning use of hearing aids it can be seen that this is also an underestimate as a large number of hearing aid owners do not actually use their aids. 165
  • 166.
    166 12.5.1 Quality oflife approach Reducing the numbers in all categories in Table 12.5 by 25% gives the numbers shown in Table 12.13. Table 12.13 Estimates of numbers of adults in Europe in four categories of hearing impairment who would benefit from hearing aids and do not own them Grade of HI Mild* Moderate Severe/ Profound Percentage of population 10.4 4.6 0.7 No. of people in EU 27,685,704 12,245,600 2,395,879 No. of people in rest of Europe 7,418,465 3,281,244 641,983 No. of people in all Europe 35,104,170 15,526,844 3,037,862 * 25 to 39 dB BEHL Combining the numbers in Table 12.13 with the annual costs per person in Table 12.7 and adding over all grades of hearing impairment gives the total costs, in billions of euros, shown in Table 12.14. Table 12.14 Total costs, in billions of euros, of unaided hearing impairment in Europe Cost (billions of euros) European Union 168 Rest of Europe 45 Total Europe 213 12.5.2 Costs of unemployment In assessing the costs of unemployment, ignoring those who own a hearing aid, the numbers of hearing impaired people to be considered are 75% of those shown in Table 12.10, that is the numbers shown in Table 12.15. Table 12.15 Total numbers of hearing impaired people in Europe (BEHL≥25) without hearing aids No. unaided with BEHL ≥25 European Union 42,327,183 Rest of Europe 11,341,692 Total Europe 53,668,875 Thus the numbers unemployed as a result of hearing impairment (ignoring those with hearing aids) are as shown in Table 12.16 (10% of the numbers shown in Table 12.15). 166
  • 167.
    167 Table 12.16 Numbersof unemployed hearing impaired people in Europe (BEHL≥25) without hearing aids No. unaided and unemployed with BEHL ≥25 European Union 4,232,718 Rest of Europe 1,134,169 Total Europe 5,366,888 The total number of unemployed hearing people without hearing aids in the UK is estimated to be 75% of the total number given in Table 12.12, that is 5,527,144. Using the previous argument it may be assumed that 10% of these, that is 552,714, are unemployed as a direct result of their hearing impairment. Using the average earnings in the UK of £24,500 gives the loss in earnings due to unaided hearing impairment in the UK as £13.5 billion. 12.6 Conclusions The data and calculations presented in this chapter show that the cost to Europe of hearing impairment of all grades is 284 billion euros for the current year (2004), and 224 billion euros for the European Union. This figure has been arrived at by taking a ‘quality of life’ approach, which will account for overall effects, including the psychosocial impacts of hearing loss. In arriving at this figure several assumptions have been made regarding the prevalence of hearing impairment, the loss of health utility due to hearing loss, and the appropriate value of a full quality life year to use in this case. By estimating the costs of lost productivity, or unemployment, in the UK it was found that hearing impairment costs the country around £18 billion. The method of calculation used here could be applied to the rest of Europe. This figure does not take into account the lower earnings of hearing people who are employed. Thus the total figure would be greater than the £18 billion estimated. Considering the impact of unaided hearing impairment the costs are 213 billion euros for the whole of Europe, based upon a quality of life approach. The costs of unemployment in the UK of unaided hearing loss are estimated to be £13.5 billion. The figures arrived at using both estimation methods are likely to be underestimates as they do not include the population of Europe over the age of 80 who suffer from hearing impairment. Furthermore, demographic changes mean that the relative numbers of elderly people in Europe will increase significantly over the next 30 years, and are likely to lead to increased proportions of the population who have hearing impairment. Furthermore, underemployment and lower wages among hearing impaired people are not accounted for. Thus it can be seen, bearing in mind the fact that the costs calculated are likely to be underestimates, that hearing impairment represents a very substantial cost to society. 167
  • 168.
    168 CHAPTER 13 CONCLUSIONS AND DISCUSSION 13.1 Introduction This report has presented the results of many studies concerned with prevalence of hearing impairment, effects of hearing impairment, the extent of ownership and use of hearing aids and their benefits, and the costs to society of hearing impairment. This chapter highlights the main conclusions of the wide ranging literature review contained in the report, discusses some of the issues raised and suggests where, in the opinion of the author, further research and action is needed. 13.2 Main conclusions The report has shown that at the current time around 22% of the population of Europe are hearing impaired to a greater or lesser extent. The prevalence of hearing impairment will increase as the population ages; it is estimated that in 20 years’ time there will be approximately 100 million hearing impaired people in Europe. The wide extent of hearing impairment has a major impact upon society. Among sufferers it can cause loneliness, depression, and low self esteem. It affects family and other close relationships, and hearing impaired people may experience prejudice and abuse because of their disability. A problem often arises as the hearing impaired person typically denies that there is a problem and therefore delays seeking help. Research in the UK and Scandinavia has shown that, on average, around 3% of the population own a hearing aid. This means that fewer than one in three people who would benefit from an aid own one. Furthermore, of those who own aids typically only two thirds use them. Thus many people are unnecessarily experiencing the negative effects of hearing loss. These numbers are particularly surprising when it is realised that the proportions of hearing impaired people owning and using aids have not changed significantly for the past 40 years. This is despite advances in technology which have improved the performance and appearance of aids over the years. Among those who do use hearing aids the majority are satisfied or very satisfied with their performance. The perceived amount of benefit provided by an aid is related to the amount of use and not to the degree of hearing loss. There is overwhelming evidence that the use of hearing aids provides significant improvement to overall quality of life. Apart from the obvious improvements in communication they can improve self confidence, psychological functioning, health, social life and family relationships. These benefits tend to occur early on in the wearing of aids and to last throughout the time that aids are used. Further evidence of the need to treat hearing loss as effectively as possible is seen in the studies on costs to society of hearing impairment. Severe to profound deafness has been shown to be one of the most expensive medical conditions, over a lifetime costing more than strokes, epilepsy or schizophrenia. However there is little information available on the societal costs of less severe hearing impairment. Data has been found which shows that hearing impaired people are more likely to be 168
  • 169.
    169 unemployed and, ifemployed, to earn less than their hearing counterparts. In addition to the financial loss to the individual, the relatively high rate of unemployment among hearing impaired people, and their working in jobs of lower status represent wasted opportunities and a loss to society of necessary skills. Taking account of the psychosocial effects of hearing impairment, and of lost productivity in terms of unemployment, it has been shown that hearing impairment causes a huge monetary loss to Europe. 13.3 Discussion An overwhelming feature of the literature reviewed in this report is the consistency of the results of the many studies considered. This is particularly noticeable where results have been adjusted so that their presentation is consistent with that of other studies. In all the aspects of hearing impairment considered, the conclusions reached are supported by the findings of a great number of independent studies. The review has, however, highlighted some areas of concern. It is obvious that, despite the very large body of research in all areas of hearing impairment, only (some) professionals involved in the area are aware of the findings. In order to avoid the prejudice and stigma of hearing loss, there needs to be an effective campaign of raising awareness among the general public of the effects of hearing loss and the needs of hearing impaired people. One way in which this could be achieved is by the use of high profile figures discussing hearing loss and the importance of obtaining and wearing hearing aids. (The advantages of such a strategy are highlighted by the increased uptake of hearing aids in the US when Bill Clinton revealed that he wore an aid.) Only by publicity of the issues will the general public become aware of and sympathetic towards the needs of hearing impaired people, thereby reducing the stigma attached to hearing impairment. As repeatedly pointed out during the report, nearly all the research that has been published on the effects of hearing loss has concerned the elderly population. Although not reviewed here, there is also a large body of information concerning hearing impaired babies and children. However, there is a dearth of information concerning teenagers and young adults. The general population does not expect young people to be hearing impaired; it is a disability associated with ageing. This adds to the stigma of hearing loss for young people. There is an urgent need for research to be carried out to study the impact of hearing impairment among young people and their particular needs and wishes regarding rehabilitation. Finally, it is shocking that, despite ever improving hearing aid technology, so few aids are owned and worn. The benefits of hearing aids have been demonstrated in many research projects over many years, and the extent to which they can improve the quality of life of hearing impaired people shown in many studies. The hearing aid industry needs to promote the results of these studies among the hearing impaired community, the general public and the medical profession. Quite apart from the costs to society that could be reduced by appropriate prescribing and wearing of aids, it is a tragedy that so many hearing impaired people are not taking advantage of the improvements to their lives that hearing aids offer. 169
  • 170.
    170 REFERENCES M O Aguayoand N F Coady. The experience of deafened adults: implications for rehabilitative services. Health and Social Work 26(4), 269-277, 2001 American Academy of Audiology. Facts on hearing loss. www.audiology.org American Academy of Audiology. A white paper addressing the societal costs of hearing loss and issues in third party reimbursement. www.audiology.org. American Speech-Language-Hearing Association. www.asha.org S Arlinger. Negative consequences of uncorrected hearing loss – a review. International J of Audiology, 42 Supplement 2, 2s17-20, 2003 S Arlinger and E Billermark. One year follow up of users of a digital hearing aid. British J. of Audiology 33(4), 223-232, 1999 S Barnett. Curbside consultation – A hearing problem. American Family Physician 66(5), 911-915, 2002 B Bech, B Christensen and A Parving. The Valby project. A survey of the hearing in the elderly >= 80 years of age – provided with hearing aids. Scandinavian Audiology 25, 247-252, 1996 V Benson and M Murano. Current estimates from the National Health Interview Survey, 1995. National Center for Health Statistics, Vital Health Statistics 10, 1998. F H Berg. The minimally hearing impaired child. Ear and Hearing 6, 43-47, 1985 F Bess, M Lichtenstein, S Logan, M C Burger and E Nelson. Hearing loss as a determinant of function in the elderly. J. American Geriatrics Society 37, 123-128, 1989 F Bess, M Lichtenstein and S Logan. Making hearing impairment functionally relevant: linkages with hearing disablity and handicap. Acta Otolaryngologia Suppl 476, 226-231, 1991 F H Bess, J Dodd-Murphy and R A Parker. Children with minimal sensorineural hearing loss: prevalence, educational performance, and functional status. Ear and Hearing 19(5), 339-354, 1998 F H Bess. The role of generic health-related quality of life measures in establishing audiological rehabilitation outcomes. Ear and Hearing 21(4), 74S-79S, 2000 Better Hearing Institute. Facts about hearing disorders. 1999 www.betterhearing.org W Bradshaw. The employment situation and experiences of deaf and hard of hearing people. RNID, May 2002. 170
  • 171.
    171 S. Breadin. Theeffect of noise and acoustics on the perception of public places. MSc thesis, South Bank University, 2000 J Bridges and R Bentler. Relating hearing aid use to well-being among older adults. The Hearing Journal 51(7), 39-44, 1998 R H S van den Brink, H P Witt, G I J M Kempen and M J G van Heuvelen. Attitude and help-seeking for hearing impairment. British J. of Audiology 30(5), 313-324, 1996 British Association of Teachers of the Deaf. Audiometric descriptors, BATOD magazine, January 2001 British Society of Audiology, Descriptors for pure tone audiograms, British Journal of Audiology 22, 123, 1988 D N Brooks. Hearing aid candidates - some relevant features. British J. of Audiology 13, 81-84, 1979 M E Capella. Comparing the occupational status of vocational rehabilitation consumers who are deaf or heard of hearing in the general labour force. JADARA 36(2), 1-21, 2003 C Carabellese, I Appollonio, R Rozzini et al. Sensory impairment and quality of life in a community elderly population. J. American Geriatics Society 41, 401-407, 1993 H L Chen. Hearing in the elderly. Relation of hearing loss, loneliness and self esteem. Journal of Gerontol. Nursing 20(6), 22-28, 1994 A K Cheng and J K Niparko. Cost-utility of the cochlear implant in adults. Arch. Otolaryngol. Neck Head Surgery 125, 1214-1218, 1999 Committee on Disabilities of the Group for the Advancement of Psychiatry. Issues to consider in deaf and hard-of-hearing patients. American Family Physician 56(8), 2057-2068, 1997 R M Cox. Assessment of subjective outcome of hearing aid fitting: getting the client’s point of view. International J of Audiology 42, S90-S96, 2003 R M Cox and I M Rivera. Predictability and reliability of hearing aid benefit measured using the PHAB. J American Academy of Audiology 3, 242-254, 1992 R M Cox and G C Alexander. Maturation of hearing aid benefit: objective and subjective measurements. Ear and Hearing 13, 131-141, 1992 R M Cox and G C Alexander. The abbreviated profile of hearing aid benefit. Ear and Hearing 16, 176-186, 1995 R M Cox, G C Alexander, I M Taylor and G A Gray. Benefit acclimatization in elderly hearing aid users. J American Academy of Audiology 7, 428-441, 1996 171
  • 172.
    172 R M Coxand G C Alexander. Personality and the subjective assessment of hearing aids. J American Academy of Audiology 10, 1-13, 1999a R M Cox and G C Alexander. Measuring satisfaction with amplification in daily life: the SADL scale. Ear and Hearing 20(4), 306-320, 1999b R M Cox and G C Alexander. Expectations about hearing aids and their relationship to fitting outcome. J American Academy of Audiology 11, 368-382, 2000 R M Cox and G C Alexander. Measuring satisfaction with amplification in daily life: validation of the SADL scale. Ear and Hearing 22(2), 151- 160, 2001 R M Cox, M Hyde, S Gatehouse, W Noble, H Dillon et al. Optimal outcome measures, research priorities and international cooperation. Ear and Hearing 21(4), 106S-115S, 1999 C Crandell. Hearing aids: their effects on functional health status. The Hearing Journal 51(2), 2-6, 1998 K J Cruickshanks, T L Wiley, T S Tweed et al. Prevalence of hearing loss in older adults in Beaver Dam, Wisconsin: The Epidemiology of Hearing Loss Study. American Journal of Epidemiology 148(9), 1075-1078, 1998 Dallas Hearing Foundation. www.dallascochlear.com B Danermark, S Antonson and I Lundstrom. Social inclusion and career development – transition from upper secondary school to work or post-secondary education among hard of hearing students. Scandinavian Audiology 30, Suppl 53, 120-128, 2001 M David and S E Trehub. Perspectives on deafened adults. American Annals of Deafness 134, 200-204, 1989 W J Davies, T J Cox, A T Kearon, B J Longhurst and C L Webb. Hearing loss in the built environment - the experience of elderly people. Acustica 87, 610-616, 2001 A Davis, K G Herbst and von Wedel. Discussion on paper by K R G Herbst, R Meredith and S D G Stephens. Implications of hearing impairment for elderly people in London and in Wales. Acta Otolaryngologia Suppl 476, 214, 1991 A C Davis. Longitudinal study of hearing. Acta Otolaryn Suppl 476, 12-22, 1991 A Davis, D Stephens, A Rayment and K Thomas. Hearing impairments in middle age: the acceptability, benefit and cost of detection. British J. of Audiology 26(1), 1-14 1992 A Davis. Hearing in adults. The prevalence and distribution of hearing impairment and reported hearing disability in the MRC Institute of Hearing Research’s National Study of Hearing. Whurr publishers, 1995. 172
  • 173.
    173 A Davis. Epidemiology.In A Kerr (ed): Scott-Brown’s Otolaryngology, (sixth edition), Volume 2. Butterworth Heinemann, 1997 A Davis, C Yoshinaga-Itano and S Hind. Commentary: Universal newborn hearing screening: implications for coordinating and developing services for deaf and hearing impaired people. British Medical Journal 323, 539-540, 2001 A Davis. Population study of the ability to benefit from amplification and the provision of a hearing aid in 55-74 year old first time hearing aid users. Int J Audiology 42, 2S39-2S52, 2003 Deafness Forum. www.dest.gov.au/archive/highered. H Dillon, G Birtles and R Lovegrove. Measuring the outcomes of a national rehabilitation program: normative data for the client oriented scale of improvement (COSI) and the hearing aid user’s questionnaire. J American Academy of Audiology 10, 67-79, 1999 J A Duijvestijn, L J Anteunis, C J Hoek, R H van de Brink, M N Chenau and J J Manni. Help-seeking behaviour of hearing-impaired persons aged > 55 years; effect of complaints, significant others and hearing image. Acta Otolaryngology 123(7), 846-850, 2003 C Dye and M Peak. Influence of amplification on the psychological functioning of older adults with neurosensory hearing loss J. Academy of Rehabilitative Audiology XVI, 210-220, 1983 M Eriksson-Mangold, A Aingdahl, A-K Bjorklund and B Wahlin. The active fitting (AF) programme of hearing aids: a psychological perspective. BJA 24, 277-285, 1990 S I Erlandsson and K M Holgers. The impact of perceived tinnitus severity on health- related quality of life with aspects of gender. Noise and Health 3(10), 39-51, 2001 A K Espmark, U Rosenhall, S Erlandsson and B Steen. The two faces of presbycusis: hearing impairment and psychosocial consequences. International J of Audiology, 41(2), 125-135, 2002 European Commission. Directive 2003/10/EC of the European Parliament and of the Council of 6 February on the minimum health and safety requirements regarding the exposure of workers to the risks arising from physical agents (noise). Official Journal of the European Union L042, 38-44, 15 February 2003 European Commission Environment Directorate-General. Assessment of mortality. In report of ad hoc workshop of the methodology of analysing benefits reduced of air pollution in the CAFÉ programme, 12 December 2003 H W Ewertsen. Use of hearing aids (always, often, rarely, never). Scandinavian Audiology 3, 173-176, 1974 173
  • 174.
    174 H M Fortum,A Q Summerfield, D H Marshall, A C Davis and J M Bamford. Prevalence of permanent childhood hearing impairment in the United Kingdom and implications for universal neonatal hearing screening: questionnaire based ascertainment study. British Medical Journal 323, 536-540, 2001. J R Franks and N J Beckmann. Rejection of hearing aids: attitudes of a geriatric sample. Ear and Hearing 6(3), 161-166, 1985 Gallaudet Research Institute. Regional and National Summary Report of data from the 2001-2002 annual survey of deaf and hard of hearing children and youth. GRI, Gallaudet University, USA, 2001 S Gatehouse. Glasgow hearing aid benefit profile. Derivation and validation of a client centred outcome measure for hearing aid services. J American Academy of Audiology 10, 80-103, 1999 S Gatehouse, G Naylor and C Elberling. Benefits from hearing aids in relation to the interaction between the user and the environment. International J Audiology 42, S77- S85, 2003 G A Gates, J C Cooper, W B Kannel et al. Hearing in the elderly. The Framingham cohort, 1983-1985, Part 1, basic audiometric test results. Ear and Hearing 11(4), 247- 256, 1990 K R Gilholme-Herbst, R Meredith and S D G Stephens. Implications of hearing impairment for elderly people in London and in Wales. Acta Otolaryngologia Suppl 476, 209-214, 1991 L. Glanopoulos, D. Stephens and A. Davis. (2002) Follow up of people fitted with hearing aids after adult hearing screening; the need for support with fitting. BMJ 325, 471, 2002 W Golabek, M Nowakowska, H Siwiec and s D G Stephens. Self-reported benefits of hearing aids by the hearing impaired. British J. Audiology 22, 183-186, 1988 J Graham and M Martin (ed). Ballantyne’s Deafness, Sixth edition. Whurr Publishers, 2001 S Gregory. The Deaf Child and His Family. George Allen and Unwin, 1976. (Republished in 1995 as Deaf Children and Their Families, Cambridge University Press) S Gregory, J Bishop and L Sheldon. Deaf Young People and Their Families. Cambridge University Press, 1995 S Gregory. Deaf young people: aspects of family and social life. Chapter 7 in M Marschark and M D Clark (ed), Psychological Perspectives on Deafness, Volume 2. Lawrence Erlbaum Assoc, 1998 174
  • 175.
    175 A Grimby andA Ringdahl. Does having a job improve the quality of life among post- lingually deafened Swedish adults with severe-profound hearing impairment? British J. of Audiology 34(3), 187-195, 2000 L R-M Hallberg. Occupational hearing loss. Scandinavian Audiology 25, Suppl 43, 25-33, 1996 L Hallberg. Is there a gender difference in coping, perceived disability and handicap in patients with noise-induced hearing loss? Noise and Health 2, 66-72, 1999 L R M Hallberg and G Jansson. Women with noise-induced hearing loss: an invisible group? British J. of Audiology 30(5), 340-345, 1996 E L Harless and F McConnell. Effects of hearing aid use on self concept in older persons. J. Speech and Hearing Disorders 47, 305-309, 1982 J P Harris, J P Anderson and R Novak. An outcomes study of cochlear implants in deaf patients. Arch. Otolaryngol. Neck Head Surgery 121, 398-404, 1995 H Hauland and A Gronninguter. Uniting divided worlds: Identity, family and education in the life projects of deaf and hard of hearing people. Disability Studies Quarterly 23(2), 75-88, 2003 Health and Safety Executive. Proposal for a physical agents (noise) directive. Revised regulatory impact assessment. www.hse.gov.uk/ria/noise, 2003 Hear This Organisation, 2002. www.hearthisorg.com Hearing Research Trust. Defeating Deafness, 2001. www.defeatingdeafness.org K R G Herbst, R Meredith and S D G Stephens. Implications of hearing impairment for elderly people in London and in Wales. Acta Otolaryngologia Suppl 476, 209-214, 1991 K Herbst and C Humphrey. Hearing impairment and mental state in the elderly living at home. BMJ 281, 903-905, 4 October 1980 R Hetu, L Riverin, L Getty, M N Lalande and C St-Cyr. The reluctance to acknowledge hearing difficulties among hearing impaired workers. British J. of Audiology 24(4), 265-276, 1990 R Hetu, L Jones and L Getty. The impact of acquired hearing impairment on intimate relationships: implications for rehabilitation. Audiology 32, 363-381, 1993 R Hetu. The stigma attached to hearing loss. Scandinavian Audiology 25, Suppl 43, 12-24, 1996 A Hietanen, P Era, M Sorri and E Heikkinen. Changes in hearing in 80-year old people: a 10-year follow-up study. Int J Audiology 43(3), 126-135, 2004 175
  • 176.
    176 J Jerger andD Hayes. Hearing aid evaluation: clinical experiences with a new philosophy. Arch. Otolaryngology 102, 214-225 1976 M S K Johansson and S D Arlinger. Prevalence of hearing impairment in a population in Sweden. Int J Audiology 42, 18-28, 2003 M A Joore, D E M Brunenberg, M N Chenault and L J C Anteunis. Societal effects of hearing aid fitting among the moderately hearing impaired. International J of Audiology 42, 152-160, 2003 T S Kapteyn. Factors in the appreciation of a prosthetic rehabilitation. Audiology 16, 446-452, 1977a T S Kapteyn. Satisfaction with fitted hearing aids: I. An analysis of technical information. Scandinavian Audiology 6, 147-156, 1977b T S Kapteyn. Satisfaction with fitted hearing aids: II. An investigation into the influence of psycho-social factors. Scandinavian Audiology 6, 171-177, 1977c B Karlsmose, T Lauritzen, M Engberg and A Parving. A five year longitudinal study of hearing in a Danish rural population aged 31 to 50 years. British J Audiology 34(1), 47-55, 2000 R Keren, M Helfand, C Homer, H McPhillips and T A Lieu. Projected cost- effectiveness of statewide universal newborn hearing screening. Pediatrics 110(5), 855 – 895, 2002 P Kerr and R Cowie. Acquired deafness: a multidimensional experience. British J. of Audiology 31, 177-188, 1997 J F Knutson and C R Lansing. The relationship between communication problems and psychological difficulties in persons with profound acquired hearing loss. J Speech Hear Disord 55, 656-664, 1990 S Kochkin. MarkeTrak III: Why 20 million in US don’t use hearing aids for their hearing loss. Hearing Journal 46(1), 20-27; 46(2), 26-31; 46(4), 36-37, 1993 S Kochkin. MarkeTrak IV: Impact on purchase intent of cosmetics, stigma, and style of hearing instrument. Hearing Journal 47(9), 29-36, 1994 S Kochkin. MarkeTrak IV: Correlates of hearing aid purchase intent. Hearing Journal 51(1), 30-41, 1998 S Kochkin. MarkeTrak V: Why my hearing aids are in the drawer: the consumer’s perspective. The Hearing Journal 53(2), 34-42, 2000 S Kochkin. The VA and direct mail sales spark growth in hearing aid market. The Hearing Review 8(12), 16-24, 63-65, 2001 176
  • 177.
    177 S Kochkin. 10-yearcustomer satisfaction trends in the US hearing instrument market. The Hearing Review 9(10), 14-25, 46, 2002a S Kochkin. Consumer rate improvements sought in hearing instruments. The Hearing Review 9(11), 18-22, 2002b S Kochkin. On the issue of value: hearing aid benefit, price, satisfaction and brand repurchase rates. The Hearing Review 10(2), 12-25, 2003 S Kochkin and C M Rogin. Quantifying the obvious: the impact of hearing instruments on quality of life. The Hearing Review 7(1), 6-34, 2000 N M Lalande, J Lambert and L Riverin. Quantification of the psychosocial disadvantages experienced by workers in a noisy industry and their nearest relatives: perspectives for rehabilitation. Audiology 27, 196-206, 1988 C Lundeen. Prevalence of hearing impairment among children. Language, Speech and Hearing Services in Schools, 22, 269-271, 1991 M L Marazita, L M Ploughman, B Rawlings, E Remington, K S Arnos and W E Nance. Genetic epidemiological studies of early-onset deafness in the US school-age population. American Journal of Medical Genetics 46, 486-491, 1993 M Marschark and M D Clark (ed), Psychological Perspectives on Deafness, Volume 2, Lawrence Erlbaum Assoc, 1998 M. Martin. Speech Recognition and Hearing Impairment. COST 219 Seminar ‘Speech and Hearing Technology’, Cottbus, Germany, November 2000 A Martini (ed). European Working Group on genetics of hearing impairment, European Commission Directorate, Biomedical and Health Research Programme (HEAR) Infoletter 2, November 1996 www.gendeaf.org L McKenna. Psychological aspects of acquired hearing loss. In Ballantyne’s Deafness (Sixth edition), ed J Graham and M Martin, 2001 P E Mohr, J J Feldman and J L Dunbar. The societal costs of severe to profound hearing loss in the United States. Project Hope Center for Health Affairs, H Series 2(1), April 2000a. P E Mohr, J J Feldman, J L Dunbar, A McConkey-Robbins, J K Niparko, R K Rittenhouse and M W Skinner. The societal costs of severe to profound hearing loss in the United States. International Journal of Technology Assessment in Health Care, 16(4), 1120-1135, 2000b R L Mowry. Quality of life indicators for deaf and hard of hearing former VR clients. J of Rehabilitation of the Deaf 21(3), 1-7, 1988 C Mulrow , C Aguilar, J Endicott et al. Association between hearing impairment and quality of life of elderly individuals J. American Geriatics Society 38, 45-50, 1990a 177
  • 178.
    178 C Mulrow, CAguilar, J Endicott et al. Quality of life changes and hearing impairment. Annals of Internal Medicine 3, 188-194, 1990b C Mulrow , M Tuley and C Aguilar. Sustained benefits of hearing aids. J. Speech and Hearing Research 35, 1402-1405, 1992 National Centre for Health Statistics. Series 10, no 205, 1998 National Center on Hearing Assessment and Management, www.infanthearing.org. The National Council on the Aging. The consequences of untreated hearing loss in seniors, May 1999. National Deaf Children’s Society. Understanding Deafness, January 2003. National Institute for Clinical Excellence. Technology appraisal guidance no 8: Guidance on hearing aid technology. July 2000 (now withdrawn) National Institute on Deafness and Other Communication Disorders (NIDCD). Statistics on Hearing. www.nidcd.nih.gov/health/statistics/hearing.asp J K Niparko, A K Cheng and H W Francis. Outcomes of cochlear implantation: assessment of quality of life impact and economic evaluation of the benefits of the cochlear implant in relation to costs. In J K Niparko (ed) Cochlear implants – principles and practices, Lippincott Williams and Wilkins, 2000. A S Niskar, S M Kieszak, A Holmes, E Esteban, C Rubin and D J Brody. Prevalence of hearing loss among children 6 to 19 years of age. The third national health and nutrition examination survey. J. American Medical Association 279(140, 1071-1075, 1998. W Noble. What is a psychosocial approach to hearing loss? Scandinavian Audiology 25, Supplement 43, 6-11, 1996 Office of Hearing Services. Client satisfaction and hearing aid survey. Government Department of Health and Ageing, Australia, October 2001 Office of Hearing Services. Top-up survey. Government Department of Health and Ageing, Australia, October 2002 G. O’Neill. Hearing loss –a growing problem that affects quality of life. Profile 2. National Academy on an Aging Society, December 1999. www.agingsociety.org H Oyer and E Oyer. Social consequences of hearing loss for the elderly. Allied Health and Behavioural Sciences 2(2), 123-138, 1979 C Palmer, J Niparko, R Wyatt, M Rothman and G Lissovoy. A prospective study of the cost-utility of the multichannel cochlear implant. Arch. Otolaryngol. Neck Head Surgery 125, 1221-1228, 1999 178
  • 179.
    179 A Parving, PSibelle and H West. An audit of hearing aid quality in Denmark. British J. of Audiology 26(4), 239-244, 1992 A Pearson, Consultant in museum education and disability issues. Personal communication, 2003. M M Popelka, K J Cruickshanks, T L Wiley, T S Tweed and B E K Klein. Low prevalence of hearing aid use among older adults with hearing loss: the epidemiology of hearing loss study. J American Geriatric Society 46, 1075-1078, 1998 A Quaranta, G Assennato and V Sallustio. Epidemiology of hearing problems among adults in Italy. Scandinavian Audiology 25, Suppl 42, 7 –11, 1996 P Rabbit. Mild hearing loss can cause apparent memory failures which increase with age and reduce with IQ. Acta Otolaryngologia Suppl 476, 167-176, 1991 P W Ries. Prevalence and characteristics of persons with hearing trouble: United States 1990-1991. National Center for Health Statistics, Series 10. No 188, 1994 RNID. Breaking the sound barrier. Can you hear us? Deaf people’s experience of social exclusion, isolation and prejudice. RNID, 1999 RNID. Deafness, employment and discrimination, 2000 RNID. (W Bradshaw) The employment situation and experiences of deaf and hard of hearing people. May 2002. RNID. Facts and figures on deafness and tinnitus. January 2003. www.rnid.org RNID. The experience of employers – research into deafness and employment. RNID, 2002 T Robillard and M Gillain. Hearing aids: statistical study and satisfaction survey of patients in an ENT practice. Acta Oto-rhino-laryngologica Belg. 50, 115-120, 1996 U Rosenhall, K Pedersen and M B Moller. Self-assessment of hearing problems in an elderly population. Scandinavian Audiology 16, 211-217, 1987 U Rosenhall, R Jonsson, A Davis and A Parving. Hearing in the ‘oldest old’ – a cross-sectional collaborative study from three European countries. J Audiological Medicine 9(1), 43-52, 2000 R J Ruben. Redefining the survival of the fittest: communication disorders in the 21st century. Laryngoscope 111(6), 1115-1116, 2001 D Rutman. The impact and experience of adventitious deafness. American Annals of Deafness 134, 305-311, 1989 179
  • 180.
    180 G Salomon, VVesterager and M Jagd. Age related hearing difficulties. I. Hearing impairment, disability and handicap – a controlled study. Audiology 27, 164-178, 1988 J Schein and M Delk. The deaf population of the United States. National Association of the Deaf, 1974 D J Schum. Perceived hearing aid benefit in relation to perceived needs. J American Academy of Audiology 10, 40-45, 1999 P Sibelle and A Parving. An audit of hearing aid quality in Denmark II: type of defects. British J. of Audiology 28(3), 141-148, 1994 L Smeeth, A E Fletcher, E S Ng, S Stirling, M Nunes, E Breeze, C Bulpitt, D Jones and A Tulloch. Reduced hearing, ownership, and use of hearing aids in elderly people in the UK – the MRC trial of the assessment and management of older people in the community: a cross-sectional survey. The Lancet 359, 1466-1470, 2002 A W Smith. The World Health Organisation and the prevention of deafness and hearing impairment caused by noise. Noise and Health 1, 6-12, 1998 M Sorri, B Brorsson, A David, I Mair, K Myhre, A Parving, R Roine, U Rosenhall and S Stilven. Hearing impairment among adults. Report of a joint (Nordic-British) project. Finnish Office for Health Care Technology Assessment, Helsinki, 2001. S D G Stephens, L J Barcham, A L Corcoran and N Parsons. Evaluation of an auditory rehabilitation scheme. In IG Taylor and A Markides (eds) Disorders of auditory function III, London: Academic Press, 1980 S D G Stephens, P A Lewis, M C Charny, S C Farrow and M Francis. Characteristics of self-reported hearing problems in a community survey. Audiology 29, 93-100, 1990 S D G Stephens, R Meredith, D E Callaghan, S Hogan and A Rayment. Early intervention and rehabilitation: factors influencing outcome. Acta Otolaryngology Suppl 476, 221-225, 1991 A Q Summerfield and D H Marshall. Cochlear implantation in the UK 1990 – 1994. London: HMSO, 1995 A Q Summerfield, D H Marshall, G R Barton and K E Bloor. A cost utility analysis of bilateral. cochlear implantation. Arch. Otolaryngol. Neck Head Surgery 128, 1255- 1262, 2002 R K Surr, G I Schuchman and A A Montgomery. Factors influencing use of hearing aids. Arch Otolaryngol 104, 732-736, 1978 A Thomas and K G Herbst. Social and psychological implications of acquired deafness for adults of employment age. British J. of Audiology 14(3), 76-85, 1980 180
  • 181.
    181 S Uimonen, KHuttunen, K Jounio-Ervasti and M Sorri. Do we know the real need for hearing rehabilitation at the population level? Hearing impairments in the 5- to 75- year old cross-sectional Finnish population. British J Audiology 33(1), 53-59, 1999 V Vesterager, G Salomon and M Jagd. Age related hearing difficulties. II. Psychological and sociological consequences of hearing problems – a controlled study. Audiology 27, 179- 192, 1988 V Vesterager and G Salomon. Psychosocial aspects of hearing impairment in the elderly. Acta Otolaryngologia Suppl 476, 215-220, 1991 M I Wallhagen, W J Strawbridge, R D Cohen and G A Kaplan. An increasing prevalence of hearing impairment and associated risk factors over three decades of the Alameda County study. American Journal of Public Health 87(3), 440-442, 1997. P Walsh, L Sanchez, A Davis, G Tucker, D Wilson, A Taylor and Meagher. The epidemiology of hearing impairment in an Australian adult population. International J Epidemiology 28(2), 247-252, 1999 B Weinstein and I Ventry. Hearing impairment and social isolation in the elderly. J. Speech and Hearing Research 25, 593-599, 1982 T L Wiley, K J Cruickshanks, D M Nondahl and T S Tweed. Self-reported hearing handicap and audiometric measures in older adults. J American Academy of Audiology 11, 67-75, 2000 B Y K Wong, Y Hui and A W Wei. Economic evaluation of cochlear implantation. In C S Kim, S O Chang, D Lim (eds) Updates in cochlear implantation. Adv Otorhinolaryngol. 57, 377-381, Basel, Karger 2000. World Health Organisation. Facts about deafness www.who.int/pdb/deafness/facts World Health Organisation. Report of informal working group on Prevention of Deafness and Hearing Impairment Programme planning, WHO Geneva, 1991. World Health Organisation. Report of the first informal consultation on future programme developments for the Prevention of Deafness and Hearing Impairment. WHO, Geneva, January 1997. World Health Organisation. Guidelines for Community Noise, 1999 World Health Organisation. Deafness and Hearing Impairment Survey. Report of consultative meeting of principal investigators, WHO Project ICP DPR 001, New Delhi, July 2001. www.who.org World Health Organisation. Prevention of deafness and hearing impairment. April 2002, www.who.org J R Wyatt and J K Niparko. Evaluating the cost effectiveness of hearing rehabilitation. In C W Cummings, J M Frederickson, L A Harker, C J Krause and D E 181
  • 182.
    182 Schuller (eds): Otolaryngology– Head and Neck Surgery Update, 2nd edition, St Louis, Missouri:Mosby Year Book Inc, 112-125, 1995 J R Wyatt, J K Niparko, M Rothman and G deLissovoy. Cost-utility of the multichannel cochlear implant in 258 profoundly deaf indivduals. Laryngoscope 106, 816-821, 1996 182
  • 183.
    183 APPENDIX I PREVALENCE OF HEARING IMPAIRMENT AMONG CHILDREN AND YOUNG ADULTS A1.1 Introduction The main report is concerned with aspects of hearing loss among adults. However, in the course of the research some related literature concerning prevalence among children and young adults has been reviewed, and is summarised in this Appendix. It should be noted that this does not represent an exhaustive search of the literature concerning prevalence of hearing impairment among children and young people. There is a great deal of literature on this topic of which only a small sample is reviewed here. However, it is relevant to the discussion in the main report on prevalence among adults as hearing impaired children grow into hearing impaired adults. Also the introduction of neo natal screening for hearing loss will enable more accurate predictions of the numbers of hearing impaired adults in the future. Most of the data that is presented here is from studies in the US and UK, but it is assumed that similar figures would apply to Europe. A1.2 Babies and children in the US Data from the US suggest that hearing loss is the most commonly occurring birth defect affecting three out of every 1000 newborn babies (National Center on Hearing Assessment and Management (NCHAM)). Of these, 1 in 1000 (that is 33 per day) are born profoundly deaf and the remainder have partial hearing loss (American Academy of Audiology). It is reported that over 12,000 babies in the US leave hospital each year with undetected hearing loss, and that 500,000 young children develop profound hearing loss before learning a spoken language (Hear This Organisation, 2002). Approximately 1,465,000 individuals aged 3 and over are deaf in both ears (ASHA). Marazita et al (1993) report that in the US, profound early-onset deafness is present in 4-11 per 10,000 children. Children's deafness is attributable to sporadic causes in 37.2% of cases and genetic causes in 62.8% of cases. The ASHA website reports data from several sources on prevalence of hearing loss among children. It is estimated that over 1 million children, that is 5% of children aged 18 and under, have some form of hearing loss. One in every 1000 infants born has severe or profound hearing loss (NIDCD) while 83 out of every 1000 children have hearing loss sufficient to affect their education. Earlier research published in 1974 reported severe to profound hearing loss in about 9 of every 1000 school age children (Schein and Delk, 1974). ASHA also cites research (Berg, 1985; Lundeen, 1991) which shows that among every 1000 school age students in US seven have bilateral and 16 to 19 have unilateral hearing loss that may significantly interfere with their education. Detailed breakdown of statistical data on hearing impairment among young people is provided by the annual survey of deaf and hard of hearing children and young people carried out each year by the Gallaudet Research Institute (GRI). The most recent 183
  • 184.
    184 published data isthat for the year 2001-2002, which considers statistics relating to 42,361 hearing impaired students (GRI, 2001). The age distribution of hearing impairment among this age group for 2001-2002 is shown in Table A1.1 (information available for 41,597 students). Table A1.1 Age distribution of hearing impaired students (GRI, 2001) Age (years) <3 3-5 6-9 10-13 14-17 ≥ 18 Number 1063 3764 9347 12062 11253 4108 Percentage 2.6 9.0 22.5 29.0 27.1 9.9 The degree of hearing loss (out of a total of 36,701 students for whom information was available) from the GRI data is shown in Table A2.2. Table A2.2 Hearing loss distribution of hearing impaired students (GRI, 2001) Moderate Hearing loss Normal Mild Moderate Severe Profound -severe dB HL < 27 27-40 41-55 71-90 ≥ 91 56-70 Number 5945 4307 4714 4446 5681 11608 Percentage 16.2 11.7 12.8 12.1 15.5 31.6 Note that the biggest percentage of students taking part in this survey is profoundly deaf. Information on the frequency characteristics of hearing loss common among children is provided by Niskar et al (1998) who report the results of audiometric screening of 6166 children aged 6 to 19 between 1988 and 1994. Hearing loss was defined as an audiometric threshold value of at least 16 dB hearing level based on a low or high pure tone average. 14.9% of children were found to have low frequency or high frequency loss, 7.1% had low frequency loss and 12.7% high frequency loss. Most hearing loss was unilateral and slight in severity, from 16 to 25 dB. A1.3 Babies and children in the UK In the absence of a national register of hearing impaired children in the UK it is thought that studies carried out prior to 1998 have underestimated their number (Fortnum et al, 2001). Figures currently published in the UK show that around 20,000 children aged 0 – 15 years are moderately to profoundly deaf (RNID, 2003). Of these, around 12,000 are born deaf, that is, they are prelingually deaf, and so have special educational needs. It is suggested that 840 children with moderate to profound deafness are born every year in the UK, and that the total number of deaf children and young people is over 30,000. The RNID also states that around 1 in 1000 three year olds are deaf and that this number rises to 2 in every 1000 at age nine to sixteen. These figures appear to be based upon the work of Fortnum et al (2001) who in 1998 carried out a large scale study of the prevalence of hearing impairment among children in the UK. This study involved surveying over 17,000 cases of children aged 16 and under with permanent 184
  • 185.
    185 childhood hearing impairment(defined as a hearing level in the better ear, averaged over 0.5, 1, 2 and 4 kHz) of more than 40 dB HL. From their study Fortnum et al estimate the prevalence of hearing impairment to be 1.07% of three year olds, rising to 2.05% for children aged nine to sixteen. They conclude that the prevalence of confirmed hearing impairment among children increases until the age of 9 years. Possible reasons for the increase are non-diagnosis in early screening; post natal acquisition of hearing impairment; and (most likely) late onset of progressive hearing impairment. For every ten children diagnosed at birth they estimate that another five to nine will be identified with hearing impairment by the age of nine. A1.2 Screening for hearing loss In both the US and UK newborn hearing screening programmes have gradually been introduced in recent years. In 1993 the National Institute of Health recommended that all infants in the US should be screened for hearing impairment; ideally this should be accomplished by screening before newborn babies leave hospital (NCHAM). Screening is currently required by legislation in 37 states, of which it has been implemented in over 20; this number is increasing. The NCHAM presents data from the universal newborn hearing screening (UNHS) programme on the numbers of newborn babies and percentages screened in each state. Data for January 2003 (published May 2003) showed that percentages varied from 57.7% of newborn babies screened in California to 99.5% in Washington DC. Of the total number of babies (4,025,933) born in 2002, 86.5% were screened for hearing impairment. This compares with only 22% of babies being screened before they were 1 month old in 1998 (American Academy of Audiology). Universal newborn hearing screening has also been started by the UK Department of Health with pilot implementation in seventeen areas (Davis et al, 2001). The scheme is intended to cover all areas by 2005 (National Deaf Children’s Society, 2003). However, Davis et al (2001) consider that more effective screening of school age children from aged from four to sixteen in the UK is required. It has been found since the introduction of screening in the US that previous estimates of the numbers of babies born with hearing loss were inaccurate. The previous standard estimate was of 1 in 1000 live births with congenital hearing loss whereas, as seen above, current estimates based on more recent data suggest that the actual figure is 2 to 3 per 1000 live births (American Academy of Audiology). This number of course does not include children born with normal hearing who have late-onset or progressive hearing loss. A1.3 Age of identification of hearing loss In 1988, before the widespread introduction of newborn screening in the US, the Commission on Education of the Deaf, in a report to Congress and President, found that the average age of identification of hearing loss was 2.5 to 3 years of age. 185
  • 186.
    186 However many caseswere not identified until the age of 5 or 6, with consequent effects upon the development of language, social and cognitive skills, according to the NCHAM. More recent data published between 1987 and 1993 and cited by the NCHAM suggests that age of identification in that period has been reducing over the years to around 18 months. In the 2001-2002 survey of over 40,000 hearing impaired students carried out by the Gallaudet Research Institute (GRI, 2001) it is interesting to note that approximately 17,000 (42%) had been identified as hearing impaired at birth, and nearly 8000 (19.2%) under the age of 3 years. 186
  • 187.
    187 APPENDIX2 PREVALENCE DATA FROM EUROPEAN STUDIES A2.1 Introduction This Appendix presents a sample of the data on prevalence of hearing impairment from some of the studies reviewed in Chapter 3. A2.2 Prevalence of hearing impairment in UK (Davis, 1995) Davis (1995) presents the data from the National Study of Hearing according to many different categories, eg gender, age, occupation etc. Table A2.1 shows the prevalence of hearing impairment among all subjects (N = 2663) in all age groups, in 5 dB hearing loss bands. Tables A2.2 and A2.3 show a subset of the data for male (N = 1277) and female (N = 1386) subjects respectively. Table A2.1 Prevalence of hearing impairment among all subjects Threshold dB HL ≥ Age 0 5 10 15 20 25 30 35 40 45 50 55 65 75 85 95 18- 93.4 72.1 49.9 32.7 22.6 16.1 11.2 8.2 5.8 3.9 2.9 2.1 1.1 0.7 0.4 0.2 80 18- 82.6 43.0 18.7 6.9 2.6 1.8 0.6 0.4 0.2 0.2 0 0 0 0 0 0 30 31- 92.8 60.5 26.9 13.8 5.6 2.8 2.3 1.4 1.1 1.1 1.0 0.8 0.7 0.7 0.6 0.6 40 41- 97.4 74.6 48.3 25.2 13.5 8.2 6.0 4.0 2.3 1.7 1.2 0.7 0.3 0.3 0.1 0.1 50 51- 98.7 90.8 68.9 43.3 28.8 18.9 11.0 7.8 5.6 4.0 2.9 2.1 0.9 0.4 0.1 0.1 60 61- 100 97.7 86.3 65.1 50.8 36.8 25.3 16.2 10.7 7.4 5.7 4.1 2.3 1.4 1.0 0.6 70 71- 99.6 99.6 95.5 87.1 74.0 60.3 47.0 40.0 29.7 17.6 12.4 9.3 4.0 2.5 1.0 0.1 80 Table A2.2 Prevalence of hearing impairment among male subjects Threshold dB HL ≥ Age 25 30 35 45 55 18-80 17.9 12.2 8.8 4.0 2.3 18-30 0.6 0.1 0.1 0.1 0.1 31-40 2.5 2.5 1.6 1.3 1.1 41-50 9.6 6.9 4.4 1.8 0.5 51-60 24.6 14.1 10.3 5.4 2.8 61-70 44.8 31.3 19.6 9.2 4.8 71-80 67.7 49.2 41.5 15.4 10.2 187
  • 188.
    188 Table A2.3 Prevalence of hearing impairment among female subjects Threshold dB HL ≥ Age 25 30 35 45 55 18-80 14.6 10.3 7.8 3.7 1.9 18-30 2.9 1.2 0.6 0.3 0.0 31-40 2.9 2.0 1.2 0.8 0.4 41-50 7.1 5.2 3.8 1.7 1.0 51-60 12.9 7.9 5.3 2.6 1.5 61-70 28.6 18.6 12.9 5.5 3.3 71-80 55.5 45.5 38.7 18.7 9.1 A2.3 Prevalence of hearing impairment in Italy (Quaranta et al, 1996) Quaranta et al (1996) give the prevalence of hearing impairment among 2170 adults, according to age group, for the better and worse ears. The prevalence according to BEHL is shown in Table A2.4. Table A2.4 Prevalence of hearing impairment in Italy according to age Better ear hearing Age group threshold ≥25 ≥45 ≥65 ≥90 18 – 30 1.85 0.56 0 0 31 – 40 3.89 1.11 0.56 0.28 41 – 50 8.29 1.46 0.49 0.24 51 – 60 18.73 4.13 1.38 0.28 61 – 70 37.66 6.65 2.85 1.27 71 - 80 69.44 21.11 4.44 0 Overall 17.05 4.01 1.20 0.32 A2.4 Changes in hearing from 80 to 90 years in Finland (Hietanen et al, 2004) Hietanen et al (2004) reported results of a 10 year longitudinal study to investigate changes in hearing in people aged 80 at start. Hearing was tested three times at five year intervals. Tables A2.5 and A2.6 show the distributions of grades of hearing impairment at ages 80, 85 and 90, analysed cross sectionally (Table A2.5) and longitudinally (Table A2.6). Table A2.5 Grades of hearing impairment (cross sectional analysis) Hearing impairment category Severe- None Mild Moderate profound M F M F M F M F 80 (n=202) 1.8 13.1 43.9 56.6 50.9 28.3 3.5 2.1 85 (n=91) - 10.6 24.0 33.3 64.0 53.0 12.0 3.0 90 (n=42) - 3.0 11.1 24.2 88.9 72.3 - - 188
  • 189.
    189 Table A2.6 Grades of hearing impairment (longitudinal analysis) Hearing impairment category Severe- None Mild Moderate profound M F M F M F M F 80 (n=36) - 11.1 55.6 63.0 44.4 25.9 - - 85 (n=36) - 11.1 33.3 37.0 66.7 51.9 12.0 - 90 (n=36) - 3.7 11.1 25.9 88.9 70.4 - - A2.5 Prevalence in Finland (Uimonen et al, 1999) Uimonen et al (1999) examined prevalence of hearing impairment among all age groups from 2 to 75. They classified their results according to both the 1991 WHO and the current EU grades, shown in Tables A2.7 and A2.8 respectively. Table A2.7 Prevalence as a function of age according to 1991 WHO classification BEHL Age N 26-40 41-60 61-80 group <=25 dB >=81 dB All HI dB dB dB 5 397 100 10 428 99.8 0.2 0.2 15 403 99.3 0.5 0.2 0.7 25 286 99.6 0.4 0.4 35 364 98.9 0.6 0.3 0.3 1.2 45 443 98.6 1.1 0.2 1.3 55 421 95.7 3.1 1.0 0.2 4.3 65 430 90.0 7.4 2.1 0.5 10.0 75 382 67.5 20.8 8.2 2.6 0.8 32.5 Table A2.8 Prevalence as a function of age according to EU classification Age BEHL N group <=20 dB 21-39 dB 40-69 dB 70-94 dB >= 95 dB All HI 5 397 98.7 1.3 1.3 10 428 99.8 0.2 0.2 15 403 99.0 0.5 0.2 0.2 0.9 25 286 99.3 0.4 0.4 0.8 35 364 98.1 1.7 0.3 2.0 45 443 93.5 6.1 0.5 6.6 55 421 84.1 14.0 1.7 0.2 15.9 65 430 62.7 31.2 5.8 0.2 37.2 75 382 35.5 45.1 16.7 2.7 64.5 189
  • 190.
    190 A2.6 Prevalence ina rural Danish population (Karlsmose et al, 1999) Karlmose et al (1999) report results of a questionnaire survey concerning perceived hearing problems, and audiometric surveys of a rural population aged from 31 to 50 in Denmark, shown in Tables A2.9 and A2.10. Table A2.9 Prevalence (%) of hearing problems as function of age and gender (in answer to question ‘Have you experienced any hearing problems in the last year?) Age group 31-40 41-50 31-50 All M F M F M F N=1392 N=339 N=368 N=329 N=356 N=668 N=724 No 85.5 91.0 76.6 88.8 81.1 89.9 85.7 Problems not restricting daily 12.7 6.5 19.5 8.4 16.0 7.5 11.6 activities Problems restricting daily 1.8 2.4 4.0 2.8 2.8 2.6 2.7 activities Table A2.10 Prevalence (%) of hearing impairment of different grades as function of age and gender Age group 31-40 41-50 31-50 All M F M F M F N=905 N=218 N=238 N=212 N=237 N=430 N=475 BEHL > 25 dB 7.3 1.3 18.4 3.8 12.8 2.5 7.4 at at least 2 freq BEHL >= 25 dB 1.8 1.3 8.5 2.5 5.1 1.9 3.4 BEHL >= 35 dB 0.9 0.4 2.4 0.4 1.6 0.4 1.0 BEHL >= 45 dB 0 0 0.5 0.4 0.2 0.2 0.2 A2.7 Prevalence in Sweden (Johanssson and Arlinger, 2003) Johanssson and Arlinger (2003) present their results of an audiometric survey in two different formats, according to age and gender. Table A2.11 gives prevalence in terms of BEHL ranges (the authors also give WEHL results), while Table A2.12 gives the data classified according to the European grades of hearing loss. Table A2.11 Prevalence in terms of BEHL ranges Age All 20-50 50-60 60-70 70-80 BEHL M F M F M F M F M F >= 25 dB 1.5 1.7 14.5 8.0 42.6 42.1 74.5 73.1 16.6 17.2 >= 35 dB 0.8 0.0 5.8 4.0 17.0 8.8 41.8 44.6 7.9 7.5 >= 45 dB 0.0 0.0 1.4 0.0 6.4 5.3 21.8 21.4 3.3 3.4 >= 65 dB 0.0 0.0 0.0 0.0 0.0 0.0 1.8 1.8 0.2 0.2 190
  • 191.
    191 Table A2.12 Prevalence according to European grades of hearing loss. Age All 20-50 50-60 60-70 70-80 BEHL M F M F M F M F M F Mild 5.5 2.9 23.2 12.0 53.2 45.6 60.0 50.0 20.5 16.2 Moderate 0.0 0.0 1.4 1.3 10.6 5.3 29.1 28.6 4.5 4.5 Severe 0.0 0.0 0.0 0.0 0.0 0.0 0.0 1.8 0.0 0.2 Profound 0.0 0.0 0.0 0.0 0.0 0.0 0.0 0.0 0.0 0.0 A2.8 Predicted prevalence of hearing impairment to 2025 (Davis, 1997) Davis (1997) estimated the numbers of hearing impaired people in the UK, US, world regions and continents according to severity and gender, for the years 1995, 2005, 2015 and 2025. Predictions for Europe were shown in Chapter 3, Table 3.23. Figures for 2005 to 2025 for the world, more and less developed regions are shown in Table A2.13. Table A2.13 Estimated numbers (to nearest million) of hearing impaired adults in world regions (adapted from Davis, 1997) Hearing threshold Region Year Gender ≥25 ≥35 ≥45 ≥65 ≥95 Male 295 150 78 26 7 2005 Female 267 156 85 25 4 Overall 562 305 163 51 11 Male 382 195 102 33 9 Whole 2015 Female 335 198 108 32 5 world Overall 717 393 209 65 14 Male 491 254 131 42 10 2025 Female 424 253 138 41 7 Overall 915 507 269 83 17 Male 92 49 26 8 2 2005 Female 96 62 36 11 2 Overall 188 111 61 19 3 More Male 106 57 30 10 2 developed 2015 Female 108 71 40 13 2 region Overall 214 128 71 22 4 Male 121 66 35 11 2 2025 Female 122 81 46 14 2 Overall 243 147 81 25 4 Male 203 101 52 18 6 2005 Female 170 93 50 14 2 Overall 373 194 102 32 8 Less Male 276 138 71 24 7 developed 2015 Female 228 127 68 19 3 region Overall 503 265 138 43 10 Male 170 188 96 31 8 2025 Female 302 173 92 27 4 Overall 673 360 187 58 13 191
  • 192.
    192 APPENDIX 3 SCALES USED IN ASSESSING PSYCHOSOCIAL EFFECTS OF HEARING IMPAIRMENT A3.1 Introduction In the studies reviewed in Chapters 4 and 5, many different methods have been used to assess the effects of hearing impairment. In some cases particular scales have been used to assess specific areas relating to the quality of life, for example physical or emotional health. Some of the scales used are ones previously developed for assessing general health welfare, or in other studies related to hearing; others are modifications of existing scales. Some authors have designed their own questionnaires for use in a particular survey. This appendix presents a summary of the most commonly used scales. The references given are to the papers reviewed in the main report that use the various scales; earlier papers in which the scale is defined or validated are cited in those papers. A3.2 Sickness Impairment Profile (SIP) (Bess et al, 1991) The SIP is a self-administered questionnaire consisting of 136 items which assess psychosocial functioning through questions relating to behaviour in various contexts. Individual items are weighted and grouped into 12 subscales as shown in Table A3.1 (Bess et al, 1991). These subscales are also combined as shown to give three main scales: physical, psychosocial and overall. Bess et al state that the SIP has been used in many studies to assess sickness related dysfunction, citing papers in the medical literature in which the scale was validated. The higher the SIP score the greater the functional impairment. Table A3.1 Main scales and subscales of the Sickness Impact Profile Main scales Subscales Physical Ambulation Mobility Body care and movement Psychosocial Social interaction Communication Alertness behaviour Emotional behaviour Additional independent measures Sleep and rest Eating Work Home management Recreation and pastimes Overall Combines all of the above subscales 192
  • 193.
    193 A3.3 Hearing Handicap Inventory for Elderly (HHIE) (Mulrow et al, 1990a, 1990b) This scale consists of a 25 item questionnaire, scored from 0 to 100, that assesses the emotional and social effects of hearing loss. A higher score represents greater handicap. The scale was originally developed to assess the benefits of hearing aids. A3.4 Quantified Denver Scale of Communication Function (QDS) (Mulrow et al, 1990a, 1990b) This scale also consists of a 25 item questionnaire, scored from 0 to 100, that assesses perceived communication difficulties due to hearing loss A higher score represents greater handicap. A3.5 Short Portable Memory Status Questionnaire (SPMSQ) (Mulrow et al, 1990a, 1990b; Carabellese et al, 1993) This scale is used to assess cognitive function, and consists of 10 items. It is scored from 0 to 10, a higher score representing greater dysfunction. A3.6 GDS Geriatric Depression Scale (GDS) (Mulrow et al, 1990a, 1990b) The GDS is a 15 item scale, scored from 0 to 15, that assesses affect (mood, or depression). A higher score represents greater dysfunction. A3.7 Self Evaluation of Life Function (SELF) (Mulrow et al, 1990a, 1990b; Carabellese, 1993) This is a large questionnaire, consisting of an overall scale of 54 items (scored from 54 to 216) that assesses six areas of functioning: physical disability, social satisfaction, symptoms of aging, depression, self-esteem, personal control. A higher score represents greater dysfunction. For example, on the social satisfaction sub scale, a score of 12 or less implies poor social relationships, 13-24 middle, and 25-36 high social satisfaction. A3.8 Nottingham Health Profile (NHP) (Grimby and Ringdahl, 2000; Erlandsson and Holgers, 2001) This questionnaire assesses Health Related Quality of Life, and is widely used as an outcome measure in health screening. It consists of two parts. Part I consists of 38 yes/no questions that reflect the degree of discomfort or distress within the dimensions of lack of energy (5 items), pain (8 items), emotional reactions (5 items), sleep (6 items), social isolation (6 items) and physical mobility (8 items). Each dimension is scored from 0 to 100, the higher scores in a particular dimension reflecting greater numbers and severity of problems. Part II of the NHP comprises seven yes/no statements referring to health related quality of life. The higher the value, the more impaired the quality of life. 193
  • 194.
    194 A3.9 Hearing Measurement Scale (HMS) (Weinstein and Ventry, 1982) The HMS scale quantifies a respondent’s perception of their situational difficulties arising from a hearing loss: their ability to hear and understand, their emotional response to their loss and their personal opinion of the hearing loss. A3.10 Comprehensive Assessment and Referral Evaluation (CARE) (Weinstein and Ventry, 1982) The CARE scale is used to assess social, emotional and physical problems of elderly individuals. It comprises 38 scales that measure various dimensions such as physical disorders, psychiatric disturbances and social problems. There are two scales to measure social isolation – the subjective isolation scale (19 items which assess constrictions in social networks, loneliness, reduced interest in leisure activities, desire to withdraw from others); and the objective isolation scale (31 items which assess the number of face to face contacts with friends and relatives and others; and involvement in leisure activities). The higher the score the more isolated the individual. A3.11 Beck’s Depression Inventory scale (BDI) (Carabellese et al, 1993) The BDI scale is used to measure mood. A score of 22 or less is ‘normal’; 23-44 is ‘low mood’; and 45-66 ‘very low’. A score above 22 is usually considered to be a reliable indication of clinically relevant low mood level. A3.12 Instrumental Activities of Daily Living scale (IADL) (Carabellese et al, 1993) The IADL scale is used to measure the functional status of older people. A score of 0 – 1 indicates that the individual is independent, while a score greater than 1 indicates dependency. A3.13 Communication Strategies Scale (CSS) (Hallberg, 1999) This scale is based upon a questionnaire designed to measure three types of coping strategies: maladaptive behaviour, verbal strategies, and nonverbal strategies. It consists of 25 items each of which is rated on a five point scale ranging from ‘almost never’ (1) to ‘almost always’ (5). Typical items are ‘One way I get people to repeat what they say is by ignoring them’ (maladaptive behaviour); ‘When I don’t understand what someone has said I ask them to repeat it’ (verbal strategy); and ‘When I must listen in a group, I try to sit where I’ll be able to hear better’ (non- verbal strategy). 194
  • 195.
    195 A3.14 Hearing Disabilityand Handicaps Scale (HDHS) (Hallberg, 1999) This scale is based upon a questionnaire designed to measure perceived handicap and disability. The questionnaire consists of 25 items on a four point rating scale from ‘seldom’ (1) to ‘always’ (4). There are four subscales: speech perception, non-speech sounds, interpersonal distress and threat to self image. Examples of items include ‘Do you have difficulty following a conversation normally in any of the following situations: at work, in a bus or a car, or when shopping?’ (speech perception); ‘Do you have difficulties hearing the footsteps of someone coming into the room without seeing them?’ (non-speech sounds); ‘Do you feel that your hearing condition has an influence on the relationship you have with your spouse or a person close to you?’ (interpersonal distress); and ‘Do you ever get the feeling of being cut off from things because of your hearing difficulty?’ (threat to the self image). The summed scores of the speech perception and non-speech sounds categories are used to measure perceived disability, and the sum of the scores on the other two factors measure perceived handicap. A3.15 Conclusions The scales described here represent just a small sample of the myriad of scales that are used in the assessment of problems arising from hearing impairment. The diversity of scales used means that detailed, direct comparison of the outcome of different research projects can be difficult. However, as was seen in Chapter 5, the results obtained in the different projects, derived using a variety of scales, are on the whole very consistent and show similar trends relating to the psychosocial consequences of hearing loss. 195
  • 196.
    196 APPENDIX 4 SUMMARIES OF QUANTITATIVE STUDIES OF PSYCHOLOGICAL EFFECTS OF HEARING IMPAIRMENT A4.1 Introduction The following pages contain tabulated information on, and summaries of results from, the studies reviewed in Chapters 4 and 5. 196
  • 197.
    197 Subjects Author(s), date Results Number Ages HL (dB) Aids Controls Thomas and Herbst 211 total 16-64 16% 0- 39 dB All 410 Psychiatric disturbance 1980 (66%>50) 66% 40-69 dB wore matched 19% (cf 5% general population) 120 12% 70-89 dB aids 57% of those with >70 dB HL & sp discrim < 70% male 6% 90+ dB Health problems 28% (cf 13% controls) 91 Loneliness female 24% (cf 14% controls) Social isolation 40% (cf 25% controls) Difficulty making friends 40% (cf 15% controls) Lack of emotional support 45% (cf 26% controls) Left out of discussions at home 27% (cf 12% controls) Hearing problem not understood by those closest 42% Hearing problem not understood by spouse 52% Denial of problem to others 59% Bess, Lichtenstein, 153 > 65 30% 0-16 dB None No All SIP scales increased with increase in hearing loss Logan, Burger and 35% 17-25 dB Physical SIP scale from Nelson 25% 26-40 dB 3.3 (no HL) to 18.9 (HL>40 dB) 1989 10% > 40 dB Psychosocial scale from 4.0 (no HL) to 16.8 (HL>40 dB) Overall scale from 5.3 (no HL) to 17.1 (HL>40 dB) For each 10 dB increase in HL scales increase by 2.8 (physical) 2.0 (psychosocial) 1.3 (overall) Overall SIP scale is 13.4 for all subjects 17.1 for subjects with >40 dB HL (cf 2 – 3 for unimpaired adults) 197
  • 198.
    198 Subjects Author(s), date Number Ages HL (dB) Aids Controls Results Mulrow, Aguilar, 204 total > 64 60% 0- 40 dB None 98 Overall handicap score Endicott et al (mean 71) 32% 41-55 dB matched 52 (cf 22 controls) 1990a 106 HI 8% 56 -70 dB Social handicap score 26 (cf 11 controls) 98% male Emotional handicap score 27 (cf 11 controls) Communication problems score 62 (cf 40 controls) Depression score 3.3 (cf 2.9 controls) Overall life function 96 (cf 93 controls) Social and emotional dysfunction among HI subjects: 66% severe handicap 16% mild to moderate handicap 18% minimal/no handicap Mulrow, Aguilar, 188 70% 0- 40 dB None Social and emotional dysfunction Endicott et al 27% 41-55 dB 63% severe handicap 1990b 3% 56 -70 dB 20% mild to moderate handicap Moderate communication difficulties 85% of subjects Depression 23% of subjects Carabellese, 1192 70-75 HI based upon HI no Can Depression score Appollonio, Rozzini hearing test aids extrapolate Low 34% (cf 26% controls) et al 131 visually (ability to hear to give Very low 11% (cf 6% controls) 1993 impaired 3 random ‘hearing Dependent numbers) adequate’ 22% (cf 10% controls) 126 HI group of Cognition impaired (uncorrected 1068 6% (cf 3% controls) HL) Social relationships score Low 37% (cf 28% controls) Physical health scores Good 64% (cf 69% controls) Borderline 32% (cf 27% controls) Poor 5% (cf 4% controls) 198
  • 199.
    199 Subjects Author(s), date Results Number Ages HL (dB) Aids Controls Gregory, Bishop and 82 Late Family communications Sheldon families teens/early 25% best with mother 1995 with deaf 20s 20% best with sibling child 5% best with father Gregory Dependence on families 1998 61 deaf 70% (of 20-21 yr olds) living with family children 50% (of 20-21 yr olds) needed help managing finances 40% unable to go to doctor alone Sibling relationships 42% got on well with siblings 32% got on quite well with siblings 20% got on with some siblings 2% did not get on with siblings Lack of family communication 80% experienced lack of communication Relationships with opposite sex 38% (over 21) had had no boy or girl friend RNID 1666 Deaf and hard Isolation and exclusion 1999 of hearing 71% feel isolated 39% avoid meeting new people 86% find public places difficult 59% think other people perceive them as stupid Prejudice and abuse 47% made fun of 47% ignored because of deafness 83% experienced impatience 63% patronised 20% victim of abuse 5% victim of violence Visits to doctor 23% leave doctor’s surgery ignorant of illness 32% need someone to interpret at doctor’s 16% avoid going to doctor 199
  • 200.
    200 Subjects Author(s), date Results Number Ages HL (dB) Aids Controls RNID 10,000 Deaf and hard 15% unemployed (cf 6% hearing population) 2000 of hearing 22% aged 25 to 45 unemployed (majority 70% prevented getting job because of deafness profoundly 68% seeking work is problem deaf) 52% denied training or education at work 74% promotion opportunities fewer than for others 60% hearing problems not understood by colleagues 38% seeking new job because of treatment at work 64% communication barriers at work 200
  • 201.
    APPENDIX 5 POPULATIONS OF EUROPEAN COUNTRIES A5.1 Countries in European Union Data for 1 January 2004 from Eurostat (europa.eu.int/comm/eurostat) Country Total population in 1000s Belgium 10396.0 Czech Republic 10211.5 Denmark 5397.6 Germany 82531.7 Estonia 1350.6 Greece 11041.1 Spain 42345.3 France 59900.7 Ireland 4027.5 Italy 57888.2 Cyprus 730.4 Latvia 2319.4 Lithuania 3445.9 Luxembourg 451.6 Hungary 10116.7 Malta 399.9 Netherlands 16258.0 Austria 8114.0 Poland 38190.6 Portugal 10474.7 Slovenia 1996.4 Slovakia 5380.1 Finland 5219.7 Sweden 8975.7 United Kingdom 59651.5 Total 456814.6
  • 202.
    202 A5.2 European countriesnot in European Union Data from www.nationmaster.com, taken from CIA World Factbook, December 2003, unless otherwise indicated. Country Total population Liechtenstein 33,900* Switzerland 7,318,638 Andorra 69,150 Moldova 4,439,502 Albania 3,582,205 Serbia and Montenegro 10,655,774 Romania 22,271,839 Macedonia 2,063,122 Ukraine 48,396,470** Croatia 4,422,248 Bosnia & Herzegovina 3,989,018 Belarus 10,322,151 Norway 4,552,300* Iceland 288,500* Total 122,404,817 *Figures from Eurostat ** July 2002 estimate Note: Turkey and Russia are partly in Europe but have not been included here. Georgia, Armenia and Azerbaijan are sometimes considered to be in Europe and also in Asia; they too have not been included. 202