Downloaded 30 times


![Washington Co Hazard Mitigation Plan
2012
Introduction
D EVELOPMENT P ATTERNS
Requirement §201.6(c)(2)(ii)(C): [The plan should describe vulnerability in terms of] providing a general description of land
uses and development trends within the community so that mitigation options can be considered in future land use
decisions.
As detailed in FEMA’s guidance, hazard mitigation plans should provide a general overview of land uses and types of
development occurring within each community participating in the plan. This can include existing land uses and
development densities in the identified hazard areas, as well as any anticipated future/proposed land uses, including
anticipated new development, and redevelopment, and anticipated annexation areas. This information is recommended
for mitigation plans because an analysis of development trends provides a basis for making decisions on the type of
mitigation approaches to consider, and the locations where these approaches can be implemented. This information can
also be used to influence decisions regarding future development in hazard areas.
FEMA suggests consideration of the following areas when analyzing development trends, and where possible, relevant data
was presented for each of the participating jurisdictions listed below.
Development trends, described both by amount and location of development
Differentiation of distinct land uses with unique densities
Location of future development, if any
Expected growth, if any
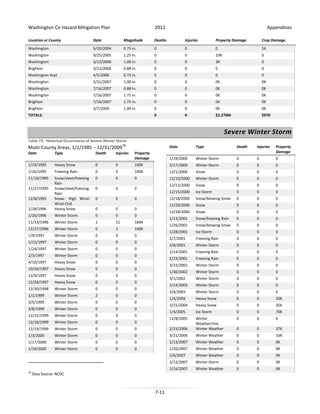
Also noted in this section are critical facilities. Critical facilities are essential to the health and welfare of the whole
population and are especially important following hazard events. Since vulnerability is based on service losses as well as
building structure integrity and content value, the loss of the following structures shown in the figures below would have a
proportionally greater impact for the participating jurisdictions. For purposes of this Hazard Mitigation Plan, Planning
Committee members in each participating jurisdiction identified the critical facility for each community. These facilities
include emergency service facilities such as hospitals and other medical facilities, jails, police and fire stations, emergency
operations centers, police and fire stations, public works facilities, evacuation shelters, schools, other centers that house
special needs populations, and facilities that provide necessary services, such as provision of food, gasoline, or
pharmaceutical supplies.
C OUNTY - WIDE
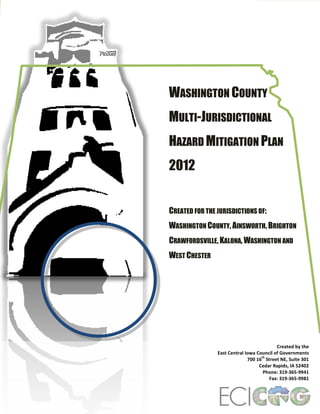
According to the Washington County 2008 Comprehensive Plan, approximately 4 percent of population growth has been in
1
the unincorporated areas of Washington County, which has led to increased housing developments. In addition,
Washington, Kalona, Riverside and Wellman have all experienced development over the past decade.
As discussed in the Community Profile section of this Hazard Mitigation Plan, the dominant land use in Washington County
is agriculture (68% of the County’s land area). Urban and residential areas account for just 2% of the County’s total land
area.
The following housing analysis comes from Washington County’s Comprehensive Plan:
1
Washington County 2008 Comprehensive Plan
1-9](https://image.slidesharecdn.com/hazardmitigationplan-131108002422-phpapp01/85/Hazard-mitigation-plan-13-320.jpg)


![Washington Co Hazard Mitigation Plan
2012
Planning Process
D OCUMENTATION OF THE P LANNING P ROCESS
Multihazard Requirement §201.6(b): An open public involvement process is essential to the development of an effective
plan.
Multihazard Requirement §201.6(b): In order to develop a more comprehensive approach to reducing the effects of natural
disasters, the planning process shall include:
(1)
An opportunity for the public to comment on the plan during the drafting stage and prior to plan approval;
(2)
An opportunity for neighboring communities, local and regional agencies involved in hazard mitigation
activities, and agencies that have the authority to regulate development, as well as businesses, academia
and other private and non-profit interests to be involved in the planning process; and
(3)
Review and incorporation, if appropriate, of existing plans, studies, reports, and technical information.
Multihazard Requirement §201.6(c)(1): [The plan shall document] the planning process used to develop the plan, including
how it was prepared, who was involved in the process, and how the public was involved.
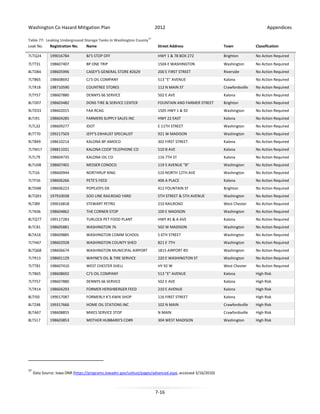
A CKNOWLEDGEMENTS
A number of people were involved in the creation of this plan. City staff, council members and citizens from Ainsworth,
Brighton, Crawfordsville, Kalona, Washington, and West Chester participated in the Planning Committees. Additional
Washington County staff from the offices of the Engineer, Public Health, Conservation, Emergency Management Agency,
Planning and Zoning, and the Board of Supervisors also were members of the Planning Committees.
The participating jurisdictions used either the Direct Representation Model or Authorized Representation Model depending
on the capabilities of the local jurisdiction. The City of Ainsworth selected the Authorized Representation Model to allow
the East Central Iowa Council of Governments (plan author) to represent their community. In this model, the consultant
drafted the plan, and presented the plan to the City Council for review and comment. The City Council then reviewed the
draft plan and made corrections and comments as necessary to meet the needs of their community. All other jurisdictions
selected the Direct Representation Model, and formed Planning Committees to guide the creation of the plan. Below is a
list of Planning Committee participants that assisted in the research, hazard analysis and risk assessment, and identification
of mitigation actions and recommendations for each jurisdiction.
A INSWORTH
C RAWFORDSVILLE
Teresa Hazelett, City Council
Troy McCarthy, City Council
Virginia Schuerman, City Council
Cheryl Smith, City Clerk
Keith Sollazzo, City Council
Dawn Stewart, Mayor
Gary Stewart, City Council
Brenda Davey, QRS and Resident
Jeremy Campbell, Assistant Fire Chief
Gene Miller, City Council
Amy Gardner, Resident
Vicki Reynolds, WACO Elementary Principal
Mike Massey, WACO Elementary Custodian
K ALONA
B RIGHTON
Larry E. Christenson, Planning & Zoning Chair
Karen Christner, City Clerk
Ryan Schlabaugh, City Administrator
Mike Bowlin, Public Works Director
Steve Yotty, Fire Chief
Jerry Zahradneh, Fire Department
Mark Schneider, Mid-Prairie School District
Lori TeBockhorst, Planning & Zoning, Hills Bank
Gregory Van Egdon, LHHP, LLP
Linda Burger, City Clerk
Robert Farley, Mayor
Bill Farmer, Fire Chief
Mel Rich, City Council – City of Brighton
Ron Rich, Assistant Fire Chief
Joe Sanner, Superintendent of Utilities
3-2](https://image.slidesharecdn.com/hazardmitigationplan-131108002422-phpapp01/85/Hazard-mitigation-plan-41-320.jpg)


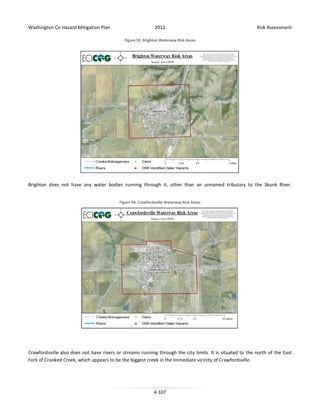
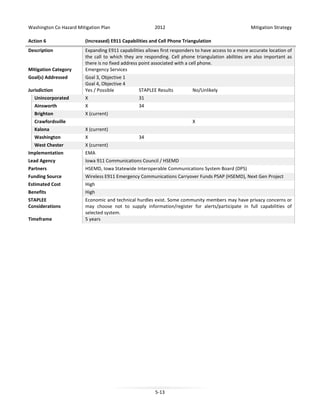
![Washington Co Hazard Mitigation Plan
2012
Risk Assessment
RISK ASSESSMENT: §201.6(c)(2): The plan shall include a risk assessment that provides the factual basis for activities
proposed in the strategy to reduce losses from identified hazards. Local risk assessments must provide sufficient information
to enable the jurisdiction to identify and prioritize appropriate mitigation actions to reduce losses from identified hazards.
Risk assessment, in the context of Hazard Mitigation Planning, is the process of identifying and profiling hazards that have
affected (or may affect) a participating jurisdiction. This process therefore provides the factual basis for the mitigation
actions proposed in the next section of this Hazard Mitigation Plan, insofar as it assesses the exposure of lives, property,
and infrastructure to the identified hazards. The risk assessment section of this document was completed using the 2007
State of Iowa Hazard Mitigation Plan (and updated with information from the 2010 Hazard Mitigation Plan when it became
available) as a guiding reference and was supplemented with resources provided by the Iowa Department of Homeland
Security and Emergency Management.
I DENTIFYING H AZARDS
Multihazard Requirement §201.6(c)(2)(i): [The risk assessment shall include a] description of the type … of all natural
hazards that can affect the jurisdiction.
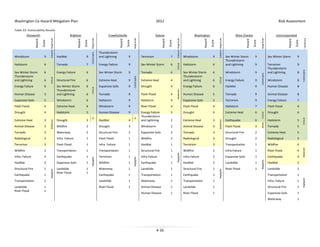
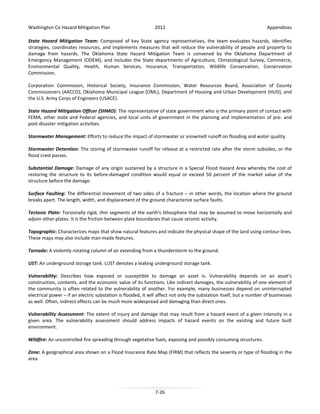
The Planning Committees of each participating jurisdiction reviewed a base list of hazards provided by the 2007 State
Hazard Mitigation Plan, and the list was later updated to reflect the 2010 plan. However, the determination was made to
retain the hazards of Energy Failure and Structural Fire, both of which were present in the 2007 plan and removed from the
2010 plan. The natural hazards in the State Plan are mandated by FEMA Region VII, while the other hazards were
determined by Iowa Homeland Security and Emergency Management Division to be applicable to Iowa as a whole. The
Planning Committees determined which of the hazards in the State Plan were applicable to their communities, and were
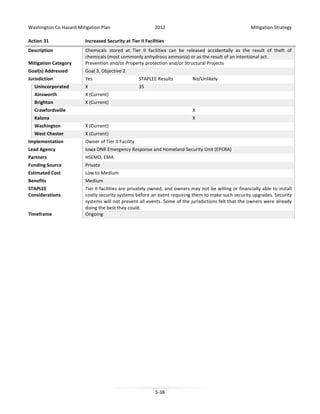
also given the option of adding additional hazards to the plan. Each of these hazards is listed alphabetically by hazard type
in the table below. An “X” indicates that the hazard could affect the jurisdiction, while “--” indicates that the event is not a
hazard to the jurisdiction.
West Chester
Washington
Kalona
Crawfordsville
Hazard
Brighton
Wash.Cty.
Ainsworth
Table 12: Hazards Addressed
--
--
--
--
--
--
--
Drought
X
X
X
X
X
X
X
Earthquake
Natural Hazards
Dam Failure
X
X
X
X
X
X
X
Expansive Soils
X
X
--
X
X
X
--
Extreme Heat
X
X
X
X
X
X
X
Flood - Flash
X
X
X
X
X
X
X
Flood - River
X
X
X
X
X
X
--
Hailstorm
X
X
X
X
X
X
X
Landslide
X
X
X
X
X
X
--
Levee Failure
--
--
--
--
--
--
--
Severe Winter Storm
X
X
4-2
X
X
X
X
X](https://image.slidesharecdn.com/hazardmitigationplan-131108002422-phpapp01/85/Hazard-mitigation-plan-49-320.jpg)


![Washington Co Hazard Mitigation Plan
2012
Risk Assessment
Data on the past occurrences and future probabilities of these hazards were collected from the following sources:
•
•
•
•
Iowa Hazard Mitigation Plan (September 2007)
Climate data from the National Climatic Data Center (NCDC) & the National Oceanic and Atmospheric Association
(NOAA)
Various articles and publications from multiple sources (all sources are cited in the text)
Mitigation Plan for Washington County, Iowa (done by Washington County Emergency Management Agency in
August, 2009)
Some hazards vary across the planning area. These hazards include river flood, flash flood, railway incidents, fixed
hazardous material incidents, and landslides. In Section 3 Part 6, each Hazard Profile lists the best available data on where
past events have occurred and discusses their impact on different jurisdictions where appropriate.
A SSESSING V ULNERABILITY
Requirement §201.6(c)(2)(ii): ]The risk assessment shall include a] description of the jurisdiction’s vulnerability to the
hazards described in paragraph (c)(2)(i) of this section. This description shall include an overall summary of each hazard and
its impact on the community.
This section provides a detailed discussion of the planning area’s vulnerability to the hazards identified. To determine what
populations or properties may be affected by a particular hazard event, the hazards discussed in the previous section are
summarized below in terms of the jurisdictions’ overall vulnerability to the hazard and its impact.
While this section is often included in mitigation plans after the hazard profiles are presented, the plan editor placed the
vulnerability analysis ahead of the hazard profiles so that the reader would have a better understanding of exactly what is
at risk when reviewing the hazards and their scores.
O VERVIEW
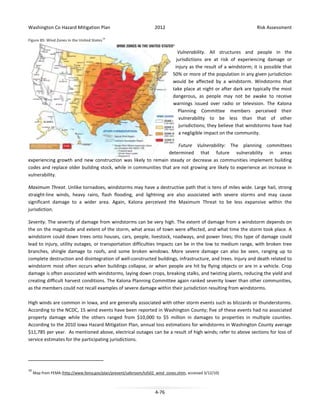
Below, each hazard is grouped according to whether or not it poses a risk of structural damage, and whether it has a
defined geographical risk area. Hazards with defined geographical risk areas (such as flood-related hazards or hazards
associated with certain soil types) will only occur in certain places due to geologic or hydrologic conditions, whereas other
hazards, such as weather-related hazards, could affect any or all parts of the entire town.
1 - Hazards with well-defined risk areas and with risk of structural damage:
Flash Flood, River Flood, Expansive Soils, Landslide
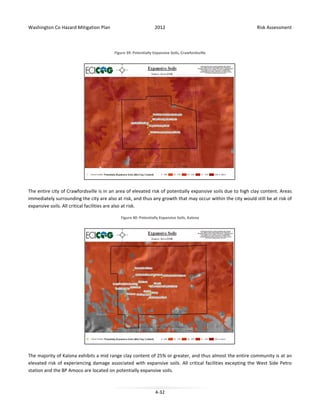
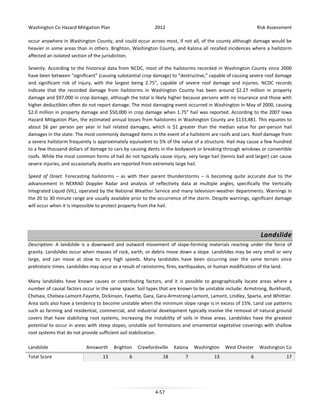
Vulnerability - People living, working, or otherwise being present inside these risk areas, as well as structures inside these
risk areas, are most vulnerable to the effects of these hazards. In general, there are relatively few area at risk of flooding in
Washington County. Of the participating jurisdictions, Kalona and portions of unincorporated Washington County (along
the Skunk River and the English River) are at greatest risk of flood damage. Similarly, there are relatively few area that are
susceptible to landslide. On the other hand, soils conducive to expansion through freeze-thaw cycles are prevalent
throughout Washington County.
Impact - While these hazards may have an extremely detrimental impact on lives and property in their path, the typical
occurrences of these hazards will not impact other people or property within the jurisdiction, except when a critical facility
4-5](https://image.slidesharecdn.com/hazardmitigationplan-131108002422-phpapp01/85/Hazard-mitigation-plan-52-320.jpg)


![Washington Co Hazard Mitigation Plan
2012
Risk Assessment
I DENTIFYING S TRUCTURES
Requirement §201.6(c)(2)(ii)(A): The plan should describe vulnerability in terms of the types and numbers of existing and
future buildings, infrastructure, and critical facilities located in the identified hazard area…
Hazard mitigation plans should describe vulnerability in terms of the types and numbers of existing and future buildings,
infrastructure and critical facilities located in the identified hazard areas. Thus, the next step in the planning process was to
determine who and what is at risk in the event that any of the selected hazards do occur. To determine this, the consultant
provided an overview of the potential property losses by assessment classification to provide information on potential
property losses and populations likely to be affected.
P OTENTIAL L OSSES
Requirement §201.6(c)(2)(ii)(B): [The plan should describe vulnerability in terms of an] estimate of the potential dollar
losses to vulnerable structures identified in paragraph (c)(2)(ii)(A) of this section and a description of the methodology used
to prepare the estimate…
Describing vulnerability in terms of dollar losses provides the communities and the State with a common framework in
which to measure the effects of hazards on vulnerable structures. Plans are encouraged to include an estimate of losses for
the identified vulnerable structures. This is intended to be a monetary estimate for each hazard including the value of the
structure, contents, and loss of function to present a full picture of the total loss for each asset.
As a guide, the hazard mitigation planning “Blue Book” recommends that structure loss is defined as a percentage of the
Replacement Value x Percentage of Damage. Content loss is defined as a percentage of the Replacement Value x
Percentage of Damage. Functional Losses are indirect effects that usually involve interruptions in asset operations. Because
the majority of mitigation projects fundable under the Stafford Act require a detailed Benefit Cost Analysis (BCA), FEMA
does have standard values available for calculating replacement value of contents and functional losses based on the type
and use of the structure in question.
Where data are limited, the guidance allows Planning Committees to select the most likely event for each hazard and
estimate the potential losses for that event. Because detailed historical records of loss values associated with many hazards
were unavailable, loss estimations have only been performed for the natural hazards identified in this plan.
In addition to data collected during the planning process, this plan also references the loss estimations completed for the
2007 Iowa Hazard Mitigation Plan. The State’s plan contains loss estimations completed by HSEMD for the 5 most common
natural hazards: flooding, tornadoes, windstorms, hailstorms and winter storms. These loss estimates were categorized by
type of damage where data was available. The primary source of data relating to weather patterns was the NCDC, and data
associated with flooding primarily came from the USACE Annual Flood Damage Report to Congress. Note that this data set
was compiled prior to 2007, and does not include severe winter storms in 2007-2008 and flooding in 2008.
The data below represent the 2009 assessed values and 2008 population estimate based on where people live rather than
where they work (or attend school). The Washington County Assessor’s office provided the data attached to the GIS parcel
layer for Washington County. The 2008 population estimate comes from the US Census. Values for most of the tax-exempt
structures were not available at this time, and further research could be done in an updated version of this plan to provide
values of these structures during an update. In addition, specific building type classifications were not available at this time,
but will be added should they become available when this plan is next updated. When interpreting the data above to
provide loss estimates for the jurisdiction in a worst-case scenario event, it is also useful to keep in mind that the assessed
4-8](https://image.slidesharecdn.com/hazardmitigationplan-131108002422-phpapp01/85/Hazard-mitigation-plan-55-320.jpg)


![Washington Co Hazard Mitigation Plan
2012
Risk Assessment
P ROFILING H AZARDS
Requirement §201.6(c)(2)(i): [The risk assessment shall include a] description of the … location and extent of all natural
hazards that can affect the jurisdiction. The plan shall include information on previous occurrences of hazard events and on
the probability of future hazard events.
Inclusion of a narrative of the location, extent, probability, and historical occurrences of the identified hazards is required in
the risk assessment section of Local Hazard Mitigation Plans. This Hazard Profile section therefore profiles in detail each
hazard that Planning Committee participants identified in Identifying Hazards (p. 4-2). The Hazard Profile includes a
description of the hazard, and also provides the results of the two-step Hazard Analysis / Risk Assessment (HARA) process:
Hazard Analysis: Narrative description of the historical occurrence, location, risk, and other relevant information relating to
each hazard, based on the results of research completed by the consultant.
Risk Assessment: The Committee discussed the results of the data collection and scored the hazards according to the
methodology recommended by Iowa HSEMD. This methodology using a scoring system that requires the Planning
Committee participants to rank each hazard based on the following six factors:
Historical Occurrence
Probability
Vulnerability
Maximum Threat
Severity of Impact
Speed of Onset
The process started by collecting data provided by the Iowa Homeland Security and Emergency Management Division,
made available to the public on their website. This data was then enhanced by research performed by the consultant, which
included web-based research, which included a review of data posted on sites such as NOAA, the NCDC, the Weather
Channel, FEMA, the Iowa DOT, and others (cited within text). This information was then presented to the committees, and
members added local data as necessary to complete the profiles.
Each factor and the rating scale the Committee used to assess the hazards’ risk to the community is described below:
HISTORICAL OCCURRENCE – Number of times that a hazard has occurred in the community in the past, within a 25-year
timeframe unless stated as otherwise.
Rating
1-2
3-4
5-6
7-9
Frequency
Rare
Occasional
Repeated
Recurring
Number of Historical Occurrences
< 4 occurrences
4-7 occurrences
8-12 occurrences
> 12 occurrences
PROBABILITY – Likelihood of the hazard occurrence, sometimes without regard to hazard history.
Rating
1-2
3-4
5-6
7-9
Likelihood
Unlikely
Occasional
Likely
Highly Likely
Frequency of Occurrence
< 1% probability in the next 100 years
>1% and <10% probability in next year, or at least one chance in the next 100 years
>10% and <100% probability in next year, or at least one chance in next 10 years
Near 100% chance in the next year
4-11](https://image.slidesharecdn.com/hazardmitigationplan-131108002422-phpapp01/85/Hazard-mitigation-plan-58-320.jpg)


![Washington Co Hazard Mitigation Plan
2012
Risk Assessment
messages, as well as the NOAA Weather Radio. The Committee noted that historically, people have usually had time to take
necessary precautions, such as sand-bagging, before a slower-moving river flood takes place.
ADDRESSING REPETITIVE LOSS PROPERTIES
Requirement §201.6(c)(2)(ii): [The risk assessment] must also address National Flood Insurance Program (NFIP) insured
structures that have been repetitively damaged floods.
Repetitive loss properties are those for which two or more losses of at least $1,000 each have been paid under the National
Flood Insurance Program (NFIP) within any 10-year period since 1978. Use of the flood insurance claim and disaster
assistance information is subject to The Privacy Act of 1974, as amended, which prohibits public release of the names of
policy holders or recipients of financial assistance and the amount of the claim payment or assistance. However, maps
showing areas where claims have been made can be made public, and are encouraged to be placed in mitigation plans. For
the purposes of preparing this plan, the consultant requested a list of partial addresses for repetitive loss properties located
in Washington County from HSEMD. At the time of plan preparation, there were no repetitive loss properties located in
Washington County.
Hailstorm
Description: A hailstorm is an outgrowth of a severe thunderstorm in which balls or irregularly shaped lumps of ice of
varying sizes fall with rain. Hail is produced by cumulonimbi (thunderclouds), normally at the front of a storm system. Hail
can be smaller than a pea or as large as a softball and can be very destructive to plants and crops. Hail is distinguished from
sleet or ice pellets because hail is formed in layers that accumulate as the hailstones move up and down within clouds. In
the United States, hail is commonly measured by comparison to round objects of various sizes. The chart below lists the
approximate size comparison between the objects and their actual size.
Table 42: Chart of Hail Size Comparisons
Object
Diameter
Object
Diameter
Pea
6.4 mm (0.25”)
Walnut
38 mm (1.5”)
Dime
17.9 mm (0.7”)
Golf ball
44 mm (1.7”)
Penny
19 mm (0.75”)
Tennis ball
64 mm (2.5”)
Nickel
21.2 mm (0.83”)
Cricket ball
71 mm (2.8”)
Quarter
24.26 mm (0.955”)
Baseball
73 mm (2.9”)
Half dollar
30.6 mm (1.2”)
Softball
114 mm (4.5”)
In the United Kingdom, the Tornado and Storm Research Organization (TORRO) has a scale for measuring hail that
associates hail size with damage. Although not widely used in this country, the comparison is still useful in determining the
risk associated with various sizes of hailstones.
4-55](https://image.slidesharecdn.com/hazardmitigationplan-131108002422-phpapp01/85/Hazard-mitigation-plan-102-320.jpg)


![Washington Co Hazard Mitigation Plan
2012
Mitigation Strategy
Requirement §201.6(c)(3): The plan shall include a mitigation strategy that provides the jurisdiction’s blueprint for reducing
the potential losses identified in the risk assessment, based on existing authorities, policies, programs and resources, and its
ability to expand on and improve these existing tools.
L OCAL H AZARD M ITIGATION G OALS
Requirement §201.6(c)(3)(i): [The hazard mitigation strategy shall include a] description of mitigation goals to reduce or
avoid long-term vulnerabilities to the identified hazards.
The mitigation strategy of this plan serves as the long-term blueprint for reducing the potential losses identified in the risk
assessment. This strategy should be based on existing authorities, policies, programs and resources, and its ability to
expand on and improve these existing tools. To provide an overall framework for the mitigation strategy, participating
jurisdictions are required to include a description of mitigation goals to reduce or avoid long-term vulnerabilities to the
hazards identified in the previous section of this plan. Mitigation goals are broad policy statements that explain what is to
be achieved, and along with the corresponding objectives, guide the development and implementation of mitigation
actions. These goals were mainly developed through meetings and discussion with the Planning Committees. The guiding
document for these goals was the State’s Hazard Mitigation Plan (2007). The Planning Committees also consulted other
local hazard mitigation plans from the area for guidance, including the Wellman single jurisdiction plan, as well as the
Winneshiek County and Jones County multi-jurisdictional hazard mitigation plans. In addition, guidance was also obtained
28
from FEMA Region 5’s “Mitigation Ideas .”
Goal 1: Protect critical facilities, infrastructure and other community assets from the impacts of hazards
Goal 2: Protect the health, safety and property of residents of the planning area
Goal 3: Improve education and awareness regarding hazards, risk and reducing vulnerability in the planning area
Goal 4: Ensure that public funds are used in the most efficient manner
The above goals are supported by the following mitigation objectives, which will serve as guidance during future project
development. The objectives are numbered as to correspond with the above goals.
Objective 1.1: The participating jurisdictions will engage in activities and practices that will help mitigate the impacts of
natural hazards
Objective 1.2: The participating jurisdictions will integrate mitigation principles into the capital improvements planning
process
Objective 2.1: The participating jurisdictions will work to prevent infrastructure extensions from occurring in hazardous
areas to reduce the risk of residents being subjected to unsafe conditions
Objective 3.1: The communities will strengthen communication between agencies and the public regarding risk reduction
Objective 3.2: The participating jurisdictions will inform the public of private-side risk reduction techniques and disaster
preparation
28
FEMA Region 5: Mitigation Ideas: Possible Mitigation Measures by Hazard Type (September 2002)
5-2](https://image.slidesharecdn.com/hazardmitigationplan-131108002422-phpapp01/85/Hazard-mitigation-plan-158-320.jpg)

![Washington Co Hazard Mitigation Plan
2012
Mitigation Strategy
I DENTIFICATION AND A NALYSIS OF M ITIGATION A CTIONS
Requirement §201.6(c)(3)(ii): [The mitigation strategy shall include a] section that identifies and analyzes a comprehensive
range of specific mitigation actions and projects being considered to reduce the effects of each hazard, with particular
emphasis on new and existing buildings and infrastructure.
The participating jurisdictions are required to identify and analyze a full spectrum of specific mitigation actions and projects
that would reduce the effects of the hazards discussed above. This analysis should include a discussion of how each
mitigation action would reduce the effects hazards on both new and existing development. Mitigation actions fall into six
broad categories: prevention, property protection, public education and awareness, natural resource protection, and
structural projects. Awareness of these six categories helped the Planning Committees generate and evaluate various
mitigation options. The six categories are as follows:
Prevention: Government, administrative or regulatory actions or processes that influence the way land and buildings are
developed and built. These actions also include public activities to reduce hazard losses. Examples include land use
regulations including zoning and subdivision ordinances, building codes, floodplain regulations, capital improvement
programs (if applicable), watershed planning, drainage district management, and storm water management regulations.
Property Protection: Actions that involve (1) modification of existing buildings or structures to protect them from a hazard
or (2) removal of the structures from the hazard area. Examples include acquisition, elevation, relocation, structural
retrofits, storm shutters, and shatter-resistant glass.
Public Education and Awareness: Actions to inform and educate citizens, elected officials, and property owners about
hazards and potential ways to mitigate them. Such actions include outreach projects, real estate disclosure, hazard
information centers, and school-age and adult education programs.
Natural Resource Protection: Actions that minimize hazard loss and also preserve or restore the functions of natural
systems. These actions include sediment and erosion control, stream corridor restoration, watershed management, forest
and vegetation management, and wetland restoration and preservation.
Emergency Services: Actions that protect people and property, during and immediately following, a disaster or hazard
event. Services include warning systems, emergency response services, and the protection of essential facilities.
Structural Projects: Actions that involve the construction of structures to reduce the impact of a hazard. Such structures
include dams, setback levees, floodwalls, retaining walls, and safe rooms.
The Planning Committees of each participating jurisdiction reviewed a comprehensive list of mitigation actions that were
29
derived from sources including FEMA recommendations and a review of existing hazard mitigation plans in Iowa. Table 57
lists all the mitigation actions that were considered by each community, and denotes the implementation status of the
action in each jurisdiction. The Planning Committees determined the following for each mitigation action: whether the
jurisdiction was currently implementing the mitigation action, might potentially implement the action, or was not at all
likely to implement the action. All mitigation actions that were categorized as having the potential to be implemented (and
could thus be labeled an ‘alternative strategy’) were selected and prioritized using the methods outlined and suggested by
Iowa Homeland Security and Emergency Management Division, as detailed to follow.
29
FEMA Region 5 - Mitigation Ideas: Possible Mitigation Measures by Hazard Type
5-4](https://image.slidesharecdn.com/hazardmitigationplan-131108002422-phpapp01/85/Hazard-mitigation-plan-160-320.jpg)

![Washington Co Hazard Mitigation Plan
2012
Mitigation Strategy
Washington
County
Brighton
Crawfordsville
Kalona
Washington
West Chester
Stormwater Management Ordinance
Structural Flood Mitigation Project
Study/Evaluate/Maintain current mitigation
projects
Subdivision Ordinances
System Improvements (sewer/wastewater)
Tree Maintenance Ordinance
Trim trees around power lines
Updated Floodplain Mapping & Studies
Ainsworth
Mitigation Action
P
P
P
P
P
P
P
P
N
N
P
N
P
P
P
P
P
N
N
P
N
C
P
P
C
C
N
P
P
C
C
N
P
C
C
C
N
N
C
C
C
C
P
P
C
C
C
P
C
C
C
N
P
P
C
C
C = mitigation action is currently implemented, P = mitigation action has the potential to be implemented, No = mitigation
action is not likely to be implemented for various reasons.
I MPLEMENTATION OF M ITIGATION A CTIONS
Requirement §201.6(c)(3)(iii): [The mitigation strategy section shall include] an action plan describing how the actions
identified in section (c)(3)(ii) will be prioritized, implemented, and administered by the local jurisdiction. Prioritization shall
include a special emphasis on the extent to which benefits are maximized according to a cost benefit review of the proposed
projects and their associated costs.
P RIORITIZATION OF M ITIGATION A CTIONS
After identifying the mitigation actions that the participating jurisdictions could potentially implement to mitigate the
effects of hazards, the actions must be prioritized in the order in which actions will be implemented. To accomplish this
step, the Planning Committees first subjected each potential mitigation action to a generalized Benefit-Cost Review.
Because each mitigation option would need to be specifically priced by an expert in that field in order to obtain an accurate
cost estimate, the cost analysis for the mitigation options is fairly broad. For the purposes of the planning process, the cost
analysis consisted of assigning each mitigation action to one of three cost categories:
High Cost: Existing funding levels are not adequate to cover the costs of the proposed project, and in some circumstances,
funding may only be available after a presidential disaster declaration. These are items anticipated to cost in excess of
$100,000. This amount was selected as it corresponds to a change in procurement policy under 44CFR.
Medium Cost: The project could possibly be implemented with existing funding but would require a reapportionment of
the budget or a budget amendment, or possibly a bond option. These items have an anticipated cost between $10,000 and
$100,000.
Low Cost: The project could be funded immediately under the existing budget, generally at levels under $10,000. Some low
cost options could be funded nearly entirely as volunteer or general office staff time projects.
The benefit analysis examines the short- and long-term impact the mitigation option would have on decreasing risk and
increasing ability to respond to events.
5-6](https://image.slidesharecdn.com/hazardmitigationplan-131108002422-phpapp01/85/Hazard-mitigation-plan-162-320.jpg)


![Washington Co Hazard Mitigation Plan
2012
Plain Maintenance
M ONITORING , E VALUATING , AND U PDATING T HE P LAN
Requirement §201.6(c)(4)(i): [The plan maintenance process shall include a] section describing the method and schedule of
monitoring, evaluating, and updating the mitigation plan within a five-year cycle.
The plan maintenance process includes a method and schedule for monitoring, evaluating, and updating the plan at least
every five (5) years. When the plan is updated, local jurisdictions assess how the Local Mitigation Plan maintenance process
worked and identify whether changes to the process are needed. Taking into consideration future updates, adjustments to
the method and schedule for maintaining the plan may be necessary to ensure its value for comprehensive risk reduction.
When the community prepares a plan update, the mitigation planning regulation at 44 CFR Part 201 requires that the plan
discuss how the community was kept involved during the plan maintenance process over the previous five years. This
discussion may take place within the planning process section of the plan update rather than the plan maintenance section.
The plan maintenance section is intended to be forward-thinking and emphasize future plan maintenance. Plan
maintenance has three main components:
Monitoring, Evaluating and Updating
Incorporation into Existing Planning
Continued Public Involvement
the Plan
Mechanisms
The plan will be monitored by the Washington County Emergency Management Agency. The plan will be evaluated by the
engineering staff using the worksheets in the attached appendix after every completed action step with a cost level of
medium, and will be updated every five (5) years unless the Planning Committee or EMA determines that an update is
needed sooner. To ensure that an update is completed on time, the EMA will reconvene the Planning Committee a
maximum of four (4) years after plan adoption to begin the review and update process.
Between updates, the lead departments should make note of any completed mitigation action steps, and the date by which
those steps were completed in a publically available copy of the adopted Local Multi-Hazard Mitigation Plan. Any member
of City or County staff or any member of the community may submit suggestions to the EMA for aspects of the plan that
may need to be changed. Additionally, a second opinion regarding monitoring or updates may be sought by contacting the
planning consultant or the East Central Iowa Council of Governments. The planning agency may also provide advice and
assistance in any grant projects that may result from implementation of the mitigation action steps.
During the review process, available representatives of the current Planning Committee and/or any additional interested
residents or new City or County staff will serve as the reviewing committee to retain as much institutional knowledge about
the planning process as possible. The review process should include an evaluation of the following:
• The effectiveness of the planning process
• The effectiveness of the City’s (or County’s) actions
• Progress made toward implementing the mitigation action steps
• Determination of the relative success of any implemented action steps
Additionally, the plan updates should include an evaluation of the plan, which will include a discussion of the following
items. This will be completed by the Planning Committee and/or a consultant selected by the County:
• How the goals and objectives address current and expected conditions.
• Whether the nature, magnitude, and/or type of risks have changed.
• If the current resources are appropriate for implementing the plan.
• Any implementation problems, such as technical, political, legal, or coordination issues with other agencies.
• Whether the outcomes have occurred as expected (a demonstration of progress).
• How the agencies and other partners participated as originally proposed.
6-2](https://image.slidesharecdn.com/hazardmitigationplan-131108002422-phpapp01/85/Hazard-mitigation-plan-213-320.jpg)
![Washington Co Hazard Mitigation Plan
2012
Plain Maintenance
The updated plan will also include a reviewed and/or revised recommendation on the method and schedule of plan
maintenance. After the above considerations are addressed by the Planning Committee and/or the selected consultant, the
EMA or the selected consultant resubmit the plan for approval.
I NCORPORATION INTO E XISTING P LANNING M ETHODS
Section §201.6(c)(4)(ii): [The plan shall include a] process by which local governments incorporate the requirements of the
mitigation plan into other planning mechanisms such as comprehensive or capital improvement plans, when appropriate.
Updates of this planning document will include a summary of any mitigation items that were incorporated into other
planning mechanisms. The Planning Committee or the selected consultant should particularly examine the following when
incorporating this document into existing planning mechanisms:
•
•
•
•
•
•
•
Updates to the floodplain maps or floodplain regulations.
Updates of the zoning code that may include additional regulations on building near identified hazard areas, which
may include steep slopes, unstable soils, special flood hazard areas, proximity of residential areas to
transportation, HAZMAT, flooding and other hazards.
Updates to the comprehensive plan that include the goals of the mitigation strategy or mitigation related goals.
Updates to the subdivision ordinance relating to setbacks on properties that pose a higher than average risk from
Infrastructure Failure, hazardous materials incident or fire.
Updates to the building code that may include adoption of a full set of building codes or adoption of more
stringent building codes.
Any new additions to the City/County Code or administrative policies that may include but are not limited to: solid
waste regulations, landscape codes, evacuation plans, response plans, fire mitigation programs, and construction
or retrofit programs.
An overview of how the information contained in the HARA was used in any other planning documents.
The above considerations and any others deemed appropriate will constitute part of the required explanation of how the
Cities and the County incorporated the mitigation plan into other planning mechanisms.
C ONTINUED P UBLIC I NVOLVEMENT
Requirement §201.6(c)(4)(iii): [The plan maintenance process shall include a] discussion on how the community will
continue public participation in the plan maintenance process.
Upon review and update of the plan, the participating jurisdictions will host a public strategic meeting to analyze public
opinion about the past mitigation plan and determine what additions may need to be made to the update. The exact details
of public involvement will be determined at the time the involvement is sought based on the number of jurisdictions
participating in the planning process at that time, growth trends and new facilities that may be constructed between now
and that time. However, appropriate methods of public involvement would include posting notices on public buildings and
other community facilities, circulating flyers, and posting proposed changes on the appropriate City/County website. This
information will be used by the Planning Committee and/or the selected consultant to guide the update of the plan. Upon
completion of a final draft of the plan update, the final draft will be made publically available at the participating
jurisdictions city halls or the County office for review and comment by the public, with a specifically noted end date for the
public comment period. Public comment shall be submitted to the EMA in writing before the end of the public comment
period or shall be delivered in person to the public meeting of the City Councils and County Board of Supervisors for formal
adoption of the revised plan.
6-3](https://image.slidesharecdn.com/hazardmitigationplan-131108002422-phpapp01/85/Hazard-mitigation-plan-214-320.jpg)


This document is the 2012 Washington County Multi-Jurisdictional Hazard Mitigation Plan created by the East Central Iowa Council of Governments for Washington County and the cities of Ainsworth, Brighton, Crawfordsville, Kalona, Washington, and West Chester. The plan is organized into seven chapters that outline the planning process, risk assessment, mitigation strategy and plan maintenance according to FEMA guidelines. The plan identifies and profiles natural, technological and human-caused hazards and assesses the vulnerability and potential losses for each jurisdiction. It establishes mitigation goals and prioritizes specific mitigation actions to reduce risks and prevent future losses from identified hazards.


