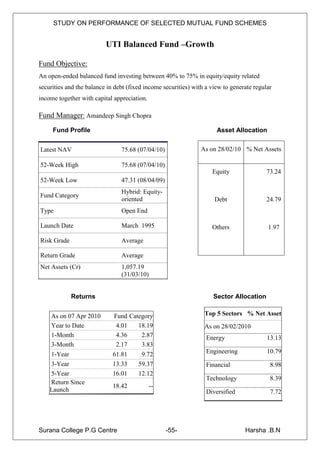
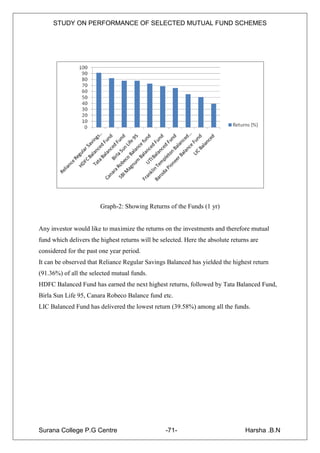
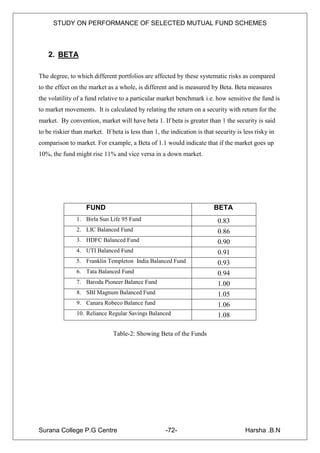
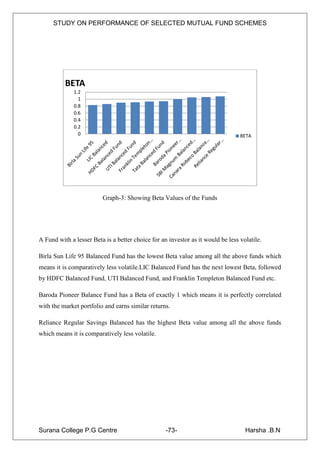
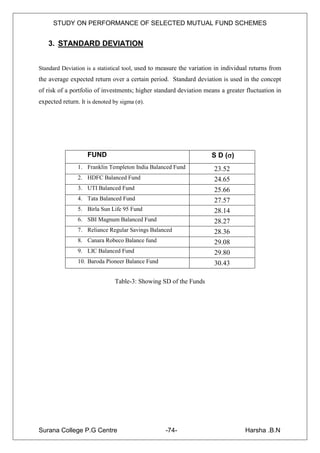
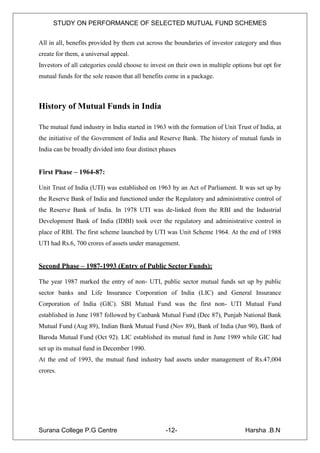
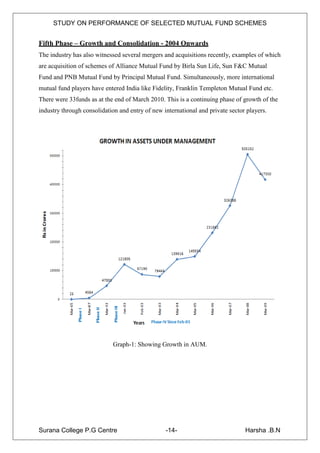
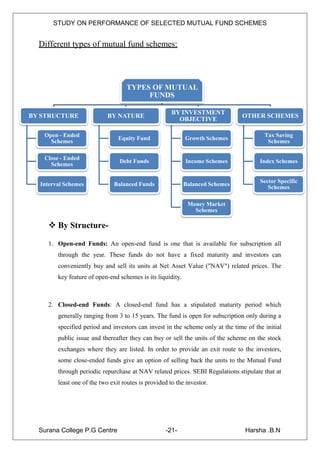
The document is a dissertation report on a study of the performance of selected mutual fund schemes. It includes an introduction that provides background on mutual funds in India, outlining their history and growth. It also describes the objectives and methodology of the study, which involves analyzing the risk and return performance of 10 balanced mutual fund schemes over one year. The executive summary previews the key findings on the funds' returns, risk levels, and performance rankings based on different measures.


![STUDY ON PERFORMANCE OF SELECTED MUTUAL FUND SCHEMES
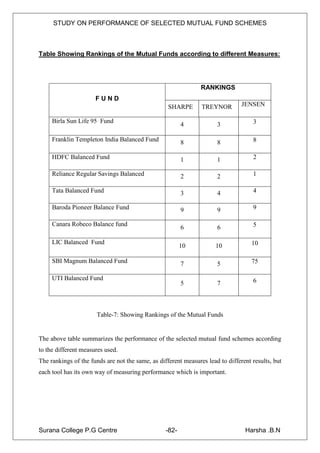
3. Sharpe index:
Sharpe index was given by WF Sharpe in 1966, it measures risk premium of a portfolio,
relative to the total amount for risk in the portfolio. Sharpe index summarizes the risk and
return of a portfolio in a single measure that categorizes the performance of funds on the risk-
adjusted basis. The larger the Sharpe Index, the portfolio over performance the market and
vice versa.
Portfolio Average Return (Rp) – Risk Free Rate of Interest (Rt)
Sharpe Index =
Standard Deviations of the Portfolio Return
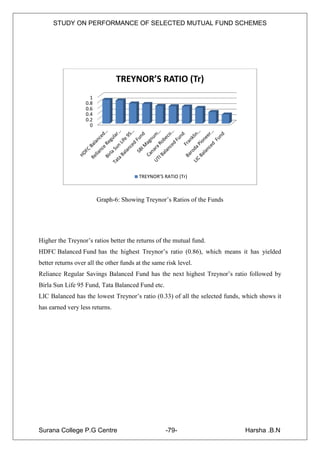
4. Treynor’s Index :
It was given by Jack Treynor in 1965, it is expressed as a ratio of returns to systematic risk
i.e., beta. It adjusts return based on systematic risk, therefore it is relevant for performance
measurement when evaluating portfolios separately or in combination with other portfolios.
Portfolio Average Return (Rp)-Risk Free Rate of Interest (Rt)
Treynor Index =
Beta Coefficient of Portfolio
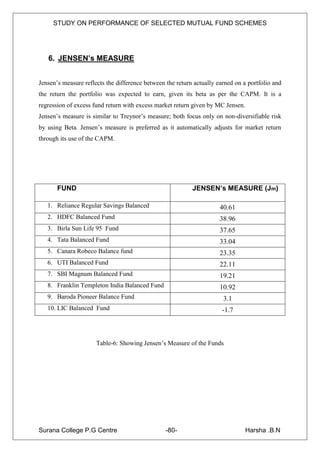
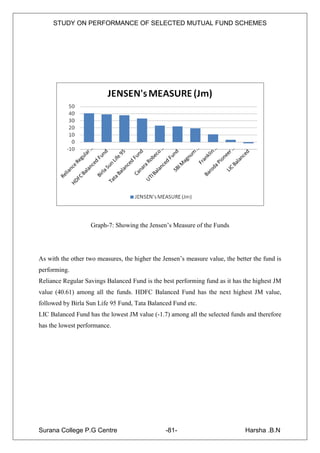
5. Jensen Measures:
It is a regression of excess fund return with excess market return given by MC Jensen in
1968. It is also popularly known as Jensen‟s alpha based on Capital Asset Pricing Model
(CAPM). It reflects the difference between the return actually earned on a portfolio and the
return the fund was expected to earn, given its beta as per the CAPM.
Ri = Rp-[Rf + Bp (Rm - Rf)]
Rm = Return on the market portfolio.
Rp = Portfolio‟s actual return during a specified time period
Rf = Risk-free rate of return during the same period
Bp = beta of the portfolio
Surana College P.G Centre -32- Harsha .B.N](https://image.slidesharecdn.com/harshaproject-100508111527-phpapp02/85/Harsha-project-32-320.jpg)