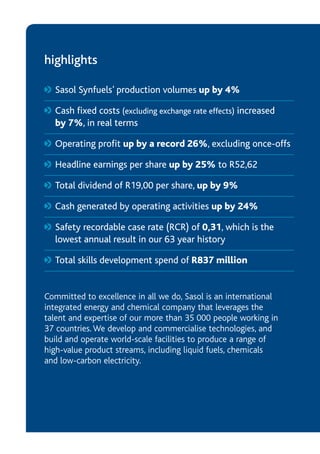
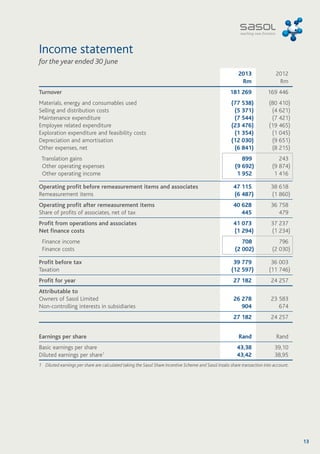
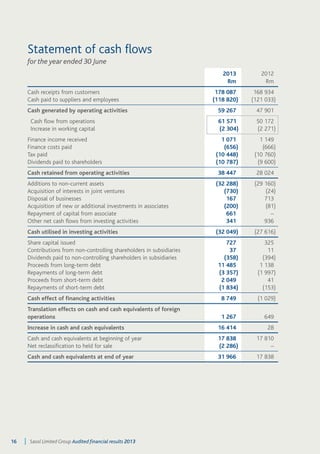
SlideShare a Scribd company logo
1 of 24
Download to read offline
Sasol Limited audited financial results 
for the year ended 30 June 2013 
better together... we deliver
highlights 
Sasol Synfuels’ production volumes up by 4% 
Cash fixed costs (excluding exchange rate effects) increased 
by 7%, in real terms 
Operating profit up by a record 26%, excluding once-offs 
Headline earnings per share up by 25% to R52,62 
Total dividend of R19,00 per share, up by 9% 
Cash generated by operating activities up by 24% 
Safety recordable case rate (RCR) of 0,31, which is the 
lowest annual result in our 63 year history 
Total skills development spend of R837 million 
Committed to excellence in all we do, Sasol is an international 
integrated energy and chemical company that leverages the 
talent and expertise of our more than 35 000 people working in 
37 countries. We develop and commercialise technologies, and 
build and operate world-scale facilities to produce a range of 
high-value product streams, including liquid fuels, chemicals 
and low-carbon electricity.
Contribution to group turnover (%) 
Contribution to group operating profit 
after remeasurement items (%) 
2013 2012 2013 2012 
1 
Segment report 
for the year ended 30 June 
Turnover 
R million 
Business unit analysis 
Operating profit/(loss) 
after remeasurement items 
R million 
2012 2013 2013 2012 
133 814 146 846 South African energy cluster 36 978 28 957 
10 672 12 324 Mining 2 213 2 287 
6 931 8 254 Gas 4 069 2 985 
48 791 58 275 Synfuels 28 624 22 095 
67 420 67 993 Oil 2 072 1 592 
– – Other – (2) 
8 429 8 886 International energy cluster (285) (55) 
5 318 5 252 Synfuels International 1 601 1 881 
3 111 3 634 Petroleum International (1 886) (1 936) 
94 752 105 313 Chemical cluster 1 919 6 500 
20 081 23 106 Polymers (2 829) 716 
18 914 21 291 Solvents 916 1 403 
37 698 41 278 Olefins & Surfactants 3 580 3 193 
18 059 19 638 Other chemical businesses 252 1 188 
50 368 Other businesses1 2 016 1 356 
237 045 261 413 40 628 36 758 
(67 599) (80 144) Intersegmental turnover1 
169 446 181 269 
1 Intersegmental turnover amounting to R8 548 million was reclassified to other intersegmental operating income as part 
of the change in the income statement presentation from function to nature, which is eliminated in the consolidated annual 
financial statements.
overview 
Advancing sustainably 
Chief Executive Officer, David E. Constable says: 
“With the bar set high, the group posted another excellent all-round performance in 2013 against 
financial, operational and safety performance targets. Clearly, macroeconomic factors continue 
to support Sasol’s overall value proposition. Our strong results are also testament to the resilience 
of our strategy, where an uncertain and volatile external environment is weighing heavily on 
economic growth. 
With a sharpened strategic focus, significant progress in relation to our US mega-projects, and the 
initiation of a complete organisational redesign, this past financial year will be seen as a watershed 
for Sasol. 
As we take bold steps forward, we are driving to become a more effective, efficient and competitive 
organisation – making Sasol fit for the future, both at home and abroad. This, together with our 
high performing people, trusted business partners, loyal customers and suppliers, strong project 
pipeline and long-term strategic vision will ensure that we deliver sustainable value for all of our 
stakeholders for decades to come. 
In all that we do, we remain committed to act responsibly and to continuously improve.” 
Year-end results overview 
Earnings attributable to shareholders for the year ended 30 June 2013 increased by 11% to R26,3 billion 
from R23,6 billion in the prior year. Headline earnings per share increased by 25% to R52,62 and 
earnings per share increased by 11% to R43,38, over the same period. 
Sasol recorded an operating profit, excluding share of profit of associates, of R40,6 billion for the year. 
Excluding the impact of net once-off charges, amounting to R8,5 billion, operating profit increased by 
26% compared with the prior year, on the back of an overall improved operational performance. 
Operating profit was boosted by a 14% weaker average rand/US dollar exchange rate (R8,85/US$ at 
30 June 2013 compared with R7,78/US$ at 30 June 2012), despite a 3% lower average Brent crude oil 
price (average dated Brent was US$108,66/barrel at 30 June 2013 compared with US$112,42/barrel at 
30 June 2012) and lower product prices. 
The operating profit in the current year was negatively impacted by net once-off charges totalling 
R8,5 billion (30 June 2012 – R2,1 billion). These items relate primarily to the partial impairments of our 
Arya Sasol Polymer Company (ASPC) investment and the FT wax expansion project of R3 611 million and 
R2 033 million, respectively, as well as the write off of an unsuccessful exploration well in Mozambique 
amounting to R442 million. In addition, included in the once-off charges is an amount of R2 021 million 
related to translation losses, primarily at our ASPC operations, resulting from the depreciation of the 
Iranian Rial against the US dollar. These once-off items also include a gain of R233 million relating to the 
remeasurement to fair value of our existing shareholding in the Merisol business, which arose from the 
acquisition of the remaining 50% of Merisol. Our operating profit further includes a gain on the valuation 
of our open Canadian foreign exchange contracts amounting to R439 million. 
Operating profit for the second half of the year, compared to the first half of the year, was R2,8 billion 
higher mainly as a result of the weaker rand/US dollar exchange rate, partly offset by the further 
impairment of ASPC and the partial impairment of the FT wax expansion project. In addition, translation 
2 Sasol Limited Group Audited financial results 2013
gains, year-end stock movements as well as the positive impact of the change in discount rates on our 
provision for environmental rehabilitation contributed further to the higher operating profit. 
Sasol Synfuels delivered production volumes for the year of 7,443 million tons (mt), which was 4% 
higher than the prior year. Stable operations, as well as the performance of the running plant during the 
phased shutdown resulted in the improved production volumes. This is the highest production volumes 
delivered by Sasol Synfuels since the 2006 financial year, post Clean Fuels 1 implementation. We 
continue to optimise our European chemical businesses’ production to match lower demand and 
optimise margins in light of the continuing weak European market conditions. Production performance 
at our ORYX gas-to-liquids (GTL) operations was in line with our expectations, taking into account the 
planned maintenance shutdown in February 2013. ASPC achieved a utilisation rate of 80% in line with 
our production expectations. 
Cash fixed costs, excluding once-off and growth costs and the impact of a weaker exchange rate, 
increased by 7% in real terms, primarily due to a challenging South African cost environment in 
respect of labour, maintenance and electricity costs. Our current cost inflation is above the indicative 
South African producers’ price index inflation trends of 6,0% for the 2013 financial year. A key area of 
management focus is our cost optimisation project, where we are actively looking at opportunities to 
significantly reduce and contain our cost base sustainably. 
The effective tax rate of 31,7% is lower than the prior year’s effective tax rate of 32,6%. This resulted 
primarily from an increase in non-deductible expenses relating mainly to once-off charges, which was 
offset by the absence of Secondary Tax on Companies, due to the implementation of dividend 
withholding tax, as well as the increase in exempt income. 
Cash flow generated by operating activities increased by 24% to R59,3 billion compared with 
R47,9 billion in the prior year. However, this was offset by increased working capital, both as a result 
of price and volume effects. Capital investments for the year amounted to R32,3 billion. 
Taking into account the ongoing strength of our financial position, current capital investment plans, 
as well as the progressive dividend policy, management has recommended and the Sasol board has 
approved the final dividend. This approach remains in line with our commitment to consistently 
return sustainable value to shareholders. 
3 
Chief Financial Officer, Christine Ramon says: 
“We continue to demonstrate our strong cash flow generation ability across our businesses 
through the cycle. We remain committed to a progressive dividend policy, barring significant 
economic variables such as abnormal fluctuations in the oil price and exchange rates. We continue 
to deliver value to shareholders, despite the negative impact on our profitability of once-off charges, 
mainly impairments. Our balance sheet continues to be resilient, which positions the company well 
to fund our attractive growth projects, our progressive dividend policy as well as to provide a buffer 
for volatility.” 
Sasol fit for the future 
To make Sasol fit for the future, we are taking decisive and proactive measures to secure our long-term 
growth and competitiveness. 
During 2013, our focus on operational performance resulted in improved plant stability and higher 
production volumes. Looking ahead, under our business performance enhancement programme, we will 
continue to improve operational productivity, while designing an effective operating model for Sasol. 
Our aim is to implement initiatives, which address both cost creep and organisational complexity to 
ensure that we become a more effective, efficient and competitive organisation over the long term.
Through our business performance enhancement programme, we expect to generate sustainable annual 
savings of at least R3 billion over the next two to three years. The drivers for the savings target will be a 
combination of efficiency benefits stemming from our new operating model, productivity improvements 
in our operations, designing “fit-for-purpose” group functions and procurement cost reduction strategies. 
We will be able to share more details on the group’s new operating model, as well as the source and 
timelines of these savings at our interim results announcement in March 2014. 
Delivering on growth and operations excellence 
We continue to progress on the delivery of our project pipeline and it is pleasing that: 
• Looking at our growth projects: 
– We continue to make progress on the execution of the front-end engineering and design (FEED) 
phase of an integrated, world-scale ethane cracker and downstream derivatives units, and 
will commence with FEED for the US GTL and chemicals value-adds facility at the Lake Charles 
chemicals complex in Louisiana, the United States, during the second half of the 2013 
calendar year: 
• The ethane cracker (estimated to cost between US$5 billion and US$7 billion) will produce 
1,5 million tons of ethylene that will be used to manufacture a range of ethylene derivatives. 
The main technologies for the ethane cracker and derivatives units have been selected and we 
have placed orders for critical long-lead equipment. We expect beneficial operation for the 
ethane cracker to be achieved during the 2017 calendar year, with the final investment decision 
(FID) to be taken during the 2014 calendar year. 
• The US GTL facility (with an estimated cost of between US$11 billion and US$14 billion) will 
produce at least a nominal 96 000 barrels per day (bbl/d) of product, with the potential to 
produce up to 10% more. The US GTL project will be delivered in two phases after the ethane 
cracker, with each phase comprising at least 48 000 bbl/d. The FID for the US GTL project is 
expected to be taken within 18 to 24 months after that of the US ethane cracker. 
• We have submitted the filings for the key environmental permits, and have regular interaction 
with the authorities and other stakeholders to monitor the process. The outcome of the permit 
applications are expected towards the end of the FEED phase. 
• We announced the introduction of a Voluntary Property Purchase Program for residents in 
designated areas to the northwest and west of our existing facility in Westlake, Louisiana. This 
programme will provide eligible property owners with the option to sell their property to Sasol, 
and relocate to an alternative neighbourhood, if they so choose. 
• The Louisiana Joint Legislative Committee on the State’s Budget approved the Cooperative 
Endeavors Agreement (CEA) between Sasol and the State of Louisiana, which facilitates the 
economic incentives package for the ethane cracker and US GTL projects. 
• In June 2013, we signed a memorandum of understanding (MOU) with Ineos Olefins & 
Polymers USA (Ineos). The intent of the MOU is to form a joint venture to manufacture high 
density polyethylene (HDPE). The proposed plant will produce 470 kilotons per annum of 
bimodal HDPE using an Innovene™ S process technology licensed from Ineos, and will utilise 
ethylene from the Lake Charles cracker project to provide Sasol with integrated manufacturing 
economics. The final investment decision for this plant is expected to be taken in the first half 
of the 2014 calendar year with start-up expected at the end of the 2015 calendar year. 
– Our Uzbekistan GTL FEED activities are progressing well and are expected to be completed during 
the second half of the 2013 calendar year. Sasol regularly reviews the projects in its project 
pipeline. As a result of the magnitude of our growth portfolio, as well as significant sustenance 
capital required for our South African operations, the Sasol board approved that we decrease our 
shareholding in the Uzbekistan GTL project from 44,5% to 25,5% at the end of the FEED phase. 
The FID remains subject to key conditions, including successful project financing and non-state 
4 Sasol Limited Group Audited financial results 2013
5 
ownership of at least 50,1%. The Uzbekistan GTL project remains an important project in 
Sasol’s GTL growth portfolio and the business case for the project remains robust. 
– In Nigeria, the Escravos GTL project is progressing steadily, with commissioning and start-up 
activities. The plant is expected to be in operation towards the end of the 2013 calendar year. 
• Focusing on our foundation businesses: 
– The Sasol Synfuels growth programme is progressing, with the first set of the gas heated heat 
exchange reformers (GHHERs) reaching beneficial operation in June 2013. The beneficial operation 
of the entire programme is expected to be reached in December 2014. The complex brownfields 
volatile organic compound abatement project continues, along with the replacement of tar tanks 
and separators as well as the coal tar filtration east project. 
– The development of the Impumelelo and Shondoni Collieries, which are part of Sasol Mining’s 
R14 billion mine replacement projects, remain on track. It is anticipated that the projects will 
be completed within budget, reaching beneficial operation during the second half of the 2014 
and 2015 calendar years, respectively. 
– Construction on the FT wax expansion facility in Sasolburg, South Africa, continues to progress. 
The commissioning of the new Slurry Bed Reactor, which is critically important for the capacity 
expansion, is expected to take place at the end of March 2014. Phase 2 of the project will be 
impacted by the delay of phase 1 and commissioning of phase 2’s key equipment (second Slurry 
Bed Reactor) is expected to take place in August 2016. The total project cost of both phases 1 
and 2 is an estimated total cost of R11,9 billion. The total project cost comprises both phase 1 
and phase 2 costs, estimated at R9,0 billion and R2,9 billion, respectively. Due to the volatile 
macroeconomic environment and increased costs relating primarily to construction delays and 
poor labour productivity, we recognised a partial impairment of R2 033 million at 30 June 2013 
in respect of the project. All efforts are being made to monitor and mitigate the risks identified 
on the project and to improve the economics thereof. 
– The construction of our R1,9 billion ethylene purification unit project in Sasolburg, and the 
R1,3 billion C3 stabilisation project in Secunda remain on track. These projects are expected to be 
in operation during the second half of the 2013 calendar year and in the middle of the 2014 
calendar year, respectively. 
– During the year, through Sasol New Energy (SNE), we continued to advance the development 
of our 49% share of the US$246 million 140 megawatts gas-fired power generation plant in 
Mozambique, in partnership with the country’s state-owned power utility Electricidade de 
Moçambique at Ressano Garcia (EDM). EDM will be the sole offtaker of the electricity under a 
long-term power purchase agreement. Civil work and construction have commenced on site. 
Beneficial operation is expected during the first half of the 2014 calendar year. 
• Turning to our upstream activities: 
– We are rationalising our global exploration portfolio and, during the year, relinquished various 
exploration licences in Mozambique, Papua New Guinea and Australia. In doing so, we have 
high-graded our exploration portfolio, which still contains a number of very promising assets in 
other parts of Mozambique, Australia, South Africa and Botswana. 
– The Inhassoro I-9Z extended well test in the Mozambique Production Sharing Agreement (PSA) 
area contributed 197 000 barrels of light oil during the year. 
– In November 2012, we completed the PSA appraisal phase programme in Mozambique and notified 
its government that two oil and two gas reservoirs are commercially viable and will be considered 
for future development. The Field Development Plan is to be submitted by 25 February 2015, which 
will give effect to a final investment decision. In October 2012, we completed the expansion of 
the Central Processing Facility (CPF) in Mozambique, increasing annual production capacity to 
183 million gigajoules per annum (MGJ/a). The agreement for the 27 MGJ/a allocated to
South Africa from the additional capacity was concluded in 2009 and has been in effect since 2010. 
In 2013, we successfully concluded three new gas sales agreements for the additional capacity, 
which was allocated to the Mozambican electricity market. 9 MGJ/a of the additional capacity 
comprises royalty gas for the Mozambican government. In support of the increased capacity, 
Sasol Gas together with its partner, has begun construction of the R1,98 billion loop line to allow 
for the additional monetisation of gas in Mozambique. 
– In offshore Gabon, we are maturing and developing new oil reserves to maintain and potentially 
boost production in the non-operated Etame Marin Permit. During 2013, an amount of 
US$168,2 million was approved for two new development projects, namely the Etame 
Expansion project and the South East Etame and North Tchibala project. The capital related to 
these investments commenced being incurred in 2013 and will continue through to the 2016 
financial year. 
Our operations deliver solid performance 
South African energy cluster 
Sasol Mining – increased production coupled with higher costs 
Operating profit of R2 213 million was 3% lower than the prior year, primarily due to increased mining 
costs, external coal purchases and increased transport costs. Lower export sales volumes and coal prices 
were offset by higher volumes and sales prices to Sasol Synfuels compared to the prior year. Production 
volumes were up 1% compared to those of the prior year. Sasol Mining for the first time in its history 
had no fatalities during the year and reduced its RCR from 0,67 in 2012 to 0,57 in 2013. 
Sasol Gas – improved sales prices and volumes 
Operating profit increased by 36% to R4 069 million compared to the prior year. This was mainly 
as a result of increased sales volumes, which supported Sasol’s initiatives to increase energy efficiencies 
and minimise our carbon footprint. In addition, higher sales prices, on the back of the weaker rand/US 
dollar exchange rate, further contributed positively to our operating profit. 
Sasol Synfuels – production volumes up by 4% 
Sasol Synfuels’ operating profit increased by 30% to R28 624 million compared to the prior year 
primarily due to a weaker average rand/US dollar exchange rate resulting in favourable product prices 
and margins, as well as increased sales volumes. Production volumes of 7,443 million tons were 4% 
higher than the prior year due to stable operations, as well as the performance of the running plant 
during the phased shutdown in September 2012. Cash unit costs increased by 13% compared to the 
prior year, due to higher feedstock prices (which are largely internal to the group), as well as increased 
labour and energy costs. 
Sasol Oil – higher margins despite lower volumes 
Operating profit increased by 30% to R2 072 million compared to the prior year primarily due to higher 
marketing and refining margins, coupled with higher petroleum product prices and a weaker average 
rand/US dollar exchange rate. Sales and production volumes for the year were lower compared to the 
prior year. This was due to lower demand, in particular for black products, on the back of higher 
petroleum product prices. Production volumes were lower compared to the prior year due to the 
extended planned maintenance shutdown at our Natref refinery, coupled with the lower demand. 
International energy cluster 
Sasol Synfuels International (SSI) – lower ORYX GTL volumes due to shutdown 
SSI’s operating profit decreased by 15% to R1 601 million compared to the prior year. This was as a 
result of lower volumes from the ORYX GTL plant in Qatar due to the planned statutory shutdown in 
February 2013 as well as higher US GTL study costs compared to the prior year. The ORYX GTL plant, 
which has maintained an RCR of zero, achieved a full year average utilisation rate, taking into account 
6 Sasol Limited Group Audited financial results 2013
the planned statutory shutdown, of 80% of nameplate capacity. The shutdown enabled the ORYX GTL 
plant to progress various key de-bottlenecking projects, which have already resulted in operational 
benefits since start-up. Average throughput for the month of May and June 2013 exceeded 106% of 
design capacity. 
Sasol Petroleum International (SPI) – Mozambique volume growth, however, low North American 
gas prices impact Canadian asset performance 
SPI recorded an operating loss of R1 886 million compared to an operating loss of R1 936 million 
in the prior year. The operating loss was underpinned by higher gross margins, supported by improved 
production volumes. However, these favourable aspects were partly offset by higher depreciation, 
mainly related to our Canadian shale gas assets of CAD226 million, as well as increased operating 
and exploration costs elsewhere. The write off of the Mupeji-1 dry well in Mozambique amounting 
to R442 million, is included in the operating loss. The operating loss for the prior year includes a 
partial impairment of R964 million relating to our Canadian shale gas assets and the impairment 
of Block 16/19 in Mozambique of R434 million. 
Production volumes from our combined assets in Mozambique, Canada and Gabon increased by 16% 
compared to the prior year. The Pande and Temane gas fields in Mozambique performed well. Although 
Gabon oil production is slowly declining, we are maturing additional volumes in Gabon to sustain asset 
life-time. Our Canadian shale gas assets remains under pressure due to low gas market prices and high 
depreciation, contributing to the operating loss for the year. We are actively de-risking this asset to 
optimise ramp-up of development activities once gas prices increase. 
Chemical cluster 
Sasol Polymers – margin pressure and negative impact of ASPC partial impairment 
Sasol Polymers’ recorded an operating loss of R2 829 million compared to an operating profit of 
R716 million in the prior year. The South African polymers business recorded an operating loss of 
R1 785 million (2012 – R1 148 million). Sales volumes in our South African polymers business were 5% 
higher than the prior year, despite the slow recovery in the polymers market. Margins continue to be 
squeezed in the South African polymers business, where feedstock price increases outweighed the 
increases in selling prices. 
Our international operations contributed R4 588 million (2012 – R2 591 million) to operating profit, 
excluding the partial impairment of our investment in ASPC of R3 611 million and translation losses 
of R2 021 million (2012 – R727 million), relating primarily to our ASPC operations, mainly due to the 
depreciation of the Iranian Rial against the US dollar. ASPC achieved an average capacity utilisation rate 
of 80% for the year. However, due to logistical disruptions at ASPC, international operations’ sales 
volumes were 19% lower than the prior year. 
Sasol Solvents – 6% higher sales volumes despite challenging trading environment 
Operating profit decreased by 35% to R916 million compared to the prior year. The benefits of a 6% 
increase in sales volumes and a weaker rand/US dollar exchange rate were offset by declining US dollar 
selling prices and contracting margins, resulting from continued high feedstock prices over this period. 
Operating profit includes a partial impairment of R242 million related to our German operations. 
Sasol Olefins & Surfactants (Sasol O&S) – improved margins in the US compensate for weaker 
margins in Europe 
Operating profit increased by 23% to R3 580 million compared to the prior year, excluding the gain 
realised in the prior year on the sale of the Witten operations in Germany. While our US operations 
continued to benefit from the low US ethane prices, our European based businesses, whilst still 
profitable, came under increased pressure as a result of reduced volumes due to softer demand, 
coupled with continued high petrochemical feedstock prices. 
7
Other chemical businesses – challenging market conditions for Sasol Nitro, negative impact of 
FT wax expansion project impairment 
Our other chemical businesses recorded an operating profit of R252 million compared to an operating 
profit of R1 188 million in the prior year. The operating profit of our Sasol Wax business, excluding a 
R2 033 million partial impairment on the FT wax expansion project and other once-off items in the 
prior year, increased by 106% compared to the prior year on the back of the weaker rand/US dollar 
exchange rates. 
The Sasol Nitro business incurred an operating loss of R124 million for the year. This was due to the 
negative effects of labour unrest in the mining sector during the first half of the year, lower customer 
demand and significantly higher feedstock costs in the fertiliser business. 
Doing business responsibly 
We continued to deliver on our broader sustainability contributions during the period: 
– SNE’s external water conservation partnerships have started to yield results, with the first water 
savings of R10,5 million being realised through the repair of leaking plumbing in 60 000 houses in 
Sebokeng and Evaton, in the Sasolburg region. In addition, it created 75 local employment 
opportunities. The project will now start to become self-funded, demonstrating the sustainability of 
the “ring-fenced savings” funding model for the project. The concept of water off-setting has been 
positively received by the Parliamentary Portfolio Committee on Water and Environmental Affairs, and 
has been incorporated in the National Water Resource Strategy of the Department of Water Affairs. 
– In terms of South African climate change policy, our experts are participating in several working 
groups, together with the South African government and other stakeholders, to develop the standards 
and guidelines which would give effect to the country’s climate change response white paper, which 
was published in 2011. We continue to engage stakeholders on climate change-related policies and 
initiatives, to find workable and sustainable solutions as we transition to a low-carbon economy. 
– Sasol supports policies that are based on analysis that uses clear and accurate information, reflects 
the constraints of a transition to a lower carbon and climate resilient South African economy, while 
effectively contributing to the reduction of greenhouse gases. However, Sasol does not support the 
proposed carbon tax in its current form as: 
• a thorough analysis of the potential impacts and alternative options have not been performed; 
• it does not align with South Africa’s broader mitigation policy; and 
• it does not sufficiently take account of South Africa’s carbon mitigation and socio-economic 
challenges. 
– Throughout the year, we have engaged actively with government on air quality legislation, both 
individually and through various forums. Through our engagements, we continue to propose an air 
quality regulatory regime that is reasonable and practicable, and that aims to achieve tangible 
improvements in ambient air quality. 
– The safety incident recordable case rate (RCR) for employees and service providers, including 
injuries and illnesses, of 0,36 at 30 June 2013 has improved compared with the RCR rate of 0,39 
at 30 June 2012. Notably, our RCR for employees and service providers, excluding illnesses, of 0,31 
at 30 June 2013 (30 June 2012 – 0,35) is at its lowest level in our company’s 63 year history. 
– During the year, our Ikusasa programme progressed well. Four areas are focused on, namely education, 
health and wellbeing, infrastructure, and safety and security in the Secunda and Sasolburg regions. 
As part of our commitment to the communities in which we operate, we invested R72 million and 
R63 million in Secunda and Sasolburg, respectively, during the year, with a further R200 million 
per annum planned for 2014 through 2016. 
– During the year, we paid R30,8 billion in direct and indirect taxes to the South African government. 
Sasol remains one of the largest corporate taxpayers in South Africa, contributing significantly to the 
country’s economy. 
8 Sasol Limited Group Audited financial results 2013
Competition law compliance 
We continue to evaluate and enhance our compliance programmes and controls in general, and our 
competition law compliance programme and controls, in particular. As a consequence of these 
programmes and controls, including monitoring and review activities, we have also adopted appropriate 
remedial and/or mitigating steps, and made disclosures on material findings, as and when appropriate. 
The South African Competition Commission (the Commission) is conducting investigations into several 
industries in which Sasol operates, including the piped gas, petroleum, fertilisers and polymer industries. 
We continue to cooperate with the Commission in these investigations. To the extent appropriate, 
further announcements will be made in future. 
As part of its investigation into the polymer industry, the Commission has contended that the prices at 
which Sasol Polymers supplies propylene and polypropylene are excessive. Sasol Polymers does not 
agree with the Commission’s assessment and is contesting the Commission’s allegations. The majority 
of the matter was heard before the South African Competition Tribunal (the Tribunal) from 13 May 2013 
to 7 June 2013 and the last of the Sasol witnesses took the stand in August 2013. Closing arguments 
will be made before the Tribunal by both Sasol and the Commission on 14 and 15 October 2013. 
The Commission has referred allegations of price-fixing and market division against Chevron SA, Engen, 
Shell SA, Total SA, Sasol Limited, BP SA and the South African Petroleum Industry Association (SAPIA) to 
the Tribunal for adjudication. The Commission is alleging that the respondents exchanged commercially 
sensitive information, mainly through SAPIA, in order to ensure that their respective prices for diesel 
followed the Wholesale List Selling Price published by the South African Department of Energy. This is 
not a new matter and Sasol began engaging with the Commission in this regard in 2008 as part of its 
group-wide competition law compliance review, which preceded the Commission’s investigation into 
the liquid fuels sector. Sasol has reviewed the Commission’s referral documents and does not agree with 
the Commission’s allegations. Accordingly, Sasol is defending the matter. 
Cash generation supports strong balance sheet 
The deleveraged balance sheet reflected an under-geared position of 0,3% at 30 June 2013 compared to 
the gearing level of 2,7% at 30 June 2012. The low gearing is supported by continued healthy cash flow 
generation, particularly from our foundation businesses. This low level of gearing is expected to be 
maintained in the short term, but is likely to return to within our targeted range of 20% to 40% in the 
medium term, taking into account our growth programme as well as our progressive dividend policy. 
Profit outlook† – strong management focus on improved operational 
performance and cost reduction 
Economic recovery in the global environment is expected to remain fragile and unbalanced. The 
European debt crisis has continued, weakening demand in that region. Coupled with the Chinese 
slowing growth, the announcement of the gradual withdrawal of quantitative easing by the Federal 
Reserve in the US, increased the risks of global economic recovery. Global economic growth is 
expected to remain modest in light of the uncertainties in the European and US markets in particular. 
Crude oil prices are expected to remain stable over the near term. Product prices are expected to 
remain volatile. The rand/US dollar exchange rate remains one of the biggest external factors impacting 
our profitability. 
We expect an overall solid production performance for the 2014 financial year with the following 
production guidance: 
– Sasol Synfuels’ volumes are expected to be between 7,3 and 7,5 million tons; 
† In accordance with standard practice, it is noted that this information has not been reviewed and reported on by the company’s 
9 
auditors.
– The average utilisation rate at ORYX GTL in Qatar is expected to be above 85% of nameplate 
capacity; and 
– Our shale gas venture in Canada will show marginally increased production compared to the prior 
year due to new wells coming on stream. At present we are stabilising our production, as ramp-up in 
drilling activities remain dependent on sustained gas price increases. 
Following the successful conclusion of the disposal of our share in ASPC during the first half of the 2014 
financial year, we are currently assessing the impact of the change in the official Iranian Rial exchange 
rate applicable from the 2014 financial year. This change may result in a loss on disposal of less than 
US$100 million. 
The macroeconomic conditions continue to be volatile, impacting our assumptions in respect of stable 
crude oil prices and volatile product prices, stronger refining margins as well as the weaker rand/US 
dollar exchange rate. We continue to focus on factors within our control: volume growth, margin 
improvement and cost reduction. The current volatility and uncertainty of global markets and 
geopolitical activities makes it difficult to be more precise in this outlook statement. 
Acquisitions and disposals of businesses 
In December 2012, Sasol acquired the remaining 50% shareholding in Merisol for a purchase 
consideration of R730 million (US$85 million). 
In April 2013, Sasol Oil disposed of its bitumen business, operated by Tosas, for a consideration of 
R116 million. 
Subsequent events 
On 2 July 2013, Sasol Gas disposed of its 49% share in Spring Lights Gas for a consideration 
of R474 million, upon obtaining approval from the South African Competition Commission. 
At 30 June 2013, Spring Lights Gas was classified as a disposal group held-for-sale. 
On 16 August 2013, we entered into a definitive sale and share purchase agreement to dispose of our 
50% interest in ASPC for a purchase consideration of R3 606 million (US$365 million). The purchase 
consideration is payable in cash for the net assets, dividends and shareholder loans. At 30 June 2013, 
the investment in ASPC was classified as a disposal group held-for-sale. As a result of this transaction, 
Sasol has no on-going investment in Iran. 
Change in directors 
Mrs KC Ramon resigned as chief financial officer and executive director of Sasol Limited with effect 
from 9 September 2013. Mr P Victor has been appointed as the acting chief financial officer and 
executive director of Sasol Limited with effect from 10 September 2013. 
10 Sasol Limited Group Audited financial results 2013
Declaration of cash dividend number 68 
A final gross cash dividend of South African 1330,00 cents per ordinary share (30 June 2012 – 1180,00 
cents per share) has been declared for the year ended 30 June 2013. The final cash dividend is payable 
on the ordinary shares and the Sasol BEE ordinary shares. The dividend has been declared out of retained 
earnings (income reserves). The South African dividend withholding tax rate is 15% and no credits in terms 
of secondary tax on companies have been utilised. At the declaration date, there are 648 925 316 Sasol 
ordinary, 25 547 081 Sasol preferred ordinary and 2 838 565 Sasol BEE ordinary shares in issue. 
The net dividend amount payable to shareholders, who are not exempt from the dividend withholding 
tax, is 1130,50 cents per share, while the dividend amount payable to shareholders who are exempt 
from dividend withholding tax is 1330,00 cents per share. 
The salient dates for holders of ordinary shares and BEE ordinary shares are: 
Declaration date Monday, 9 September 2013 
Last day for trading to qualify for and participate 
in the final dividend (cum dividend) Friday, 4 October 2013 
Trading ex dividend commences Monday, 7 October 2013 
Record date Friday, 11 October 2013 
Dividend payment date Monday, 14 October 2013 
On Monday, 14 October 2013, dividends due to certificated shareholders on the South African registry 
will either be electronically transferred to shareholders’ bank accounts or, in the absence of suitable 
mandates, dividend cheques will be posted to such shareholders. Shareholders who hold dematerialised 
shares will have their accounts held by their CSDP or broker credited on Monday, 14 October 2013. 
Share certificates may not be dematerialised or re-materialised between Monday, 7 October 2013 and 
Friday, 11 October 2013, both days inclusive. 
On behalf of the board 
11 
Hixonia Nyasulu David E. Constable Christine Ramon 
Chairman Chief Executive Officer Chief Financial Officer 
Sasol Limited 
9 September 2013
The preliminary financial statements are presented on a summarised consolidated basis. 
Statement of financial position 
at 30 June 
2013 
Rm 
2012 
Rm 
ASSETS 
Property, plant and equipment 108 070 95 872 
Assets under construction 41 244 33 585 
Goodwill 859 787 
Other intangible assets 1 532 1 214 
Investments in associates 2 676 2 560 
Post-retirement benefit assets 407 313 
Deferred tax assets 2 318 1 514 
Other long-term assets 2 787 2 437 
Non-current assets 159 893 138 282 
Assets in disposal groups held for sale 2 304 18 
Inventories 24 056 20 668 
Trade and other receivables 29 003 26 299 
Short-term financial assets 1 526 426 
Cash restricted for use 7 442 5 314 
Cash 25 271 12 746 
Current assets 89 602 65 471 
Total assets 249 495 203 753 
EQUITY AND LIABILITIES 
Shareholders’ equity 149 625 125 234 
Non-controlling interests 3 650 3 080 
Total equity 153 275 128 314 
Long-term debt 22 357 12 828 
Long-term financial liabilities 22 38 
Long-term provisions 12 397 10 518 
Post-retirement benefit obligations 8 841 6 872 
Long-term deferred income 305 455 
Deferred tax liabilities 16 173 13 839 
Non-current liabilities 60 095 44 550 
Short-term debt 1 701 3 072 
Short-term financial liabilities 200 135 
Other current liabilities 33 477 27 460 
Bank overdraft 747 222 
Current liabilities 36 125 30 889 
Total equity and liabilities 249 495 203 753 
12 Sasol Limited Group Audited financial results 2013
Income statement 
for the year ended 30 June 
2013 
Rm 
2012 
Rm 
Turnover 181 269 169 446 
Materials, energy and consumables used (77 538) (80 410) 
Selling and distribution costs (5 371) (4 621) 
Maintenance expenditure (7 544) (7 421) 
Employee related expenditure (23 476) (19 465) 
Exploration expenditure and feasibility costs (1 354) (1 045) 
Depreciation and amortisation (12 030) (9 651) 
Other expenses, net (6 841) (8 215) 
Translation gains 899 243 
Other operating expenses (9 692) (9 874) 
Other operating income 1 952 1 416 
Operating profit before remeasurement items and associates 47 115 38 618 
Remeasurement items (6 487) (1 860) 
Operating profit after remeasurement items 40 628 36 758 
Share of profits of associates, net of tax 445 479 
Profit from operations and associates 41 073 37 237 
Net finance costs (1 294) (1 234) 
Finance income 708 796 
Finance costs (2 002) (2 030) 
Profit before tax 39 779 36 003 
Taxation (12 597) (11 746) 
Profit for year 27 182 24 257 
Attributable to 
Owners of Sasol Limited 26 278 23 583 
Non-controlling interests in subsidiaries 904 674 
27 182 24 257 
Earnings per share Rand Rand 
Basic earnings per share 43,38 39,10 
Diluted earnings per share1 43,42 38,95 
1 Diluted earnings per share are calculated taking the Sasol Share Incentive Scheme and Sasol Inzalo share transaction into account. 
13
Statement of comprehensive income 
for the year ended 30 June 
2013 
Rm 
2012 
Rm 
Profit for year 27 182 24 257 
Other comprehensive income, net of tax 
Items that can be subsequently reclassified 
to the income statement 8 160 4 101 
Effect of translation of foreign operations 8 121 4 063 
Effect of cash flow hedges 78 41 
Investments available-for-sale (17) (3) 
Tax on items that can be subsequently reclassified 
to the income statement (22) – 
Items that cannot be subsequently reclassified 
to the income statement (338) ( 821) 
Remeasurements on post-retirement benefit obligations (497) (1 195) 
Tax on items that cannot be subsequently reclassified to 
the income statement 159 374 
Total comprehensive income for the year 35 004 27 537 
Attributable to 
Owners of Sasol Limited 34 084 26 853 
Non-controlling interests in subsidiaries 920 684 
35 004 27 537 
14 Sasol Limited Group Audited financial results 2013
Statement of changes in equity 
for the year ended 30 June 
2013 
Rm 
2012 
Rm 
Opening balance 128 314 109 860 
Shares issued during year 727 325 
Share-based payment expense 374 485 
Disposal of businesses 7 – 
Acquisition of business (14) – 
Transactions with non-controlling shareholders in subsidiaries 8 101 
Total comprehensive income for the year 35 004 27 537 
Dividends paid to shareholders (10 787) (9 600) 
Dividends paid to non-controlling shareholders in subsidiaries (358) (394) 
Closing balance 153 275 128 314 
Comprising 
Share capital 28 711 27 984 
Share repurchase programme (2 641) (2 641) 
Sasol Inzalo share transaction (22 054) (22 054) 
Retained earnings 128 038 112 547 
Share-based payment reserve 8 883 8 509 
Foreign currency translation reserve 10 235 2 137 
Remeasurements on post-retirement benefit obligations (1 585) (1 250) 
Investment fair value reserve (3) 15 
Cash flow hedge accounting reserve 41 (13) 
Shareholders’ equity 149 625 125 234 
Non-controlling interests in subsidiaries 3 650 3 080 
Total equity 153 275 128 314 
15
Statement of cash flows 
for the year ended 30 June 
2013 
Rm 
2012 
Rm 
Cash receipts from customers 178 087 168 934 
Cash paid to suppliers and employees (118 820) (121 033) 
Cash generated by operating activities 59 267 47 901 
Cash flow from operations 61 571 50 172 
Increase in working capital (2 304) (2 271) 
Finance income received 1 071 1 149 
Finance costs paid (656) (666) 
Tax paid (10 448) (10 760) 
Dividends paid to shareholders (10 787) (9 600) 
Cash retained from operating activities 38 447 28 024 
Additions to non-current assets (32 288) (29 160) 
Acquisition of interests in joint ventures (730) (24) 
Disposal of businesses 167 713 
Acquisition of new or additional investments in associates (200) (81) 
Repayment of capital from associate 661 – 
Other net cash flows from investing activities 341 936 
Cash utilised in investing activities (32 049) (27 616) 
Share capital issued 727 325 
Contributions from non-controlling shareholders in subsidiaries 37 11 
Dividends paid to non-controlling shareholders in subsidiaries (358) (394) 
Proceeds from long-term debt 11 485 1 138 
Repayments of long-term debt (3 357) (1 997) 
Proceeds from short-term debt 2 049 41 
Repayments of short-term debt (1 834) (153) 
Cash effect of financing activities 8 749 (1 029) 
Translation effects on cash and cash equivalents of foreign 
operations 1 267 649 
Increase in cash and cash equivalents 16 414 28 
Cash and cash equivalents at beginning of year 17 838 17 810 
Net reclassification to held for sale (2 286) – 
Cash and cash equivalents at end of year 31 966 17 838 
16 Sasol Limited Group Audited financial results 2013
Salient features 
for the year ended 30 June 
2013 2012 
Selected ratios 
Return on shareholders’ equity % 19,1 20,3 
Return on total assets % 18,4 20,0 
Operating profit margin % 22,4 21,7 
Finance costs cover times 63,7 57,1 
Dividend cover times 2,3 2,3 
Share statistics 
Total shares in issue million 677,2 673,2 
Sasol ordinary shares in issue million 648,8 644,8 
Treasury shares (share repurchase programme) million 8,8 8,8 
Weighted average number of shares million 605,7 603,2 
Diluted weighted average number of shares million 614,5 616,2 
Share price (closing) Rand 431,54 342,40 
Market capitalisation – Sasol ordinary shares Rm 279 983 220 788 
Market capitalisation – Sasol BEE ordinary shares Rm 871 686 
Net asset value per share Rand 247,19 208,27 
Dividend per share Rand 19,00 17,50 
Interim Rand 5,70 5,70 
Final Rand 13,30 11,80 
Other financial information 
Total debt (including bank overdraft) Rm 24 805 16 122 
Interest bearing1 Rm 24 291 15 597 
Non-interest bearing Rm 514 525 
Finance costs capitalised Rm 302 24 
Capital commitments – Property, plant and equipment Rm 67 752 45 819 
Authorised and contracted Rm 64 387 50 243 
Authorised, not yet contracted Rm 45 216 28 417 
Less expenditure to the end of year Rm (41 851) (32 841) 
Guarantees and contingent liabilities 
Total amount Rm 36 213 25 299 
Liability included in the statement of financial position Rm 21 271 11 194 
Share-based payment expenses Rm 2 038 691 
Sasol share incentive schemes Rm 1 666 221 
Sasol Inzalo share transaction Rm 372 470 
Directors’ remuneration Rm 98 70 
1 Sasol Financing International Plc, an indirect 100% financing subsidiary of Sasol Limited, issued a US$1 billion bond at a fixed 
rate of 4,5%, which is listed on the New York Stock Exchange and is repayable in November 2022. 
17
Salient features continued 
for the year ended 30 June 
2013 2012 
Other financial information continued 
Share options granted to directors – cumulative 000 47 628 
Share appreciation rights with no performance targets 
granted to directors – cumulative 000 63 86 
Share appreciation rights with performance targets granted 
to directors – cumulative 000 780 700 
Medium-term incentive rights granted to directors 
– cumulative 000 198 156 
Sasol Inzalo share rights granted to directors 
– cumulative 000 50 50 
Effective tax rate2 % 31,7 32,6 
Number of employees number 35 471 34 916 
Average crude oil price – dated Brent US$/barrel 108,66 112,42 
Average rand/US$ exchange rate 1US$ = Rand 8,85 7,78 
Closing rand/US$ exchange rate 1US$ = Rand 9,88 8,17 
2 The decrease in the effective tax rate from 32,6% to 31,7% is mainly due to an increase in non-deductible expenses, which was 
offset by the absence of Secondary Tax on Companies, due to the implementation of dividend withholding tax, as well as the 
increase in exempt income. 
Reconciliation of headline earnings Rm Rm 
Earnings attributable to owners of Sasol Limited 26 278 23 583 
Effect of remeasurement items 6 487 1 860 
Impairment of assets 6 102 1 642 
Reversal of impairment (107) (12) 
Net profit on disposal of businesses (85) (354) 
Profit on disposal of associate – (7) 
Net profit on disposal of property, plant and equipment (7) (138) 
Net loss on disposal of other intangible assets 6 – 
Fair value gain on acquisition of business (233) – 
Scrapping of property, plant and equipment 238 212 
Scrapping of assets under construction 104 247 
Write off of unsuccessful exploration wells 469 270 
Tax effects and non-controlling interests (892) 61 
Headline earnings 31 873 25 504 
18 Sasol Limited Group Audited financial results 2013
Salient features continued 
for the year ended 30 June 
2013 
Rm 
2012 
Rm 
Remeasurement items per above 
Mining 7 61 
Gas – 11 
Synfuels 77 238 
Oil 78 14 
Synfuels International (7) 34 
Petroleum International 428 1 609 
Polymers 3 572 62 
Solvents 341 83 
Olefins & Surfactants 64 (179) 
Other chemical businesses 1 815 (94) 
Other businesses 112 21 
Remeasurement items 6 487 1 860 
Headline earnings per share Rand 52,62 42,28 
Diluted headline earnings per share Rand 52,53 42,07 
The reader is referred to the definitions contained in the 2012 Sasol Limited annual financial statements. 
19
Basis of preparation and accounting policies 
The preliminary summarised consolidated financial results for the year ended 30 June 2013 have been prepared in 
accordance with the framework concepts and the recognition and measurement requirements of International Financial 
Reporting Standards (IFRS), the presentation and disclosure requirements of International Accounting Standard 34 Interim 
Financial Reporting applied to year end reporting, Listings Requirements of the JSE Limited, the SAICA Financial Reporting 
Guides as issued by the Accounting Practices Committee and Financial Pronouncements as issued by the Financial 
Reporting Standards Council, as well as the requirements of the South African Companies Act, 2008, as amended. 
The accounting policies applied in the presentation of the preliminary summarised consolidated financial results are 
consistent with those applied for the year ended 30 June 2012 and are in terms of IFRS as issued by the International 
Accounting Standards Board except as follows: 
Sasol Limited has early adopted the following standards: 
– IAS 36 (Amendment), Impairment of assets: Recoverable Amount Disclosures for Non-Financial Assets. 
– IAS 39 (Amendment), Financial Instruments: Recognition and Measurement: Novation of Derivatives and Continuation 
of Hedge Accounting. 
– IFRIC 21, Levies. 
These newly adopted standards did not significantly impact our financial results. With effect from 1 July 2012, the group 
changed the presentation of its income statement from a classification based on function to a classification based on 
nature. Sasol has elected to change its income statement presentation to better reflect how it effectively manages its 
business as well as align to peers. The comparative period presented has been restated to comply with the income 
statement classification by nature. The change in the income statement presentation did not have an impact on turnover, 
operating profit or earnings per share. 
The preliminary summarised consolidated financial results do not include all the disclosure required for complete annual 
financial statements prepared in accordance with IFRS. 
These preliminary summarised consolidated financial results have been prepared in accordance with the historic cost 
convention except that certain items, including derivative instruments, liabilities for cash-settled share-based payment 
schemes, financial assets at fair value through profit or loss and available-for-sale financial assets, are stated at fair value. 
The preliminary summarised consolidated financial results are presented in South African rand, which is Sasol Limited’s 
functional and presentation currency. 
The preliminary summarised consolidated financial results appearing in this announcement are the responsibility of the 
directors. The directors take full responsibility for the preparation of the preliminary summarised consolidated financial 
results and that the financial information has been correctly extracted from the underlying audited annual financial 
statements. Christine Ramon CA(SA), Chief Financial Officer, is responsible for this set of financial results and has 
supervised the preparation thereof in conjunction with the Executive: Group Finance, Paul Victor CA(SA). 
Related party transactions 
The group, in the ordinary course of business, entered into various sale and purchase transactions on an arm’s length basis 
at market rates with related parties. 
Significant changes in contingent liabilities since 30 June 2012 
As a result of the fine imposed on Sasol Wax GmbH in October 2008 by the European Commission, on 23 September 
2011, Sasol Wax GmbH and Sasol Wax International AG were served with a law suit in The Netherlands by a company to 
which potential claims for compensation of damages have been assigned to by eight customers. The outcome of these 
proceedings cannot be determined at present. On 30 September 2011, another law suit had been lodged with the London 
High Court by 30 plaintiffs against Sasol Wax GmbH, Sasol Wax International AG and Sasol Holding in Germany GmbH. 
In the course of June 2013, full and final settlements have been reached with all 30 plaintiffs. 
Independent audit by the auditors 
These preliminary summarised consolidated financial results for the year ended 30 June 2013 have been derived from 
the audited consolidated annual financial statements of Sasol Limited for the year ended 30 June 2013, on which the 
auditors, KPMG Inc., have expressed an unmodified audit opinion. The individual auditor assigned to perform the audit is 
Mr CH Basson. KPMG Inc. has also issued an unmodified audit report on these summarised financial statements, stating 
that these summarised financial statements are consistent, in all material respects, with those financial statements. The 
auditor’s reports and the audited consolidated annual financial statements, which have been summarised in this report, 
are available for inspection at the registered office of the company. 
20 Sasol Limited Group Audited financial results 2013
Registered office: Sasol Limited, 1 Sturdee Avenue, Rosebank, Johannesburg 2196 
PO Box 5486, Johannesburg 2000, South Africa 
Share registrars: Computershare Investor Services (Pty) Ltd., 70 Marshall Street, Johannesburg 2001 
PO Box 61051, Marshalltown 2107, South Africa, Tel: +27 11 370-7700 Fax: +27 11 370-5271/2 
JSE Sponsor: Deutsche Securities (SA) Pty Ltd. 
Directors (non-executive): Mrs TH Nyasulu (Chairman), Mr C Beggs*, Mr HG Dijkgraaf (Dutch)*, Dr MSV Gantsho*, 
Ms IN Mkhize*, Mr ZM Mkhize*, Mr MJN Njeke*, Mr PJ Robertson (British and American)*, Prof JE Schrempp (German)^, 
Mr S Westwell (British)* 
(executive): Mr DE Constable (Chief Executive Officer) (Canadian), Mrs KC Ramon (Chief Financial Officer), 
Ms VN Fakude 
*Independent ^Lead independent director 
Company secretary: Mr VD Kahla 
Company registration number: 1979/003231/06, incorporated in the Republic of South Africa 
Income tax reference number: 9520/018/60/8 
JSE NYSE 
Sasol Ordinary shares 
Share code: SOL SSL 
ISIN: ZAE000006896 US8038663006 
Sasol BEE Ordinary shares 
Share code: SOLBE1 
ISIN: ZAE000151817 
American depositary receipts (ADR) program: 
Cusip number 803866300 ADR to ordinary share 1:1 
Depositary: The Bank of New York Mellon, 22nd floor, 101 Barclay Street, New York, NY 10286, USA 
Disclaimer – Forward-looking statements: Sasol may, in this document, make certain statements that are not 
historical facts and relate to analyses and other information which are based on forecasts of future results and 
estimates of amounts not yet determinable. These statements may also relate to our future prospects, 
developments and business strategies. Examples of such forward-looking statements include, but are not limited to, 
statements regarding exchange rate fluctuations, volume growth, increases in market share, total shareholder return 
and cost reductions. Words such as “believe”, “anticipate”, “expect”, “intend”, “seek”, “will”, “plan”, “could”, “may”, 
“endeavour” and “project” and similar expressions are intended to identify such forward-looking statements, but are 
not the exclusive means of identifying such statements. By their very nature, forward-looking statements involve 
inherent risks and uncertainties, both general and specific, and there are risks that the predictions, forecasts, 
projections and other forward-looking statements will not be achieved. If one or more of these risks materialise, or 
should underlying assumptions prove incorrect, our actual results may differ materially from those anticipated. You 
should understand that a number of important factors could cause actual results to differ materially from the plans, 
objectives, expectations, estimates and intentions expressed in such forward-looking statements. These factors are 
discussed more fully in our most recent annual report under the Securities Exchange Act of 1934 on Form 20-F 
filed on 12 October 2012 and in other filings with the United States Securities and Exchange Commission. The list 
of factors discussed therein is not exhaustive; when relying on forward-looking statements to make investment 
decisions, you should carefully consider both these factors and other uncertainties and events. Forward-looking 
statements apply only as of the date on which they are made, and we do not undertake any obligation to update 
or revise any of them, whether as a result of new information, future events or otherwise. 
Please note: A billion is defined as one thousand million. All references to years refer to the financial year ended 
30 June. Any reference to a calendar year is prefaced by the word “calendar”.
www.sasol.com

More Related Content

What's hot

Rudra Shares Fundamental Call Report- Bodal chemicals ltd
 Rudra Shares Fundamental Call Report- Bodal chemicals  ltd Rudra Shares Fundamental Call Report- Bodal chemicals  ltd
Rudra Shares Fundamental Call Report- Bodal chemicals ltdAnkurShah108
 
April/May 2018 Investor Presentation
April/May 2018 Investor PresentationApril/May 2018 Investor Presentation
April/May 2018 Investor Presentationingersollrand2016
 
May 2018 investor presentation
May 2018 investor presentationMay 2018 investor presentation
May 2018 investor presentationingersollrand2016
 
SGS 2014 Full Year Results
SGS 2014 Full Year ResultsSGS 2014 Full Year Results
SGS 2014 Full Year ResultsSGS
 
SGS_CC_Full_Year_Results_2014_EN
SGS_CC_Full_Year_Results_2014_ENSGS_CC_Full_Year_Results_2014_EN
SGS_CC_Full_Year_Results_2014_ENShahriyar Majlesein
 
Q2 2017 earnings presentation final
Q2 2017 earnings presentation finalQ2 2017 earnings presentation final
Q2 2017 earnings presentation finalingersollrand2016
 
Hydrogen Group Investor Presentation 2014
Hydrogen Group Investor Presentation 2014Hydrogen Group Investor Presentation 2014
Hydrogen Group Investor Presentation 2014Samantha Garrad
 
Bruker Q3'18 Earnings Slides
Bruker Q3'18 Earnings SlidesBruker Q3'18 Earnings Slides
Bruker Q3'18 Earnings SlidesInvestorBruker
 
2q '16 earnings presentation final
2q '16 earnings presentation final2q '16 earnings presentation final
2q '16 earnings presentation finalq4curtisswright
 
Colgate ru2 qfy2011-281010
Colgate  ru2 qfy2011-281010Colgate  ru2 qfy2011-281010
Colgate ru2 qfy2011-281010Angel Broking
 
Barry Callebaut Group - Half-Year Results Fiscal Year 2017/18 - Media/Analyst...
Barry Callebaut Group - Half-Year Results Fiscal Year 2017/18 - Media/Analyst...Barry Callebaut Group - Half-Year Results Fiscal Year 2017/18 - Media/Analyst...
Barry Callebaut Group - Half-Year Results Fiscal Year 2017/18 - Media/Analyst...Barry Callebaut
 
Klöckner & Co - Q3 2012 Results
Klöckner & Co - Q3 2012 ResultsKlöckner & Co - Q3 2012 Results
Klöckner & Co - Q3 2012 ResultsKlöckner & Co SE
 
Klöckner & Co - Roadshow Presentation November 2012
Klöckner & Co - Roadshow Presentation November 2012Klöckner & Co - Roadshow Presentation November 2012
Klöckner & Co - Roadshow Presentation November 2012Klöckner & Co SE
 
Rockwell Automation Q2 FY17 Earnings Presentation
Rockwell Automation Q2 FY17 Earnings PresentationRockwell Automation Q2 FY17 Earnings Presentation
Rockwell Automation Q2 FY17 Earnings PresentationRockwellAutomationIR
 

What's hot (17)

Rudra Shares Fundamental Call Report- Bodal chemicals ltd
 Rudra Shares Fundamental Call Report- Bodal chemicals  ltd Rudra Shares Fundamental Call Report- Bodal chemicals  ltd
Rudra Shares Fundamental Call Report- Bodal chemicals ltd
 
April/May 2018 Investor Presentation
April/May 2018 Investor PresentationApril/May 2018 Investor Presentation
April/May 2018 Investor Presentation
 
May 2018 investor presentation
May 2018 investor presentationMay 2018 investor presentation
May 2018 investor presentation
 
SGS 2014 Full Year Results
SGS 2014 Full Year ResultsSGS 2014 Full Year Results
SGS 2014 Full Year Results
 
SGS_CC_Full_Year_Results_2014_EN
SGS_CC_Full_Year_Results_2014_ENSGS_CC_Full_Year_Results_2014_EN
SGS_CC_Full_Year_Results_2014_EN
 
Q2 2017 earnings presentation final
Q2 2017 earnings presentation finalQ2 2017 earnings presentation final
Q2 2017 earnings presentation final
 
Jp morgan leave behind
Jp morgan leave behindJp morgan leave behind
Jp morgan leave behind
 
Hydrogen Group Investor Presentation 2014
Hydrogen Group Investor Presentation 2014Hydrogen Group Investor Presentation 2014
Hydrogen Group Investor Presentation 2014
 
Bruker Q3'18 Earnings Slides
Bruker Q3'18 Earnings SlidesBruker Q3'18 Earnings Slides
Bruker Q3'18 Earnings Slides
 
2q '16 earnings presentation final
2q '16 earnings presentation final2q '16 earnings presentation final
2q '16 earnings presentation final
 
Barclays CEO Energy Conference
Barclays CEO Energy ConferenceBarclays CEO Energy Conference
Barclays CEO Energy Conference
 
Colgate ru2 qfy2011-281010
Colgate  ru2 qfy2011-281010Colgate  ru2 qfy2011-281010
Colgate ru2 qfy2011-281010
 
Barry Callebaut Group - Half-Year Results Fiscal Year 2017/18 - Media/Analyst...
Barry Callebaut Group - Half-Year Results Fiscal Year 2017/18 - Media/Analyst...Barry Callebaut Group - Half-Year Results Fiscal Year 2017/18 - Media/Analyst...
Barry Callebaut Group - Half-Year Results Fiscal Year 2017/18 - Media/Analyst...
 
Klöckner & Co - Q3 2012 Results
Klöckner & Co - Q3 2012 ResultsKlöckner & Co - Q3 2012 Results
Klöckner & Co - Q3 2012 Results
 
Klöckner & Co - Roadshow Presentation November 2012
Klöckner & Co - Roadshow Presentation November 2012Klöckner & Co - Roadshow Presentation November 2012
Klöckner & Co - Roadshow Presentation November 2012
 
Rockwell Automation Q2 FY17 Earnings Presentation
Rockwell Automation Q2 FY17 Earnings PresentationRockwell Automation Q2 FY17 Earnings Presentation
Rockwell Automation Q2 FY17 Earnings Presentation
 
Baml leave behind
Baml leave behindBaml leave behind
Baml leave behind
 

Similar to Sasol results june 2013

Interim Results Announcement 2013
Interim Results Announcement 2013Interim Results Announcement 2013
Interim Results Announcement 2013Aviva plc
 
Q4 2013 Earnings Presentation
Q4 2013 Earnings PresentationQ4 2013 Earnings Presentation
Q4 2013 Earnings PresentationInvestorBruker
 
I-Bytes Manufacturing Industry
I-Bytes Manufacturing IndustryI-Bytes Manufacturing Industry
I-Bytes Manufacturing IndustryEGBG Services
 
AMD Second Quarter 2013 Earnings Results Summary
AMD Second Quarter 2013 Earnings Results SummaryAMD Second Quarter 2013 Earnings Results Summary
AMD Second Quarter 2013 Earnings Results SummaryAMD
 
SGS 2022 Full Year Results Report
SGS 2022 Full Year Results ReportSGS 2022 Full Year Results Report
SGS 2022 Full Year Results ReportSGS
 
Southwestern Energy's 2013 Q413 and Full Year 2013 Financial/Operational Update
Southwestern Energy's 2013 Q413 and Full Year 2013 Financial/Operational UpdateSouthwestern Energy's 2013 Q413 and Full Year 2013 Financial/Operational Update
Southwestern Energy's 2013 Q413 and Full Year 2013 Financial/Operational UpdateMarcellus Drilling News
 
SGS 2014 Half Year Results Report
SGS 2014 Half Year Results ReportSGS 2014 Half Year Results Report
SGS 2014 Half Year Results ReportSGS
 
Half Year 2014 Results Announcement
Half Year 2014 Results AnnouncementHalf Year 2014 Results Announcement
Half Year 2014 Results AnnouncementAviva plc
 
SGS 2023 Half Year Results Report
SGS 2023 Half Year Results ReportSGS 2023 Half Year Results Report
SGS 2023 Half Year Results ReportSGS
 
SGS 2015 Annual Report
SGS 2015 Annual ReportSGS 2015 Annual Report
SGS 2015 Annual ReportSGS
 
Klöckner & Co - Credit Suisse Global Steel and Mining Conference, September 1...
Klöckner & Co - Credit Suisse Global Steel and Mining Conference, September 1...Klöckner & Co - Credit Suisse Global Steel and Mining Conference, September 1...
Klöckner & Co - Credit Suisse Global Steel and Mining Conference, September 1...Klöckner & Co SE
 
air products & chemicals Q4 FY 08 earnings
air products & chemicals Q4 FY 08 earningsair products & chemicals Q4 FY 08 earnings
air products & chemicals Q4 FY 08 earningsfinance26
 
air products & chemicals Q4 FY 06 Earnings
air products & chemicals Q4 FY 06 Earningsair products & chemicals Q4 FY 06 Earnings
air products & chemicals Q4 FY 06 Earningsfinance26
 
2Q 2016 Ryder System Inc. Earnings Presentation
2Q 2016 Ryder System Inc. Earnings Presentation2Q 2016 Ryder System Inc. Earnings Presentation
2Q 2016 Ryder System Inc. Earnings PresentationRyder System, Inc.
 
Klöckner & Co - UBS Best of Germany Conference, September 17, 2013
Klöckner & Co - UBS Best of Germany Conference, September 17, 2013Klöckner & Co - UBS Best of Germany Conference, September 17, 2013
Klöckner & Co - UBS Best of Germany Conference, September 17, 2013Klöckner & Co SE
 
Full year results presentation (final excluding script)
Full year results presentation (final excluding script)Full year results presentation (final excluding script)
Full year results presentation (final excluding script)Company Spotlight
 
Klöckner & Co SE Annual Report 2013
Klöckner & Co SE Annual Report 2013Klöckner & Co SE Annual Report 2013
Klöckner & Co SE Annual Report 2013Klöckner & Co SE
 
Afrox 2018 year-end results
Afrox 2018 year-end resultsAfrox 2018 year-end results
Afrox 2018 year-end resultsSimon Miller
 

Similar to Sasol results june 2013 (20)

Interim Results Announcement 2013
Interim Results Announcement 2013Interim Results Announcement 2013
Interim Results Announcement 2013
 
Q4 2013 Earnings Presentation
Q4 2013 Earnings PresentationQ4 2013 Earnings Presentation
Q4 2013 Earnings Presentation
 
Interim Results to 30 November 2013
Interim Results to 30 November 2013Interim Results to 30 November 2013
Interim Results to 30 November 2013
 
I-Bytes Manufacturing Industry
I-Bytes Manufacturing IndustryI-Bytes Manufacturing Industry
I-Bytes Manufacturing Industry
 
AMD Second Quarter 2013 Earnings Results Summary
AMD Second Quarter 2013 Earnings Results SummaryAMD Second Quarter 2013 Earnings Results Summary
AMD Second Quarter 2013 Earnings Results Summary
 
SGS 2022 Full Year Results Report
SGS 2022 Full Year Results ReportSGS 2022 Full Year Results Report
SGS 2022 Full Year Results Report
 
Southwestern Energy's 2013 Q413 and Full Year 2013 Financial/Operational Update
Southwestern Energy's 2013 Q413 and Full Year 2013 Financial/Operational UpdateSouthwestern Energy's 2013 Q413 and Full Year 2013 Financial/Operational Update
Southwestern Energy's 2013 Q413 and Full Year 2013 Financial/Operational Update
 
SGS 2014 Half Year Results Report
SGS 2014 Half Year Results ReportSGS 2014 Half Year Results Report
SGS 2014 Half Year Results Report
 
Half Year 2014 Results Announcement
Half Year 2014 Results AnnouncementHalf Year 2014 Results Announcement
Half Year 2014 Results Announcement
 
SGS 2023 Half Year Results Report
SGS 2023 Half Year Results ReportSGS 2023 Half Year Results Report
SGS 2023 Half Year Results Report
 
SGS 2015 Annual Report
SGS 2015 Annual ReportSGS 2015 Annual Report
SGS 2015 Annual Report
 
Origin
OriginOrigin
Origin
 
Klöckner & Co - Credit Suisse Global Steel and Mining Conference, September 1...
Klöckner & Co - Credit Suisse Global Steel and Mining Conference, September 1...Klöckner & Co - Credit Suisse Global Steel and Mining Conference, September 1...
Klöckner & Co - Credit Suisse Global Steel and Mining Conference, September 1...
 
air products & chemicals Q4 FY 08 earnings
air products & chemicals Q4 FY 08 earningsair products & chemicals Q4 FY 08 earnings
air products & chemicals Q4 FY 08 earnings
 
air products & chemicals Q4 FY 06 Earnings
air products & chemicals Q4 FY 06 Earningsair products & chemicals Q4 FY 06 Earnings
air products & chemicals Q4 FY 06 Earnings
 
2Q 2016 Ryder System Inc. Earnings Presentation
2Q 2016 Ryder System Inc. Earnings Presentation2Q 2016 Ryder System Inc. Earnings Presentation
2Q 2016 Ryder System Inc. Earnings Presentation
 
Klöckner & Co - UBS Best of Germany Conference, September 17, 2013
Klöckner & Co - UBS Best of Germany Conference, September 17, 2013Klöckner & Co - UBS Best of Germany Conference, September 17, 2013
Klöckner & Co - UBS Best of Germany Conference, September 17, 2013
 
Full year results presentation (final excluding script)
Full year results presentation (final excluding script)Full year results presentation (final excluding script)
Full year results presentation (final excluding script)
 
Klöckner & Co SE Annual Report 2013
Klöckner & Co SE Annual Report 2013Klöckner & Co SE Annual Report 2013
Klöckner & Co SE Annual Report 2013
 
Afrox 2018 year-end results
Afrox 2018 year-end resultsAfrox 2018 year-end results
Afrox 2018 year-end results
 

Sasol results june 2013

  • 1. Sasol Limited audited financial results for the year ended 30 June 2013 better together... we deliver
  • 2. highlights Sasol Synfuels’ production volumes up by 4% Cash fixed costs (excluding exchange rate effects) increased by 7%, in real terms Operating profit up by a record 26%, excluding once-offs Headline earnings per share up by 25% to R52,62 Total dividend of R19,00 per share, up by 9% Cash generated by operating activities up by 24% Safety recordable case rate (RCR) of 0,31, which is the lowest annual result in our 63 year history Total skills development spend of R837 million Committed to excellence in all we do, Sasol is an international integrated energy and chemical company that leverages the talent and expertise of our more than 35 000 people working in 37 countries. We develop and commercialise technologies, and build and operate world-scale facilities to produce a range of high-value product streams, including liquid fuels, chemicals and low-carbon electricity.
  • 3. Contribution to group turnover (%) Contribution to group operating profit after remeasurement items (%) 2013 2012 2013 2012 1 Segment report for the year ended 30 June Turnover R million Business unit analysis Operating profit/(loss) after remeasurement items R million 2012 2013 2013 2012 133 814 146 846 South African energy cluster 36 978 28 957 10 672 12 324 Mining 2 213 2 287 6 931 8 254 Gas 4 069 2 985 48 791 58 275 Synfuels 28 624 22 095 67 420 67 993 Oil 2 072 1 592 – – Other – (2) 8 429 8 886 International energy cluster (285) (55) 5 318 5 252 Synfuels International 1 601 1 881 3 111 3 634 Petroleum International (1 886) (1 936) 94 752 105 313 Chemical cluster 1 919 6 500 20 081 23 106 Polymers (2 829) 716 18 914 21 291 Solvents 916 1 403 37 698 41 278 Olefins & Surfactants 3 580 3 193 18 059 19 638 Other chemical businesses 252 1 188 50 368 Other businesses1 2 016 1 356 237 045 261 413 40 628 36 758 (67 599) (80 144) Intersegmental turnover1 169 446 181 269 1 Intersegmental turnover amounting to R8 548 million was reclassified to other intersegmental operating income as part of the change in the income statement presentation from function to nature, which is eliminated in the consolidated annual financial statements.
  • 4. overview Advancing sustainably Chief Executive Officer, David E. Constable says: “With the bar set high, the group posted another excellent all-round performance in 2013 against financial, operational and safety performance targets. Clearly, macroeconomic factors continue to support Sasol’s overall value proposition. Our strong results are also testament to the resilience of our strategy, where an uncertain and volatile external environment is weighing heavily on economic growth. With a sharpened strategic focus, significant progress in relation to our US mega-projects, and the initiation of a complete organisational redesign, this past financial year will be seen as a watershed for Sasol. As we take bold steps forward, we are driving to become a more effective, efficient and competitive organisation – making Sasol fit for the future, both at home and abroad. This, together with our high performing people, trusted business partners, loyal customers and suppliers, strong project pipeline and long-term strategic vision will ensure that we deliver sustainable value for all of our stakeholders for decades to come. In all that we do, we remain committed to act responsibly and to continuously improve.” Year-end results overview Earnings attributable to shareholders for the year ended 30 June 2013 increased by 11% to R26,3 billion from R23,6 billion in the prior year. Headline earnings per share increased by 25% to R52,62 and earnings per share increased by 11% to R43,38, over the same period. Sasol recorded an operating profit, excluding share of profit of associates, of R40,6 billion for the year. Excluding the impact of net once-off charges, amounting to R8,5 billion, operating profit increased by 26% compared with the prior year, on the back of an overall improved operational performance. Operating profit was boosted by a 14% weaker average rand/US dollar exchange rate (R8,85/US$ at 30 June 2013 compared with R7,78/US$ at 30 June 2012), despite a 3% lower average Brent crude oil price (average dated Brent was US$108,66/barrel at 30 June 2013 compared with US$112,42/barrel at 30 June 2012) and lower product prices. The operating profit in the current year was negatively impacted by net once-off charges totalling R8,5 billion (30 June 2012 – R2,1 billion). These items relate primarily to the partial impairments of our Arya Sasol Polymer Company (ASPC) investment and the FT wax expansion project of R3 611 million and R2 033 million, respectively, as well as the write off of an unsuccessful exploration well in Mozambique amounting to R442 million. In addition, included in the once-off charges is an amount of R2 021 million related to translation losses, primarily at our ASPC operations, resulting from the depreciation of the Iranian Rial against the US dollar. These once-off items also include a gain of R233 million relating to the remeasurement to fair value of our existing shareholding in the Merisol business, which arose from the acquisition of the remaining 50% of Merisol. Our operating profit further includes a gain on the valuation of our open Canadian foreign exchange contracts amounting to R439 million. Operating profit for the second half of the year, compared to the first half of the year, was R2,8 billion higher mainly as a result of the weaker rand/US dollar exchange rate, partly offset by the further impairment of ASPC and the partial impairment of the FT wax expansion project. In addition, translation 2 Sasol Limited Group Audited financial results 2013
  • 5. gains, year-end stock movements as well as the positive impact of the change in discount rates on our provision for environmental rehabilitation contributed further to the higher operating profit. Sasol Synfuels delivered production volumes for the year of 7,443 million tons (mt), which was 4% higher than the prior year. Stable operations, as well as the performance of the running plant during the phased shutdown resulted in the improved production volumes. This is the highest production volumes delivered by Sasol Synfuels since the 2006 financial year, post Clean Fuels 1 implementation. We continue to optimise our European chemical businesses’ production to match lower demand and optimise margins in light of the continuing weak European market conditions. Production performance at our ORYX gas-to-liquids (GTL) operations was in line with our expectations, taking into account the planned maintenance shutdown in February 2013. ASPC achieved a utilisation rate of 80% in line with our production expectations. Cash fixed costs, excluding once-off and growth costs and the impact of a weaker exchange rate, increased by 7% in real terms, primarily due to a challenging South African cost environment in respect of labour, maintenance and electricity costs. Our current cost inflation is above the indicative South African producers’ price index inflation trends of 6,0% for the 2013 financial year. A key area of management focus is our cost optimisation project, where we are actively looking at opportunities to significantly reduce and contain our cost base sustainably. The effective tax rate of 31,7% is lower than the prior year’s effective tax rate of 32,6%. This resulted primarily from an increase in non-deductible expenses relating mainly to once-off charges, which was offset by the absence of Secondary Tax on Companies, due to the implementation of dividend withholding tax, as well as the increase in exempt income. Cash flow generated by operating activities increased by 24% to R59,3 billion compared with R47,9 billion in the prior year. However, this was offset by increased working capital, both as a result of price and volume effects. Capital investments for the year amounted to R32,3 billion. Taking into account the ongoing strength of our financial position, current capital investment plans, as well as the progressive dividend policy, management has recommended and the Sasol board has approved the final dividend. This approach remains in line with our commitment to consistently return sustainable value to shareholders. 3 Chief Financial Officer, Christine Ramon says: “We continue to demonstrate our strong cash flow generation ability across our businesses through the cycle. We remain committed to a progressive dividend policy, barring significant economic variables such as abnormal fluctuations in the oil price and exchange rates. We continue to deliver value to shareholders, despite the negative impact on our profitability of once-off charges, mainly impairments. Our balance sheet continues to be resilient, which positions the company well to fund our attractive growth projects, our progressive dividend policy as well as to provide a buffer for volatility.” Sasol fit for the future To make Sasol fit for the future, we are taking decisive and proactive measures to secure our long-term growth and competitiveness. During 2013, our focus on operational performance resulted in improved plant stability and higher production volumes. Looking ahead, under our business performance enhancement programme, we will continue to improve operational productivity, while designing an effective operating model for Sasol. Our aim is to implement initiatives, which address both cost creep and organisational complexity to ensure that we become a more effective, efficient and competitive organisation over the long term.
  • 6. Through our business performance enhancement programme, we expect to generate sustainable annual savings of at least R3 billion over the next two to three years. The drivers for the savings target will be a combination of efficiency benefits stemming from our new operating model, productivity improvements in our operations, designing “fit-for-purpose” group functions and procurement cost reduction strategies. We will be able to share more details on the group’s new operating model, as well as the source and timelines of these savings at our interim results announcement in March 2014. Delivering on growth and operations excellence We continue to progress on the delivery of our project pipeline and it is pleasing that: • Looking at our growth projects: – We continue to make progress on the execution of the front-end engineering and design (FEED) phase of an integrated, world-scale ethane cracker and downstream derivatives units, and will commence with FEED for the US GTL and chemicals value-adds facility at the Lake Charles chemicals complex in Louisiana, the United States, during the second half of the 2013 calendar year: • The ethane cracker (estimated to cost between US$5 billion and US$7 billion) will produce 1,5 million tons of ethylene that will be used to manufacture a range of ethylene derivatives. The main technologies for the ethane cracker and derivatives units have been selected and we have placed orders for critical long-lead equipment. We expect beneficial operation for the ethane cracker to be achieved during the 2017 calendar year, with the final investment decision (FID) to be taken during the 2014 calendar year. • The US GTL facility (with an estimated cost of between US$11 billion and US$14 billion) will produce at least a nominal 96 000 barrels per day (bbl/d) of product, with the potential to produce up to 10% more. The US GTL project will be delivered in two phases after the ethane cracker, with each phase comprising at least 48 000 bbl/d. The FID for the US GTL project is expected to be taken within 18 to 24 months after that of the US ethane cracker. • We have submitted the filings for the key environmental permits, and have regular interaction with the authorities and other stakeholders to monitor the process. The outcome of the permit applications are expected towards the end of the FEED phase. • We announced the introduction of a Voluntary Property Purchase Program for residents in designated areas to the northwest and west of our existing facility in Westlake, Louisiana. This programme will provide eligible property owners with the option to sell their property to Sasol, and relocate to an alternative neighbourhood, if they so choose. • The Louisiana Joint Legislative Committee on the State’s Budget approved the Cooperative Endeavors Agreement (CEA) between Sasol and the State of Louisiana, which facilitates the economic incentives package for the ethane cracker and US GTL projects. • In June 2013, we signed a memorandum of understanding (MOU) with Ineos Olefins & Polymers USA (Ineos). The intent of the MOU is to form a joint venture to manufacture high density polyethylene (HDPE). The proposed plant will produce 470 kilotons per annum of bimodal HDPE using an Innovene™ S process technology licensed from Ineos, and will utilise ethylene from the Lake Charles cracker project to provide Sasol with integrated manufacturing economics. The final investment decision for this plant is expected to be taken in the first half of the 2014 calendar year with start-up expected at the end of the 2015 calendar year. – Our Uzbekistan GTL FEED activities are progressing well and are expected to be completed during the second half of the 2013 calendar year. Sasol regularly reviews the projects in its project pipeline. As a result of the magnitude of our growth portfolio, as well as significant sustenance capital required for our South African operations, the Sasol board approved that we decrease our shareholding in the Uzbekistan GTL project from 44,5% to 25,5% at the end of the FEED phase. The FID remains subject to key conditions, including successful project financing and non-state 4 Sasol Limited Group Audited financial results 2013
  • 7. 5 ownership of at least 50,1%. The Uzbekistan GTL project remains an important project in Sasol’s GTL growth portfolio and the business case for the project remains robust. – In Nigeria, the Escravos GTL project is progressing steadily, with commissioning and start-up activities. The plant is expected to be in operation towards the end of the 2013 calendar year. • Focusing on our foundation businesses: – The Sasol Synfuels growth programme is progressing, with the first set of the gas heated heat exchange reformers (GHHERs) reaching beneficial operation in June 2013. The beneficial operation of the entire programme is expected to be reached in December 2014. The complex brownfields volatile organic compound abatement project continues, along with the replacement of tar tanks and separators as well as the coal tar filtration east project. – The development of the Impumelelo and Shondoni Collieries, which are part of Sasol Mining’s R14 billion mine replacement projects, remain on track. It is anticipated that the projects will be completed within budget, reaching beneficial operation during the second half of the 2014 and 2015 calendar years, respectively. – Construction on the FT wax expansion facility in Sasolburg, South Africa, continues to progress. The commissioning of the new Slurry Bed Reactor, which is critically important for the capacity expansion, is expected to take place at the end of March 2014. Phase 2 of the project will be impacted by the delay of phase 1 and commissioning of phase 2’s key equipment (second Slurry Bed Reactor) is expected to take place in August 2016. The total project cost of both phases 1 and 2 is an estimated total cost of R11,9 billion. The total project cost comprises both phase 1 and phase 2 costs, estimated at R9,0 billion and R2,9 billion, respectively. Due to the volatile macroeconomic environment and increased costs relating primarily to construction delays and poor labour productivity, we recognised a partial impairment of R2 033 million at 30 June 2013 in respect of the project. All efforts are being made to monitor and mitigate the risks identified on the project and to improve the economics thereof. – The construction of our R1,9 billion ethylene purification unit project in Sasolburg, and the R1,3 billion C3 stabilisation project in Secunda remain on track. These projects are expected to be in operation during the second half of the 2013 calendar year and in the middle of the 2014 calendar year, respectively. – During the year, through Sasol New Energy (SNE), we continued to advance the development of our 49% share of the US$246 million 140 megawatts gas-fired power generation plant in Mozambique, in partnership with the country’s state-owned power utility Electricidade de Moçambique at Ressano Garcia (EDM). EDM will be the sole offtaker of the electricity under a long-term power purchase agreement. Civil work and construction have commenced on site. Beneficial operation is expected during the first half of the 2014 calendar year. • Turning to our upstream activities: – We are rationalising our global exploration portfolio and, during the year, relinquished various exploration licences in Mozambique, Papua New Guinea and Australia. In doing so, we have high-graded our exploration portfolio, which still contains a number of very promising assets in other parts of Mozambique, Australia, South Africa and Botswana. – The Inhassoro I-9Z extended well test in the Mozambique Production Sharing Agreement (PSA) area contributed 197 000 barrels of light oil during the year. – In November 2012, we completed the PSA appraisal phase programme in Mozambique and notified its government that two oil and two gas reservoirs are commercially viable and will be considered for future development. The Field Development Plan is to be submitted by 25 February 2015, which will give effect to a final investment decision. In October 2012, we completed the expansion of the Central Processing Facility (CPF) in Mozambique, increasing annual production capacity to 183 million gigajoules per annum (MGJ/a). The agreement for the 27 MGJ/a allocated to
  • 8. South Africa from the additional capacity was concluded in 2009 and has been in effect since 2010. In 2013, we successfully concluded three new gas sales agreements for the additional capacity, which was allocated to the Mozambican electricity market. 9 MGJ/a of the additional capacity comprises royalty gas for the Mozambican government. In support of the increased capacity, Sasol Gas together with its partner, has begun construction of the R1,98 billion loop line to allow for the additional monetisation of gas in Mozambique. – In offshore Gabon, we are maturing and developing new oil reserves to maintain and potentially boost production in the non-operated Etame Marin Permit. During 2013, an amount of US$168,2 million was approved for two new development projects, namely the Etame Expansion project and the South East Etame and North Tchibala project. The capital related to these investments commenced being incurred in 2013 and will continue through to the 2016 financial year. Our operations deliver solid performance South African energy cluster Sasol Mining – increased production coupled with higher costs Operating profit of R2 213 million was 3% lower than the prior year, primarily due to increased mining costs, external coal purchases and increased transport costs. Lower export sales volumes and coal prices were offset by higher volumes and sales prices to Sasol Synfuels compared to the prior year. Production volumes were up 1% compared to those of the prior year. Sasol Mining for the first time in its history had no fatalities during the year and reduced its RCR from 0,67 in 2012 to 0,57 in 2013. Sasol Gas – improved sales prices and volumes Operating profit increased by 36% to R4 069 million compared to the prior year. This was mainly as a result of increased sales volumes, which supported Sasol’s initiatives to increase energy efficiencies and minimise our carbon footprint. In addition, higher sales prices, on the back of the weaker rand/US dollar exchange rate, further contributed positively to our operating profit. Sasol Synfuels – production volumes up by 4% Sasol Synfuels’ operating profit increased by 30% to R28 624 million compared to the prior year primarily due to a weaker average rand/US dollar exchange rate resulting in favourable product prices and margins, as well as increased sales volumes. Production volumes of 7,443 million tons were 4% higher than the prior year due to stable operations, as well as the performance of the running plant during the phased shutdown in September 2012. Cash unit costs increased by 13% compared to the prior year, due to higher feedstock prices (which are largely internal to the group), as well as increased labour and energy costs. Sasol Oil – higher margins despite lower volumes Operating profit increased by 30% to R2 072 million compared to the prior year primarily due to higher marketing and refining margins, coupled with higher petroleum product prices and a weaker average rand/US dollar exchange rate. Sales and production volumes for the year were lower compared to the prior year. This was due to lower demand, in particular for black products, on the back of higher petroleum product prices. Production volumes were lower compared to the prior year due to the extended planned maintenance shutdown at our Natref refinery, coupled with the lower demand. International energy cluster Sasol Synfuels International (SSI) – lower ORYX GTL volumes due to shutdown SSI’s operating profit decreased by 15% to R1 601 million compared to the prior year. This was as a result of lower volumes from the ORYX GTL plant in Qatar due to the planned statutory shutdown in February 2013 as well as higher US GTL study costs compared to the prior year. The ORYX GTL plant, which has maintained an RCR of zero, achieved a full year average utilisation rate, taking into account 6 Sasol Limited Group Audited financial results 2013
  • 9. the planned statutory shutdown, of 80% of nameplate capacity. The shutdown enabled the ORYX GTL plant to progress various key de-bottlenecking projects, which have already resulted in operational benefits since start-up. Average throughput for the month of May and June 2013 exceeded 106% of design capacity. Sasol Petroleum International (SPI) – Mozambique volume growth, however, low North American gas prices impact Canadian asset performance SPI recorded an operating loss of R1 886 million compared to an operating loss of R1 936 million in the prior year. The operating loss was underpinned by higher gross margins, supported by improved production volumes. However, these favourable aspects were partly offset by higher depreciation, mainly related to our Canadian shale gas assets of CAD226 million, as well as increased operating and exploration costs elsewhere. The write off of the Mupeji-1 dry well in Mozambique amounting to R442 million, is included in the operating loss. The operating loss for the prior year includes a partial impairment of R964 million relating to our Canadian shale gas assets and the impairment of Block 16/19 in Mozambique of R434 million. Production volumes from our combined assets in Mozambique, Canada and Gabon increased by 16% compared to the prior year. The Pande and Temane gas fields in Mozambique performed well. Although Gabon oil production is slowly declining, we are maturing additional volumes in Gabon to sustain asset life-time. Our Canadian shale gas assets remains under pressure due to low gas market prices and high depreciation, contributing to the operating loss for the year. We are actively de-risking this asset to optimise ramp-up of development activities once gas prices increase. Chemical cluster Sasol Polymers – margin pressure and negative impact of ASPC partial impairment Sasol Polymers’ recorded an operating loss of R2 829 million compared to an operating profit of R716 million in the prior year. The South African polymers business recorded an operating loss of R1 785 million (2012 – R1 148 million). Sales volumes in our South African polymers business were 5% higher than the prior year, despite the slow recovery in the polymers market. Margins continue to be squeezed in the South African polymers business, where feedstock price increases outweighed the increases in selling prices. Our international operations contributed R4 588 million (2012 – R2 591 million) to operating profit, excluding the partial impairment of our investment in ASPC of R3 611 million and translation losses of R2 021 million (2012 – R727 million), relating primarily to our ASPC operations, mainly due to the depreciation of the Iranian Rial against the US dollar. ASPC achieved an average capacity utilisation rate of 80% for the year. However, due to logistical disruptions at ASPC, international operations’ sales volumes were 19% lower than the prior year. Sasol Solvents – 6% higher sales volumes despite challenging trading environment Operating profit decreased by 35% to R916 million compared to the prior year. The benefits of a 6% increase in sales volumes and a weaker rand/US dollar exchange rate were offset by declining US dollar selling prices and contracting margins, resulting from continued high feedstock prices over this period. Operating profit includes a partial impairment of R242 million related to our German operations. Sasol Olefins & Surfactants (Sasol O&S) – improved margins in the US compensate for weaker margins in Europe Operating profit increased by 23% to R3 580 million compared to the prior year, excluding the gain realised in the prior year on the sale of the Witten operations in Germany. While our US operations continued to benefit from the low US ethane prices, our European based businesses, whilst still profitable, came under increased pressure as a result of reduced volumes due to softer demand, coupled with continued high petrochemical feedstock prices. 7
  • 10. Other chemical businesses – challenging market conditions for Sasol Nitro, negative impact of FT wax expansion project impairment Our other chemical businesses recorded an operating profit of R252 million compared to an operating profit of R1 188 million in the prior year. The operating profit of our Sasol Wax business, excluding a R2 033 million partial impairment on the FT wax expansion project and other once-off items in the prior year, increased by 106% compared to the prior year on the back of the weaker rand/US dollar exchange rates. The Sasol Nitro business incurred an operating loss of R124 million for the year. This was due to the negative effects of labour unrest in the mining sector during the first half of the year, lower customer demand and significantly higher feedstock costs in the fertiliser business. Doing business responsibly We continued to deliver on our broader sustainability contributions during the period: – SNE’s external water conservation partnerships have started to yield results, with the first water savings of R10,5 million being realised through the repair of leaking plumbing in 60 000 houses in Sebokeng and Evaton, in the Sasolburg region. In addition, it created 75 local employment opportunities. The project will now start to become self-funded, demonstrating the sustainability of the “ring-fenced savings” funding model for the project. The concept of water off-setting has been positively received by the Parliamentary Portfolio Committee on Water and Environmental Affairs, and has been incorporated in the National Water Resource Strategy of the Department of Water Affairs. – In terms of South African climate change policy, our experts are participating in several working groups, together with the South African government and other stakeholders, to develop the standards and guidelines which would give effect to the country’s climate change response white paper, which was published in 2011. We continue to engage stakeholders on climate change-related policies and initiatives, to find workable and sustainable solutions as we transition to a low-carbon economy. – Sasol supports policies that are based on analysis that uses clear and accurate information, reflects the constraints of a transition to a lower carbon and climate resilient South African economy, while effectively contributing to the reduction of greenhouse gases. However, Sasol does not support the proposed carbon tax in its current form as: • a thorough analysis of the potential impacts and alternative options have not been performed; • it does not align with South Africa’s broader mitigation policy; and • it does not sufficiently take account of South Africa’s carbon mitigation and socio-economic challenges. – Throughout the year, we have engaged actively with government on air quality legislation, both individually and through various forums. Through our engagements, we continue to propose an air quality regulatory regime that is reasonable and practicable, and that aims to achieve tangible improvements in ambient air quality. – The safety incident recordable case rate (RCR) for employees and service providers, including injuries and illnesses, of 0,36 at 30 June 2013 has improved compared with the RCR rate of 0,39 at 30 June 2012. Notably, our RCR for employees and service providers, excluding illnesses, of 0,31 at 30 June 2013 (30 June 2012 – 0,35) is at its lowest level in our company’s 63 year history. – During the year, our Ikusasa programme progressed well. Four areas are focused on, namely education, health and wellbeing, infrastructure, and safety and security in the Secunda and Sasolburg regions. As part of our commitment to the communities in which we operate, we invested R72 million and R63 million in Secunda and Sasolburg, respectively, during the year, with a further R200 million per annum planned for 2014 through 2016. – During the year, we paid R30,8 billion in direct and indirect taxes to the South African government. Sasol remains one of the largest corporate taxpayers in South Africa, contributing significantly to the country’s economy. 8 Sasol Limited Group Audited financial results 2013
  • 11. Competition law compliance We continue to evaluate and enhance our compliance programmes and controls in general, and our competition law compliance programme and controls, in particular. As a consequence of these programmes and controls, including monitoring and review activities, we have also adopted appropriate remedial and/or mitigating steps, and made disclosures on material findings, as and when appropriate. The South African Competition Commission (the Commission) is conducting investigations into several industries in which Sasol operates, including the piped gas, petroleum, fertilisers and polymer industries. We continue to cooperate with the Commission in these investigations. To the extent appropriate, further announcements will be made in future. As part of its investigation into the polymer industry, the Commission has contended that the prices at which Sasol Polymers supplies propylene and polypropylene are excessive. Sasol Polymers does not agree with the Commission’s assessment and is contesting the Commission’s allegations. The majority of the matter was heard before the South African Competition Tribunal (the Tribunal) from 13 May 2013 to 7 June 2013 and the last of the Sasol witnesses took the stand in August 2013. Closing arguments will be made before the Tribunal by both Sasol and the Commission on 14 and 15 October 2013. The Commission has referred allegations of price-fixing and market division against Chevron SA, Engen, Shell SA, Total SA, Sasol Limited, BP SA and the South African Petroleum Industry Association (SAPIA) to the Tribunal for adjudication. The Commission is alleging that the respondents exchanged commercially sensitive information, mainly through SAPIA, in order to ensure that their respective prices for diesel followed the Wholesale List Selling Price published by the South African Department of Energy. This is not a new matter and Sasol began engaging with the Commission in this regard in 2008 as part of its group-wide competition law compliance review, which preceded the Commission’s investigation into the liquid fuels sector. Sasol has reviewed the Commission’s referral documents and does not agree with the Commission’s allegations. Accordingly, Sasol is defending the matter. Cash generation supports strong balance sheet The deleveraged balance sheet reflected an under-geared position of 0,3% at 30 June 2013 compared to the gearing level of 2,7% at 30 June 2012. The low gearing is supported by continued healthy cash flow generation, particularly from our foundation businesses. This low level of gearing is expected to be maintained in the short term, but is likely to return to within our targeted range of 20% to 40% in the medium term, taking into account our growth programme as well as our progressive dividend policy. Profit outlook† – strong management focus on improved operational performance and cost reduction Economic recovery in the global environment is expected to remain fragile and unbalanced. The European debt crisis has continued, weakening demand in that region. Coupled with the Chinese slowing growth, the announcement of the gradual withdrawal of quantitative easing by the Federal Reserve in the US, increased the risks of global economic recovery. Global economic growth is expected to remain modest in light of the uncertainties in the European and US markets in particular. Crude oil prices are expected to remain stable over the near term. Product prices are expected to remain volatile. The rand/US dollar exchange rate remains one of the biggest external factors impacting our profitability. We expect an overall solid production performance for the 2014 financial year with the following production guidance: – Sasol Synfuels’ volumes are expected to be between 7,3 and 7,5 million tons; † In accordance with standard practice, it is noted that this information has not been reviewed and reported on by the company’s 9 auditors.
  • 12. – The average utilisation rate at ORYX GTL in Qatar is expected to be above 85% of nameplate capacity; and – Our shale gas venture in Canada will show marginally increased production compared to the prior year due to new wells coming on stream. At present we are stabilising our production, as ramp-up in drilling activities remain dependent on sustained gas price increases. Following the successful conclusion of the disposal of our share in ASPC during the first half of the 2014 financial year, we are currently assessing the impact of the change in the official Iranian Rial exchange rate applicable from the 2014 financial year. This change may result in a loss on disposal of less than US$100 million. The macroeconomic conditions continue to be volatile, impacting our assumptions in respect of stable crude oil prices and volatile product prices, stronger refining margins as well as the weaker rand/US dollar exchange rate. We continue to focus on factors within our control: volume growth, margin improvement and cost reduction. The current volatility and uncertainty of global markets and geopolitical activities makes it difficult to be more precise in this outlook statement. Acquisitions and disposals of businesses In December 2012, Sasol acquired the remaining 50% shareholding in Merisol for a purchase consideration of R730 million (US$85 million). In April 2013, Sasol Oil disposed of its bitumen business, operated by Tosas, for a consideration of R116 million. Subsequent events On 2 July 2013, Sasol Gas disposed of its 49% share in Spring Lights Gas for a consideration of R474 million, upon obtaining approval from the South African Competition Commission. At 30 June 2013, Spring Lights Gas was classified as a disposal group held-for-sale. On 16 August 2013, we entered into a definitive sale and share purchase agreement to dispose of our 50% interest in ASPC for a purchase consideration of R3 606 million (US$365 million). The purchase consideration is payable in cash for the net assets, dividends and shareholder loans. At 30 June 2013, the investment in ASPC was classified as a disposal group held-for-sale. As a result of this transaction, Sasol has no on-going investment in Iran. Change in directors Mrs KC Ramon resigned as chief financial officer and executive director of Sasol Limited with effect from 9 September 2013. Mr P Victor has been appointed as the acting chief financial officer and executive director of Sasol Limited with effect from 10 September 2013. 10 Sasol Limited Group Audited financial results 2013
  • 13. Declaration of cash dividend number 68 A final gross cash dividend of South African 1330,00 cents per ordinary share (30 June 2012 – 1180,00 cents per share) has been declared for the year ended 30 June 2013. The final cash dividend is payable on the ordinary shares and the Sasol BEE ordinary shares. The dividend has been declared out of retained earnings (income reserves). The South African dividend withholding tax rate is 15% and no credits in terms of secondary tax on companies have been utilised. At the declaration date, there are 648 925 316 Sasol ordinary, 25 547 081 Sasol preferred ordinary and 2 838 565 Sasol BEE ordinary shares in issue. The net dividend amount payable to shareholders, who are not exempt from the dividend withholding tax, is 1130,50 cents per share, while the dividend amount payable to shareholders who are exempt from dividend withholding tax is 1330,00 cents per share. The salient dates for holders of ordinary shares and BEE ordinary shares are: Declaration date Monday, 9 September 2013 Last day for trading to qualify for and participate in the final dividend (cum dividend) Friday, 4 October 2013 Trading ex dividend commences Monday, 7 October 2013 Record date Friday, 11 October 2013 Dividend payment date Monday, 14 October 2013 On Monday, 14 October 2013, dividends due to certificated shareholders on the South African registry will either be electronically transferred to shareholders’ bank accounts or, in the absence of suitable mandates, dividend cheques will be posted to such shareholders. Shareholders who hold dematerialised shares will have their accounts held by their CSDP or broker credited on Monday, 14 October 2013. Share certificates may not be dematerialised or re-materialised between Monday, 7 October 2013 and Friday, 11 October 2013, both days inclusive. On behalf of the board 11 Hixonia Nyasulu David E. Constable Christine Ramon Chairman Chief Executive Officer Chief Financial Officer Sasol Limited 9 September 2013
  • 14. The preliminary financial statements are presented on a summarised consolidated basis. Statement of financial position at 30 June 2013 Rm 2012 Rm ASSETS Property, plant and equipment 108 070 95 872 Assets under construction 41 244 33 585 Goodwill 859 787 Other intangible assets 1 532 1 214 Investments in associates 2 676 2 560 Post-retirement benefit assets 407 313 Deferred tax assets 2 318 1 514 Other long-term assets 2 787 2 437 Non-current assets 159 893 138 282 Assets in disposal groups held for sale 2 304 18 Inventories 24 056 20 668 Trade and other receivables 29 003 26 299 Short-term financial assets 1 526 426 Cash restricted for use 7 442 5 314 Cash 25 271 12 746 Current assets 89 602 65 471 Total assets 249 495 203 753 EQUITY AND LIABILITIES Shareholders’ equity 149 625 125 234 Non-controlling interests 3 650 3 080 Total equity 153 275 128 314 Long-term debt 22 357 12 828 Long-term financial liabilities 22 38 Long-term provisions 12 397 10 518 Post-retirement benefit obligations 8 841 6 872 Long-term deferred income 305 455 Deferred tax liabilities 16 173 13 839 Non-current liabilities 60 095 44 550 Short-term debt 1 701 3 072 Short-term financial liabilities 200 135 Other current liabilities 33 477 27 460 Bank overdraft 747 222 Current liabilities 36 125 30 889 Total equity and liabilities 249 495 203 753 12 Sasol Limited Group Audited financial results 2013
  • 15. Income statement for the year ended 30 June 2013 Rm 2012 Rm Turnover 181 269 169 446 Materials, energy and consumables used (77 538) (80 410) Selling and distribution costs (5 371) (4 621) Maintenance expenditure (7 544) (7 421) Employee related expenditure (23 476) (19 465) Exploration expenditure and feasibility costs (1 354) (1 045) Depreciation and amortisation (12 030) (9 651) Other expenses, net (6 841) (8 215) Translation gains 899 243 Other operating expenses (9 692) (9 874) Other operating income 1 952 1 416 Operating profit before remeasurement items and associates 47 115 38 618 Remeasurement items (6 487) (1 860) Operating profit after remeasurement items 40 628 36 758 Share of profits of associates, net of tax 445 479 Profit from operations and associates 41 073 37 237 Net finance costs (1 294) (1 234) Finance income 708 796 Finance costs (2 002) (2 030) Profit before tax 39 779 36 003 Taxation (12 597) (11 746) Profit for year 27 182 24 257 Attributable to Owners of Sasol Limited 26 278 23 583 Non-controlling interests in subsidiaries 904 674 27 182 24 257 Earnings per share Rand Rand Basic earnings per share 43,38 39,10 Diluted earnings per share1 43,42 38,95 1 Diluted earnings per share are calculated taking the Sasol Share Incentive Scheme and Sasol Inzalo share transaction into account. 13
  • 16. Statement of comprehensive income for the year ended 30 June 2013 Rm 2012 Rm Profit for year 27 182 24 257 Other comprehensive income, net of tax Items that can be subsequently reclassified to the income statement 8 160 4 101 Effect of translation of foreign operations 8 121 4 063 Effect of cash flow hedges 78 41 Investments available-for-sale (17) (3) Tax on items that can be subsequently reclassified to the income statement (22) – Items that cannot be subsequently reclassified to the income statement (338) ( 821) Remeasurements on post-retirement benefit obligations (497) (1 195) Tax on items that cannot be subsequently reclassified to the income statement 159 374 Total comprehensive income for the year 35 004 27 537 Attributable to Owners of Sasol Limited 34 084 26 853 Non-controlling interests in subsidiaries 920 684 35 004 27 537 14 Sasol Limited Group Audited financial results 2013
  • 17. Statement of changes in equity for the year ended 30 June 2013 Rm 2012 Rm Opening balance 128 314 109 860 Shares issued during year 727 325 Share-based payment expense 374 485 Disposal of businesses 7 – Acquisition of business (14) – Transactions with non-controlling shareholders in subsidiaries 8 101 Total comprehensive income for the year 35 004 27 537 Dividends paid to shareholders (10 787) (9 600) Dividends paid to non-controlling shareholders in subsidiaries (358) (394) Closing balance 153 275 128 314 Comprising Share capital 28 711 27 984 Share repurchase programme (2 641) (2 641) Sasol Inzalo share transaction (22 054) (22 054) Retained earnings 128 038 112 547 Share-based payment reserve 8 883 8 509 Foreign currency translation reserve 10 235 2 137 Remeasurements on post-retirement benefit obligations (1 585) (1 250) Investment fair value reserve (3) 15 Cash flow hedge accounting reserve 41 (13) Shareholders’ equity 149 625 125 234 Non-controlling interests in subsidiaries 3 650 3 080 Total equity 153 275 128 314 15
  • 18. Statement of cash flows for the year ended 30 June 2013 Rm 2012 Rm Cash receipts from customers 178 087 168 934 Cash paid to suppliers and employees (118 820) (121 033) Cash generated by operating activities 59 267 47 901 Cash flow from operations 61 571 50 172 Increase in working capital (2 304) (2 271) Finance income received 1 071 1 149 Finance costs paid (656) (666) Tax paid (10 448) (10 760) Dividends paid to shareholders (10 787) (9 600) Cash retained from operating activities 38 447 28 024 Additions to non-current assets (32 288) (29 160) Acquisition of interests in joint ventures (730) (24) Disposal of businesses 167 713 Acquisition of new or additional investments in associates (200) (81) Repayment of capital from associate 661 – Other net cash flows from investing activities 341 936 Cash utilised in investing activities (32 049) (27 616) Share capital issued 727 325 Contributions from non-controlling shareholders in subsidiaries 37 11 Dividends paid to non-controlling shareholders in subsidiaries (358) (394) Proceeds from long-term debt 11 485 1 138 Repayments of long-term debt (3 357) (1 997) Proceeds from short-term debt 2 049 41 Repayments of short-term debt (1 834) (153) Cash effect of financing activities 8 749 (1 029) Translation effects on cash and cash equivalents of foreign operations 1 267 649 Increase in cash and cash equivalents 16 414 28 Cash and cash equivalents at beginning of year 17 838 17 810 Net reclassification to held for sale (2 286) – Cash and cash equivalents at end of year 31 966 17 838 16 Sasol Limited Group Audited financial results 2013
  • 19. Salient features for the year ended 30 June 2013 2012 Selected ratios Return on shareholders’ equity % 19,1 20,3 Return on total assets % 18,4 20,0 Operating profit margin % 22,4 21,7 Finance costs cover times 63,7 57,1 Dividend cover times 2,3 2,3 Share statistics Total shares in issue million 677,2 673,2 Sasol ordinary shares in issue million 648,8 644,8 Treasury shares (share repurchase programme) million 8,8 8,8 Weighted average number of shares million 605,7 603,2 Diluted weighted average number of shares million 614,5 616,2 Share price (closing) Rand 431,54 342,40 Market capitalisation – Sasol ordinary shares Rm 279 983 220 788 Market capitalisation – Sasol BEE ordinary shares Rm 871 686 Net asset value per share Rand 247,19 208,27 Dividend per share Rand 19,00 17,50 Interim Rand 5,70 5,70 Final Rand 13,30 11,80 Other financial information Total debt (including bank overdraft) Rm 24 805 16 122 Interest bearing1 Rm 24 291 15 597 Non-interest bearing Rm 514 525 Finance costs capitalised Rm 302 24 Capital commitments – Property, plant and equipment Rm 67 752 45 819 Authorised and contracted Rm 64 387 50 243 Authorised, not yet contracted Rm 45 216 28 417 Less expenditure to the end of year Rm (41 851) (32 841) Guarantees and contingent liabilities Total amount Rm 36 213 25 299 Liability included in the statement of financial position Rm 21 271 11 194 Share-based payment expenses Rm 2 038 691 Sasol share incentive schemes Rm 1 666 221 Sasol Inzalo share transaction Rm 372 470 Directors’ remuneration Rm 98 70 1 Sasol Financing International Plc, an indirect 100% financing subsidiary of Sasol Limited, issued a US$1 billion bond at a fixed rate of 4,5%, which is listed on the New York Stock Exchange and is repayable in November 2022. 17
  • 20. Salient features continued for the year ended 30 June 2013 2012 Other financial information continued Share options granted to directors – cumulative 000 47 628 Share appreciation rights with no performance targets granted to directors – cumulative 000 63 86 Share appreciation rights with performance targets granted to directors – cumulative 000 780 700 Medium-term incentive rights granted to directors – cumulative 000 198 156 Sasol Inzalo share rights granted to directors – cumulative 000 50 50 Effective tax rate2 % 31,7 32,6 Number of employees number 35 471 34 916 Average crude oil price – dated Brent US$/barrel 108,66 112,42 Average rand/US$ exchange rate 1US$ = Rand 8,85 7,78 Closing rand/US$ exchange rate 1US$ = Rand 9,88 8,17 2 The decrease in the effective tax rate from 32,6% to 31,7% is mainly due to an increase in non-deductible expenses, which was offset by the absence of Secondary Tax on Companies, due to the implementation of dividend withholding tax, as well as the increase in exempt income. Reconciliation of headline earnings Rm Rm Earnings attributable to owners of Sasol Limited 26 278 23 583 Effect of remeasurement items 6 487 1 860 Impairment of assets 6 102 1 642 Reversal of impairment (107) (12) Net profit on disposal of businesses (85) (354) Profit on disposal of associate – (7) Net profit on disposal of property, plant and equipment (7) (138) Net loss on disposal of other intangible assets 6 – Fair value gain on acquisition of business (233) – Scrapping of property, plant and equipment 238 212 Scrapping of assets under construction 104 247 Write off of unsuccessful exploration wells 469 270 Tax effects and non-controlling interests (892) 61 Headline earnings 31 873 25 504 18 Sasol Limited Group Audited financial results 2013
  • 21. Salient features continued for the year ended 30 June 2013 Rm 2012 Rm Remeasurement items per above Mining 7 61 Gas – 11 Synfuels 77 238 Oil 78 14 Synfuels International (7) 34 Petroleum International 428 1 609 Polymers 3 572 62 Solvents 341 83 Olefins & Surfactants 64 (179) Other chemical businesses 1 815 (94) Other businesses 112 21 Remeasurement items 6 487 1 860 Headline earnings per share Rand 52,62 42,28 Diluted headline earnings per share Rand 52,53 42,07 The reader is referred to the definitions contained in the 2012 Sasol Limited annual financial statements. 19
  • 22. Basis of preparation and accounting policies The preliminary summarised consolidated financial results for the year ended 30 June 2013 have been prepared in accordance with the framework concepts and the recognition and measurement requirements of International Financial Reporting Standards (IFRS), the presentation and disclosure requirements of International Accounting Standard 34 Interim Financial Reporting applied to year end reporting, Listings Requirements of the JSE Limited, the SAICA Financial Reporting Guides as issued by the Accounting Practices Committee and Financial Pronouncements as issued by the Financial Reporting Standards Council, as well as the requirements of the South African Companies Act, 2008, as amended. The accounting policies applied in the presentation of the preliminary summarised consolidated financial results are consistent with those applied for the year ended 30 June 2012 and are in terms of IFRS as issued by the International Accounting Standards Board except as follows: Sasol Limited has early adopted the following standards: – IAS 36 (Amendment), Impairment of assets: Recoverable Amount Disclosures for Non-Financial Assets. – IAS 39 (Amendment), Financial Instruments: Recognition and Measurement: Novation of Derivatives and Continuation of Hedge Accounting. – IFRIC 21, Levies. These newly adopted standards did not significantly impact our financial results. With effect from 1 July 2012, the group changed the presentation of its income statement from a classification based on function to a classification based on nature. Sasol has elected to change its income statement presentation to better reflect how it effectively manages its business as well as align to peers. The comparative period presented has been restated to comply with the income statement classification by nature. The change in the income statement presentation did not have an impact on turnover, operating profit or earnings per share. The preliminary summarised consolidated financial results do not include all the disclosure required for complete annual financial statements prepared in accordance with IFRS. These preliminary summarised consolidated financial results have been prepared in accordance with the historic cost convention except that certain items, including derivative instruments, liabilities for cash-settled share-based payment schemes, financial assets at fair value through profit or loss and available-for-sale financial assets, are stated at fair value. The preliminary summarised consolidated financial results are presented in South African rand, which is Sasol Limited’s functional and presentation currency. The preliminary summarised consolidated financial results appearing in this announcement are the responsibility of the directors. The directors take full responsibility for the preparation of the preliminary summarised consolidated financial results and that the financial information has been correctly extracted from the underlying audited annual financial statements. Christine Ramon CA(SA), Chief Financial Officer, is responsible for this set of financial results and has supervised the preparation thereof in conjunction with the Executive: Group Finance, Paul Victor CA(SA). Related party transactions The group, in the ordinary course of business, entered into various sale and purchase transactions on an arm’s length basis at market rates with related parties. Significant changes in contingent liabilities since 30 June 2012 As a result of the fine imposed on Sasol Wax GmbH in October 2008 by the European Commission, on 23 September 2011, Sasol Wax GmbH and Sasol Wax International AG were served with a law suit in The Netherlands by a company to which potential claims for compensation of damages have been assigned to by eight customers. The outcome of these proceedings cannot be determined at present. On 30 September 2011, another law suit had been lodged with the London High Court by 30 plaintiffs against Sasol Wax GmbH, Sasol Wax International AG and Sasol Holding in Germany GmbH. In the course of June 2013, full and final settlements have been reached with all 30 plaintiffs. Independent audit by the auditors These preliminary summarised consolidated financial results for the year ended 30 June 2013 have been derived from the audited consolidated annual financial statements of Sasol Limited for the year ended 30 June 2013, on which the auditors, KPMG Inc., have expressed an unmodified audit opinion. The individual auditor assigned to perform the audit is Mr CH Basson. KPMG Inc. has also issued an unmodified audit report on these summarised financial statements, stating that these summarised financial statements are consistent, in all material respects, with those financial statements. The auditor’s reports and the audited consolidated annual financial statements, which have been summarised in this report, are available for inspection at the registered office of the company. 20 Sasol Limited Group Audited financial results 2013
  • 23. Registered office: Sasol Limited, 1 Sturdee Avenue, Rosebank, Johannesburg 2196 PO Box 5486, Johannesburg 2000, South Africa Share registrars: Computershare Investor Services (Pty) Ltd., 70 Marshall Street, Johannesburg 2001 PO Box 61051, Marshalltown 2107, South Africa, Tel: +27 11 370-7700 Fax: +27 11 370-5271/2 JSE Sponsor: Deutsche Securities (SA) Pty Ltd. Directors (non-executive): Mrs TH Nyasulu (Chairman), Mr C Beggs*, Mr HG Dijkgraaf (Dutch)*, Dr MSV Gantsho*, Ms IN Mkhize*, Mr ZM Mkhize*, Mr MJN Njeke*, Mr PJ Robertson (British and American)*, Prof JE Schrempp (German)^, Mr S Westwell (British)* (executive): Mr DE Constable (Chief Executive Officer) (Canadian), Mrs KC Ramon (Chief Financial Officer), Ms VN Fakude *Independent ^Lead independent director Company secretary: Mr VD Kahla Company registration number: 1979/003231/06, incorporated in the Republic of South Africa Income tax reference number: 9520/018/60/8 JSE NYSE Sasol Ordinary shares Share code: SOL SSL ISIN: ZAE000006896 US8038663006 Sasol BEE Ordinary shares Share code: SOLBE1 ISIN: ZAE000151817 American depositary receipts (ADR) program: Cusip number 803866300 ADR to ordinary share 1:1 Depositary: The Bank of New York Mellon, 22nd floor, 101 Barclay Street, New York, NY 10286, USA Disclaimer – Forward-looking statements: Sasol may, in this document, make certain statements that are not historical facts and relate to analyses and other information which are based on forecasts of future results and estimates of amounts not yet determinable. These statements may also relate to our future prospects, developments and business strategies. Examples of such forward-looking statements include, but are not limited to, statements regarding exchange rate fluctuations, volume growth, increases in market share, total shareholder return and cost reductions. Words such as “believe”, “anticipate”, “expect”, “intend”, “seek”, “will”, “plan”, “could”, “may”, “endeavour” and “project” and similar expressions are intended to identify such forward-looking statements, but are not the exclusive means of identifying such statements. By their very nature, forward-looking statements involve inherent risks and uncertainties, both general and specific, and there are risks that the predictions, forecasts, projections and other forward-looking statements will not be achieved. If one or more of these risks materialise, or should underlying assumptions prove incorrect, our actual results may differ materially from those anticipated. You should understand that a number of important factors could cause actual results to differ materially from the plans, objectives, expectations, estimates and intentions expressed in such forward-looking statements. These factors are discussed more fully in our most recent annual report under the Securities Exchange Act of 1934 on Form 20-F filed on 12 October 2012 and in other filings with the United States Securities and Exchange Commission. The list of factors discussed therein is not exhaustive; when relying on forward-looking statements to make investment decisions, you should carefully consider both these factors and other uncertainties and events. Forward-looking statements apply only as of the date on which they are made, and we do not undertake any obligation to update or revise any of them, whether as a result of new information, future events or otherwise. Please note: A billion is defined as one thousand million. All references to years refer to the financial year ended 30 June. Any reference to a calendar year is prefaced by the word “calendar”.