In this hadoop 101 hands on lab we walk you through on how to create a azure VM for hortorn works. The contente is taken from Hortorns work website but modified and controled for the class
1. Sunil S Ranka sunil.ranka@jadeglobal.com Hadoop Hands On
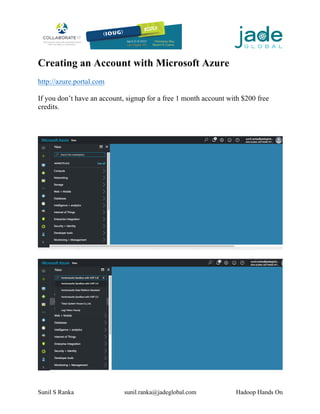
Creating an Account with Microsoft Azure
http://azure.portal.com
If you don’t have an account, signup for a free 1 month account with $200 free
credits.
2. Sunil S Ranka sunil.ranka@jadeglobal.com Hadoop Hands On
3. Sunil S Ranka sunil.ranka@jadeglobal.com Hadoop Hands On
4. Sunil S Ranka sunil.ranka@jadeglobal.com Hadoop Hands On
5. Sunil S Ranka sunil.ranka@jadeglobal.com Hadoop Hands On
The different fields:
• Name: This is the name you want to use to reference the machine. In the example
above, we use the name “MySandbox”
• User name: The name of the user account that will be used to log into the
machine. Throughout these tutorials, we will use azure as the user name.
• Authentication type: By default, the machine will be deployed and allow you to
connect via SSH key or password. In this example, we opt to use a password.
• Subscription: The subscription to deploy the machine under. Select one already in
your list.
• Resource group: The name of the resource group to create, or use an existing one.
Here, we create a new one with the same name as the machine itself.
• Location: Which region in the Azure offering to deploy the machine to.
6. Sunil S Ranka sunil.ranka@jadeglobal.com Hadoop Hands On
The next step is to choose a size for the virtual machine. It is recommended to use
a machine with A4 specifications, or higher.
7. Sunil S Ranka sunil.ranka@jadeglobal.com Hadoop Hands On
Optional settings to configure. You can safely leave these at their defaults.
8. Sunil S Ranka sunil.ranka@jadeglobal.com Hadoop Hands On
9. Sunil S Ranka sunil.ranka@jadeglobal.com Hadoop Hands On
Look over the summary and continue when ready.
10. Sunil S Ranka sunil.ranka@jadeglobal.com Hadoop Hands On
SET A STATIC IP
Once the machine is deployed, it’s overview will appear on the screen. Find the
sandbox’s public IP address and click on it.
11. Sunil S Ranka sunil.ranka@jadeglobal.com Hadoop Hands On
Clicking on the IP address will bring up the IP configuration panel. Select Static as
the Assignment, and then make sure to save your changes. This will keep the
sandbox from changing IP addresses each time it’s rebooted.
CONFIGURE SSH TUNNELING
12. Sunil S Ranka sunil.ranka@jadeglobal.com Hadoop Hands On
SSH tunneling allows us a way to port forward securely, without actually opening
the machine’s ports for the entire world to access. Follow these steps to access the
endpoints of your Azure deployment from your computer.
Use your favorite editor and edit your ~/.ssh/config file. For example:
vi ~/.ssh/config
Enter the following configuration, replacing the HostName IP with the public IP
of your instance. More forwardings can be entered via the LocalForward directive
similar to the ones displayed here.
Host azureSandbox
Port 22
User azure
HostName 52.175.207.131
LocalForward 8080 127.0.0.1:8080
LocalForward 8888 127.0.0.1:8888
LocalForward 9995 127.0.0.1:9995
LocalForward 9996 127.0.0.1:9996
LocalForward 8886 127.0.0.1:8886
LocalForward 10500 127.0.0.1:10500
LocalForward 4200 127.0.0.1:4200
LocalForward 2222 127.0.0.1:2222
Save and close the file. Now SSH into the Azure machine by using the Host alias
we just configured, which will connect us automatically using the IP address we
specified in the config file. You’ll be asked for a password, which is the one you
set during initial configuration on Azure.
ssh azureSandbox
13. Sunil S Ranka sunil.ranka@jadeglobal.com Hadoop Hands On
Congratulations!!!!! You are just few steps away from being a Pro
That’s it! Keep this SSH connection open for the duration of your interaction
with the sandbox on Azure.
14. Sunil S Ranka sunil.ranka@jadeglobal.com Hadoop Hands On
SPLASH SCREEN
Now that you’ve port forwarded by following the tutorial linked above, you can
explore the sandbox as you see fit. Point your browser to http://localhost:8888 for
the sandbox’s splash screen.
15. Sunil S Ranka sunil.ranka@jadeglobal.com Hadoop Hands On
Fill out the form and hit Submit to access the sandbox.
SETUP AMBARI ADMIN PASSWORD MANUALLY
• Start your sandbox and open a terminal (mac or linux) or putty (windows)
• SSH into the sandbox as root using ssh root@127.0.0.1 -p 2222 .
• Type the following commands:
# Updates password
ambari-admin-password-reset
# If Ambari doesn't restart automatically, restart ambari service
ambari-agent restart
Note: Now you can login to ambari as an admin user to perform operations, such
as starting and stopping services.
**** create a password as admin
16. Sunil S Ranka sunil.ranka@jadeglobal.com Hadoop Hands On
AMBARI LOGIN
http://127.0.0.1:8080/#/login
EXPLORE AMBARI WELCOME SCREEN 5 KEY CAPABILITIES
Enter the Ambari Welcome URL and then you should see the following options:
• “Operate Your Cluster” will take you to the Ambari Dashboard which is
the primary UI for Hadoop Operators
• “Manage Users + Groups” allows you to add & remove Ambari users and
groups
• “Clusters” allows you to grant permission to Ambari users and groups
• “Ambari User Views” list the set of Ambari Users views that are part of the
cluster
• “Deploy Views” provides administration for adding and removing Ambari
User Views
17. Sunil S Ranka sunil.ranka@jadeglobal.com Hadoop Hands On
FILE SYSTEM SHELL GUIDE
SSH into the sandbox as root using ssh root@127.0.0.1 -p 2222
• Usade: hdfs dfs -ls
• For a directory it returns list of its direct children as in unix.A directory is
listed as:
• Usage: hdfs dfs -lsr
• Recursive version of ls. Similar to Unix ls -R.
• Usage: hdfs dfs -mkdir
• hdfs dfs -mkdir /user/<username>/dir1 /user/hadoop/dir2 • hdfs dfs -mkdir
hdfs://nn1.example.com/user/hadoop/dir
hdfs://nn2.example.com/user/hadoop/dir
• Usage: dfs -moveFromLocal
For more details please refer to :
https://hadoop.apache.org/docs/r1.2.1/file_system_shell.pdf
SEND DATA BETWEEN SANDBOX & LOCAL MACHINE
Open your terminal (linux or mac) or git bash (windows). To send data, in our
example HDF .tar.gz file, from your local machine to the azure sandbox, you
would input the the following command. If you want to try this command, replace
the HDF filename with another filename from your Downloads folder. Modify the
command and execute:
scp -P 2222 ~/Downloads/HDF-1.2.0.1-1.tar.gz root@localhost:/root
hadoop fs -copyFromLocal products.tsv /tmp/maria/
18. Sunil S Ranka sunil.ranka@jadeglobal.com Hadoop Hands On
HADOOP TUTORIAL – GETTING STARTED WITH HDP
LAB 1 - LOADING SENSOR DATA INTO HDF INTRODUCTION
OUTLINE
• Step 1: Download and Extract the Sensor Data Files – Geolocation.zip
• Step 2: Load the Sensor Data into HDFS
• Summary
DOWNLOAD AND EXTRACT THE SENSOR DATA FILES
• You can download the sample sensor data contained in a compressed (.zip) folder
here: Geolocation.zip
Geolocation.zip file location :
https://app.box.com/HadoopCrashCourseData
1. Save the Geolocation.zip file to your computer, then extract the files. You
should see a Geolocation folder that contains the following files:
o geolocation.csv – This is the collected geolocation data from the
trucks. It contains records showing truck location, date, time, type of
event, speed, etc.
o trucks.csv – This is data was exported from a relational database and
it shows info on truck models, driverid, truckid, and aggregated
mileage info.
19. Sunil S Ranka sunil.ranka@jadeglobal.com Hadoop Hands On
LOAD THE SENSOR DATA INTO HDFS
1. Go to Ambari Dashboard and open the HDFS Files view. Click on the 9
square Ambari User Views icon next to the username button and select
the HDFS Files menu item.
2. Start from the top root of the HDFS file system, you will see all the files the
logged in user (maria_dev in this case) has access to see:
20. Sunil S Ranka sunil.ranka@jadeglobal.com Hadoop Hands On
3. Navigate to /user/maria_dev directory by clicking on the directory links.
4. Let’s create a data directory to upload the data that we are going to use for
this use case. Click the button to create the data directory inside
the maria_dev directory. Now navigate into the data directory.
21. Sunil S Ranka sunil.ranka@jadeglobal.com Hadoop Hands On
UPLOAD GEOLOCATION AND TRUCKS CSV FILES TO DATA
FOLDER
1. If you’re not already in your newly created directory
path /user/maria_dev/data , go to the data folder. Then click on
the button to upload the
corresponding geolocation.csv and trucks.csv files into it.
2. An Upload file window will appear, click on the cloud symbol.
Another window will appear, navigate to the destination the two csv files were
downloaded. Click on one at a time, press open to complete the upload. Repeat the
process until both files are uploaded.
22. Sunil S Ranka sunil.ranka@jadeglobal.com Hadoop Hands On
Both files are uploaded to HDFS as shown in the Files View UI:
You can also perform the following operations on a file or folder by clicking on the
entity’s
row: Open, Rename, Permissions, Delete, Copy, Move, Download and concaten
ate.
23. Sunil S Ranka sunil.ranka@jadeglobal.com Hadoop Hands On
SET WRITE PERMISSIONS TO WRITE TO DATA FOLDER
1. click on the data folder’s row, which is contained within the directory
path /user/maria_dev .
2. Click Permissions.
3. Make sure that the background of all the write boxes are checked (blue).
Refer to image for a visual explanation.
SUMMARY
Congratulations! Let’s summarize the skills and knowledge we acquired from this
tutorial. We learned Hadoop Distributed File System (HDFS) was built to
manage storing data across multiple machines. Now we can upload data into the
HDFS using Ambari’s HDFS Files view.
24. Sunil S Ranka sunil.ranka@jadeglobal.com Hadoop Hands On
AMBARI HIVE USER VIEWS ON HORTONWORKS SANDBOX
To make it easy to interact with Hive we use a tool in the Hortonworks Sandbox
called the Ambari Hive User View. Ambari Hive User View provides an
interactive interface to Hive. We can create, edit, save and run queries, and have
Hive evaluate them for us using a series of MapReduce jobs or Tez jobs.
Let’s now open the Ambari Hive User View and get introduced to the
environment, go to the Ambari User VIew icon and select Hive :
25. Sunil S Ranka sunil.ranka@jadeglobal.com Hadoop Hands On
Ambari Hive User View
Now let’s take a closer look at the SQL editing capabilities in the User View:
There are five tabs to interact with SQL:
• Query: This is the interface shown above and the primary interface to write, edit
and execute new SQL statements
• Saved Queries: You can save your favorite queries and quickly have access to
them to rerun or edit.
• History: This allows you to look at past queries or currently running queries to
view, edit and rerun. It also allows you to see all SQL queries you have authority
to view. For example, if you are an operator and an analyst needs help with a
26. Sunil S Ranka sunil.ranka@jadeglobal.com Hadoop Hands On
query, then the Hadoop operator can use the History feature to see the query that
was sent from the reporting tool.
• UDFs: Allows you to define UDF interfaces and associated classes so you can
access them from the SQL editor.
• Upload Table: Allows you to upload your hive query tables to your preferred
database and appears instantly in the Query Editor for execution.
• Database Explorer: The Database Explorer helps you navigate your database
objects. You can either search for a database object in the Search tables dialog
box, or you can navigate through Database -> Table -> Columns in the navigation
pane.
• The principle pane to write and edit SQL statements. This editor includes content
assist via CTRL + Space to help you build queries. Content assist helps you with
SQL syntax and table objects.
• Once you have created your SQL statement you have 4 options:
• Execute: This runs the SQL statement.
• Explain: This provides you a visual plan, from the Hive optimizer, of how the
SQL statement will be executed.
• Save as: Allows you to persist your queries into your list of saved queries.
• Kill Session: Terminates the SQL statement.
• When the query is executed you can see the Logs or the actual query results.
• Logs: When the query is executed you can see the logs associated with the query
execution. If your query fails this is a good place to get additional information for
troubleshooting.
• Results: You can view results in sets of 50 by default.
• There are six sliding views on the right hand side with the following capabilities,
which are in context of the tab you are in:
• Query: This is the default operation,which allows you to write and edit SQL.
• Settings: This allows you to set properties globally or associated with an
individual query.
• Data Visualization: Allows you to visualize your numeric data through different
charts.
• Visual Explain: This will generate an explain for the query. This will also show
the progress of the query.
• TEZ: If you use TEZ as the query execution engine then you can view the DAG
associated with the query. This integrates the TEZ User View so you can check
27. Sunil S Ranka sunil.ranka@jadeglobal.com Hadoop Hands On
for correctness and helps with performance tuning by visualizing the TEZ jobs
associated with a SQL query.
• Notifications: This is how to get feedback on query execution.
The Apache Hive project provides a data warehouse view of the data in HDFS.
Using a SQL dialect, HiveQL (HQL), Hive lets you create summarizations of your
data and perform ad-hoc queries and analysis of large datasets in the Hadoop
cluster. The overall approach with Hive is to project a table structure on the dataset
and then manipulate it with SQL. The notion of projecting a table structure on a
file is often referred to as Schema-On-Read. Since you are using data in HDFS,
your operations can be scaled across all the datanodes and you can manipulate
huge datasets.
DEFINE A HIVE TABLE
Now that you are familiar with the Hive View, let’s create and load tables for the
geolocation and trucks data. In this section we will learn how to use the Ambari
Hive View to create two tables: geolocation and trucking using the Hive View
Upload Table tab. The Upload Table tab provides the following key options:
choose input file type, storage options (i.e. Apache ORC) and set first row as
header. Here is a visual representation of the table and load creation process
accomplished in the next few steps.:
28. Sunil S Ranka sunil.ranka@jadeglobal.com Hadoop Hands On
29. Sunil S Ranka sunil.ranka@jadeglobal.com Hadoop Hands On
CREATE AND LOAD TRUCKS TABLE FOR STAGING INITIAL LOAD
• Navigate and select the Upload Table of the Ambari Hive View. Then select
the Upload fromHDFS radio button, enter the HDFS
path /user/maria_dev/data/trucks.csv and click the Preview button:
You should see a similar dialog:
Note that the first row contains the names of the columns.
30. Sunil S Ranka sunil.ranka@jadeglobal.com Hadoop Hands On
• Fortunately the Upload Table tab has a feature to specify the first row as a
header for the column names. Press the Gear Button next to
the File type pull down menu, shown above, to file type customization
window. Then check the checkbox for the Is first row header? and hit the
close button.
• You should now see a similar dialog box with the names of the header
columns as the names of the columns:
31. Sunil S Ranka sunil.ranka@jadeglobal.com Hadoop Hands On
• Once you have finished setting all the various properties select
the Upload Table button to start the create and load table process.
VERIFY NEW TABLES EXIST
32. Sunil S Ranka sunil.ranka@jadeglobal.com Hadoop Hands On
SAMPLE DATA FROM THE TRUCKS TABLE
• Click on the Load sample data icon to generate and execute a select SQL
statement to query the table for a 100 rows.
• You can have multiple SQL statements within each editor worksheet, but
each statement needs to be separated by a semicolon ”;”.
• If you have multiple statements within a worksheet but you only want to run
one of them just highlight the statement you want to run and then click the
Execute button.
A few additional commands to explore tables:
• show tables; – List the tables created in the database by looking up the list of
tables from the metadata stored in HCatalogdescribe
• describe {table_name}; – Provides a list of columns for a particular table
(ie describe trucks; )
• show create table {table_name}; – Provides the DDL to recreate a table
(ie show create table trucks; )
• describe formatted {table_name}; – Explore additional metadata about the
table. For example you can verify geolocation is an ORC Table, execute the
following query:
describe formatted trucks;
Scroll down to the bottom of the Results tab and you will see a section labeled
Storage Information. The output should look like:
By default, when you create a table in Hive, a directory with the same name gets
created in the /apps/hive/warehouse folder in HDFS. Using the Ambari Files
View, navigate to the /apps/hive/warehouse folder.
33. Sunil S Ranka sunil.ranka@jadeglobal.com Hadoop Hands On
set hive.cli.print.current.db=true;
hive (default)>
hive (default)> CREATE DATABASE ourfirstdatabase;
CREATE TABLE our_first_table (FirstName STRING,LastName STRIN
G,EmployeeId INT);
EXPLORE HIVE SETTINGS ON AMBARI DASHBOARD
OPEN AMBARI DASHBOARD IN NEW TAB
• localhost:8080/#/main/dashboard/metrics
Click on the Dashboard tab to start exploring the Ambari Dashboard.
34. Sunil S Ranka sunil.ranka@jadeglobal.com Hadoop Hands On
BECOME FAMILIAR WITH HIVE SETTINGS
Go to the Hive page then select the Configs tab then click on Settings tab:
35. Sunil S Ranka sunil.ranka@jadeglobal.com Hadoop Hands On
PERFORM WEB LOG ANALYSIS WITH HIVE
Introduction
This tutorial describes how to ingest clickstream data into HDFS, then use
HCatalog to create tables and perform queries on those tables with Hive to analyze
the web logs from that data. By the end of the tutorial, we will have a better
understanding of how to perform web log analysis on clickstream data, so we can
better understand the habits of our customers.
• Clickstream Data
• Potential Uses of Clickstream Data
• Step 1: Download the Sample Data
• Step 2: Upload the Data Files into the Sandbox
• Step 3: Create Hive Tables
• Step 4: Load data into new tables
• Step 5: View and Refine the Data in the Sandbox
• Summary
36. Sunil S Ranka sunil.ranka@jadeglobal.com Hadoop Hands On
CLICKSTREAM DATA
Clickstream data is an information trail a user leaves behind while visiting a
website. It is typically captured in semi-structured website log files.
These website log files contain data elements such as a date and time stamp, the
visitor’s IP address, the destination URLs of the pages visited, and a user ID that
uniquely identifies the website visitor.
POTENTIAL USES OF CLICKSTREAM DATA
One of the original uses of Hadoop at Yahoo was to store and process their
massive volume of clickstream data. Now enterprises of all types can use Hadoop
and the Hortonworks Data Platform (HDP) to refine and analyze clickstream data.
They can then answer business questions such as:
• What is the most efficient path for a site visitor to research a product, and
then buy it?
• What products do visitors tend to buy together, and what are they most
likely to buy in the future?
• Where should I spend resources on fixing or enhancing the user experience
on my website?
• In this tutorial, we will focus on the “path optimization” use case.
Specifically: how can we improve our website to reduce bounce rates and
improve conversion?
37. Sunil S Ranka sunil.ranka@jadeglobal.com Hadoop Hands On
STEP 1: DOWNLOAD THE SAMPLE DATA
A set of sample data contained in a compressed (.zip) folder can be downloaded
here:
RefineDemoData.zip
• File Location –
o https://s3.amazonaws.com/hw-sandbox/tutorial8/RefineDemoData.zip
Save the sample data .zip file to your computer, then extract the files and
unzip Omniture.0.tsv.gz , user.tsv.gz and products.tsv.gz .
*** Note: The extracted data files should have a .tsv file extension at the end.
STEP 2: UPLOAD THE DATA FILES INTO THE SANDBOX
• First Log in to the Ambari interface at http://localhost:8080. You can log in
with the username maria_dev and the password maria_dev
• Select the Files view from the vies menu at the top. The HDFS
Files view enables users to view Hortonworks Data Platform(HDP) file
store. The HDP file system is separate from the local file system.
• We navigate to /tmp , create a maria folder
38. Sunil S Ranka sunil.ranka@jadeglobal.com Hadoop Hands On
• click on the row of maria and select Permissions:
• Now we check the Write buttons and press save.
• Verify that the permissions look now like this:
• Now, we navigate to /tmp/maria , click on upload and browse
the Omniture.0.tsv .
• Repeat this procedure for users.tsv and products.tsv .
39. Sunil S Ranka sunil.ranka@jadeglobal.com Hadoop Hands On
STEP 3: CREATE HIVE TABLES
• Let’s open the Hive View by clicking on the Hive button from the views
menu .
• Let’s create the tables: users, products and omniture.
CREATE USERS TABLE
create table users (swid STRING, birth_dt STRING, gender_cd CHAR(1))
ROW FORMAT DELIMITED
FIELDS TERMINATED by 't'
stored as textfile
tblproperties ("skip.header.line.count"="1")
CREATE PRODUCTS TABLE
create table products (url STRING, category STRING)
ROW FORMAT DELIMITED
FIELDS TERMINATED by 't'
stored as textfile
tblproperties ("skip.header.line.count"="1");
40. Sunil S Ranka sunil.ranka@jadeglobal.com Hadoop Hands On
CREATE OMNITURELOGS TABLE
create table omniturelogs (col_1 STRING,col_2 STRING,col_3 STRING,col_4
STRING,col_5 STRING,col_6 STRING,col_7 STRING,col_8 STRING,col_9
STRING,col_10 STRING,col_11 STRING,col_12 STRING,col_13
STRING,col_14 STRING,col_15 STRING,col_16 STRING,col_17
STRING,col_18 STRING,col_19 STRING,col_20 STRING,col_21
STRING,col_22 STRING,col_23 STRING,col_24 STRING,col_25
STRING,col_26 STRING,col_27 STRING,col_28 STRING,col_29
STRING,col_30 STRING,col_31 STRING,col_32 STRING,col_33
STRING,col_34 STRING,col_35 STRING,col_36 STRING,col_37
STRING,col_38 STRING,col_39 STRING,col_40 STRING,col_41
STRING,col_42 STRING,col_43 STRING,col_44 STRING,col_45
STRING,col_46 STRING,col_47 STRING,col_48 STRING,col_49
STRING,col_50 STRING,col_51 STRING,col_52 STRING,col_53 STRING)
ROW FORMAT DELIMITED
FIELDS TERMINATED by 't'
stored as textfile
tblproperties ("skip.header.line.count"="1");
Let’s execute the following queries to load the data into the tables.
LOAD DATA INPATH '/tmp/maria/products.tsv' OVERWRITE INTO TABLE
products;
LOAD DATA INPATH '/tmp/maria/users.tsv' OVERWRITE INTO TABLE users;
LOAD DATA INPATH '/tmp/maria/Omniture.0.tsv' OVERWRITE INTO TABLE
omniturelogs;
41. Sunil S Ranka sunil.ranka@jadeglobal.com Hadoop Hands On
42. Sunil S Ranka sunil.ranka@jadeglobal.com Hadoop Hands On
VERIFY DATA LOADED CORRECTLY
To check if the data was loaded, click on the load sample data icon next to the
table name. It executes a sample query.
43. Sunil S Ranka sunil.ranka@jadeglobal.com Hadoop Hands On
VIEW AND REFINE THE DATA IN THE SANDBOX
In the previous section, we created sandbox tables from uploaded data files. Now
let’s take a closer look at that data.
Here’s a summary of the data we’re working with:
Switch to your local machine, navigate to the location of the datasets before
sending them to HDP, then open omniturelogs in the text editor or spreadsheet of
your choice:
omniturelogs – website logs containing information such as URL, timestamp, IP
address, geocoded IP, and session ID.
users – CRM user data listing SWIDs (Software User IDs) along with date of birth
and gender.
products – CMS data that maps product categories to website URLs.
44. Sunil S Ranka sunil.ranka@jadeglobal.com Hadoop Hands On
Now let’s use a Hive script to generate an “omniture” view that contains a subset
of the data in the Omniture log table.
CREATE VIEW omniture AS
SELECT col_2 ts, col_8 ip, col_13 url, col_14 swid, col_50 city, col_51 country,
col_53 state
FROM omniturelogs
Click Save as…. On the “Saving item” pop-up, type “omniture” in the box, then
click OK.
You can see your saved query now by clicking on the “Save Queries” button at the
top.
45. Sunil S Ranka sunil.ranka@jadeglobal.com Hadoop Hands On
Click Execute to run the script.
To view the data generated by the saved script, click on the icon next to the view’s
name at the Database Explorer.
The query results will appear, and you can see that the results include the data from
the omniturelogs table that were specified in the query.
46. Sunil S Ranka sunil.ranka@jadeglobal.com Hadoop Hands On
Finally, we’ll create a script that joins the omniture website log data to the CRM
data (registered users) and CMS data (products). Click Query Editor, then paste the
following text in the Query box:
create table webloganalytics as
select to_date(o.ts) logdate, o.url, o.ip, o.city, upper(o.state) state,
o.country, p.category, CAST(datediff( from_unixtime( unix_timestamp() ),
from_unixtime( unix_timestamp(u.birth_dt, 'dd-MMM-yy'))) / 365 AS INT) age,
u.gender_cd
from omniture o
inner join products p
on o.url = p.url
left outer join users u
on o.swid = concat('{', u.swid , '}')
Save this script as “webloganalytics” and execute the script.
Let’s view the data generated by the script with the procedure we learned in the
previous steps.
47. Sunil S Ranka sunil.ranka@jadeglobal.com Hadoop Hands On
Now that you have loaded data into the Hortonworks Platform, you can use
Business Intelligence (BI) applications or Data Science Notebooks such as
Microsoft Excel or Apache Zeppelin to access and analyze the data.
48. Sunil S Ranka sunil.ranka@jadeglobal.com Hadoop Hands On
ANALYZE CLICKSTREAM DATA WITH APACHE ZEPPELIN
Open up Ambari and make sure Zeppelin is running. If not, start the service. Go to
browser and type http://localhost:9995 to open Zeppelin UI.
49. Sunil S Ranka sunil.ranka@jadeglobal.com Hadoop Hands On
Once the Zeppelin UI is open you can either create a new note and run the
commands, or import the following notebook from this URL: `
https://raw.githubusercontent.com/hortonworks/data-
tutorials/cf9f67737c3f1677b595673fc685670b44d9890f/tutorials/hdp/hdp-
2.5/visualize-website-clickstream-data/assets/ClickstreamAnalytics.json
To see the code click on the – show/hide – icon below.
IDENTIFY FROM WHICH STATE’S CUSTOMERS VISIT THE WEBSITE
MOST
• Write the query to filter states
• open settings, make sure state COUNT is in the Values field
• select bar graph to represent the data visually
50. Sunil S Ranka sunil.ranka@jadeglobal.com Hadoop Hands On
UNDERSTAND DEMOGRAPHICS FROM DATA TO PULL IN MORE
CUSTOMERS
• Write the query to filter demographics (age, gender, category)
• open settings, make sure
• age is in Keys field,
• gender_cd is in Groups field,
• category COUNT is in Values field
• select area chart
%jdbc(hive)
select age, gender_cd, category from webloganalytics where age is not NULL
LIMIT 1000
51. Sunil S Ranka sunil.ranka@jadeglobal.com Hadoop Hands On
Thus, the majority of users who come into the website are within age range of 20-
30. Additionally, there seems to be an even split between both genders.
Which gender seems to dominate the website views for the older age?
STEP 3: ANALYZE THE INTEREST CATEGORY DISTRIBUTION FOR
USERS
• Write the query to find the number of users interested toward particular categories
• open settings, make sure
• category is in Keys field
• category SUM is in Values field
• select pie chart
52. Sunil S Ranka sunil.ranka@jadeglobal.com Hadoop Hands On
Hence, clothing is clearly the most popular reason customers visit the website.
What are the next two interest categories that are most popular?