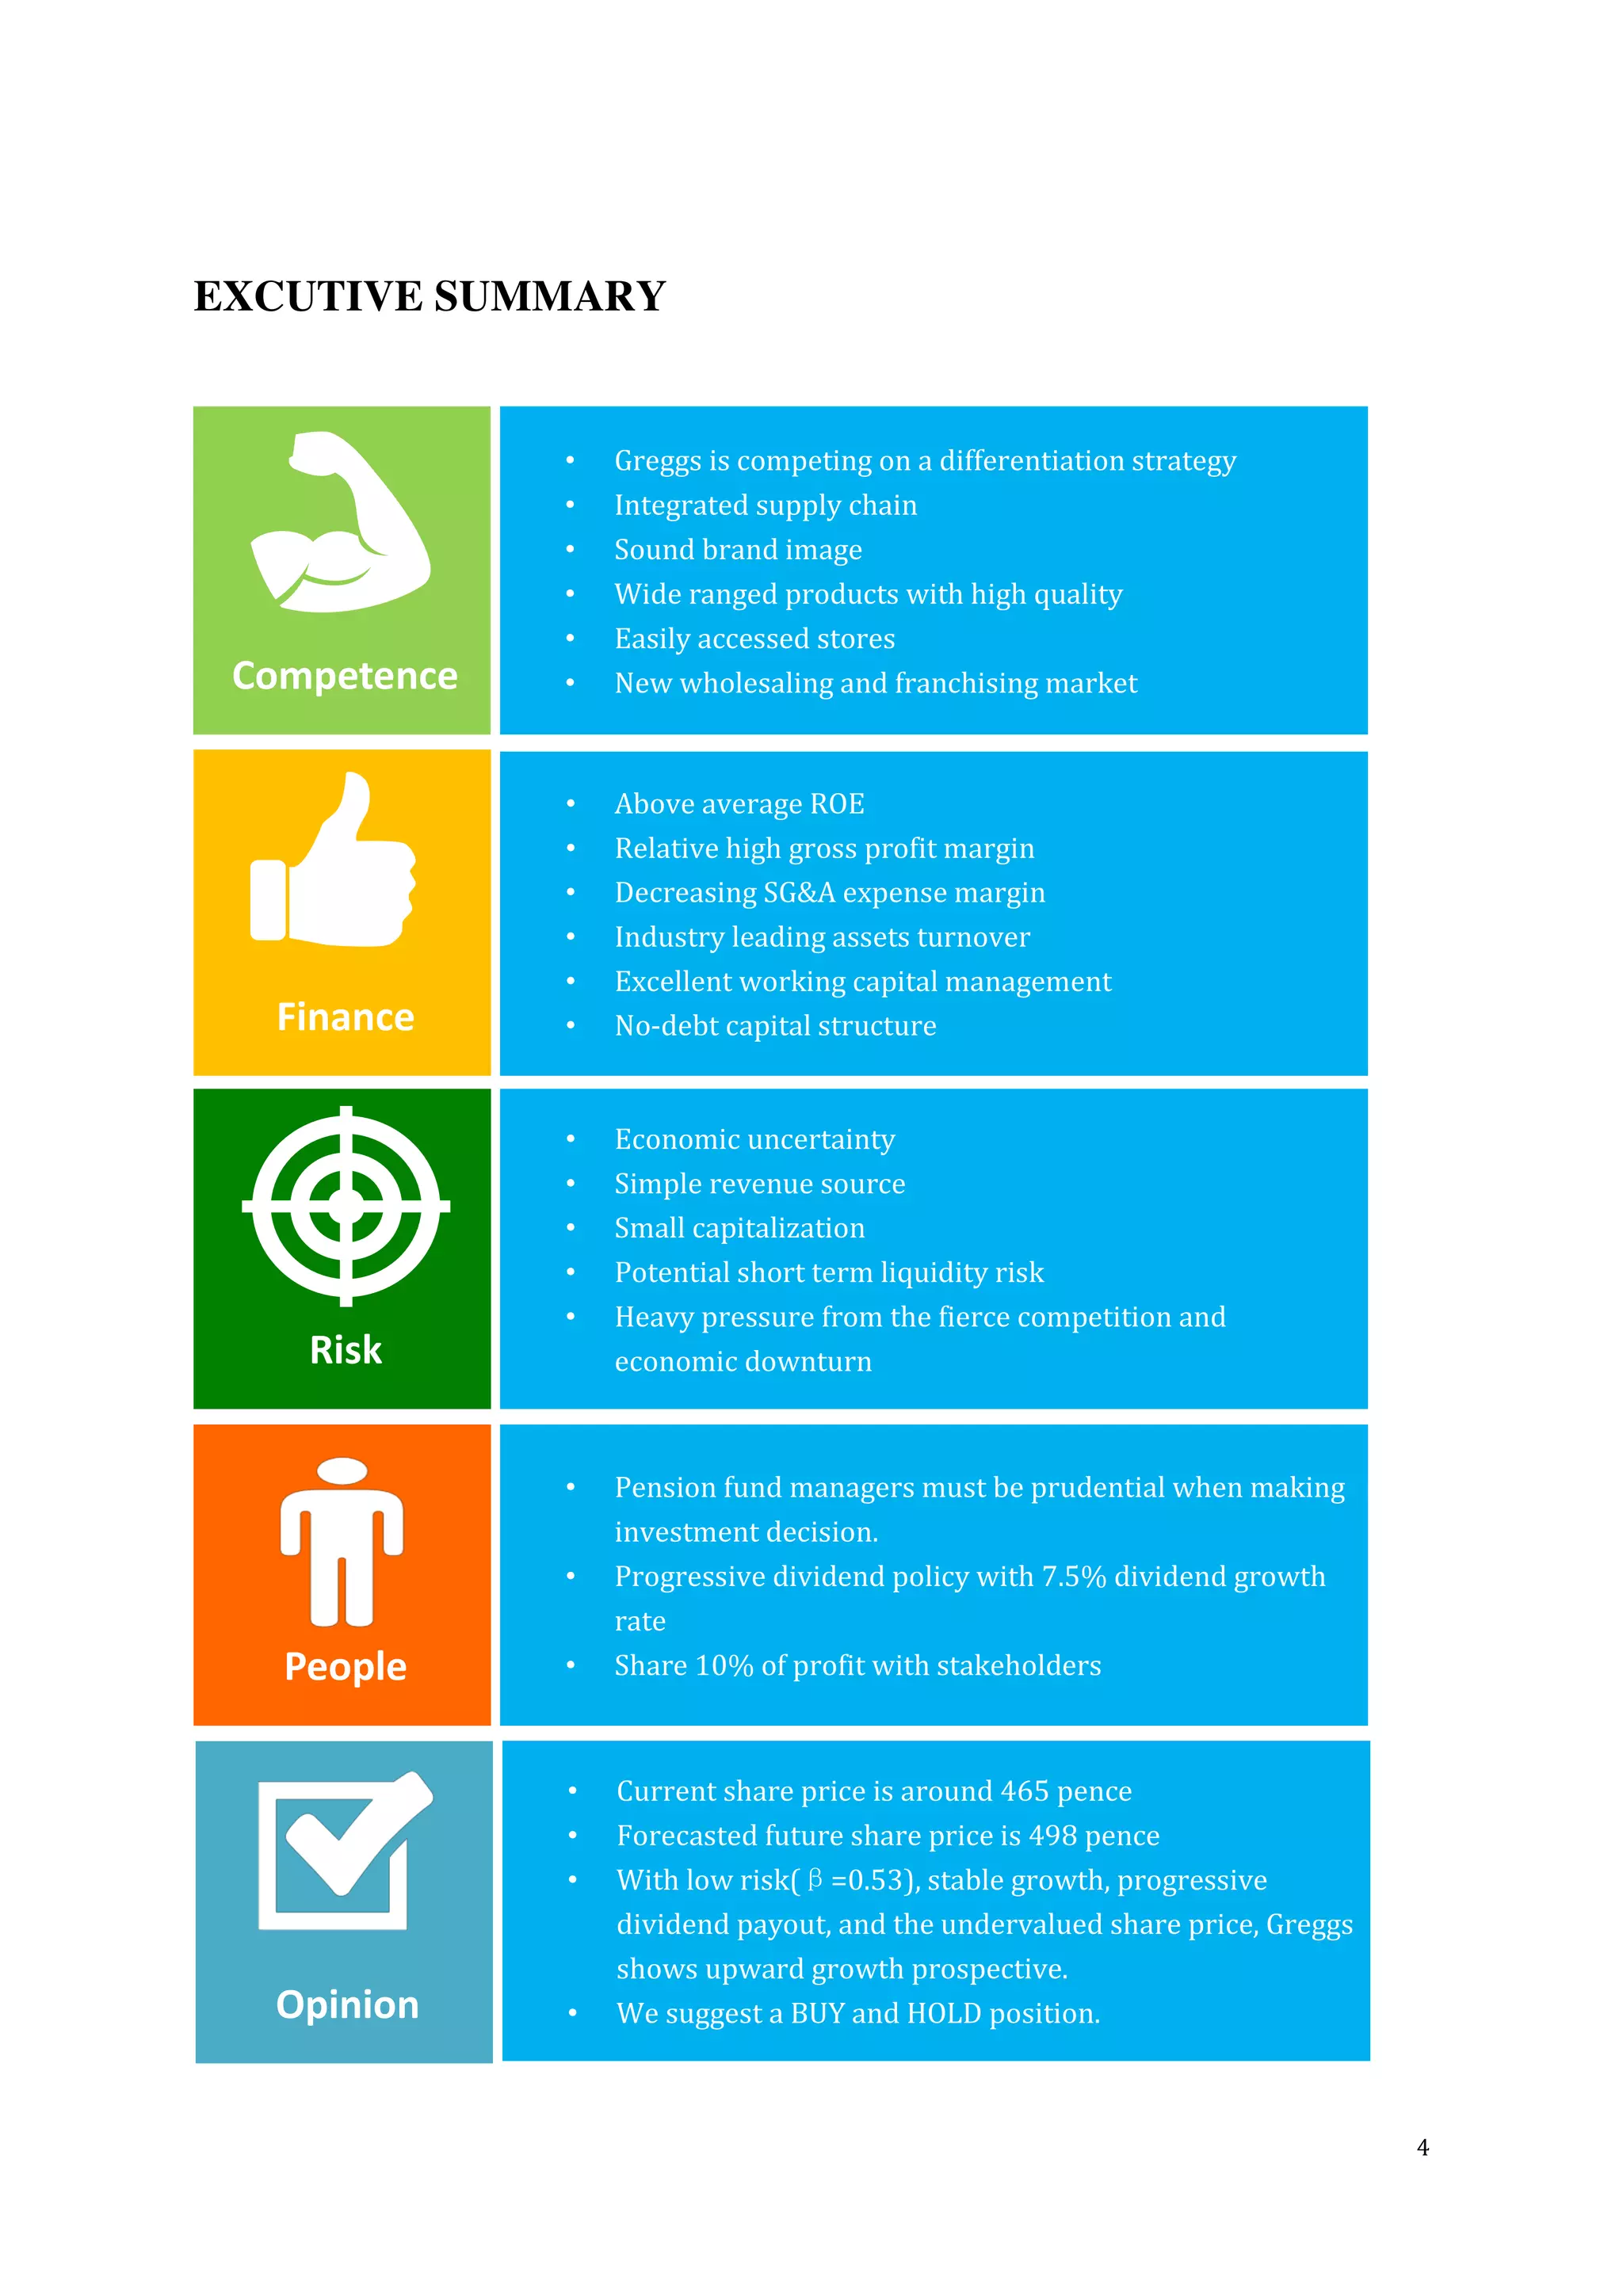
SlideShare a Scribd company logo
1 of 45
Download to read offline
1
TABLE OF CONTNENT
EXCUTIVE SUMMARY ......................................................................................................................................4
1. COMPANY OVERVIEW.................................................................................................................................5
1.1. COMPANY PROFILE................................................................................................................................................... 5
1.2. COMPANY HISTORY .................................................................................................................................................. 5
2. INDUSTRY OVERVIEW................................................................................................................................6
2.1.FIVE FORCES ANALYSIS.......................................................................................................................................... 6
2.1.1. Rivalry among existing firms: ........................................................................................................................7
2.1.2. Threat of new entrants:.....................................................................................................................................8
2.1.3. Threat of substitute products.........................................................................................................................8
2.1.4. Bargaining power of buyers............................................................................................................................8
2.1.5. Bargaining power of suppliers:.....................................................................................................................8
2.2. SUMMARY OF FIVE FORCES ANALYSIS .................................................................................................................... 9
3. STRATEGIC ANALYSIS.............................................................................................................................. 10
3.1. PRODUCT LEVEL......................................................................................................................................................10
3.2. BRAND LEVEL..........................................................................................................................................................10
3.3. OPERATION LEVEL..................................................................................................................................................10
3.4. SUMMARY OF STRATEGY ANALYSIS ......................................................................................................................11
4. RATIO ANALYSIS........................................................................................................................................12
4.1. OVERALL PROFITABILITY ......................................................................................................................................12
4.2. OPERATING MANAGEMENT ...................................................................................................................................14
4.2.1. Gross Profit margin & SG&A margin.........................................................................................................14
4.2.2. NOPAT margin & EBITDA margin..............................................................................................................15
4.2.3. Summary of Operating management.......................................................................................................15
4.3. INVESTMENT MANAGEMENT.................................................................................................................................15
4.3.1. Working capital management.....................................................................................................................16
4.3.2. Non-current assets management ...............................................................................................................17
4.3.3. Summary of Investment management.....................................................................................................17
4.4. FINANCIAL MANAGEMENT.....................................................................................................................................17
4.4.1. Current liabilities and short-term liquidity...........................................................................................18
4.4.2. Debt and long-term solvency........................................................................................................................19
4.4.3. Summary of Financial Management.........................................................................................................19
4.5. SUMMARY OF RATIO ANALYSIS.............................................................................................................................19
5. CASH FLOW ANALYSIS............................................................................................................................. 20
5.1. CASH FLOW STRUCTURE........................................................................................................................................20
5.2. INTERNAL CASH FLOW GENERATING ABILITY ....................................................................................................20
5.2.1. Future cash flow generating ability..........................................................................................................20
5.3. LIQUIDITY ................................................................................................................................................................21
2
5.4. DIVIDEND PAYOUT ABILITY...................................................................................................................................21
5.5. SUMMARY OF CASH FLOW ANALYSIS...................................................................................................................21
6. PROSPECTIVE ANALYSIS......................................................................................................................... 22
6.1. FORECASTING..........................................................................................................................................................22
6.2. VALUATION ..............................................................................................................................................................25
6.2.1. Residual income valuation.............................................................................................................................25
6.2.2. Price multiple valuation..................................................................................................................................27
7. RECOMMENDATION .................................................................................................................................28
7.1. INVESTMENT PRINCIPLE OF PENSION FUND .....................................................................................................28
7.2. CORPORATE RISK NATURE.....................................................................................................................................28
7.3. CORPORATE COMPETENCE ...................................................................................................................................29
7.4. FUTURE GROWTH POTENTIAL .............................................................................................................................29
7.5. DIVIDEND.................................................................................................................................................................29
7.6. VALUATION ..............................................................................................................................................................29
7.7. RECOMMENDATION................................................................................................................................................29
REFERENCE......................................................................................................................................................30
APPENDIX ........................................................................................................................................................ 32
Appendix 1: Standardized Income Statement of Greggs plc. 2008-2012	
  (£’1000)..........................32
Appendix 2: Vertical Common Sized Income Statement of Greggs plc 2008-2012..........................32
Appendix 3: Standardized Balance Sheet of Greggs plc. 2008-2012......................................................33
Appendix 4: Standardized Income Statement of Tesco plc. 2008-2012	
  (£’m)....................................35
Appendix 5: Vertical Common Sized Income Statement of Tesco plc 2008-2012.............................35
Appendix 5: Standardized Balance Sheet of Tesco plc. 2008-2012.........................................................36
Appendix 6: Ratio analysis of Greggs plc. and Tesco plc. 2008-2012 .....................................................39
Appendix 7: Ratio calculations.................................................................................................................................41
Appendix 8: 5 Years' forecasted financial statements	
  of	
  Greggs	
  (£’000)..............................................43
Appendix 9: Words reconciliation...........................................................................................................................45
3
LIST OF FIGURES
FIGURE 1: FTSE 100 INDEX OF FOOD AND DRUG RETAILER SECTOR................................................................................................... 6
FIGURE 2: UK RETIAL EXPENDITURE GROWTH YEAR-ON-YEAR 2007-2012 (%)........................................................................... 7
FIGURE 3: RETURN ON EQUITY (ROE) FOR GREGGS AND TESCO, 2008-2012..............................................................................12
FIGURE 4: ADJUSTED RETURN ON EQUITY (ROE) FOR GREGGS AND TESCO, 2008-2012...........................................................13
FIGURE 5: NET PROFIT MARGIN FOR GREGGS AND TESCO, 2008-2012..........................................................................................14
FIGURE 6: ASSETS TURNOVER OF GREGGS AND TESCO, 2008-2012 ...............................................................................................16
FIGURE 7: FINANCIAL LEVERAGE OF GREGGS AND TESCO, 2008-2012 ..........................................................................................18
FIGURE 8: SHARE PRICE OF GREGGS PLC.................................................................................................................................................28
TABLE 1: HISTORY OF GREGGS PLC............................................................................................................................................................ 5
TABLE 2: RANK OF UK BAKERY COMPANIES BASED ON THEIR STORE NUMBER.................................................................................. 7
TABLE 3: FASTEST GROWERS IN UK CRAFT BAKERY ............................................................................................................................... 7
TABLE 4: DECOMPOSITION OF ROE FOR GREGGS, 2008-2012........................................................................................................13
TABLE 5: DECOMPOSITION OF ROE FOR TESCO, 2008-2012...........................................................................................................13
TABLE 6: GROSS PROFIT MARGIN AND SG&A EXPENSES MARGIN FOR GREGGS AND TESCO, 2008-2012.................................14
TABLE 7: EBITDA MARGIN AND NOPAT EXPENSES MARGIN FOR GREGGS AND TESCO, 2008-2012.......................................15
TABLE 8: WORKING CAPITAL MANAGEMENT OF GREGGS, 2008-2012............................................................................................16
TABLE 9: NON-CURRENT ASSETS MANAGEMENT RATIOS FOR GREGGS, 2008-2012.....................................................................17
TABLE 10: CURRENT LIABILITIES AND SHORT-TERM LIQUIDITY OF GREGGS, 2008-2012 ..........................................................18
TABLE 11: DEBT AND LONG-TERM SOLVENCY OF GREGGS, 2008-2012..........................................................................................19
TABLE 12: COMPOSITION OF GREGGS'S CASH FLOW, 2010-2012....................................................................................................20
TABLE 13: CHANGES OF OPERATING WORKING CAPITAL OF GREGGS DURING 2012.......................................................................20
TABLE 14: CASH FLOW GENERATING ABILITY, 2010-2012...............................................................................................................21
TABLE 15: OPERATING CASH FLOW RATIO OF GREGGS, 2010-2012................................................................................................21
TABLE 16: DIVIDEND SUSTAINABILITY OF GREGGS, 2010-2012......................................................................................................21
TABLE 17: FORECASTED SALES GROWTH FOR GREGGS, 2013-2017 ...............................................................................................22
TABLE 18: FORECASTED COST OF SALES FOR GREGGS, 2013-2017.................................................................................................22
TABLE 19: FORECASTED DISTRBUTION AND SELLING COST FOR GREGGS, 2013-2017 ................................................................22
TABLE 20: FORECASTED ADMINISTRATIVE FOR GREGGS, 2013-2017 ............................................................................................23
TABLE 21: FORECASTED OPERATING WORKING CAPITAL MARGIN FOR GREGGS, 2013-2017 .....................................................23
TABLE 22: FORECASTED FREE CASH FLOW TO EQUITY FOR GREGGS, 2013-2017.........................................................................24
TABLE 23: GROWTH SUSTAINABILITY OF GREGGS, 2010-2012 .......................................................................................................29
4
EXCUTIVE SUMMARY
• Greggs is competing on a differentiation strategy
• Integrated supply chain
• Sound brand image
• Wide ranged products with high quality
• Easily accessed stores
• New wholesaling and franchising marketCompetence
Finance
Risk
People
•
•
Opinion
5
1. COMPANY OVERVIEW
1.1. Company Profile
Greggs plc is a UK-based bakery chain company founded and headquartered in Tyneside, Newcastle
in  the  UK  in  1939,  and  has  expanded  into  a  dominant  player  in  UK’s  bakery  industry (Covell, 2005). It
produces fresh bakery goods including a variety of sandwiches, savouries and pasties, and distributes
these products to the market through take out service, retailing, franchising and wholesales (Greggs,
2013b). The company focuses on building a strong brand image of fresh and high quality food
throughout its expansion, and meanwhile improving the overall efficiency of operational activity.
Nowadays Greggs has 1671 shops throughout the UK and approximately 20,000 employees supported
by ten regional bakeries, one savoury production unit and highly efficient self-owned distribution
channels, selling products worth £735 million in the year 2012 (ibid.). It also launched a new project
named  ‘Greggs Moment’  to  explore  the  market  in  coffee  shop format in 2011 (Chris, 2011).
1.2. Company History
Greggs plc. started as a local bakery business in Tyneside founded by John Greggs in 1939, and began
to expand to neighbour areas after his son, Ian Greggs took over. The company experienced significant
growth in 1984, the year of Greggs’  Initial  Public  Offering,  and  1994,  the  year  of  acquiring  Allied  
Bakeries Limited. The detailed history can be presented in a timeline table below.
Table 1: History of Greggs plc.
Year Event
1939 The business started as a small local bakery in Tyneside, England.
1964 Ian Greggs became the chairman of the business named Greggs.
1972 Greggs successfully expand its business outside England.
1984 Greggs hired Mike Darrington as a new managing director and launched its initial public offerings.
1994 Greggs acquired Allied Bakeries Limited, adding Bakers Oven to its brand.
2003 Greggs opened two new stores in Belgium.
2008 Share price dropped 25.38% during financial crisis.
2011 Greggs opened  ‘Greggs Moment’  shops.
Source: International Directory of Company Histories, 2005.
6
2. INDUSTRY OVERVIEW
According to FTSE (2012), Greggs is classified into food and drug retailer sector, which includes
supermarket, chain stores and drug stores etc. The economic downturn and high unemployment rate
has significantly hurt sales revenue and generated fierce price competition. Given the weak economy,
the sector has a compound annual growth rate (CAGR) of 3.5% during previous years (Datamonitor,
2010), presenting a slight growth under economy downturn. However, for food industry, the extent of
damage is relatively small because the demand of food and general goods is income-inelastic. Further
evidence is shown in figure 1. The past performance of index and FTSE 100 of this sector illustrates
that this sector’s share price has a mild fluctuation and highly correlates with whole market index.
Figure 1: FTSE 100 index of food and drug retailer sector
Source: Yahoo Finance
As a bakery corporation, Greggs is listed in the London Stock Exchange and categorized as a food &
drug retailer. The UK food & drug retailer sector is full of numerous companies with fierce
competitions. While some large and lucrative companies expanded rapidly, others underperformed the
market or even went to bankrupt. So this section will analyze Greggs’s  current  market  position using
Porter’s  Five  Forces  Analysis.  To  provide  a  more  precise  analysis,  we  narrow  the  industry  analysis  to  
bakery industry.
2.1.Five forces analysis
Five Forces Analysis offers an effective way to analyze the competitive condition of an industry in
terms of rivalry among existing firms, threat of new entrants, threat of substitutes, bargaining power
of buyers and bargaining power of suppliers (Porter, 1979). These factors determine the capacity for a
7
firm to earn abnormal profits in its industry.
2.1.1. Rivalry among existing firms:
There is a strong competition among existing firms, especially comes from the increasing pressure
from craft bakeries and supermarkets. The figure 2 implicitly indicates a slowdown of market growth
which might be explained by market saturation. To survive and remain competitive, it is critical for
Greggs to attract and retain customers for further development.
Figure 2: UK retial expenditure growth year-on-year 2007-2012 (%)
Source: Verdict Research
Within bakery industry, tables blew show that Greggs has expanded rapidly and soon dominated
bakery market with the most stores, followed by Costa and Subway. However, competition has
increasingly come from supermarkets such as Tesco and Sainsbury. With widely distributed stores and
low priced bakery products, they have become major players in bakery industry. Therefore, it suggests
higher pressure in traditional bakery firms and severer price competition (Palepu, Healy & Peek
2010).
Table 2: Rank of UK bakery companies based on their store number
Rank Company Store numbers in 2013
1 Greggs 1671
2 Costa 1552
3 Subway 1483
Source: British Baker
Table 3: Fastest growers in UK craft bakery
Rank Company Outlets in 2013 Year-on-year increase
1 Costa 1552 200
2 Greggs 1671 100
3.60% 3.85% 3.85%
3.35% 3.30% 3.30%3.60%
-0.20%
-4.30%
0.20%
-0.80% -0.50%
3.60%
1.60%
-0.40%
1.40% 1.10% 1.20%
-5.00%
-4.00%
-3.00%
-2.00%
-1.00%
0.00%
1.00%
2.00%
3.00%
4.00%
5.00%
2007 2008 2009 2010 2011 2012
Food & grocery Non-food Total retail
8
3 Subway 1483 59
Source: British Baker
2.1.2. Threat of new entrants:
Threat from new entrants is considered to be moderate from the following two aspects. Although the
entry  barrier  of  bakery  industry  is  rather  low,  Greggs’s  economy  of  scale,  well  established  distribution  
channel, and good relationship with suppliers made it difficult for the new entrants to obtain a certain
market share. However, certain threat comes from existing food firms who are attracted by high
profitability and likely to enter bakery  market.  Like  McDonald’s  established  McCafé,  other food firms,
such as KFC, Pizza hot, have the potential to be new entrants.
2.1.3. Threat of substitute products
Greggs faces high level of threat of substitute products. Affected by the globalization, consumers are
willing to try new things and change their daily foods. For example, cheap and tasty Chinese, Japanese
and Mexican foods are getting favored. Given the fact of low switching cost in the food industry, it is
crucial for Greggs to take corresponding measures.
2.1.4. Bargaining power of buyers
As   a   result   of   customers’   high   price   sensitivity   and   low switching costs, the bargaining power of
buyers in bakery market is high. With an increasingly acute perception of price, customers spend less
of the disposable income in recent years (Trading Economics, 2013). The situation is worsen by the
economic downturn, which made customers more cautious about their shrinking disposable income.
2.1.5. Bargaining power of suppliers:
The bargaining power of suppliers is relatively low. The major materials Greggs need are indifferent
from individual households, and there are plenty of suppliers in the market. Additionally, the large
volume of purchase by Greggs allows it to have a better bargaining position over their suppliers.
9
2.2.Summaryoffiveforcesanalysis
High
ModerateHigh
Low
Bargainingpowerofbuyers
Highpricesensitivity
Lowswitchingcost
Lessexpenditureofdisposableincome
Threatofnewentrants
Limitedmarketsharefornewentrants
Lowentrybarriers
Integrationofexistingbigfoodfirms
Threatofsubstitutes
Lowswitchingcosts
Lotsofalternatives
RivalryamongexistingfirmsHigh
Lowindustrygrowthrate(3.3%)
Remaindominantbakerymarket
Increasingpressurefromsupermarkets
Bargainingpowerofsuppliers
Plentyofrawmaterialsuppliers
LargevolumepurchasebyGreggs
10
3. STRATEGIC ANALYSIS
Greggs competes on the basis of differentiation by offering high-quality, fresh food at great value
prices, and operating an integrated supply chain from production through distribution to point of sale.
From customers’  perspective,  they  tend  to  be  highly  price  sensitive  and  prefer  conveniently  accessible  
stores as well as take away and processed food. To assess if the strategy fulfill customers’ needs, the
strategy will be analyzed in product level, brand level and operation level.
3.1. Product level
Developing product ranges
Greggs is continuously developing their product ranges. In addition to traditional bakeries, Greggs
now provides breakfasts and low calories choices to meet the increasing needs for late breakfast and
healthy living style (Greggs, 2012).
3.2. Brand level
Building brand images
As with promotion, Greggs spread its advertising channel into online website, which drove its
promotion success. From service aspect, Greggs managed to build an image of comfortable
environment along with good quality of product in Greggs Moment and Bakery Oven, focusing on
pleasant customer experience (ibid.).
Corporate Social Responsibility (CSR)
Greggs has long-standing commitment to CSR and considers it as the core of business operation.
Concerned about the safety and quality, Greggs has removed any artificial chemical additives from its
products. In addition, Greggs is serving more than two million free breakfasts to disadvantaged
primary school children each year (ibid.).
3.3. Operation level
Expanding stores location
Not only Greggs but also Subway and Costa are moving away from high streets. One reason is that
costs for opening new stores in high streets are soaring. While another prior concern is that customers’  
preferences have changed from city center to nearby stores. Hence, Greggs is making their shops more
accessible and comfortable.
Exploring new markets
Greggs is now successfully working together with Iceland and Moto which succeeds in expanding its
profits sources. A range of frozen products in Greggs branded cabinets are traded in Iceland stores
(ibid.). Furthermore, Greggs Moment is aimed to derive shares from increasing coffee market and
exploring the benefits from Greggs’  brand  image.  
11
Integrating supply chain
Greggs’   supply   chain  is   vertical   integrated   as   both  a   baker  and   a   retailer,  from   production   through  
distribution to point of sale. Setting distribution center in certain areas is one of the core expansion
strategies. This ensures the efficiency of Greggs’  operation  and  an  effective  cost-saving scheme.
3.4. Summary of Strategy analysis
12
4. RATIO ANALYSIS
Why Tesco
Greggs mainly has two types of major competitors: bakery and coffee (Costa, Subway, Starbucks) and
chain stores (Tesco,   Sainsbury’s).   It   is   complicated   to   choose   an   ideally   comparable   firm   as   a  
benchmark for financial analysis purpose. Costa and Subway, same as other craft bakeries, are
essentially comparable to Greggs in a number of ways. However, they are all private companies which
renders the detailed financial analysis impossible because of insufficient information disclosures. As
with Starbucks, they are US-based public companies with international operations while Greggs are
solely operating in UK, which makes ratio comparison irrelevant because Starbucks’ statistics
indicates its global performance while Greggs’ only represents UK’s performance. Therefore, we
choose a UK-based retailer Tesco as our benchmark for financial analysis which can be justified on the
ground that Tesco is a market leader in food & drug retailers sector in UK and its bakery and other
food  products  present  major  pressure  on  Greggs’  products, especially easily accessed Tesco Express.
Nonetheless, to achieve an objective comparison, variations in specific business models are taken into
considerations in the analysis below.
As a fundamental work for further probing, forecasting and evaluating, ratio analysis will be
conducted in four main aspects: overall profitability, operating management, investment management
and financial management (Palepu et al, 2010). In each of these dimensions, ratios of previous years
and among peer groups will be compared. Although ratio analysis may not reach a final decision, it
does give us a brief understanding of Greggs in numerical form and may assist the final investment
choice.
4.1. Overall profitability
Widely used by investors, return on equity  (ROE)  ratio  indicates  a  firm’s  profitability  by  measuring  
how much profit a firm can generate with the  funds  invested  by  the  firm’s  shareholders.  The  higher  
ratio  means  more  efficient  the  firm’s  management  is  and  the  better  profit  generating  ability.  In  general,  
ROE between 15% and 20% are considered desirable for most industries. As Figure 3 shows it is
reasonable to state that Greggs in general maintains an acceptable level of ROE through the five years
with an average of 21.17%, which above the benchmark company Tesco.
Figure 3: Return on equity (ROE) for Greggs and Tesco, 2008-2012
23.05% 20.93% 21.53% 22.43%
17.89%
17.94% 16.57% 15.91% 16.07% 15.81%
0.00%
5.00%
10.00%
15.00%
20.00%
25.00%
2008 2009 2010 2011 2012
Greggs
Tesco
13
Both  of  the  two  firms’  ROE  declined  in  2008.  This  might  be  the  result  of  the  financial  crisis  in  2008.  
Greggs seemed to be better than Tesco in dealing with the economic downturn and its ROE recovered
soon in 2010. However, an abnormal drop occurred in 2012 with sharp decrease from 22.43% to
17.89%. Further analysis from the annual report of Greggs shows that the ROE in 2011 was not fully
contributed by operating activities, it contained the income and expenses come from the revaluation of
pension. If excluded, the adjusted ROE in 2011 would be 19.66%. As Figure 4 displays, adjusted ROE
of Greggs showed a steady down turn since 2010 while that of Tesco remained at a stable level with
mild fluctuations.
Figure 4: Adjusted return on equity (ROE) for Greggs and Tesco, 2008-2012
While Tesco was appreciated with stable performance and profitability, Greggs gained advantage over
the magnitude of ROE throughout the five years. By decomposing the ROE into net profit margin,
asset turnover and financial leverage as displayed in table 4 and 5, we find that the higher ROE of
Greggs was mainly driven by the superior net profit margin and asset turnover, which meant Greggs
was more capable to retain profit from sales and more efficient in utilizing asset base. Although Tesco
benefited from aggressive financial management, a strong ROE is certainly a solid signal that Greggs
has better profitability.
Table 4: Decomposition of ROE for Greggs, 2008-2012
2011 is after adjustment 2012 2011* 2010 2009 2008
Net profit margin 5.52% 5.56% 5.73% 5.22% 5.43%
*Asset turnover 2.24 2.27 2.33 2.36 2.51
=ROA 12.35% 12.63% 13.33% 12.30% 13.61%
*Financial leverage 1.45 1.56 1.61 1.70 1.69
=ROE 17.89% 19.66% 21.53% 20.93% 23.05%
Table 5: Decomposition of ROE for Tesco, 2008-2012
2012 2011 2010 2009 2008
Net profit margin 4.33% 4.38% 4.10% 3.97% 4.50%
*Asset turnover 1.28 1.29 1.24 1.18 1.57
=ROA 5.54% 5.66% 5.08% 4.69% 7.06%
*Financial leverage 2.85 2.84 3.13 3.53 2.54
ROE 15.81% 16.07% 15.91% 16.57% 17.94%
23.05% 20.93% 21.53%
19.66%
17.89%
17.94%
16.57% 15.91% 16.07% 15.81%
0.00%
5.00%
10.00%
15.00%
20.00%
25.00%
2008 2009 2010 2011 2012
Greggs
Tesco
14
The following sections will mainly focus on the decomposition of ROE in terms of operating
management, investment management and financial management.
4.2. Operating management
Given the net operating profit margin (Figure 5), further decomposition allows analyst to assess
operating management effectiveness of firms (Palepu et al, 2010). Widely used as an analytical tool,
the common sized income statement (Appendix 2) displays all items as a percentage of sales revenue,
which makes it possible to compare those margins of a firm over time and with peer firms. Several
ratios allow us to investigate why these two firms have distinct net profit margin related to operating
management.
Figure 5: Net profit margin for Greggs and Tesco, 2008-2012
4.2.1. Gross Profit margin & SG&A margin
The gross profit  margin  is  an  indication  of  a  firm’s  financial  health  by  revealing  the  proportion  of  
money left after accounting for the cost of goods sold (ibid.). Table 6 shows that both the gross profit
margin and SG&A margin of Greggs were much higher than that of Tesco. Greggs, a baking firm, has
relatively low cost of goods mainly generated by raw materials, while Tesco, a supermarket, directly
purchases and sells finished products to customers. As with SG&A margin, Greggs has been
undertaking expansion strategy in recent several years, which certainly generated a large amount of
SG&A expenses. For instance, it opened increase 100 new  bakeries  in  2012  and  established  ‘Greggs
The  Moment’   (Greggs, 2012). Despite this, Greggs continuously reduced its SG&A expenses by a
total of £10 million over last three years and targeted to cut another £5 million down in next 2 years
(ibid.) Tesco usually shared SG&A expenses with suppliers. Therefore, the big gap of two margins
should not be surprising and problematic.
Table 6: Gross profit margin and SG&A expenses margin for Greggs and Tesco, 2008-2012
2012 2011 2010 2009 2008
Gross profit margin
Greggs 61.10% 61.09% 61.85% 61.67% 61.76%
Tesco 7.94% 8.30% 8.10% 7.76% 7.67%
SG&A expenses margin
Greggs 53.84% 53.85% 53.95% 54.31% 55.30%
Tesco 2.58% 2.75% 2.68% 2.32% 2.17%
5.43% 5.22%
5.73% 5.56% 5.52%
4.50%
3.97% 4.10% 4.38% 4.33%
0.00%
1.00%
2.00%
3.00%
4.00%
5.00%
6.00%
7.00%
2008 2009 2010 2011 2012
Greggs
Tesco
15
4.2.2. NOPAT margin & EBITDA margin
By netting out cost effects, NOPAT margin and EBITDA margin   can   reflect   a   firm’s   operating  
performance. From Table7 we see that Greggs’s   NOPAT   margin   and   EBITDA   margin   worsened  
between 2011 and 2012 in the presence of declined customer footfalls and like-for-like sales
mentioned previously, but still higher than TESCO. The bigger difference between EBITDA margins
compared with NOPAT margins indicates that the noncash operating expense of Greggs has more
significant impact on operating income, which may also reflects to some extent the expansion strategy
that requires more non-current assets. Given the similar NOPAT margins, Greggs has advantage over
the net profit margin. Therefore, although Greggs has suffered declining profit in recent years, we still
have strong ground to expect its operating performance will be improved in the foreseeable future.
Table 7: EBITDA margin and NOPAT expenses margin for Greggs and Tesco, 2008-2012
2012 2011 2010 2009 2008
EBITDA margin
Greggs 11.75% 13.02% 12.30% 11.51% 11.88%
Tesco 8.24% 8.59% 8.51% 8.09% 8.00%
NOPAT margin
Greggs 5.52% 6.34% 5.71% 5.19% 5.33%
Tesco 4.61% 4.80% 4.51% 4.46% 4.60%
4.2.3. Summary of Operating management
4.2. Operating management: 
4.2.1. Gross Profit margin & SG&A margin 
4.2.2. NOPAT margin & EBITDA margin 
4.3. Investment management
Asset turnover is a fundamental factor composing a company return equity. It is of great importance in
assessing Greggs’   performance   since   Greggs is a retail chain giant that requires huge amount of
operating capital and non-current asset investment. As Figure 6 indicates, asset turnover of Greggs
was almost doubling to that of Tesco, which contributes a sound profit generating ability of Greggs.
Yet, following an obvious drop in 2009 because of the effect of financial crisis, the asset turnover of
Greggs fell  slightly  every  year.  By  contrast,  Tesco’s  asset  turnover  rebounded  in  2010  and  remained  on  
a constant level ever since. Unfavorable sales data due to intense consumer spending budget and
declining footfalls may explain the upsetting trend of asset turnover in Greggs to some extent.
However, the fact that its major competitor Tesco has a steady asset turnover could not be ignored.
This brings up the necessity to dig more of Greggs’s investment management performance by
analyzing working capital management and non-current assets management separately.
16
Figure 6: Assets turnover of Greggs and Tesco, 2008-2012
4.3.1. Working capital management
Effective working capital management ability is essential for a firm to maintain sufficient amount of
cash meeting its short-term debt obligations and operating expense. Operating working capital
turnover   is   an   effective   indicator   of   a   firm’s   ability   in   such   area.   As   a leading firm in food retail
industry, Greggs holds a negative operating working capital since its products can be sold quickly
even before the cost of materials are paid (Table 8). Low level of operating working capital turnover
shows Greggs’s   managerial efficiency. The turnover is lowed on a yearly base and reached an
abnormal low level of -21.08 in 2012. Detailed analysis of such phenomenon will be given by
assessing the trade receivables, inventories and trade payables separately.
Table 8: Working capital management of Greggs, 2008-2012
2012 2011 2010 2009 2008
Operating working capital turnover -21.08 -15.42 -15.28 -13.61 -16.07
Trade receivables turnover 27.29 33.12 29.69 31.04 27.68
Inventories turnover 16.18 19.11 21.26 21.23 19.77
Trade payables turnover 3.97 3.67 3.6 3.52 3.83
4.3.1.1. Trade receivables turnover
Trade receivables turnover is calculated by dividing sales by trade receivables. The higher the rate, the
better  it  shows  a  firm’s  ability to generate liquid revenue. Greggs enjoyed a decline in 2012 but it was
not crucial since the turnover rate of the firm fluctuated every year on a regular base, which might be a
result of different liability due date.
4.3.1.2. Inventories turnover
Inventories turnover derived from cost of sales over inventories. Low turnover rate indicates bad
performance because of excess inventory reserve. The rate of Greggs declined steadily in the past
years and enjoyed a sharp downturn in 2012. This may partly be blamed to the bad weather as Greggs
2.51
2.36 2.33 2.27 2.24
1.57
1.18 1.24 1.29 1.28
0
0.5
1
1.5
2
2.5
3
2008 2009 2010 2011 2012
Greggs
Tesco
17
claims (Greggs, 2012), but it also indicates Greggs’s   weakness   in   optimizing   its   supply   chain  
management.
4.3.1.3. Trade payables turnover
Trade payables turnover is calculated by dividing cost of sales by trade payables. The higher the rate,
the better it indicates a company’s  ability  to  finance  itself  by purchasing on credit. The turnover of
Greggs reached the peak of 3.97 representing a positive sign. This may partly due to the increased
purchasing base as a result of its expansion plan. Yet, potential risks exist if the company continues to
rely on huge amount of trade credits.
4.3.2. Non-current assets management
The ability to utilize non-current   assets   is   of   major   concern   when   assessing   a   firm’s   investment  
management performance. Though the Net non-current asset turnover of Greggs is generally higher
than that of Tesco, the rate of Greggs fell since 2009 and remained at a low level. Property, plant, and
equipment (PP&E) are major components of non-current assets. Further analysis of PP&E turnover
indicates a similar trend. This could be roughly explained by Greggs’s  bold  expansion  plan,  with  100  
new shops opened in 2012 and huge amount of capital investment in savory manufacturing plant.
Therefore, although the ratios indicate an unfavorable performance of Greggs, the situation may be
improved if the investment in non-current asset ceases and begins to generate profit in the future.
Table 9: Non-current assets management ratios for Greggs, 2008-2012
2012 2011 2010 2009 2008
Net non-current assets turnover 2.92 3 3.2 3.51 3.23
PP&E turnover 2.78 2.77 2.93 3.12 2.98
4.3.3. Summary of Investment management
4.3. Investment management: 
Asset turnover 
4.3.1 Working capital management:
Operating working capital turnover 
4.3.1.1 Trade receivables turnover 
4.3.1.2 Inventories turnover 
4.3.1.3 Trade payables turnover 
4.3.2 Non-current assets management:
Non-current asset turnover 
PP&E turnover 
4.4. Financial management
Financial  leverage  measures  a  firm’s  total  debt  to  equity  ratio.  High  financial  leverage  can  benefit  firm  
by increasing its profit-generating base apart from equity. However, high leverage may also imply
18
high risk. Although not held as a general concept, the optimal level of financing structure can be
achieved when cost of liabilities equals cost of equity. In Greggs’s   case,   the   financial   leverage   is  
almost  50%  lower  than  that  of  Tesco’s  and  reduced  gradually (Figure 7). This reflects Greggs has a
rather lowly leveraged structure and a potential to an even lower level.
Figure 7: Financial leverage of Greggs and Tesco, 2008-2012
4.4.1. Current liabilities and short-term liquidity
As retail firms, both Greggs and Tesco capture the industry’s  characteristic  of  high  turnover  rates  and  
thus have high short term liabilities. Greggs has overall smaller percentage of short-term liabilities as
compared to Tesco, but its liquidity risk tends to increase as explained in the following sections.
Table 10: Current liabilities and short-term liquidity of Greggs, 2008-2012
2012 2011 2010 2009 2008
Current ratio 80.53% 68.54% 74.77% 83.13% 53.13%
Quick ratio 58.30% 50.90% 59.45% 68.54% 36.69%
Cash ratio 24.40% 24.73% 30.68% 42.50% 6.00%
4.4.1.1. Current ratio
The current ratio of Greggs is in general below one, which may indicate high risk, but as explained
above, Greggs as a food retailed can afford such kind of risk. In fact, its upward rising trend may
further its liquid credit.
4.4.1.2. Quick ratio
By excluding inventory in calculation, rising quick ratio of Greggs further proves its effort in
improving the ability to afford short-term debt.
4.4.1.3. Cash ratio
Cash ratio uses only cash and marketable securities as numerator. Decreasing level of cash ratio
compared to quick ratio used above implies Greggs has increasing amount of trade receivables and
1.69 1.7 1.61 1.56 1.45
2.54
3.53
3.13
2.84 2.85
0
0.5
1
1.5
2
2.5
3
3.5
4
2008 2009 2010 2011 2012
Greggs
Tesco
19
potential risk if the trade receivables cannot be cashed.
4.4.2. Debt and long-term solvency
The choice of debt  financing  also  influences  a  firm’s  financial  leverage.  Low  and  decreasing  liabilities  
to equity ratio indicates Greggs is not favoring liabilities and thereby has low long-term solvency
problem. It is critical to mention that Greggs carries a distinct feature, as compared to Tesco, that it has
no  debt.  And  thereby  its  debt  to  equity  ratio  is  amounted  to  zero.  Although  it  is  firm’s  own  choice  to  
raise  debt  or  not,  and  firm’s  without  debt  such  as  Apple  can  also  perform  well,  it  is  held  that  generally  
certain amount of debt is beneficial. Additionally, given the fact that Greggs is in a growing phase
requiring  huge  amount  of  investment,  certain  cheaper  debt  financing  can  ease  the  company’s  cash  flow  
problem.
Table 11: Debt and long-term solvency of Greggs, 2008-2012
2012 2011 2010 2009 2008
Liabilities to equity ratio 44.78% 55.76% 61.48% 70.15% 69.27%
Debt to equity ratio 0 0 0 0 0
4.4.3. Summary of Financial Management
4.4. Financial management 
4.4.1 current liabilities and short-term liquidity
4.4.1.1 Current ratio 
4.4.1.2 Quick ratio 
4.4.1.3 Cash ratio 
4.4.2 Debt and long-term solvency
Liabilities to equity ratio 
Debt to equity ratio 
4.5. Summary of Ratio Analysis
4.2. Operating management: 
4.3. Investment management: 
4.4. Financial management 
Overall performance 
20
5. CASH FLOW ANALYSIS
While ratio analysis emphases on income statement and balance sheet of Greggs, cash flow analysis
gives investors better understandings of Greggs’s investing, operating and financing performance and
policies.
5.1. Cash flow structure
Table 12 illustrates the composition of Greggs’   cash   inflow   and   outflow.   During   past   3 years, its
operating activity provided dominant cash inflow while most cash outflow was related to investment
activities, indicating that Greggs is undertaking vast long-term investment through internal financing.
Table 12: Composition of Greggs's cash flow, 2010-2012
Cash inflow 2012 2011 2010
Operating activity 70,013,000 88,112,000 77,826,000
Investing activity 5,112,000 3,339,000 973,000
Financing activity 3,624,000 3,266,000 783,000
Cash outflow
Operating activity -13,435,000 -14,334,000 -15,814,000
Investing activity -46,035,000 -62,882,000 -47,672,000
Financing activity -19,406,000 -18,843,000 -29,925,000
5.2. Internal cash flow generating ability
Benefited from its growing revenue and industry-leading turnover, Greggs keeps a strong cash flow
from operating activity. However, compared to 2011, cash flow from operation declined shapely from
£73,778,000 to £56,578,000 during 2012, which is mainly attributed to undervaluation of pension
amounted to £9,665,000 (Greggs, 2011) and an increase of operating working capital by £10,614,000.
The significant increase of operating working capital was mainly resulted from the unexpected bad
weather and the economy depression, which was reflected in below table.
Table 13: Changes of operating working capital of Greggs during 2012
2012 2011 Changes
Trade Receivables 26,917,000 21,165,000 5,752,000
Inventories 17,658,000 14,274,000 3,384,000
Trade Payables 71,955,000 74,304,000 2,349,000
5.2.1. Future cash flow generating ability
The steady trade payable/ sales ratio and close cooperation with business partners allow Greggs to
realize sales in cash while credit its purchase of raw material. Besides, the industry-leading asset
turnover and newly opened stores ensure Greggs to continue operation activities and pay off accounts
payable. Hence, it is reasonable to believe that Greggs would have strong cash position in future.
21
Table 14: Cash flow generating ability, 2010-2012
2012 2011 2010
Net non-current assets turnover 2.92 3.00 3.20
Trade payable/sales ratio 9.80% 10.60% 10.61%
5.3. Liquidity
Since Greggs has no debt or any interest bearing liability, there is no long-term liquidity risk or
financial distress. In short-term, given that the operating cash flow ratios in table 14 are all less than 1,
Greggs’s  operating cash flow is insufficient to cover short-term payment, which suggests a potential
short-term liquidity risk if the sales and turnover stagnates.
Table 15: Operating cash flow ratio of Greggs, 2010-2012
2012 2011 2010
Operating cash flow ratio 0.71 0.91 0.80
5.4. Dividend payout ability
As an important indicator for pension fund, the dividend coverage ratio measures whether a company's
operating cash flows are sufficient to meet dividends. In practice, investors usually can enjoy a solid
dividend income to support post-employment life if the dividend coverage ratio is above 2 or 3. From
table 16, Greggs has sound dividend payments during past years with dividend coverage ratios all
above 3. Additionally, the growing dividend per share also indicates a progressive dividend policy of
Greggs, which exactly meets our investment requirement.
Table 16: Dividend sustainability of Greggs, 2010-2012
2012 2011 2010
Dividend coverage ratio 2.92 4.03 3.63
Dividend per share 19.5pence 19.3pence 18.2pence
5.5. Summary of Cash Flow Analysis
5.1. Cash flow structure 
5.2. Internal cash flow generating ability 
5.3. Liquidity 
5.4. Dividend payout ability 
22
6. PROSPECTIVE ANALYSIS
Prospective analysis is forward-looking process consisting of forecasting and valuation (Plepu, Healy
& Peek, 2010). Below we summarize the steps to forecast important items related with income
statement,balance sheet, and cash flows, following by detailed valuation.
6.1. Forecasting
Sales growth
While like-for-like sale was 4% lower in the first 11 weeks of 2013, total sales grew by 4.2%,
primarily due to the good performance of newly opened wholesale business. Considering the emerging
business and challenging background, sales in 2013 is assumed to increase by 4.5%. Overall, the
projection in table 17 shows a moderate improvement in growth of sales revenue during 2013 to 2015,
when economy recovers. Thereafter, it is reasonable to assume that growth rate of sales will keep
constant at 6% which is the average growth rate in Europe.
Table 17: Forecasted sales growth for Greggs, 2013-2017
F2013 F2014 F2015 F2016 F2017
Sales growth rate 4.50% 5.00% 6.00% 6.00% 6.00%
Cost of sales
The percentage of cost of sales to revenue was stable in a range from 38.15% to 38.91% in the
common size income statement. However, the latest financial report of Greggs indicates that the gross
margin will decline owing to the high commodity inflation and low margin of wholesaling business.
Thus, table 18 predicts that the cost of sales will increase to 39% and keep constant in the following
years.
Table 18: Forecasted cost of sales for Greggs, 2013-2017
F2013 F2014 F2015 F2016 F2017
Cost of sales -39.00% -39.00% -39.00% -39.00% -39.00%
Distribution and selling cost
The historical percentage of distribution and selling cost to revenue was stable in a range from 48.50%
to 49.29% in the common-sized income statement. However, because Greggs regards quality logistics
as its competitive advantage to provide fresh products, distribution and selling cost is believed to
slightly increase to 49% of revenue and remain constant (Table 19).
Table 19: Forecasted distribution and selling cost for Greggs, 2013-2017
F2013 F2014 F2015 F2016 F2017
Distribution and selling costs -48.87% -49.00% -49.00% -49.00% -49.00%
23
Administrative expenses
Benefited from efficiency of supply chain, Greggs continuously reduced its administrative expenses
during the past 5 years. Administrative cost is estimated in table 20 as percentage of administrative
cost to revenue using three years moving average.
Table 20: Forecasted administrative for Greggs, 2013-2017
F2013 F2014 F2015 F2016 F2017
Administration cost -4.99% -4.84% -4.79% -4.87% -4.83%
Other income
Other income is caused by closure of bakery. It is assumed that there will be no closure of bakery in
the future 5 years. So other income will be 0.
Finance income
Finance income is caused by bank balance and foreign exchange gains. This small figure is negligible,
so it is assumed to be constant at £49,000 after 2012.
Tax rate
The corporate effective tax rate was 24% in 2012 and is assumed to remain unchanged.
Working capital margin
While working capital margin is stable before 2012, it increased significantly to 4.7% in 2012, leading
to a sharp decline of operating cash flow. Despite this, Greggs is capable to increase trade payables
and reduce trade receivables because of the admired reputation and strong bargaining power.
Therefore, Greggs’s  working  capital  margin  is  considered  to  gradually  revert  to  the  mean  ratio  of  6.5%,  
which is shown in table 21.
Table 21: Forecasted operating working capital margin for Greggs, 2013-2017
F2013 F2014 F2015 F2016 F2017
Operating working capital margin -5.00% -5.50% -6.00% -6.50% -6.50%
Property, plant and equipment (PPE)
PPE of Greggs is directly related to number of stores. The PPE per store of past five years is averaged
at£157,000/store which will be used for future PPE forecasting. The latest financial report suggests
that Greggs will open about 60 stores annually. Hence, the PPE of Greggs is forecasted as the product
of the averaged PPE per store and number of stores (see details in Appendix 8).
Debt
As Greggs is an all equity-financed company, Greggs will not raise debt as before.
24
Cash flow forecasts
Once income statement and balance sheet are forecasted, we can derive free cash flow to equity by
adjusting from operating activity and investing activity. Details are shown in Table 22.
Table 22: Forecasted free cash flow to equity for Greggs, 2013-2017
F2013 F2014 F2015 F2016 F2017
Net profit 41,688 43,893 46,827 49,076 52,300
Less Change in Working Capital
(cash excluded)
3,538 5,949 6,931 7,603 3,532
Add Depreciation 33 33 33 33 33
Less Change in non-current assets
(investment activity)
(7,510) (9,420) (9,420) (9,420) (9,420)
Cash flow to Equity 37,749 40,454 44,371 47,293 46,444
25
6.2.Valuation
6.2.1.Residualincomevaluation
Input
ForecastedRIgrowthrate(notes4)-15%
Dividendpaidin201219,406
Costofequity(Note1)4.692%
No.ofshares101,160,000
Net  equity  (£’000)226,790
2012
(£’000)
2013
(£’000)
2014
(£’000)
2015
(£’000)
2016
(£’000)
2017
(£’000)
Onwards
(£’000)
Openingbookvalue226,790247,616269,083291,802314,963339,402
Earnings(Note2)41,68843,89346,82749,07652,300
Capitalcharge(Note3)10,64111,61812,62513,69114,778
Residualincome(Note4)31,04732,27534,20235,38537,522161,961
Dividend(Note5)19,40620,86122,42624,10825,91627,860
Closingbookvalue(Note6)247,616269,083291,802314,963339,402
Discountfactor(@4.692%)0.95520.91240.87150.83240.7951
PVRI29,65529,44729,80629,45529,834128,779
26
NPVRI276,977
NETequity226,790
Value503,767
No.ofsharesoutstanding101,160,000
SharePrice(pence)497.99
Currentshareprice(pence)464.50
Liquidatingdividend501,364
PVDiv.19,92620,46121,01021,57322,152398,644
NPVDiv.503,767
Notes
Note1:Rateof10-yeargovernmentbondisusedasriskfreerate
Riskfreerate1.83%(Source:CountryEconomy,2013)
Marketriskpremium5.40%(Source:CountryEconomy,2013)
Beta0.53(Source:FinancialTimes,2013)
Costofequity=riskfreerate+beta*marketriskpremium=1.83%+0.53*5.40%=4.692%
Note2:earningsaretakenfromtheforecastedcashflowstatement
Note3:Capitalcharge=openingbookvalue*costofequity
Note4:assumeresidualincomedecreaseby15%from2018onwards
Note5:assumeannualdividendgrowthis7.5%from13-17
Note6:Closingbookvalue=openingbookvalue+earnings-dividend
27
6.2.2. Price multiple valuation
P/E ratio is a simplified indicator of a company’s value. It is defined as market price per share
divided by annual earnings per share. Generally speaking, companies with P/E higher than 17
are overvalued and those with P/E lower than 10 are undervalued. However, P/E of different
industries may vary due to different natures. Companies within the same industry generally
hold similar P/E unless abnormal operating failure occurs or high future growth is expected.
The average P/E of Food and Drug retailer sector is 11.17. Greggs has a close ratio amounted
to 11.91. This indicates that Greggs’s   stock   price is fairly valued compared to its peers.
However, as Greggs has been expanding and investing substantially, it is reasonable to expect
that the P/E ratio of Greggs has a high possibility to grow in the future. In other words,
Greggs is to some extent undervalued, which confirms the forecast by residual income model.
28
7. RECOMMENDATION
In the last part, we would give investment recommendation for pension fund managers
according to previous analysis.
7.1. Investment Principle of Pension Fund
Pension fund is an assets pool which aims to generate stable growth over the long term, and
provide pensions for investors to support their post-employment life. Because investors would
lose their major income from working after retirement, they cannot bear much loss from
investment. Hence, fund managers must be prudential when making investment decisions,
here, we recommend to invest in firms with low risk and relatively stable returns, especially
firms with stable value and large capitalization.
7.2. Corporate risk nature
With respect to business nature, compared with other industry, demand of food is relatively
income-inelastic, thus, the continuing economic depression would not greatly harm Greggs’  
ongoing operation. As with share price performance, Greggs’   share   price was very stable
during these years compared with the market index, with β=0.53, its share price has ranged
from 400 pence to 550 pence since 2010 and kept a growing trend. The trend line also
reconciles with the previous valuation result, indicating the undervalued share price.
Furthermore, the no-debt capital structure results in no bankruptcy risk of Greggs.
Figure 8: Share price of Greggs plc.
Source: Yahoo finance
29
7.3. Corporate Competence
Though the five forces analysis indicates that Greggs is facing fierce competition in bakery
market, it adopts differentiation strategy to be specialized in bakery making, offering high
quality fresh products. From the previous financial analysis, it can be concluded that Greggs
has competitive advantage in its differentiation strategy. Greggs has sound brand, profitable
products, industry leading turnover and excellent working capital management (negative
operating working capital), contributing to its growing revenue and strong cash flow
generation when competing with competitors.
7.4. Future Growth Potential
Firstly, the expanding wholesaling and franchising business strongly supported Greggs
revenue growth during past years, and will account for more and more weight of Greggs’  
income in future years. Secondly, Greggs plans to open about 60 new stores and refurbish
over 100 stores in future, presenting potential growth opportunity in bakery retail business.
7.5. Dividend
Pension fund values dividend income more than short-term capital gain and Greggs claims a
progressive dividend policy, with an average 7.5% increase per year. As table 23 shows,
sufficient dividend coverage ratio and increasing dividend payment guarantees the dividend
payout will continue in future.
Table 23: Growth sustainability of Greggs, 2010-2012
2012 2011 2010
Dividend payout ratio 0.48 0.41 0.45
Dividend per share 19.5pence 19.3pence 18.2pence
Divided coverage ratio 2.90 4.00 3.60
7.6. Valuation
The result of valuation part illustrates that Greggs’  share  price is underpriced in market and
the share price may eventually increase to reflect its true value.
7.7. Recommendation
Though the fact that Greggs is small cap company which may not fit our investment purpose,
with low risk, stable growth and progressive dividend payout, combined with the undervalued
share price, Greggs shows upward growth prospective. Thus, we recommend to BUY and
HOLD Greggs shares.
30
REFERENCE
British Baker (2013) BB 75 2013 report [Online] Available at
<http://www.bakeryinfo.co.uk/news/categoryfront.php/id/286/BB75_2013.html> [8th
April 2013]
Chris, T. (2011) Greggs picks its moment to take on Starbucks. [Online] Available at
<http://www.ft.com/cms/s/0/64ae9dba-f26f-11e0-931e-00144feab49a.html#axzz2RAue9
18o> [7th
April 2013]
CountryEconomy (2013) UK Bonds - 10 Years [Online] Retrieved at <
http://countryeconomy.com/bonds/uk?dr=2013-01> [12th
April 2013]
Covell,  J.  (2005)  “Greggs  PLC”  International Directory of Company Histories 2005 [Online]
Available from < http://www.encyclopedia.com/doc/1G2-3429200053.html > [7th
April
2013]
Datamonitor (2010), Food Retail in the United Kingdom, [online] Available at:
<http://www.docin.com/p-338524950.html> [1st
April 2013]
Financial Times (2013) Greggs PLC, GRG:LSE performance, [Online] Available at
<http://markets.ft.com/research/Markets/Tearsheets/Summary?s=GRG:LSE> [1st
April
2013]
Greggs plc (2008) Annual Reports and Accounts 2008 [Online] Available at <
http://corporate.greggs.co.uk/assets/Uploads/2008-Annual-Report.pdf> [25th
March,
2013]
Greggs plc (2009) Annual Reports and Accounts 2009 [0nline] Available at <
http://corporate.greggs.co.uk/assets/Financial-Results/GREGGS%20ANNUAL%20REP
ORT_2010.pdf> [25th
March, 2013]
Greggs plc (2011) Annual Reports and Accounts 2010 [Online] Available at <
http://corporate.greggs.co.uk/assets/Uploads/630554A4ANNUAL-REPORT2011-3.pdf>
[25th
March, 2013]
Greggs plc (2012) Annual Reports and Accounts 2011 [Online] Available at
<http://corporate.greggs.co.uk/assets/Uploads/GREGGS-PLC-REPORT-AND-ACCOU
NTS.pdf> [25th
March, 2013]
Greggs plc (2013a) Annual Reports and Accounts 2012 [Online] Available at
<http://corporate.greggs.co.uk/assets/Uploads/GREGGS-18035-AR2012-Web.pdf> [25th
31
March, 2013]
Greggs plc (2013b) Company Overview [Online] Available at
<http://corporate.greggs.co.uk/company-overview> [28th
March, 2013]
Palepu, K. G., Healy, P.M. & Peek, E. (2010) Business Analysis and Valuation IFRS edition:
Second edition. Hampshire: South-Western, Cengage Learning Inc.
Porter M.E. (1979), The Five Competitive Forces that Shape Strategy, [online] Available at:
<http://prolog.univie.ac.at/teaching/LVAs/KFK-LM/WS07/Porter.pdf> [25th
March
2013]
TESCO plc (2009) Annual Report and Financial Statements 2008 [Online] Available at <
http://www.tescoplc.com/files/pdf/reports/annual_report_2009.pdf > [25th
March, 2013]
TESCO plc (2010) Annual Report and Financial Statements 2009 [Online] Available at <
http://www.tescoplc.com/files/pdf/reports/annual_report_2009.pdf > [25th
March, 2013]
TESCO plc (2011) Annual Report and Financial Statements 2010 [Online] Available at <
http://www.tescoplc.com/files/pdf/reports/annual_report_2010.pdf> [25th
March, 2013]
TESCO plc (2012) Annual Report and Financial Statements 2011 [Online] Available at <
http://www.tescoplc.com/files/pdf/reports/tesco_annual_report_2011.pdf> [25th
March,
2013]
TESCO plc (2013) Annual Report and Financial Statements 2012 [Online] Available at <
http://www.tescoplc.com/files/pdf/reports/tesco_annual_report_2012.pdf> [25th
March,
2013]
Trading Economics 2013, United Kingdom Households Disposable Income, [online]
Retrieved at:
<http://www.tradingeconomics.com/united-kingdom/disposable-personal-income> [3rd
April, 2013]
Trading Economics 2013, United Kingdom Consumer Spending, [online] Retrieved at:
<http://www.tradingeconomics.com/united-kingdom/consumer-spending> [3rd
April,
2013]
Verdict (2013) How the UK Will Shop: 2013, [online] Available at:
<http://www.sas.com/offices/europe/uk/downloads/retail/retail-predictions2013.pdf> [2nd
April 2013]
32
APPENDIX
Appendix 1: Standardized Income Statement of Greggs plc. 2008-2012 (£’1000)
2012 2011 2010 2009 2008
Sales 734,502 701,088 662,326 658,186 628,198
Cost of Sales -285,748 -272,778 -252,651 -252,284 -240,200
Gross Profit 448,754 428,310 409,675 405,902 387,998
SG&A
Distribution and selling costs -362,067 -342,641 -321,261 -321,686 -306,573
Administrative expenses -33,394 -34,903 -36,049 -35,783 -40,845
-395,461 -377,544 -357,310 -357,469 -347,418
Other income 0 9,665 0 0 8,033
Operating profit 53,293 60,431 52,365 48,433 48,613
Net interest 49 69 158 346 857
Profit before tax 53,342 60,500 52,523 48,779 49,470
Income tax -12,775 -15,997 -14,589 -14,405 -15,375
Net Profit 40,567 44,503 37,934 34,374 34,095
Appendix 2: Vertical Common Sized Income Statement of Greggs plc 2008-2012
2012 2011 2010 2009 2008
Sales 100.00% 100.00% 100.00% 100.00% 100.00%
Cost of Sales -38.90% -38.91% -38.15% -38.33% -38.24%
Gross Profit 61.10% 61.09% 61.85% 61.67% 61.76%
SG&A
Distribution and selling costs -49.29% -48.87% -48.50% -48.87% -48.80%
Administrative expenses -4.55% -4.98% -5.44% -5.44% -6.50%
-53.84% -53.85% -53.95% -54.31% -55.30%
Other income 0.00% 1.38% 0.00% 0.00% 1.28%
Operating profit 7.26% 8.62% 7.91% 7.36% 7.74%
Net interest 0.01% 0.01% 0.02% 0.05% 0.14%
Profit before tax 7.26% 8.63% 7.93% 7.41% 7.87%
Income tax -1.74% -2.28% -2.20% -2.19% -2.45%
Net Profit 5.52% 6.35% 5.73% 5.22% 5.43%
33
Appendix3:StandardizedBalanceSheetofGreggsplc.2008-2012
20122011201020092008
ASSETS
CashandMarketableSecurities
-Cashandcashequivalents19,38119,50820,790346194433
-Short-terminvestment05003,00000
19,38120,00823,790346194433
TradeReceivables26,91721,16522,3092120622698
Inventories17,65814,27411,8831188612152
OtherCurrentAssets00000
TotalCurrentAssets63,95655,44757,9826771139283
Non-CurrentTangibleAssets
-Property,plantandequipment264,257253,264226,150211155210455
Non-CurrentIntangibleAssets144289433579686
DeferredTaxAsset00000
OtherNon-CurrentAssets00000
TotalNon-CurrentAssets264,401253,553226,583211734211141
TotalAssets328,357309,000284,565279445250424
LIABILITIES
CurrentDebt00000
TradePayables71,95574,30470,2467173862761
OtherCurrentLiabilities
-Currenttaxliability71015,9696,28288578337
34
-Provisions3596201,0188572843
74606,5897,300971411180
TotalCurrentLiabilities79,41580,89377,5468145273941
Non-CurrentDebt
DeferredTaxLiability9,19910,01010,924929812154
OtherNon-CurrentLiabilities(non-interestbearing)
-Deferredgovernmentgrants7,5027,9698,43988308221
-Definedbenefitpensionliability4,0568,8668,764123325733
-Longtermprovisions1,3952,8792,66532962428
12,95319,71419,8682445816382
TotalNon-currentliabilities22,15229,72430,7923375628536
TotalLiability101,567110,617108,338115208102477
EQUITIES
PreferenceShares00000
OrdinaryShareholder'sEquity
-ShareCapital2,0232,0232,02320802080
-SharePremiumAccount13,53313,53313,5331353313533
-Capitalredemptionreserve416416416359359
-Retainedearnings210,818182,411160,255148265131975
TotalEquity226,790198,383176,227164237147947
TotalEquityandLiabilities328,357309,000284,565279445250424
35
Appendix 4: Standardized Income Statement of Tesco plc. 2008-2012 (£’m)
2012 2011 2010 2009 2008
Sales 64,975 60,931 56,910 53,898 47,298
Cost of Sales -59,817 -55,871 -52,303 -49,713 -43,668
Gross Profit 5,158 5,060 4,607 4,185 3,630
SG&A
Administrative expense -1,675 -1,676 -1,527 -1,252 -1,027
Other operating income 375 427 377 236 188
Operating Profit 3,858 3,811 3,457 3,169 2,791
Investment income 91 57 33 110 75
Net interest -242 -333 -314 -362 -63
Profit before tax 3,707 3,535 3,176 2,917 2,803
Income tax -893 -864 -840 -779 -673
Net Profit 2,814 2,671 2,336 2,138 2,130
Appendix 5: Vertical Common Sized Income Statement of Tesco plc 2008-2012
2012 2011 2010 2009 2008
Sales 100% 100% 100% 100% 100%
Cost of Sales -92.06% -85.99% -80.50% -76.51% -67.21%
Gross Profit 7.94% 7.79% 7.09% 6.44% 5.59%
SG&A
Administrative expense -2.58% -2.58% -2.35% -1.93% -1.58%
Other operating income 0.58% 0.66% 0.58% 0.36% 0.29%
Operating Profit 5.94% 5.87% 5.32% 4.88% 4.30%
Investment income 0.14% 0.09% 0.05% 0.17% 0.12%
Net interest -0.37% -0.51% -0.48% -0.56% -0.10%
Profit before tax 5.71% 5.44% 4.89% 4.49% 4.31%
Income tax -1.37% -1.33% -1.29% -1.20% -1.04%
Net Profit 4.33% 4.11% 3.60% 3.29% 3.28%
36
Appendix5:StandardizedBalanceSheetofTescoplc.2008-2012
20122011201020092008
ASSETS
CashandMarketableSecurities
-Cashandcashequivalents2,3052,4282,8193,5091,788
-Short-terminvestment1,2431,0221,3141,233360
3,5483,4504,1334,7422,148
TradeReceivables2,6572,3301,8881,8201,311
Inventories3,5983,1622,7292,6692,430
OtherCurrentAssets2,5502,6662,6423,850103
TotalCurrentAssets12,35311,60811,39213,0815,992
Non-CurrentTangibleAssets
-Property,plantandequipment25,71024,39824,20323,15219,787
-Non-currenttangibleassetsclassifiedasheldforsale510431373398308
26,22024,82924,57623,55020,095
Non-CurrentIntangibleAssets4,6184,3384,1774,0762,336
DeferredTaxAsset23483849104
OtherNon-CurrentAssets
-Investmentinassociates42331615262305
-Investmentproperty1,9911,8631,7311,5391,112
-Otherinvestments1,5269388632594
-Non-currentderivativefinancialinstruments1,7261,1391,2501,478216
-Loansandadvancestocustomers1,9012,1271,8441,4700
37
7,5676,3835,8404,8081,637
TotalNon-CurrentAssets38,42835,59834,63132,48324,172
TotalAssets50,78147,20646,02345,56430,164
LIABILITIES
CurrentDebt1,8381,3861,5293,4712,084
TradePayables11,23410,4849,4428,6657,359
OtherCurrentLiabilities
-Currenttaxliability416432472362455
-Provisions996439104
-Others5,6625,3654,5335,087443
6,1775,8615,0445,459902
TotalCurrentLiabilities19,24917,73116,01517,59510,345
Non-CurrentDebt
-Financialliabilities10,59910,28912,52012,6936,294
DeferredTaxLiabiliy1,1601,094795676791
OtherNon-CurrentLiabilities(non-interestbearing)
-Provisionforpost-employeebenefits1,8721,3561,8401,494838
-Otherprovisions10011317220023
1,9721,4692,0121,694861
TotalNon-currentliabilities13,73112,85215,32715,0637,946
TotalLiability32,98030,58331,34232,65818,291
38
EQUITIES
PreferenceShares00000
OrdinaryShareholder'sEquity
-ShareCapital402402399395393
-SharePremium4,9644,8964,8014,6384,511
-Retainedearnings12,36911,1979,3567,7766,842
-Otherreserves4040404040
17,77516,53514,59612,84911,786
Non-controllinginterests2688855787
TotalEquity17,80116,62314,68112,90611,873
TotalEquityandLiabilities50,78147,20646,02345,56430,164
39
Appendix 6: Ratio analysis of Greggs plc. and Tesco plc. 2008-2012
2012 2011 2010 2009 2008
Greggs Tesco Greggs Tesco Greggs Tesco Greggs Tesco Greggs Tesco
ROE 17.89% 15.81% 22.43% 16.07% 21.53% 15.91% 20.93% 16.57% 23.05% 17.94%
Financial leverage 1.45 2.85 1.56 2.84 1.61 3.13 1.70 3.53 1.69 2.54
ROA 12.35% 5.54% 14.40% 5.66% 13.33% 5.08% 12.30% 4.69% 13.61% 7.06%
Net Profit margin 5.52% 4.33% 6.35% 4.38% 5.73% 4.10% 5.22% 3.97% 5.43% 4.50%
Operating management
Gross profit margin 61.10% 7.94% 61.09% 8.30% 61.85% 8.10% 61.67% 7.76% 61.76% 7.67%
SG&A expenses margin 53.84% 2.58% 53.85% 2.75% 53.95% 2.68% 54.31% 2.32% 55.30% 2.17%
EBITDA margin 11.75% 8.24% 13.02% 8.59% 12.30% 8.51% 11.51% 8.09% 11.88% 8.00%
NOPAT margin 5.52% 4.61% 6.34% 4.80% 5.71% 4.51% 5.19% 4.46% 5.33% 4.60%
Asset turnover 2.24 1.28 2.27 1.29 2.33 1.24 2.36 1.18 2.51 1.57
Working capital management
Operating working capital turnover -21.08 -7.55 -15.42 -7.44 -15.28 -7.87 -13.61 -9.32 -16.07 -10.71
Trade receivables turnover 27.29 24.45 33.12 26.15 29.69 30.14 31.04 29.61 27.68 36.08
Inventories turnover 16.18 18.06 19.11 19.27 21.26 20.85 21.23 20.19 19.77 19.46
Trade payables turnover 3.97 5.78 3.67 5.81 3.6 6.03 3.52 6.22 3.83 6.43
Non current assets management
Net non-current assets turnover 2.92 1.78 3 1.79 3.2 1.74 3.51 1.75 3.23 2.03
PP&E turnover 2.78 2.53 2.77 2.5 2.93 2.35 3.12 2.33 2.98 2.39
Financial leverage 1.45 2.85 1.56 2.84 1.61 3.13 1.7 3.53 1.69 2.54
Current liabilities and short term
40
liquidity
Current ratio 80.53% 64.17% 68.54% 65.47% 74.77% 71.13% 83.13% 74.34% 53.13% 57.92%
Quick ratio 58.30% 32.24% 50.90% 32.60% 59.45% 37.60% 68.54% 37.29% 36.69% 33.44%
Cash ratio 24.40% 18.43% 24.73% 19.46% 30.68% 25.81% 42.50% 26.95% 6.00% 20.76%
Debt and long term solvency
Liabilities to equity ratio 44.78% 185.27% 55.76% 183.98% 61.48% 213.49% 70.15% 253.05% 69.27% 154.06%
Debt to equity ratio 0 69.87% 0 70.23% 0 95.70% 0 125.24% 0 70.56%
41
Appendix 7: Ratio calculations
Profitability Ratios
𝑅𝑂𝐸 = 𝑅𝑂𝐴 × 𝐹𝑖𝑛𝑎𝑛𝑐𝑖𝑎𝑙  𝐿𝑣𝑒𝑟𝑎𝑔𝑒
𝑅𝑂𝐴 =
𝑁𝑒𝑡  𝑃𝑟𝑜𝑓𝑖𝑡
𝐴𝑠𝑠𝑒𝑡𝑠
= 𝑁𝑒𝑡  𝑃𝑟𝑜𝑓𝑖𝑡  𝑀𝑎𝑟𝑔𝑖𝑛 × 𝐴𝑠𝑠𝑒𝑡𝑠  𝑇𝑢𝑟𝑛𝑜𝑣𝑒𝑟
𝑁𝑒𝑡  𝑃𝑟𝑜𝑓𝑖𝑡  𝑚𝑎𝑟𝑔𝑖𝑛 =
𝑁𝑒𝑡  𝑃𝑟𝑜𝑓𝑖𝑡
𝑆𝑎𝑙𝑒𝑠
𝐴𝑠𝑠𝑒𝑡𝑠  𝑇𝑢𝑟𝑛𝑜𝑣𝑒𝑟 =
𝑆𝑎𝑙𝑒𝑠
𝐴𝑠𝑠𝑒𝑡𝑠
𝐹𝑖𝑛𝑎𝑛𝑐𝑖𝑎𝑙  𝐿𝑒𝑣𝑒𝑟𝑎𝑔𝑒 =
𝐴𝑠𝑠𝑒𝑡𝑠
𝑆ℎ𝑎𝑟𝑒ℎ𝑜𝑙𝑑𝑒𝑠′  𝑒𝑞𝑢𝑖𝑡𝑦
Operating Ratios
𝐺𝑟𝑜𝑠𝑠  𝑃𝑟𝑜𝑓𝑖𝑡  𝑚𝑎𝑟𝑔𝑖𝑛 =
𝑆𝑎𝑙𝑒𝑠 − 𝐶𝑜𝑠𝑡  𝑜𝑓  𝑆𝑎𝑙𝑒𝑠
𝑆𝑎𝑙𝑒𝑠
𝑆𝐺&𝐴  𝑒𝑥𝑝𝑒𝑛𝑠𝑒  𝑚𝑎𝑟𝑔𝑖𝑛 =
𝑆𝐺&𝐴  𝑒𝑥𝑝𝑒𝑛𝑠𝑒
𝑆𝑎𝑙𝑒𝑠
𝑁𝑂𝑃𝐴𝑇  𝑚𝑎𝑟𝑔𝑖𝑛 =
𝑁𝑂𝑃𝐴𝑇
𝑆𝑎𝑙𝑒𝑠
𝐸𝐵𝐼𝑇𝐷𝐴  𝑚𝑎𝑟𝑔𝑖𝑛 =
𝐸𝑎𝑟𝑛𝑖𝑛𝑔𝑠  𝑏𝑒𝑓𝑜𝑟𝑒  𝑖𝑛𝑡𝑒𝑟𝑒𝑠𝑡𝑠, 𝑡𝑎𝑥𝑒𝑠, 𝑑𝑒𝑝𝑟𝑒𝑐𝑖𝑎𝑡𝑖𝑜𝑛  𝑎𝑛𝑑  𝑎𝑚𝑜𝑟𝑡𝑖𝑧𝑎𝑡𝑖𝑜𝑛
𝑆𝑎𝑙𝑒𝑠
Investment Ratios
𝑂𝑝𝑒𝑟𝑎𝑡𝑖𝑛𝑔  𝑤𝑜𝑟𝑘𝑖𝑛𝑔  𝑐𝑎𝑝𝑖𝑡𝑎𝑙
= (𝐶𝑢𝑟𝑟𝑒𝑛𝑡  𝑎𝑠𝑠𝑒𝑡𝑠 − 𝐶𝑎𝑠ℎ  𝑎𝑛𝑑  𝑚𝑎𝑟𝑘𝑒𝑡𝑎𝑏𝑙𝑒  𝑠𝑒𝑐𝑢𝑟𝑖𝑡𝑖𝑒𝑠) − (𝐶𝑢𝑟𝑟𝑒𝑛𝑡  𝑙𝑖𝑎𝑏𝑖𝑙𝑖𝑡𝑖𝑒𝑠
− 𝐶𝑢𝑟𝑟𝑒𝑛𝑡  𝑑𝑒𝑏𝑡  𝑎𝑛𝑑  𝑐𝑢𝑟𝑟𝑒𝑛𝑡  𝑝𝑜𝑟𝑡𝑖𝑜𝑛  𝑜𝑓  𝑛𝑜𝑛 − 𝑐𝑢𝑟𝑟𝑒𝑛𝑡  𝑑𝑒𝑏𝑡)
𝑂𝑝𝑒𝑟𝑎𝑡𝑖𝑛𝑔  𝑤𝑜𝑟𝑘𝑖𝑛𝑔  𝑐𝑎𝑝𝑖𝑡𝑎𝑙  𝑡𝑜  𝑠𝑎𝑙𝑠𝑒𝑠  𝑡𝑢𝑟𝑛𝑜𝑣𝑒𝑟 =
𝑆𝑎𝑙𝑒𝑠
𝑂𝑝𝑒𝑟𝑎𝑡𝑖𝑛𝑔  𝑤𝑜𝑟𝑘𝑖𝑛𝑔  𝑐𝑎𝑝𝑖𝑡𝑎𝑙
𝑇𝑟𝑎𝑑𝑒  𝑟𝑒𝑐𝑒𝑖𝑣𝑎𝑏𝑙𝑒𝑠  𝑡𝑢𝑟𝑛𝑜𝑣𝑒𝑟 =
𝑆𝑎𝑙𝑒𝑠
𝑇𝑟𝑎𝑑𝑒  𝑟𝑒𝑐𝑒𝑖𝑣𝑎𝑏𝑙𝑒𝑠
𝐼𝑛𝑣𝑒𝑛𝑡𝑜𝑟𝑦  𝑡𝑢𝑟𝑛𝑜𝑣𝑒𝑟 =
𝐶𝑜𝑠𝑡  𝑜𝑓  𝑠𝑎𝑙𝑒𝑠
𝐼𝑛𝑣𝑒𝑛𝑡𝑜𝑟𝑦
𝑇𝑟𝑎𝑑𝑒  𝑝𝑎𝑦𝑎𝑏𝑙𝑒𝑠  𝑡𝑢𝑟𝑛𝑜𝑣𝑒𝑟 =
𝐶𝑜𝑠𝑡  𝑜𝑓  𝑠𝑎𝑙𝑒𝑠
𝑇𝑟𝑎𝑑𝑒  𝑝𝑎𝑦𝑎𝑏𝑙𝑒𝑠
𝐷𝑎𝑦𝑠 𝑖𝑛𝑣𝑒𝑛𝑡𝑜𝑟𝑖𝑒𝑠 =
𝐼𝑛𝑣𝑒𝑛𝑡𝑜𝑟𝑖𝑒𝑠
𝐴𝑣𝑒𝑟𝑎𝑔𝑒  𝑐𝑜𝑠𝑡  𝑜𝑓  𝑠𝑎𝑙𝑒𝑠  𝑝𝑒𝑟  𝑑𝑎𝑦
𝐷𝑎𝑦𝑠 𝑝𝑎𝑦𝑎𝑏𝑙𝑒 =
𝑇𝑟𝑎𝑑𝑒  𝑝𝑎𝑦𝑎𝑏𝑙𝑒𝑠
𝐴𝑣𝑒𝑟𝑎𝑔𝑒  𝑐𝑜𝑠𝑡  𝑜𝑓  𝑠𝑎𝑙𝑒𝑠  𝑝𝑒𝑟  𝑑𝑎𝑦
𝑁𝑒𝑡  𝑛𝑜𝑛 − 𝑐𝑢𝑟𝑟𝑒𝑛𝑡  𝑎𝑠𝑠𝑒𝑡  𝑡𝑢𝑟𝑛𝑜𝑣𝑒𝑟 =
𝑆𝑎𝑙𝑒𝑠
𝑁𝑒𝑡  𝑛𝑜𝑛 − 𝑐𝑢𝑟𝑟𝑒𝑛𝑡  𝑎𝑠𝑠𝑒𝑡𝑠
42
𝑃𝑃&𝐸  𝑡𝑢𝑟𝑛𝑜𝑣𝑒𝑟 =
𝑆𝑎𝑙𝑒𝑠
𝑁𝑒𝑡  𝑝𝑟𝑜𝑝𝑒𝑟𝑡𝑦, 𝑝𝑙𝑎𝑛𝑡  𝑎𝑛𝑑  𝑒𝑞𝑢𝑖𝑝𝑚𝑒𝑛𝑡
Financing Ratios
𝐶𝑢𝑟𝑟𝑒𝑛𝑡  𝑟𝑎𝑡𝑖𝑜 =
𝐶𝑢𝑟𝑟𝑒𝑛𝑡  𝑎𝑠𝑠𝑒𝑡𝑠
𝐶𝑢𝑟𝑟𝑒𝑛𝑡  𝑙𝑖𝑎𝑏𝑖𝑙𝑖𝑡𝑖𝑒𝑠
𝑄𝑢𝑖𝑐𝑘  𝑟𝑎𝑡𝑖𝑜 =
𝐶𝑎𝑠ℎ  𝑎𝑛𝑑  𝑚𝑎𝑟𝑘𝑒𝑡  𝑠𝑒𝑐𝑢𝑟𝑖𝑡𝑖𝑒𝑠 + 𝑇𝑟𝑎𝑑𝑒  𝑟𝑒𝑐𝑒𝑖𝑣𝑎𝑏𝑙𝑒𝑠  (𝑛𝑒𝑡)
𝐶𝑢𝑟𝑟𝑒𝑛𝑡  𝑙𝑖𝑎𝑏𝑖𝑙𝑖𝑡𝑖𝑒𝑠
𝐶𝑎𝑠ℎ  𝑟𝑎𝑡𝑖𝑜 =
𝐶𝑎𝑠ℎ  𝑎𝑛𝑑  𝑚𝑎𝑟𝑘𝑒𝑡𝑎𝑏𝑙𝑒  𝑠𝑒𝑐𝑢𝑟𝑖𝑡𝑖𝑒𝑠
𝐶𝑢𝑟𝑟𝑒𝑛𝑡  𝑙𝑖𝑎𝑏𝑖𝑙𝑡𝑖𝑒𝑠
𝑂𝑝𝑒𝑟𝑎𝑡𝑖𝑛𝑔  𝑐𝑎𝑠ℎ  𝑓𝑙𝑜𝑤  𝑟𝑎𝑡𝑖𝑜 =
𝐶𝑎𝑠ℎ  𝑓𝑙𝑜𝑤  𝑓𝑟𝑜𝑚  𝑜𝑝𝑒𝑟𝑎𝑡𝑖𝑜𝑛
𝐶𝑢𝑟𝑟𝑒𝑛𝑡  𝑙𝑖𝑎𝑏𝑖𝑙𝑖𝑡𝑖𝑒𝑠
𝐿𝑖𝑎𝑏𝑖𝑙𝑡𝑖𝑒𝑠  𝑡𝑜  𝑒𝑞𝑢𝑖𝑡𝑦  𝑟𝑎𝑡𝑖𝑜 =
𝑇𝑜𝑡𝑎𝑙  𝑙𝑖𝑎𝑏𝑖𝑙𝑖𝑡𝑖𝑒𝑠
𝑆ℎ𝑎𝑟𝑒ℎ𝑜𝑙𝑑𝑒𝑟𝑠 𝑒𝑞𝑢𝑖𝑡𝑦
𝐷𝑒𝑏𝑡  𝑡𝑜  𝑒𝑞𝑢𝑖𝑡𝑦  𝑟𝑎𝑡𝑖𝑜 =
𝐶𝑢𝑟𝑟𝑒𝑛𝑡  𝑑𝑒𝑏𝑡 + 𝑁𝑜𝑛– 𝑐𝑢𝑟𝑟𝑒𝑛𝑡  𝑑𝑒𝑏𝑡
𝑆ℎ𝑎𝑟𝑒ℎ𝑜𝑙𝑑𝑒𝑟𝑠 𝑒𝑞𝑢𝑖𝑡𝑦
Sustainable growth ratios
𝐷𝑖𝑣𝑖𝑑𝑒𝑛𝑑  𝑝𝑎𝑦𝑜𝑢𝑡  𝑟𝑎𝑡𝑖𝑜 =
𝐶𝑎𝑠ℎ  𝑑𝑖𝑣𝑖𝑑𝑒𝑛𝑑𝑠  𝑝𝑎𝑖𝑑
𝑁𝑒𝑡  𝑝𝑟𝑜𝑓𝑖𝑡
𝑆𝑢𝑠𝑡𝑎𝑖𝑛𝑎𝑏𝑙𝑒  𝑔𝑟𝑜𝑤𝑡ℎ  𝑟𝑎𝑡𝑖𝑜 = 𝑅𝑂𝐸 × (1 − 𝐷𝑖𝑣𝑖𝑑𝑛𝑒𝑑  𝑝𝑎𝑦𝑜𝑢𝑡  𝑟𝑎𝑡𝑖𝑜)
𝐷𝑖𝑣𝑖𝑑𝑒𝑛𝑑  𝑐𝑜𝑣𝑒𝑟𝑎𝑔𝑒 =
𝐸𝑎𝑟𝑛𝑖𝑛𝑔  𝑝𝑒𝑟  𝑠ℎ𝑎𝑟𝑒
𝐷𝑖𝑣𝑖𝑑𝑒𝑛𝑑  𝑝𝑒𝑟  𝑠ℎ𝑎𝑟𝑒
43
Appendix 8:  5  Years'  forecasted  financial  statements  of  Greggs  (£’000)
5 Years'  Forecasting  Income  Statement  of  Greggs  (£’000)
Notes F2013 F2014 F2015 F2016 F2017
Revenue *1 767,555 805,932 854,288 905,546 959,878
Cost of sales *2 (299,346) (314,314) (333,172) (353,163) (374,353)
Gross Profit 468,208 491,619 521,116 552,383 585,526
Distribution and selling costs *3 (375,104) (394,907) (418,601) (443,717) (470,340)
Administrative expenses *4 (38,301) (39,007) (40,949) (44,140) (46,419)
Other income *5 0 0 0 0 0
Operating profit 54,803 57,705 61,566 64,525 68,766
Finance income *6 49 49 49 49 49
Profit before tax 54,852 57,754 61,615 64,574 68,815
Income tax *7 (13,165) (13,861) (14,788) (15,498) (16,516)
Net profit 41,688 43,893 46,827 49,076 52,300
Dividend *8 20861 22426 24108 25916 27860
Forecasted assumptions
Sales growth rate *1 4.50% 5.00% 6.00% 6.00% 6.00%
Cost of sales *2 -39.00% -39.00% -39.00% -39.00% -39.00%
Distribution and selling costs *3 -48.87% -49.00% -49.00% -49.00% -49.00%
Administration cost *4 -4.99% -4.84% -4.79% -4.87% -4.83%
Income tax *7 -24% -24% -24% -24% -24%
Dividend payout growth rate *8 7.50% 7.50% 7.50% 7.50% 7.50%
44
5  Years'  Partially  Forecasted  Balance  Sheet  of  Greggs  (£’000)
Inputs 2010 2011 2012 F2013 F2014 F2015 F2016 F2017
Sales 662,326 701,088 734,502 767,555 805,932 854,288 905,546 959,878
Operating working capital/sales ratio -6.55% -6.48% -4.74% -5.00% -5.50% -6.00% -6.50% -6.50%
PPE/store number 152 161 158 157 157 157 157 157
Store number 1487 1571 1671 1731 1791 1851 1911 1971
Outputs
Operating working capital -43,354 -45,454 -34,840 -38,378 -44,326 -51,257 -58,860 -62,392
PP&E 226,150 253,264 264,257 271,767 281,187 290,607 300,027 309,447
5 Years' Partially Forcasted cash  flow  statement  of  Greggs  (£’000)
F2013 F2014 F2015 F2016 F2017
Net profit 41,688 43,893 46,827 49,076 52,300
Less Finance income 49 49 49 49 49
NOPAT 41,639 43,844 46,778 49,027 52,251
Change in Working Capital (cash excluded) (3,538) (5,949) (6,931) (7,603) (3,532)
Change in non current assets (Depreciation adjusted) 7,510 9,420 9,420 9,420 9,420
Cash flow to Equity 37,716 40,421 44,338 47,260 46,411
45
Appendix 9: Words reconciliation
Total word count 9359
Less form reference list to end 2212
Less cover and contents 685
Less tables and figures 1514
Main body of text 4948

More Related Content

What's hot

21383838 financial-analysis-of-selected-textile-companies
21383838 financial-analysis-of-selected-textile-companies21383838 financial-analysis-of-selected-textile-companies
21383838 financial-analysis-of-selected-textile-companiesRamchundar Karuna
 
Edita Food Industries - Re-initiation of Coverage - August 2016
Edita Food Industries - Re-initiation of Coverage - August 2016Edita Food Industries - Re-initiation of Coverage - August 2016
Edita Food Industries - Re-initiation of Coverage - August 2016Omneya El Hammamy
 
LinkedIn. An overall analysis of the company.
LinkedIn. An overall analysis of the company.LinkedIn. An overall analysis of the company.
LinkedIn. An overall analysis of the company.MarcoBorsari
 
Corporate digital communication - CIM Level 07
Corporate digital communication - CIM Level 07Corporate digital communication - CIM Level 07
Corporate digital communication - CIM Level 07Dinesh Tharanga
 
Employee handbook -head_office
Employee handbook -head_officeEmployee handbook -head_office
Employee handbook -head_officeConfidential
 
Unit 9 entrepreneurship and small business management esbm assignment
Unit 9 entrepreneurship and small business management esbm assignmentUnit 9 entrepreneurship and small business management esbm assignment
Unit 9 entrepreneurship and small business management esbm assignmentTop-notch Research & Consultncy
 
Royal Dutch Shell_Group 1_Section D
Royal Dutch Shell_Group 1_Section DRoyal Dutch Shell_Group 1_Section D
Royal Dutch Shell_Group 1_Section DRakesh Choudhary
 
Strategic Management MBA AIB (2016)
Strategic Management MBA AIB (2016)Strategic Management MBA AIB (2016)
Strategic Management MBA AIB (2016)Dimithri Wellage
 
Coca Cola Company Strategic Management Project ( A Comprehensive Analysis on ...
Coca Cola Company Strategic Management Project ( A Comprehensive Analysis on ...Coca Cola Company Strategic Management Project ( A Comprehensive Analysis on ...
Coca Cola Company Strategic Management Project ( A Comprehensive Analysis on ...IBA - Institute of Business Administration
 
Strategic Analysis of Unilever
Strategic Analysis of UnileverStrategic Analysis of Unilever
Strategic Analysis of UnileverTouseef Ahmed
 
Ryder Systems, Inc. Case Study: Comprehensive Business Analysis and Review
Ryder Systems, Inc. Case Study: Comprehensive Business Analysis and Review Ryder Systems, Inc. Case Study: Comprehensive Business Analysis and Review
Ryder Systems, Inc. Case Study: Comprehensive Business Analysis and Review Jeff Shields
 
CIM assignment - Customer Experience on Keells Super (38456903)
CIM assignment - Customer Experience on Keells Super (38456903)CIM assignment - Customer Experience on Keells Super (38456903)
CIM assignment - Customer Experience on Keells Super (38456903)Dayenkie Chandrasekera
 
Project report on truck turnaround time
Project report on truck turnaround timeProject report on truck turnaround time
Project report on truck turnaround timePuspendu Pattanayek
 
National foods ltd.
National foods ltd.National foods ltd.
National foods ltd.Zain Shah
 
Lululemon Strategy Report
Lululemon Strategy ReportLululemon Strategy Report
Lululemon Strategy ReportAziz Ghani
 
Merger and Job Satisfaction
Merger and Job SatisfactionMerger and Job Satisfaction
Merger and Job SatisfactionUsama Raees
 
Dissertation effectiveness of employee engagement and employee motivation on...
Dissertation  effectiveness of employee engagement and employee motivation on...Dissertation  effectiveness of employee engagement and employee motivation on...
Dissertation effectiveness of employee engagement and employee motivation on...WritingHubUK
 
JLR Strategy Analysis
JLR Strategy AnalysisJLR Strategy Analysis
JLR Strategy AnalysisKaungPaing8
 

What's hot (20)

21383838 financial-analysis-of-selected-textile-companies
21383838 financial-analysis-of-selected-textile-companies21383838 financial-analysis-of-selected-textile-companies
21383838 financial-analysis-of-selected-textile-companies
 
Edita Food Industries - Re-initiation of Coverage - August 2016
Edita Food Industries - Re-initiation of Coverage - August 2016Edita Food Industries - Re-initiation of Coverage - August 2016
Edita Food Industries - Re-initiation of Coverage - August 2016
 
LinkedIn. An overall analysis of the company.
LinkedIn. An overall analysis of the company.LinkedIn. An overall analysis of the company.
LinkedIn. An overall analysis of the company.
 
Corporate digital communication - CIM Level 07
Corporate digital communication - CIM Level 07Corporate digital communication - CIM Level 07
Corporate digital communication - CIM Level 07
 
Employee handbook -head_office
Employee handbook -head_officeEmployee handbook -head_office
Employee handbook -head_office
 
Unit 9 entrepreneurship and small business management esbm assignment
Unit 9 entrepreneurship and small business management esbm assignmentUnit 9 entrepreneurship and small business management esbm assignment
Unit 9 entrepreneurship and small business management esbm assignment
 
Oxford Brookes ACCA RAP Thesis Topic-8, Writing and Mentoring Services
Oxford Brookes ACCA RAP Thesis Topic-8, Writing and Mentoring ServicesOxford Brookes ACCA RAP Thesis Topic-8, Writing and Mentoring Services
Oxford Brookes ACCA RAP Thesis Topic-8, Writing and Mentoring Services
 
Royal Dutch Shell_Group 1_Section D
Royal Dutch Shell_Group 1_Section DRoyal Dutch Shell_Group 1_Section D
Royal Dutch Shell_Group 1_Section D
 
Strategic Management MBA AIB (2016)
Strategic Management MBA AIB (2016)Strategic Management MBA AIB (2016)
Strategic Management MBA AIB (2016)
 
Coca Cola Company Strategic Management Project ( A Comprehensive Analysis on ...
Coca Cola Company Strategic Management Project ( A Comprehensive Analysis on ...Coca Cola Company Strategic Management Project ( A Comprehensive Analysis on ...
Coca Cola Company Strategic Management Project ( A Comprehensive Analysis on ...
 
Strategic Analysis of Unilever
Strategic Analysis of UnileverStrategic Analysis of Unilever
Strategic Analysis of Unilever
 
Ryder Systems, Inc. Case Study: Comprehensive Business Analysis and Review
Ryder Systems, Inc. Case Study: Comprehensive Business Analysis and Review Ryder Systems, Inc. Case Study: Comprehensive Business Analysis and Review
Ryder Systems, Inc. Case Study: Comprehensive Business Analysis and Review
 
CIM assignment - Customer Experience on Keells Super (38456903)
CIM assignment - Customer Experience on Keells Super (38456903)CIM assignment - Customer Experience on Keells Super (38456903)
CIM assignment - Customer Experience on Keells Super (38456903)
 
Project report on truck turnaround time
Project report on truck turnaround timeProject report on truck turnaround time
Project report on truck turnaround time
 
Full thesis
Full thesisFull thesis
Full thesis
 
National foods ltd.
National foods ltd.National foods ltd.
National foods ltd.
 
Lululemon Strategy Report
Lululemon Strategy ReportLululemon Strategy Report
Lululemon Strategy Report
 
Merger and Job Satisfaction
Merger and Job SatisfactionMerger and Job Satisfaction
Merger and Job Satisfaction
 
Dissertation effectiveness of employee engagement and employee motivation on...
Dissertation  effectiveness of employee engagement and employee motivation on...Dissertation  effectiveness of employee engagement and employee motivation on...
Dissertation effectiveness of employee engagement and employee motivation on...
 
JLR Strategy Analysis
JLR Strategy AnalysisJLR Strategy Analysis
JLR Strategy Analysis
 

Viewers also liked

Greggs Plc - Financial Analysis Review
Greggs Plc - Financial Analysis ReviewGreggs Plc - Financial Analysis Review
Greggs Plc - Financial Analysis ReviewReportLinker.com
 
Financial Planning in Uncertain Economic Times, Greggs
Financial Planning in Uncertain Economic Times, GreggsFinancial Planning in Uncertain Economic Times, Greggs
Financial Planning in Uncertain Economic Times, GreggsInnovation Enterprise
 
BigData Analytics for UK Retail Sector
BigData Analytics for UK Retail SectorBigData Analytics for UK Retail Sector
BigData Analytics for UK Retail SectorChun-Kai (Ken) Huang
 
Greggs Slideshow
Greggs SlideshowGreggs Slideshow
Greggs Slideshowkpm1919
 
International Business Strategy Plan for a new or an emerging Start Up
International Business Strategy Plan for a new or an emerging Start Up International Business Strategy Plan for a new or an emerging Start Up
International Business Strategy Plan for a new or an emerging Start Up Chandandeep Singh
 
Analysis of Northrop Grumman
Analysis of Northrop GrummanAnalysis of Northrop Grumman
Analysis of Northrop GrummanMichael Martinez
 
Porters 5 forces class presentation
Porters 5 forces class presentationPorters 5 forces class presentation
Porters 5 forces class presentationannesunita
 
Using digital marketing to target the youth market
Using digital marketing to target the youth marketUsing digital marketing to target the youth market
Using digital marketing to target the youth marketGavin Llewellyn
 
Porter’s 5 forces model case apple inc
Porter’s 5 forces model  case apple incPorter’s 5 forces model  case apple inc
Porter’s 5 forces model case apple incJonty Mohta
 
The 7P's of Marketing Mix - PPT
The 7P's of Marketing Mix - PPTThe 7P's of Marketing Mix - PPT
The 7P's of Marketing Mix - PPTMohit Pachauri
 
Situational analysis, Business strategy and BCG matrix
Situational analysis, Business strategy and BCG matrixSituational analysis, Business strategy and BCG matrix
Situational analysis, Business strategy and BCG matrixPinnakk Paul
 
Marketting mix ppt
Marketting mix pptMarketting mix ppt
Marketting mix pptabhishek2406
 

Viewers also liked (16)

Greggs Plc - Financial Analysis Review
Greggs Plc - Financial Analysis ReviewGreggs Plc - Financial Analysis Review
Greggs Plc - Financial Analysis Review
 
Financial Planning in Uncertain Economic Times, Greggs
Financial Planning in Uncertain Economic Times, GreggsFinancial Planning in Uncertain Economic Times, Greggs
Financial Planning in Uncertain Economic Times, Greggs
 
BigData Analytics for UK Retail Sector
BigData Analytics for UK Retail SectorBigData Analytics for UK Retail Sector
BigData Analytics for UK Retail Sector
 
Greggs Slideshow
Greggs SlideshowGreggs Slideshow
Greggs Slideshow
 
International Business Strategy Plan for a new or an emerging Start Up
International Business Strategy Plan for a new or an emerging Start Up International Business Strategy Plan for a new or an emerging Start Up
International Business Strategy Plan for a new or an emerging Start Up
 
Analysis of Northrop Grumman
Analysis of Northrop GrummanAnalysis of Northrop Grumman
Analysis of Northrop Grumman
 
Porters 5 forces class presentation
Porters 5 forces class presentationPorters 5 forces class presentation
Porters 5 forces class presentation
 
Using digital marketing to target the youth market
Using digital marketing to target the youth marketUsing digital marketing to target the youth market
Using digital marketing to target the youth market
 
Tesco
TescoTesco
Tesco
 
Porter’s 5 forces model case apple inc
Porter’s 5 forces model  case apple incPorter’s 5 forces model  case apple inc
Porter’s 5 forces model case apple inc
 
Marketing mix
Marketing mixMarketing mix
Marketing mix
 
The 7P's of Marketing Mix - PPT
The 7P's of Marketing Mix - PPTThe 7P's of Marketing Mix - PPT
The 7P's of Marketing Mix - PPT
 
Pepsi marketing mix
Pepsi marketing mixPepsi marketing mix
Pepsi marketing mix
 
Marketing Mix
Marketing MixMarketing Mix
Marketing Mix
 
Situational analysis, Business strategy and BCG matrix
Situational analysis, Business strategy and BCG matrixSituational analysis, Business strategy and BCG matrix
Situational analysis, Business strategy and BCG matrix
 
Marketting mix ppt
Marketting mix pptMarketting mix ppt
Marketting mix ppt
 

Similar to Greggs Financial Analysis

Link SDVOSB Past Performance Summaries
Link SDVOSB Past Performance SummariesLink SDVOSB Past Performance Summaries
Link SDVOSB Past Performance Summariesgasanden
 
Link SDVOSB Past Performance Summaries
Link SDVOSB Past Performance SummariesLink SDVOSB Past Performance Summaries
Link SDVOSB Past Performance Summariesgasanden
 
Link Resources Past Performance Summaries
Link Resources Past Performance SummariesLink Resources Past Performance Summaries
Link Resources Past Performance SummariesLink Resources
 
2011 GMC Light Duty Upfitter Wisconsin - General Information
2011 GMC Light Duty Upfitter Wisconsin - General Information2011 GMC Light Duty Upfitter Wisconsin - General Information
2011 GMC Light Duty Upfitter Wisconsin - General InformationZimbrick Buick/GMC West
 
Forecasting, Financing &amp; Fast Tracking Your Business Growth
Forecasting, Financing &amp; Fast Tracking Your Business GrowthForecasting, Financing &amp; Fast Tracking Your Business Growth
Forecasting, Financing &amp; Fast Tracking Your Business GrowthVenugopal Rao Pendyala
 
Mind the Gap Report Overview
Mind the Gap Report OverviewMind the Gap Report Overview
Mind the Gap Report Overviewpondo4life
 
1663789117187Operations Manual 2022 Draft.pdf
1663789117187Operations Manual 2022 Draft.pdf1663789117187Operations Manual 2022 Draft.pdf
1663789117187Operations Manual 2022 Draft.pdfAakashKhanal3
 
BOOK FOR RECORD KEEPING - latest
BOOK FOR RECORD KEEPING - latestBOOK FOR RECORD KEEPING - latest
BOOK FOR RECORD KEEPING - latestNamatai Moyo
 
Mwania
MwaniaMwania
Mwaniamwania
 
ingram micro Proxy Statement 2004
ingram micro  Proxy Statement 2004ingram micro  Proxy Statement 2004
ingram micro Proxy Statement 2004finance7
 
GNW%20Q308%20QFS
GNW%20Q308%20QFSGNW%20Q308%20QFS
GNW%20Q308%20QFSfinance24
 
GNW%20Q308%20QFS
GNW%20Q308%20QFSGNW%20Q308%20QFS
GNW%20Q308%20QFSfinance24
 
Principles-of-Financial-Accounting.pdf
Principles-of-Financial-Accounting.pdfPrinciples-of-Financial-Accounting.pdf
Principles-of-Financial-Accounting.pdfEdenAlemu3
 
CAPSTONE Final Business Plan
CAPSTONE Final Business Plan CAPSTONE Final Business Plan
CAPSTONE Final Business Plan Karianne Delgado
 
IPO process in Bangladesh and performance analysis
IPO process in Bangladesh and performance analysisIPO process in Bangladesh and performance analysis
IPO process in Bangladesh and performance analysisSumaiya Akter
 
Hermosa Beach - Cost Benefit Analysis 2014
Hermosa Beach - Cost Benefit Analysis 2014Hermosa Beach - Cost Benefit Analysis 2014
Hermosa Beach - Cost Benefit Analysis 2014StopHermosaBeachOil
 

Similar to Greggs Financial Analysis (20)

Link SDVOSB Past Performance Summaries
Link SDVOSB Past Performance SummariesLink SDVOSB Past Performance Summaries
Link SDVOSB Past Performance Summaries
 
Link SDVOSB Past Performance Summaries
Link SDVOSB Past Performance SummariesLink SDVOSB Past Performance Summaries
Link SDVOSB Past Performance Summaries
 
Link Resources Past Performance Summaries
Link Resources Past Performance SummariesLink Resources Past Performance Summaries
Link Resources Past Performance Summaries
 
Capital Market
Capital MarketCapital Market
Capital Market
 
2011 GMC Light Duty Upfitter Wisconsin - General Information
2011 GMC Light Duty Upfitter Wisconsin - General Information2011 GMC Light Duty Upfitter Wisconsin - General Information
2011 GMC Light Duty Upfitter Wisconsin - General Information
 
Business Plan
Business PlanBusiness Plan
Business Plan
 
Mirsal 2 manual BOE
Mirsal 2 manual BOEMirsal 2 manual BOE
Mirsal 2 manual BOE
 
Forecasting, Financing &amp; Fast Tracking Your Business Growth
Forecasting, Financing &amp; Fast Tracking Your Business GrowthForecasting, Financing &amp; Fast Tracking Your Business Growth
Forecasting, Financing &amp; Fast Tracking Your Business Growth
 
Mind the Gap Report Overview
Mind the Gap Report OverviewMind the Gap Report Overview
Mind the Gap Report Overview
 
1663789117187Operations Manual 2022 Draft.pdf
1663789117187Operations Manual 2022 Draft.pdf1663789117187Operations Manual 2022 Draft.pdf
1663789117187Operations Manual 2022 Draft.pdf
 
BOOK FOR RECORD KEEPING - latest
BOOK FOR RECORD KEEPING - latestBOOK FOR RECORD KEEPING - latest
BOOK FOR RECORD KEEPING - latest
 
Mwania
MwaniaMwania
Mwania
 
ingram micro Proxy Statement 2004
ingram micro  Proxy Statement 2004ingram micro  Proxy Statement 2004
ingram micro Proxy Statement 2004
 
Securities Market
Securities MarketSecurities Market
Securities Market
 
GNW%20Q308%20QFS
GNW%20Q308%20QFSGNW%20Q308%20QFS
GNW%20Q308%20QFS
 
GNW%20Q308%20QFS
GNW%20Q308%20QFSGNW%20Q308%20QFS
GNW%20Q308%20QFS
 
Principles-of-Financial-Accounting.pdf
Principles-of-Financial-Accounting.pdfPrinciples-of-Financial-Accounting.pdf
Principles-of-Financial-Accounting.pdf
 
CAPSTONE Final Business Plan
CAPSTONE Final Business Plan CAPSTONE Final Business Plan
CAPSTONE Final Business Plan
 
IPO process in Bangladesh and performance analysis
IPO process in Bangladesh and performance analysisIPO process in Bangladesh and performance analysis
IPO process in Bangladesh and performance analysis
 
Hermosa Beach - Cost Benefit Analysis 2014
Hermosa Beach - Cost Benefit Analysis 2014Hermosa Beach - Cost Benefit Analysis 2014
Hermosa Beach - Cost Benefit Analysis 2014
 

Greggs Financial Analysis

  • 1. 1 TABLE OF CONTNENT EXCUTIVE SUMMARY ......................................................................................................................................4 1. COMPANY OVERVIEW.................................................................................................................................5 1.1. COMPANY PROFILE................................................................................................................................................... 5 1.2. COMPANY HISTORY .................................................................................................................................................. 5 2. INDUSTRY OVERVIEW................................................................................................................................6 2.1.FIVE FORCES ANALYSIS.......................................................................................................................................... 6 2.1.1. Rivalry among existing firms: ........................................................................................................................7 2.1.2. Threat of new entrants:.....................................................................................................................................8 2.1.3. Threat of substitute products.........................................................................................................................8 2.1.4. Bargaining power of buyers............................................................................................................................8 2.1.5. Bargaining power of suppliers:.....................................................................................................................8 2.2. SUMMARY OF FIVE FORCES ANALYSIS .................................................................................................................... 9 3. STRATEGIC ANALYSIS.............................................................................................................................. 10 3.1. PRODUCT LEVEL......................................................................................................................................................10 3.2. BRAND LEVEL..........................................................................................................................................................10 3.3. OPERATION LEVEL..................................................................................................................................................10 3.4. SUMMARY OF STRATEGY ANALYSIS ......................................................................................................................11 4. RATIO ANALYSIS........................................................................................................................................12 4.1. OVERALL PROFITABILITY ......................................................................................................................................12 4.2. OPERATING MANAGEMENT ...................................................................................................................................14 4.2.1. Gross Profit margin & SG&A margin.........................................................................................................14 4.2.2. NOPAT margin & EBITDA margin..............................................................................................................15 4.2.3. Summary of Operating management.......................................................................................................15 4.3. INVESTMENT MANAGEMENT.................................................................................................................................15 4.3.1. Working capital management.....................................................................................................................16 4.3.2. Non-current assets management ...............................................................................................................17 4.3.3. Summary of Investment management.....................................................................................................17 4.4. FINANCIAL MANAGEMENT.....................................................................................................................................17 4.4.1. Current liabilities and short-term liquidity...........................................................................................18 4.4.2. Debt and long-term solvency........................................................................................................................19 4.4.3. Summary of Financial Management.........................................................................................................19 4.5. SUMMARY OF RATIO ANALYSIS.............................................................................................................................19 5. CASH FLOW ANALYSIS............................................................................................................................. 20 5.1. CASH FLOW STRUCTURE........................................................................................................................................20 5.2. INTERNAL CASH FLOW GENERATING ABILITY ....................................................................................................20 5.2.1. Future cash flow generating ability..........................................................................................................20 5.3. LIQUIDITY ................................................................................................................................................................21
  • 2. 2 5.4. DIVIDEND PAYOUT ABILITY...................................................................................................................................21 5.5. SUMMARY OF CASH FLOW ANALYSIS...................................................................................................................21 6. PROSPECTIVE ANALYSIS......................................................................................................................... 22 6.1. FORECASTING..........................................................................................................................................................22 6.2. VALUATION ..............................................................................................................................................................25 6.2.1. Residual income valuation.............................................................................................................................25 6.2.2. Price multiple valuation..................................................................................................................................27 7. RECOMMENDATION .................................................................................................................................28 7.1. INVESTMENT PRINCIPLE OF PENSION FUND .....................................................................................................28 7.2. CORPORATE RISK NATURE.....................................................................................................................................28 7.3. CORPORATE COMPETENCE ...................................................................................................................................29 7.4. FUTURE GROWTH POTENTIAL .............................................................................................................................29 7.5. DIVIDEND.................................................................................................................................................................29 7.6. VALUATION ..............................................................................................................................................................29 7.7. RECOMMENDATION................................................................................................................................................29 REFERENCE......................................................................................................................................................30 APPENDIX ........................................................................................................................................................ 32 Appendix 1: Standardized Income Statement of Greggs plc. 2008-2012  (£’1000)..........................32 Appendix 2: Vertical Common Sized Income Statement of Greggs plc 2008-2012..........................32 Appendix 3: Standardized Balance Sheet of Greggs plc. 2008-2012......................................................33 Appendix 4: Standardized Income Statement of Tesco plc. 2008-2012  (£’m)....................................35 Appendix 5: Vertical Common Sized Income Statement of Tesco plc 2008-2012.............................35 Appendix 5: Standardized Balance Sheet of Tesco plc. 2008-2012.........................................................36 Appendix 6: Ratio analysis of Greggs plc. and Tesco plc. 2008-2012 .....................................................39 Appendix 7: Ratio calculations.................................................................................................................................41 Appendix 8: 5 Years' forecasted financial statements  of  Greggs  (£’000)..............................................43 Appendix 9: Words reconciliation...........................................................................................................................45
  • 3. 3 LIST OF FIGURES FIGURE 1: FTSE 100 INDEX OF FOOD AND DRUG RETAILER SECTOR................................................................................................... 6 FIGURE 2: UK RETIAL EXPENDITURE GROWTH YEAR-ON-YEAR 2007-2012 (%)........................................................................... 7 FIGURE 3: RETURN ON EQUITY (ROE) FOR GREGGS AND TESCO, 2008-2012..............................................................................12 FIGURE 4: ADJUSTED RETURN ON EQUITY (ROE) FOR GREGGS AND TESCO, 2008-2012...........................................................13 FIGURE 5: NET PROFIT MARGIN FOR GREGGS AND TESCO, 2008-2012..........................................................................................14 FIGURE 6: ASSETS TURNOVER OF GREGGS AND TESCO, 2008-2012 ...............................................................................................16 FIGURE 7: FINANCIAL LEVERAGE OF GREGGS AND TESCO, 2008-2012 ..........................................................................................18 FIGURE 8: SHARE PRICE OF GREGGS PLC.................................................................................................................................................28 TABLE 1: HISTORY OF GREGGS PLC............................................................................................................................................................ 5 TABLE 2: RANK OF UK BAKERY COMPANIES BASED ON THEIR STORE NUMBER.................................................................................. 7 TABLE 3: FASTEST GROWERS IN UK CRAFT BAKERY ............................................................................................................................... 7 TABLE 4: DECOMPOSITION OF ROE FOR GREGGS, 2008-2012........................................................................................................13 TABLE 5: DECOMPOSITION OF ROE FOR TESCO, 2008-2012...........................................................................................................13 TABLE 6: GROSS PROFIT MARGIN AND SG&A EXPENSES MARGIN FOR GREGGS AND TESCO, 2008-2012.................................14 TABLE 7: EBITDA MARGIN AND NOPAT EXPENSES MARGIN FOR GREGGS AND TESCO, 2008-2012.......................................15 TABLE 8: WORKING CAPITAL MANAGEMENT OF GREGGS, 2008-2012............................................................................................16 TABLE 9: NON-CURRENT ASSETS MANAGEMENT RATIOS FOR GREGGS, 2008-2012.....................................................................17 TABLE 10: CURRENT LIABILITIES AND SHORT-TERM LIQUIDITY OF GREGGS, 2008-2012 ..........................................................18 TABLE 11: DEBT AND LONG-TERM SOLVENCY OF GREGGS, 2008-2012..........................................................................................19 TABLE 12: COMPOSITION OF GREGGS'S CASH FLOW, 2010-2012....................................................................................................20 TABLE 13: CHANGES OF OPERATING WORKING CAPITAL OF GREGGS DURING 2012.......................................................................20 TABLE 14: CASH FLOW GENERATING ABILITY, 2010-2012...............................................................................................................21 TABLE 15: OPERATING CASH FLOW RATIO OF GREGGS, 2010-2012................................................................................................21 TABLE 16: DIVIDEND SUSTAINABILITY OF GREGGS, 2010-2012......................................................................................................21 TABLE 17: FORECASTED SALES GROWTH FOR GREGGS, 2013-2017 ...............................................................................................22 TABLE 18: FORECASTED COST OF SALES FOR GREGGS, 2013-2017.................................................................................................22 TABLE 19: FORECASTED DISTRBUTION AND SELLING COST FOR GREGGS, 2013-2017 ................................................................22 TABLE 20: FORECASTED ADMINISTRATIVE FOR GREGGS, 2013-2017 ............................................................................................23 TABLE 21: FORECASTED OPERATING WORKING CAPITAL MARGIN FOR GREGGS, 2013-2017 .....................................................23 TABLE 22: FORECASTED FREE CASH FLOW TO EQUITY FOR GREGGS, 2013-2017.........................................................................24 TABLE 23: GROWTH SUSTAINABILITY OF GREGGS, 2010-2012 .......................................................................................................29
  • 4. 4 EXCUTIVE SUMMARY • Greggs is competing on a differentiation strategy • Integrated supply chain • Sound brand image • Wide ranged products with high quality • Easily accessed stores • New wholesaling and franchising marketCompetence Finance Risk People • • Opinion
  • 5. 5 1. COMPANY OVERVIEW 1.1. Company Profile Greggs plc is a UK-based bakery chain company founded and headquartered in Tyneside, Newcastle in  the  UK  in  1939,  and  has  expanded  into  a  dominant  player  in  UK’s  bakery  industry (Covell, 2005). It produces fresh bakery goods including a variety of sandwiches, savouries and pasties, and distributes these products to the market through take out service, retailing, franchising and wholesales (Greggs, 2013b). The company focuses on building a strong brand image of fresh and high quality food throughout its expansion, and meanwhile improving the overall efficiency of operational activity. Nowadays Greggs has 1671 shops throughout the UK and approximately 20,000 employees supported by ten regional bakeries, one savoury production unit and highly efficient self-owned distribution channels, selling products worth £735 million in the year 2012 (ibid.). It also launched a new project named  ‘Greggs Moment’  to  explore  the  market  in  coffee  shop format in 2011 (Chris, 2011). 1.2. Company History Greggs plc. started as a local bakery business in Tyneside founded by John Greggs in 1939, and began to expand to neighbour areas after his son, Ian Greggs took over. The company experienced significant growth in 1984, the year of Greggs’  Initial  Public  Offering,  and  1994,  the  year  of  acquiring  Allied   Bakeries Limited. The detailed history can be presented in a timeline table below. Table 1: History of Greggs plc. Year Event 1939 The business started as a small local bakery in Tyneside, England. 1964 Ian Greggs became the chairman of the business named Greggs. 1972 Greggs successfully expand its business outside England. 1984 Greggs hired Mike Darrington as a new managing director and launched its initial public offerings. 1994 Greggs acquired Allied Bakeries Limited, adding Bakers Oven to its brand. 2003 Greggs opened two new stores in Belgium. 2008 Share price dropped 25.38% during financial crisis. 2011 Greggs opened  ‘Greggs Moment’  shops. Source: International Directory of Company Histories, 2005.
  • 6. 6 2. INDUSTRY OVERVIEW According to FTSE (2012), Greggs is classified into food and drug retailer sector, which includes supermarket, chain stores and drug stores etc. The economic downturn and high unemployment rate has significantly hurt sales revenue and generated fierce price competition. Given the weak economy, the sector has a compound annual growth rate (CAGR) of 3.5% during previous years (Datamonitor, 2010), presenting a slight growth under economy downturn. However, for food industry, the extent of damage is relatively small because the demand of food and general goods is income-inelastic. Further evidence is shown in figure 1. The past performance of index and FTSE 100 of this sector illustrates that this sector’s share price has a mild fluctuation and highly correlates with whole market index. Figure 1: FTSE 100 index of food and drug retailer sector Source: Yahoo Finance As a bakery corporation, Greggs is listed in the London Stock Exchange and categorized as a food & drug retailer. The UK food & drug retailer sector is full of numerous companies with fierce competitions. While some large and lucrative companies expanded rapidly, others underperformed the market or even went to bankrupt. So this section will analyze Greggs’s  current  market  position using Porter’s  Five  Forces  Analysis.  To  provide  a  more  precise  analysis,  we  narrow  the  industry  analysis  to   bakery industry. 2.1.Five forces analysis Five Forces Analysis offers an effective way to analyze the competitive condition of an industry in terms of rivalry among existing firms, threat of new entrants, threat of substitutes, bargaining power of buyers and bargaining power of suppliers (Porter, 1979). These factors determine the capacity for a
  • 7. 7 firm to earn abnormal profits in its industry. 2.1.1. Rivalry among existing firms: There is a strong competition among existing firms, especially comes from the increasing pressure from craft bakeries and supermarkets. The figure 2 implicitly indicates a slowdown of market growth which might be explained by market saturation. To survive and remain competitive, it is critical for Greggs to attract and retain customers for further development. Figure 2: UK retial expenditure growth year-on-year 2007-2012 (%) Source: Verdict Research Within bakery industry, tables blew show that Greggs has expanded rapidly and soon dominated bakery market with the most stores, followed by Costa and Subway. However, competition has increasingly come from supermarkets such as Tesco and Sainsbury. With widely distributed stores and low priced bakery products, they have become major players in bakery industry. Therefore, it suggests higher pressure in traditional bakery firms and severer price competition (Palepu, Healy & Peek 2010). Table 2: Rank of UK bakery companies based on their store number Rank Company Store numbers in 2013 1 Greggs 1671 2 Costa 1552 3 Subway 1483 Source: British Baker Table 3: Fastest growers in UK craft bakery Rank Company Outlets in 2013 Year-on-year increase 1 Costa 1552 200 2 Greggs 1671 100 3.60% 3.85% 3.85% 3.35% 3.30% 3.30%3.60% -0.20% -4.30% 0.20% -0.80% -0.50% 3.60% 1.60% -0.40% 1.40% 1.10% 1.20% -5.00% -4.00% -3.00% -2.00% -1.00% 0.00% 1.00% 2.00% 3.00% 4.00% 5.00% 2007 2008 2009 2010 2011 2012 Food & grocery Non-food Total retail
  • 8. 8 3 Subway 1483 59 Source: British Baker 2.1.2. Threat of new entrants: Threat from new entrants is considered to be moderate from the following two aspects. Although the entry  barrier  of  bakery  industry  is  rather  low,  Greggs’s  economy  of  scale,  well  established  distribution   channel, and good relationship with suppliers made it difficult for the new entrants to obtain a certain market share. However, certain threat comes from existing food firms who are attracted by high profitability and likely to enter bakery  market.  Like  McDonald’s  established  McCafé,  other food firms, such as KFC, Pizza hot, have the potential to be new entrants. 2.1.3. Threat of substitute products Greggs faces high level of threat of substitute products. Affected by the globalization, consumers are willing to try new things and change their daily foods. For example, cheap and tasty Chinese, Japanese and Mexican foods are getting favored. Given the fact of low switching cost in the food industry, it is crucial for Greggs to take corresponding measures. 2.1.4. Bargaining power of buyers As   a   result   of   customers’   high   price   sensitivity   and   low switching costs, the bargaining power of buyers in bakery market is high. With an increasingly acute perception of price, customers spend less of the disposable income in recent years (Trading Economics, 2013). The situation is worsen by the economic downturn, which made customers more cautious about their shrinking disposable income. 2.1.5. Bargaining power of suppliers: The bargaining power of suppliers is relatively low. The major materials Greggs need are indifferent from individual households, and there are plenty of suppliers in the market. Additionally, the large volume of purchase by Greggs allows it to have a better bargaining position over their suppliers.
  • 10. 10 3. STRATEGIC ANALYSIS Greggs competes on the basis of differentiation by offering high-quality, fresh food at great value prices, and operating an integrated supply chain from production through distribution to point of sale. From customers’  perspective,  they  tend  to  be  highly  price  sensitive  and  prefer  conveniently  accessible   stores as well as take away and processed food. To assess if the strategy fulfill customers’ needs, the strategy will be analyzed in product level, brand level and operation level. 3.1. Product level Developing product ranges Greggs is continuously developing their product ranges. In addition to traditional bakeries, Greggs now provides breakfasts and low calories choices to meet the increasing needs for late breakfast and healthy living style (Greggs, 2012). 3.2. Brand level Building brand images As with promotion, Greggs spread its advertising channel into online website, which drove its promotion success. From service aspect, Greggs managed to build an image of comfortable environment along with good quality of product in Greggs Moment and Bakery Oven, focusing on pleasant customer experience (ibid.). Corporate Social Responsibility (CSR) Greggs has long-standing commitment to CSR and considers it as the core of business operation. Concerned about the safety and quality, Greggs has removed any artificial chemical additives from its products. In addition, Greggs is serving more than two million free breakfasts to disadvantaged primary school children each year (ibid.). 3.3. Operation level Expanding stores location Not only Greggs but also Subway and Costa are moving away from high streets. One reason is that costs for opening new stores in high streets are soaring. While another prior concern is that customers’   preferences have changed from city center to nearby stores. Hence, Greggs is making their shops more accessible and comfortable. Exploring new markets Greggs is now successfully working together with Iceland and Moto which succeeds in expanding its profits sources. A range of frozen products in Greggs branded cabinets are traded in Iceland stores (ibid.). Furthermore, Greggs Moment is aimed to derive shares from increasing coffee market and exploring the benefits from Greggs’  brand  image.  
  • 11. 11 Integrating supply chain Greggs’   supply   chain  is   vertical   integrated   as   both  a   baker  and   a   retailer,  from   production   through   distribution to point of sale. Setting distribution center in certain areas is one of the core expansion strategies. This ensures the efficiency of Greggs’  operation  and  an  effective  cost-saving scheme. 3.4. Summary of Strategy analysis
  • 12. 12 4. RATIO ANALYSIS Why Tesco Greggs mainly has two types of major competitors: bakery and coffee (Costa, Subway, Starbucks) and chain stores (Tesco,   Sainsbury’s).   It   is   complicated   to   choose   an   ideally   comparable   firm   as   a   benchmark for financial analysis purpose. Costa and Subway, same as other craft bakeries, are essentially comparable to Greggs in a number of ways. However, they are all private companies which renders the detailed financial analysis impossible because of insufficient information disclosures. As with Starbucks, they are US-based public companies with international operations while Greggs are solely operating in UK, which makes ratio comparison irrelevant because Starbucks’ statistics indicates its global performance while Greggs’ only represents UK’s performance. Therefore, we choose a UK-based retailer Tesco as our benchmark for financial analysis which can be justified on the ground that Tesco is a market leader in food & drug retailers sector in UK and its bakery and other food  products  present  major  pressure  on  Greggs’  products, especially easily accessed Tesco Express. Nonetheless, to achieve an objective comparison, variations in specific business models are taken into considerations in the analysis below. As a fundamental work for further probing, forecasting and evaluating, ratio analysis will be conducted in four main aspects: overall profitability, operating management, investment management and financial management (Palepu et al, 2010). In each of these dimensions, ratios of previous years and among peer groups will be compared. Although ratio analysis may not reach a final decision, it does give us a brief understanding of Greggs in numerical form and may assist the final investment choice. 4.1. Overall profitability Widely used by investors, return on equity  (ROE)  ratio  indicates  a  firm’s  profitability  by  measuring   how much profit a firm can generate with the  funds  invested  by  the  firm’s  shareholders.  The  higher   ratio  means  more  efficient  the  firm’s  management  is  and  the  better  profit  generating  ability.  In  general,   ROE between 15% and 20% are considered desirable for most industries. As Figure 3 shows it is reasonable to state that Greggs in general maintains an acceptable level of ROE through the five years with an average of 21.17%, which above the benchmark company Tesco. Figure 3: Return on equity (ROE) for Greggs and Tesco, 2008-2012 23.05% 20.93% 21.53% 22.43% 17.89% 17.94% 16.57% 15.91% 16.07% 15.81% 0.00% 5.00% 10.00% 15.00% 20.00% 25.00% 2008 2009 2010 2011 2012 Greggs Tesco
  • 13. 13 Both  of  the  two  firms’  ROE  declined  in  2008.  This  might  be  the  result  of  the  financial  crisis  in  2008.   Greggs seemed to be better than Tesco in dealing with the economic downturn and its ROE recovered soon in 2010. However, an abnormal drop occurred in 2012 with sharp decrease from 22.43% to 17.89%. Further analysis from the annual report of Greggs shows that the ROE in 2011 was not fully contributed by operating activities, it contained the income and expenses come from the revaluation of pension. If excluded, the adjusted ROE in 2011 would be 19.66%. As Figure 4 displays, adjusted ROE of Greggs showed a steady down turn since 2010 while that of Tesco remained at a stable level with mild fluctuations. Figure 4: Adjusted return on equity (ROE) for Greggs and Tesco, 2008-2012 While Tesco was appreciated with stable performance and profitability, Greggs gained advantage over the magnitude of ROE throughout the five years. By decomposing the ROE into net profit margin, asset turnover and financial leverage as displayed in table 4 and 5, we find that the higher ROE of Greggs was mainly driven by the superior net profit margin and asset turnover, which meant Greggs was more capable to retain profit from sales and more efficient in utilizing asset base. Although Tesco benefited from aggressive financial management, a strong ROE is certainly a solid signal that Greggs has better profitability. Table 4: Decomposition of ROE for Greggs, 2008-2012 2011 is after adjustment 2012 2011* 2010 2009 2008 Net profit margin 5.52% 5.56% 5.73% 5.22% 5.43% *Asset turnover 2.24 2.27 2.33 2.36 2.51 =ROA 12.35% 12.63% 13.33% 12.30% 13.61% *Financial leverage 1.45 1.56 1.61 1.70 1.69 =ROE 17.89% 19.66% 21.53% 20.93% 23.05% Table 5: Decomposition of ROE for Tesco, 2008-2012 2012 2011 2010 2009 2008 Net profit margin 4.33% 4.38% 4.10% 3.97% 4.50% *Asset turnover 1.28 1.29 1.24 1.18 1.57 =ROA 5.54% 5.66% 5.08% 4.69% 7.06% *Financial leverage 2.85 2.84 3.13 3.53 2.54 ROE 15.81% 16.07% 15.91% 16.57% 17.94% 23.05% 20.93% 21.53% 19.66% 17.89% 17.94% 16.57% 15.91% 16.07% 15.81% 0.00% 5.00% 10.00% 15.00% 20.00% 25.00% 2008 2009 2010 2011 2012 Greggs Tesco
  • 14. 14 The following sections will mainly focus on the decomposition of ROE in terms of operating management, investment management and financial management. 4.2. Operating management Given the net operating profit margin (Figure 5), further decomposition allows analyst to assess operating management effectiveness of firms (Palepu et al, 2010). Widely used as an analytical tool, the common sized income statement (Appendix 2) displays all items as a percentage of sales revenue, which makes it possible to compare those margins of a firm over time and with peer firms. Several ratios allow us to investigate why these two firms have distinct net profit margin related to operating management. Figure 5: Net profit margin for Greggs and Tesco, 2008-2012 4.2.1. Gross Profit margin & SG&A margin The gross profit  margin  is  an  indication  of  a  firm’s  financial  health  by  revealing  the  proportion  of   money left after accounting for the cost of goods sold (ibid.). Table 6 shows that both the gross profit margin and SG&A margin of Greggs were much higher than that of Tesco. Greggs, a baking firm, has relatively low cost of goods mainly generated by raw materials, while Tesco, a supermarket, directly purchases and sells finished products to customers. As with SG&A margin, Greggs has been undertaking expansion strategy in recent several years, which certainly generated a large amount of SG&A expenses. For instance, it opened increase 100 new  bakeries  in  2012  and  established  ‘Greggs The  Moment’   (Greggs, 2012). Despite this, Greggs continuously reduced its SG&A expenses by a total of £10 million over last three years and targeted to cut another £5 million down in next 2 years (ibid.) Tesco usually shared SG&A expenses with suppliers. Therefore, the big gap of two margins should not be surprising and problematic. Table 6: Gross profit margin and SG&A expenses margin for Greggs and Tesco, 2008-2012 2012 2011 2010 2009 2008 Gross profit margin Greggs 61.10% 61.09% 61.85% 61.67% 61.76% Tesco 7.94% 8.30% 8.10% 7.76% 7.67% SG&A expenses margin Greggs 53.84% 53.85% 53.95% 54.31% 55.30% Tesco 2.58% 2.75% 2.68% 2.32% 2.17% 5.43% 5.22% 5.73% 5.56% 5.52% 4.50% 3.97% 4.10% 4.38% 4.33% 0.00% 1.00% 2.00% 3.00% 4.00% 5.00% 6.00% 7.00% 2008 2009 2010 2011 2012 Greggs Tesco
  • 15. 15 4.2.2. NOPAT margin & EBITDA margin By netting out cost effects, NOPAT margin and EBITDA margin   can   reflect   a   firm’s   operating   performance. From Table7 we see that Greggs’s   NOPAT   margin   and   EBITDA   margin   worsened   between 2011 and 2012 in the presence of declined customer footfalls and like-for-like sales mentioned previously, but still higher than TESCO. The bigger difference between EBITDA margins compared with NOPAT margins indicates that the noncash operating expense of Greggs has more significant impact on operating income, which may also reflects to some extent the expansion strategy that requires more non-current assets. Given the similar NOPAT margins, Greggs has advantage over the net profit margin. Therefore, although Greggs has suffered declining profit in recent years, we still have strong ground to expect its operating performance will be improved in the foreseeable future. Table 7: EBITDA margin and NOPAT expenses margin for Greggs and Tesco, 2008-2012 2012 2011 2010 2009 2008 EBITDA margin Greggs 11.75% 13.02% 12.30% 11.51% 11.88% Tesco 8.24% 8.59% 8.51% 8.09% 8.00% NOPAT margin Greggs 5.52% 6.34% 5.71% 5.19% 5.33% Tesco 4.61% 4.80% 4.51% 4.46% 4.60% 4.2.3. Summary of Operating management 4.2. Operating management:  4.2.1. Gross Profit margin & SG&A margin  4.2.2. NOPAT margin & EBITDA margin  4.3. Investment management Asset turnover is a fundamental factor composing a company return equity. It is of great importance in assessing Greggs’   performance   since   Greggs is a retail chain giant that requires huge amount of operating capital and non-current asset investment. As Figure 6 indicates, asset turnover of Greggs was almost doubling to that of Tesco, which contributes a sound profit generating ability of Greggs. Yet, following an obvious drop in 2009 because of the effect of financial crisis, the asset turnover of Greggs fell  slightly  every  year.  By  contrast,  Tesco’s  asset  turnover  rebounded  in  2010  and  remained  on   a constant level ever since. Unfavorable sales data due to intense consumer spending budget and declining footfalls may explain the upsetting trend of asset turnover in Greggs to some extent. However, the fact that its major competitor Tesco has a steady asset turnover could not be ignored. This brings up the necessity to dig more of Greggs’s investment management performance by analyzing working capital management and non-current assets management separately.
  • 16. 16 Figure 6: Assets turnover of Greggs and Tesco, 2008-2012 4.3.1. Working capital management Effective working capital management ability is essential for a firm to maintain sufficient amount of cash meeting its short-term debt obligations and operating expense. Operating working capital turnover   is   an   effective   indicator   of   a   firm’s   ability   in   such   area.   As   a leading firm in food retail industry, Greggs holds a negative operating working capital since its products can be sold quickly even before the cost of materials are paid (Table 8). Low level of operating working capital turnover shows Greggs’s   managerial efficiency. The turnover is lowed on a yearly base and reached an abnormal low level of -21.08 in 2012. Detailed analysis of such phenomenon will be given by assessing the trade receivables, inventories and trade payables separately. Table 8: Working capital management of Greggs, 2008-2012 2012 2011 2010 2009 2008 Operating working capital turnover -21.08 -15.42 -15.28 -13.61 -16.07 Trade receivables turnover 27.29 33.12 29.69 31.04 27.68 Inventories turnover 16.18 19.11 21.26 21.23 19.77 Trade payables turnover 3.97 3.67 3.6 3.52 3.83 4.3.1.1. Trade receivables turnover Trade receivables turnover is calculated by dividing sales by trade receivables. The higher the rate, the better  it  shows  a  firm’s  ability to generate liquid revenue. Greggs enjoyed a decline in 2012 but it was not crucial since the turnover rate of the firm fluctuated every year on a regular base, which might be a result of different liability due date. 4.3.1.2. Inventories turnover Inventories turnover derived from cost of sales over inventories. Low turnover rate indicates bad performance because of excess inventory reserve. The rate of Greggs declined steadily in the past years and enjoyed a sharp downturn in 2012. This may partly be blamed to the bad weather as Greggs 2.51 2.36 2.33 2.27 2.24 1.57 1.18 1.24 1.29 1.28 0 0.5 1 1.5 2 2.5 3 2008 2009 2010 2011 2012 Greggs Tesco
  • 17. 17 claims (Greggs, 2012), but it also indicates Greggs’s   weakness   in   optimizing   its   supply   chain   management. 4.3.1.3. Trade payables turnover Trade payables turnover is calculated by dividing cost of sales by trade payables. The higher the rate, the better it indicates a company’s  ability  to  finance  itself  by purchasing on credit. The turnover of Greggs reached the peak of 3.97 representing a positive sign. This may partly due to the increased purchasing base as a result of its expansion plan. Yet, potential risks exist if the company continues to rely on huge amount of trade credits. 4.3.2. Non-current assets management The ability to utilize non-current   assets   is   of   major   concern   when   assessing   a   firm’s   investment   management performance. Though the Net non-current asset turnover of Greggs is generally higher than that of Tesco, the rate of Greggs fell since 2009 and remained at a low level. Property, plant, and equipment (PP&E) are major components of non-current assets. Further analysis of PP&E turnover indicates a similar trend. This could be roughly explained by Greggs’s  bold  expansion  plan,  with  100   new shops opened in 2012 and huge amount of capital investment in savory manufacturing plant. Therefore, although the ratios indicate an unfavorable performance of Greggs, the situation may be improved if the investment in non-current asset ceases and begins to generate profit in the future. Table 9: Non-current assets management ratios for Greggs, 2008-2012 2012 2011 2010 2009 2008 Net non-current assets turnover 2.92 3 3.2 3.51 3.23 PP&E turnover 2.78 2.77 2.93 3.12 2.98 4.3.3. Summary of Investment management 4.3. Investment management:  Asset turnover  4.3.1 Working capital management: Operating working capital turnover  4.3.1.1 Trade receivables turnover  4.3.1.2 Inventories turnover  4.3.1.3 Trade payables turnover  4.3.2 Non-current assets management: Non-current asset turnover  PP&E turnover  4.4. Financial management Financial  leverage  measures  a  firm’s  total  debt  to  equity  ratio.  High  financial  leverage  can  benefit  firm   by increasing its profit-generating base apart from equity. However, high leverage may also imply
  • 18. 18 high risk. Although not held as a general concept, the optimal level of financing structure can be achieved when cost of liabilities equals cost of equity. In Greggs’s   case,   the   financial   leverage   is   almost  50%  lower  than  that  of  Tesco’s  and  reduced  gradually (Figure 7). This reflects Greggs has a rather lowly leveraged structure and a potential to an even lower level. Figure 7: Financial leverage of Greggs and Tesco, 2008-2012 4.4.1. Current liabilities and short-term liquidity As retail firms, both Greggs and Tesco capture the industry’s  characteristic  of  high  turnover  rates  and   thus have high short term liabilities. Greggs has overall smaller percentage of short-term liabilities as compared to Tesco, but its liquidity risk tends to increase as explained in the following sections. Table 10: Current liabilities and short-term liquidity of Greggs, 2008-2012 2012 2011 2010 2009 2008 Current ratio 80.53% 68.54% 74.77% 83.13% 53.13% Quick ratio 58.30% 50.90% 59.45% 68.54% 36.69% Cash ratio 24.40% 24.73% 30.68% 42.50% 6.00% 4.4.1.1. Current ratio The current ratio of Greggs is in general below one, which may indicate high risk, but as explained above, Greggs as a food retailed can afford such kind of risk. In fact, its upward rising trend may further its liquid credit. 4.4.1.2. Quick ratio By excluding inventory in calculation, rising quick ratio of Greggs further proves its effort in improving the ability to afford short-term debt. 4.4.1.3. Cash ratio Cash ratio uses only cash and marketable securities as numerator. Decreasing level of cash ratio compared to quick ratio used above implies Greggs has increasing amount of trade receivables and 1.69 1.7 1.61 1.56 1.45 2.54 3.53 3.13 2.84 2.85 0 0.5 1 1.5 2 2.5 3 3.5 4 2008 2009 2010 2011 2012 Greggs Tesco
  • 19. 19 potential risk if the trade receivables cannot be cashed. 4.4.2. Debt and long-term solvency The choice of debt  financing  also  influences  a  firm’s  financial  leverage.  Low  and  decreasing  liabilities   to equity ratio indicates Greggs is not favoring liabilities and thereby has low long-term solvency problem. It is critical to mention that Greggs carries a distinct feature, as compared to Tesco, that it has no  debt.  And  thereby  its  debt  to  equity  ratio  is  amounted  to  zero.  Although  it  is  firm’s  own  choice  to   raise  debt  or  not,  and  firm’s  without  debt  such  as  Apple  can  also  perform  well,  it  is  held  that  generally   certain amount of debt is beneficial. Additionally, given the fact that Greggs is in a growing phase requiring  huge  amount  of  investment,  certain  cheaper  debt  financing  can  ease  the  company’s  cash  flow   problem. Table 11: Debt and long-term solvency of Greggs, 2008-2012 2012 2011 2010 2009 2008 Liabilities to equity ratio 44.78% 55.76% 61.48% 70.15% 69.27% Debt to equity ratio 0 0 0 0 0 4.4.3. Summary of Financial Management 4.4. Financial management  4.4.1 current liabilities and short-term liquidity 4.4.1.1 Current ratio  4.4.1.2 Quick ratio  4.4.1.3 Cash ratio  4.4.2 Debt and long-term solvency Liabilities to equity ratio  Debt to equity ratio  4.5. Summary of Ratio Analysis 4.2. Operating management:  4.3. Investment management:  4.4. Financial management  Overall performance 
  • 20. 20 5. CASH FLOW ANALYSIS While ratio analysis emphases on income statement and balance sheet of Greggs, cash flow analysis gives investors better understandings of Greggs’s investing, operating and financing performance and policies. 5.1. Cash flow structure Table 12 illustrates the composition of Greggs’   cash   inflow   and   outflow.   During   past   3 years, its operating activity provided dominant cash inflow while most cash outflow was related to investment activities, indicating that Greggs is undertaking vast long-term investment through internal financing. Table 12: Composition of Greggs's cash flow, 2010-2012 Cash inflow 2012 2011 2010 Operating activity 70,013,000 88,112,000 77,826,000 Investing activity 5,112,000 3,339,000 973,000 Financing activity 3,624,000 3,266,000 783,000 Cash outflow Operating activity -13,435,000 -14,334,000 -15,814,000 Investing activity -46,035,000 -62,882,000 -47,672,000 Financing activity -19,406,000 -18,843,000 -29,925,000 5.2. Internal cash flow generating ability Benefited from its growing revenue and industry-leading turnover, Greggs keeps a strong cash flow from operating activity. However, compared to 2011, cash flow from operation declined shapely from £73,778,000 to £56,578,000 during 2012, which is mainly attributed to undervaluation of pension amounted to £9,665,000 (Greggs, 2011) and an increase of operating working capital by £10,614,000. The significant increase of operating working capital was mainly resulted from the unexpected bad weather and the economy depression, which was reflected in below table. Table 13: Changes of operating working capital of Greggs during 2012 2012 2011 Changes Trade Receivables 26,917,000 21,165,000 5,752,000 Inventories 17,658,000 14,274,000 3,384,000 Trade Payables 71,955,000 74,304,000 2,349,000 5.2.1. Future cash flow generating ability The steady trade payable/ sales ratio and close cooperation with business partners allow Greggs to realize sales in cash while credit its purchase of raw material. Besides, the industry-leading asset turnover and newly opened stores ensure Greggs to continue operation activities and pay off accounts payable. Hence, it is reasonable to believe that Greggs would have strong cash position in future.
  • 21. 21 Table 14: Cash flow generating ability, 2010-2012 2012 2011 2010 Net non-current assets turnover 2.92 3.00 3.20 Trade payable/sales ratio 9.80% 10.60% 10.61% 5.3. Liquidity Since Greggs has no debt or any interest bearing liability, there is no long-term liquidity risk or financial distress. In short-term, given that the operating cash flow ratios in table 14 are all less than 1, Greggs’s  operating cash flow is insufficient to cover short-term payment, which suggests a potential short-term liquidity risk if the sales and turnover stagnates. Table 15: Operating cash flow ratio of Greggs, 2010-2012 2012 2011 2010 Operating cash flow ratio 0.71 0.91 0.80 5.4. Dividend payout ability As an important indicator for pension fund, the dividend coverage ratio measures whether a company's operating cash flows are sufficient to meet dividends. In practice, investors usually can enjoy a solid dividend income to support post-employment life if the dividend coverage ratio is above 2 or 3. From table 16, Greggs has sound dividend payments during past years with dividend coverage ratios all above 3. Additionally, the growing dividend per share also indicates a progressive dividend policy of Greggs, which exactly meets our investment requirement. Table 16: Dividend sustainability of Greggs, 2010-2012 2012 2011 2010 Dividend coverage ratio 2.92 4.03 3.63 Dividend per share 19.5pence 19.3pence 18.2pence 5.5. Summary of Cash Flow Analysis 5.1. Cash flow structure  5.2. Internal cash flow generating ability  5.3. Liquidity  5.4. Dividend payout ability 
  • 22. 22 6. PROSPECTIVE ANALYSIS Prospective analysis is forward-looking process consisting of forecasting and valuation (Plepu, Healy & Peek, 2010). Below we summarize the steps to forecast important items related with income statement,balance sheet, and cash flows, following by detailed valuation. 6.1. Forecasting Sales growth While like-for-like sale was 4% lower in the first 11 weeks of 2013, total sales grew by 4.2%, primarily due to the good performance of newly opened wholesale business. Considering the emerging business and challenging background, sales in 2013 is assumed to increase by 4.5%. Overall, the projection in table 17 shows a moderate improvement in growth of sales revenue during 2013 to 2015, when economy recovers. Thereafter, it is reasonable to assume that growth rate of sales will keep constant at 6% which is the average growth rate in Europe. Table 17: Forecasted sales growth for Greggs, 2013-2017 F2013 F2014 F2015 F2016 F2017 Sales growth rate 4.50% 5.00% 6.00% 6.00% 6.00% Cost of sales The percentage of cost of sales to revenue was stable in a range from 38.15% to 38.91% in the common size income statement. However, the latest financial report of Greggs indicates that the gross margin will decline owing to the high commodity inflation and low margin of wholesaling business. Thus, table 18 predicts that the cost of sales will increase to 39% and keep constant in the following years. Table 18: Forecasted cost of sales for Greggs, 2013-2017 F2013 F2014 F2015 F2016 F2017 Cost of sales -39.00% -39.00% -39.00% -39.00% -39.00% Distribution and selling cost The historical percentage of distribution and selling cost to revenue was stable in a range from 48.50% to 49.29% in the common-sized income statement. However, because Greggs regards quality logistics as its competitive advantage to provide fresh products, distribution and selling cost is believed to slightly increase to 49% of revenue and remain constant (Table 19). Table 19: Forecasted distribution and selling cost for Greggs, 2013-2017 F2013 F2014 F2015 F2016 F2017 Distribution and selling costs -48.87% -49.00% -49.00% -49.00% -49.00%
  • 23. 23 Administrative expenses Benefited from efficiency of supply chain, Greggs continuously reduced its administrative expenses during the past 5 years. Administrative cost is estimated in table 20 as percentage of administrative cost to revenue using three years moving average. Table 20: Forecasted administrative for Greggs, 2013-2017 F2013 F2014 F2015 F2016 F2017 Administration cost -4.99% -4.84% -4.79% -4.87% -4.83% Other income Other income is caused by closure of bakery. It is assumed that there will be no closure of bakery in the future 5 years. So other income will be 0. Finance income Finance income is caused by bank balance and foreign exchange gains. This small figure is negligible, so it is assumed to be constant at £49,000 after 2012. Tax rate The corporate effective tax rate was 24% in 2012 and is assumed to remain unchanged. Working capital margin While working capital margin is stable before 2012, it increased significantly to 4.7% in 2012, leading to a sharp decline of operating cash flow. Despite this, Greggs is capable to increase trade payables and reduce trade receivables because of the admired reputation and strong bargaining power. Therefore, Greggs’s  working  capital  margin  is  considered  to  gradually  revert  to  the  mean  ratio  of  6.5%,   which is shown in table 21. Table 21: Forecasted operating working capital margin for Greggs, 2013-2017 F2013 F2014 F2015 F2016 F2017 Operating working capital margin -5.00% -5.50% -6.00% -6.50% -6.50% Property, plant and equipment (PPE) PPE of Greggs is directly related to number of stores. The PPE per store of past five years is averaged at£157,000/store which will be used for future PPE forecasting. The latest financial report suggests that Greggs will open about 60 stores annually. Hence, the PPE of Greggs is forecasted as the product of the averaged PPE per store and number of stores (see details in Appendix 8). Debt As Greggs is an all equity-financed company, Greggs will not raise debt as before.
  • 24. 24 Cash flow forecasts Once income statement and balance sheet are forecasted, we can derive free cash flow to equity by adjusting from operating activity and investing activity. Details are shown in Table 22. Table 22: Forecasted free cash flow to equity for Greggs, 2013-2017 F2013 F2014 F2015 F2016 F2017 Net profit 41,688 43,893 46,827 49,076 52,300 Less Change in Working Capital (cash excluded) 3,538 5,949 6,931 7,603 3,532 Add Depreciation 33 33 33 33 33 Less Change in non-current assets (investment activity) (7,510) (9,420) (9,420) (9,420) (9,420) Cash flow to Equity 37,749 40,454 44,371 47,293 46,444
  • 27. 27 6.2.2. Price multiple valuation P/E ratio is a simplified indicator of a company’s value. It is defined as market price per share divided by annual earnings per share. Generally speaking, companies with P/E higher than 17 are overvalued and those with P/E lower than 10 are undervalued. However, P/E of different industries may vary due to different natures. Companies within the same industry generally hold similar P/E unless abnormal operating failure occurs or high future growth is expected. The average P/E of Food and Drug retailer sector is 11.17. Greggs has a close ratio amounted to 11.91. This indicates that Greggs’s   stock   price is fairly valued compared to its peers. However, as Greggs has been expanding and investing substantially, it is reasonable to expect that the P/E ratio of Greggs has a high possibility to grow in the future. In other words, Greggs is to some extent undervalued, which confirms the forecast by residual income model.
  • 28. 28 7. RECOMMENDATION In the last part, we would give investment recommendation for pension fund managers according to previous analysis. 7.1. Investment Principle of Pension Fund Pension fund is an assets pool which aims to generate stable growth over the long term, and provide pensions for investors to support their post-employment life. Because investors would lose their major income from working after retirement, they cannot bear much loss from investment. Hence, fund managers must be prudential when making investment decisions, here, we recommend to invest in firms with low risk and relatively stable returns, especially firms with stable value and large capitalization. 7.2. Corporate risk nature With respect to business nature, compared with other industry, demand of food is relatively income-inelastic, thus, the continuing economic depression would not greatly harm Greggs’   ongoing operation. As with share price performance, Greggs’   share   price was very stable during these years compared with the market index, with β=0.53, its share price has ranged from 400 pence to 550 pence since 2010 and kept a growing trend. The trend line also reconciles with the previous valuation result, indicating the undervalued share price. Furthermore, the no-debt capital structure results in no bankruptcy risk of Greggs. Figure 8: Share price of Greggs plc. Source: Yahoo finance
  • 29. 29 7.3. Corporate Competence Though the five forces analysis indicates that Greggs is facing fierce competition in bakery market, it adopts differentiation strategy to be specialized in bakery making, offering high quality fresh products. From the previous financial analysis, it can be concluded that Greggs has competitive advantage in its differentiation strategy. Greggs has sound brand, profitable products, industry leading turnover and excellent working capital management (negative operating working capital), contributing to its growing revenue and strong cash flow generation when competing with competitors. 7.4. Future Growth Potential Firstly, the expanding wholesaling and franchising business strongly supported Greggs revenue growth during past years, and will account for more and more weight of Greggs’   income in future years. Secondly, Greggs plans to open about 60 new stores and refurbish over 100 stores in future, presenting potential growth opportunity in bakery retail business. 7.5. Dividend Pension fund values dividend income more than short-term capital gain and Greggs claims a progressive dividend policy, with an average 7.5% increase per year. As table 23 shows, sufficient dividend coverage ratio and increasing dividend payment guarantees the dividend payout will continue in future. Table 23: Growth sustainability of Greggs, 2010-2012 2012 2011 2010 Dividend payout ratio 0.48 0.41 0.45 Dividend per share 19.5pence 19.3pence 18.2pence Divided coverage ratio 2.90 4.00 3.60 7.6. Valuation The result of valuation part illustrates that Greggs’  share  price is underpriced in market and the share price may eventually increase to reflect its true value. 7.7. Recommendation Though the fact that Greggs is small cap company which may not fit our investment purpose, with low risk, stable growth and progressive dividend payout, combined with the undervalued share price, Greggs shows upward growth prospective. Thus, we recommend to BUY and HOLD Greggs shares.
  • 30. 30 REFERENCE British Baker (2013) BB 75 2013 report [Online] Available at <http://www.bakeryinfo.co.uk/news/categoryfront.php/id/286/BB75_2013.html> [8th April 2013] Chris, T. (2011) Greggs picks its moment to take on Starbucks. [Online] Available at <http://www.ft.com/cms/s/0/64ae9dba-f26f-11e0-931e-00144feab49a.html#axzz2RAue9 18o> [7th April 2013] CountryEconomy (2013) UK Bonds - 10 Years [Online] Retrieved at < http://countryeconomy.com/bonds/uk?dr=2013-01> [12th April 2013] Covell,  J.  (2005)  “Greggs  PLC”  International Directory of Company Histories 2005 [Online] Available from < http://www.encyclopedia.com/doc/1G2-3429200053.html > [7th April 2013] Datamonitor (2010), Food Retail in the United Kingdom, [online] Available at: <http://www.docin.com/p-338524950.html> [1st April 2013] Financial Times (2013) Greggs PLC, GRG:LSE performance, [Online] Available at <http://markets.ft.com/research/Markets/Tearsheets/Summary?s=GRG:LSE> [1st April 2013] Greggs plc (2008) Annual Reports and Accounts 2008 [Online] Available at < http://corporate.greggs.co.uk/assets/Uploads/2008-Annual-Report.pdf> [25th March, 2013] Greggs plc (2009) Annual Reports and Accounts 2009 [0nline] Available at < http://corporate.greggs.co.uk/assets/Financial-Results/GREGGS%20ANNUAL%20REP ORT_2010.pdf> [25th March, 2013] Greggs plc (2011) Annual Reports and Accounts 2010 [Online] Available at < http://corporate.greggs.co.uk/assets/Uploads/630554A4ANNUAL-REPORT2011-3.pdf> [25th March, 2013] Greggs plc (2012) Annual Reports and Accounts 2011 [Online] Available at <http://corporate.greggs.co.uk/assets/Uploads/GREGGS-PLC-REPORT-AND-ACCOU NTS.pdf> [25th March, 2013] Greggs plc (2013a) Annual Reports and Accounts 2012 [Online] Available at <http://corporate.greggs.co.uk/assets/Uploads/GREGGS-18035-AR2012-Web.pdf> [25th
  • 31. 31 March, 2013] Greggs plc (2013b) Company Overview [Online] Available at <http://corporate.greggs.co.uk/company-overview> [28th March, 2013] Palepu, K. G., Healy, P.M. & Peek, E. (2010) Business Analysis and Valuation IFRS edition: Second edition. Hampshire: South-Western, Cengage Learning Inc. Porter M.E. (1979), The Five Competitive Forces that Shape Strategy, [online] Available at: <http://prolog.univie.ac.at/teaching/LVAs/KFK-LM/WS07/Porter.pdf> [25th March 2013] TESCO plc (2009) Annual Report and Financial Statements 2008 [Online] Available at < http://www.tescoplc.com/files/pdf/reports/annual_report_2009.pdf > [25th March, 2013] TESCO plc (2010) Annual Report and Financial Statements 2009 [Online] Available at < http://www.tescoplc.com/files/pdf/reports/annual_report_2009.pdf > [25th March, 2013] TESCO plc (2011) Annual Report and Financial Statements 2010 [Online] Available at < http://www.tescoplc.com/files/pdf/reports/annual_report_2010.pdf> [25th March, 2013] TESCO plc (2012) Annual Report and Financial Statements 2011 [Online] Available at < http://www.tescoplc.com/files/pdf/reports/tesco_annual_report_2011.pdf> [25th March, 2013] TESCO plc (2013) Annual Report and Financial Statements 2012 [Online] Available at < http://www.tescoplc.com/files/pdf/reports/tesco_annual_report_2012.pdf> [25th March, 2013] Trading Economics 2013, United Kingdom Households Disposable Income, [online] Retrieved at: <http://www.tradingeconomics.com/united-kingdom/disposable-personal-income> [3rd April, 2013] Trading Economics 2013, United Kingdom Consumer Spending, [online] Retrieved at: <http://www.tradingeconomics.com/united-kingdom/consumer-spending> [3rd April, 2013] Verdict (2013) How the UK Will Shop: 2013, [online] Available at: <http://www.sas.com/offices/europe/uk/downloads/retail/retail-predictions2013.pdf> [2nd April 2013]
  • 32. 32 APPENDIX Appendix 1: Standardized Income Statement of Greggs plc. 2008-2012 (£’1000) 2012 2011 2010 2009 2008 Sales 734,502 701,088 662,326 658,186 628,198 Cost of Sales -285,748 -272,778 -252,651 -252,284 -240,200 Gross Profit 448,754 428,310 409,675 405,902 387,998 SG&A Distribution and selling costs -362,067 -342,641 -321,261 -321,686 -306,573 Administrative expenses -33,394 -34,903 -36,049 -35,783 -40,845 -395,461 -377,544 -357,310 -357,469 -347,418 Other income 0 9,665 0 0 8,033 Operating profit 53,293 60,431 52,365 48,433 48,613 Net interest 49 69 158 346 857 Profit before tax 53,342 60,500 52,523 48,779 49,470 Income tax -12,775 -15,997 -14,589 -14,405 -15,375 Net Profit 40,567 44,503 37,934 34,374 34,095 Appendix 2: Vertical Common Sized Income Statement of Greggs plc 2008-2012 2012 2011 2010 2009 2008 Sales 100.00% 100.00% 100.00% 100.00% 100.00% Cost of Sales -38.90% -38.91% -38.15% -38.33% -38.24% Gross Profit 61.10% 61.09% 61.85% 61.67% 61.76% SG&A Distribution and selling costs -49.29% -48.87% -48.50% -48.87% -48.80% Administrative expenses -4.55% -4.98% -5.44% -5.44% -6.50% -53.84% -53.85% -53.95% -54.31% -55.30% Other income 0.00% 1.38% 0.00% 0.00% 1.28% Operating profit 7.26% 8.62% 7.91% 7.36% 7.74% Net interest 0.01% 0.01% 0.02% 0.05% 0.14% Profit before tax 7.26% 8.63% 7.93% 7.41% 7.87% Income tax -1.74% -2.28% -2.20% -2.19% -2.45% Net Profit 5.52% 6.35% 5.73% 5.22% 5.43%
  • 33. 33 Appendix3:StandardizedBalanceSheetofGreggsplc.2008-2012 20122011201020092008 ASSETS CashandMarketableSecurities -Cashandcashequivalents19,38119,50820,790346194433 -Short-terminvestment05003,00000 19,38120,00823,790346194433 TradeReceivables26,91721,16522,3092120622698 Inventories17,65814,27411,8831188612152 OtherCurrentAssets00000 TotalCurrentAssets63,95655,44757,9826771139283 Non-CurrentTangibleAssets -Property,plantandequipment264,257253,264226,150211155210455 Non-CurrentIntangibleAssets144289433579686 DeferredTaxAsset00000 OtherNon-CurrentAssets00000 TotalNon-CurrentAssets264,401253,553226,583211734211141 TotalAssets328,357309,000284,565279445250424 LIABILITIES CurrentDebt00000 TradePayables71,95574,30470,2467173862761 OtherCurrentLiabilities -Currenttaxliability71015,9696,28288578337
  • 34. 34 -Provisions3596201,0188572843 74606,5897,300971411180 TotalCurrentLiabilities79,41580,89377,5468145273941 Non-CurrentDebt DeferredTaxLiability9,19910,01010,924929812154 OtherNon-CurrentLiabilities(non-interestbearing) -Deferredgovernmentgrants7,5027,9698,43988308221 -Definedbenefitpensionliability4,0568,8668,764123325733 -Longtermprovisions1,3952,8792,66532962428 12,95319,71419,8682445816382 TotalNon-currentliabilities22,15229,72430,7923375628536 TotalLiability101,567110,617108,338115208102477 EQUITIES PreferenceShares00000 OrdinaryShareholder'sEquity -ShareCapital2,0232,0232,02320802080 -SharePremiumAccount13,53313,53313,5331353313533 -Capitalredemptionreserve416416416359359 -Retainedearnings210,818182,411160,255148265131975 TotalEquity226,790198,383176,227164237147947 TotalEquityandLiabilities328,357309,000284,565279445250424
  • 35. 35 Appendix 4: Standardized Income Statement of Tesco plc. 2008-2012 (£’m) 2012 2011 2010 2009 2008 Sales 64,975 60,931 56,910 53,898 47,298 Cost of Sales -59,817 -55,871 -52,303 -49,713 -43,668 Gross Profit 5,158 5,060 4,607 4,185 3,630 SG&A Administrative expense -1,675 -1,676 -1,527 -1,252 -1,027 Other operating income 375 427 377 236 188 Operating Profit 3,858 3,811 3,457 3,169 2,791 Investment income 91 57 33 110 75 Net interest -242 -333 -314 -362 -63 Profit before tax 3,707 3,535 3,176 2,917 2,803 Income tax -893 -864 -840 -779 -673 Net Profit 2,814 2,671 2,336 2,138 2,130 Appendix 5: Vertical Common Sized Income Statement of Tesco plc 2008-2012 2012 2011 2010 2009 2008 Sales 100% 100% 100% 100% 100% Cost of Sales -92.06% -85.99% -80.50% -76.51% -67.21% Gross Profit 7.94% 7.79% 7.09% 6.44% 5.59% SG&A Administrative expense -2.58% -2.58% -2.35% -1.93% -1.58% Other operating income 0.58% 0.66% 0.58% 0.36% 0.29% Operating Profit 5.94% 5.87% 5.32% 4.88% 4.30% Investment income 0.14% 0.09% 0.05% 0.17% 0.12% Net interest -0.37% -0.51% -0.48% -0.56% -0.10% Profit before tax 5.71% 5.44% 4.89% 4.49% 4.31% Income tax -1.37% -1.33% -1.29% -1.20% -1.04% Net Profit 4.33% 4.11% 3.60% 3.29% 3.28%
  • 36. 36 Appendix5:StandardizedBalanceSheetofTescoplc.2008-2012 20122011201020092008 ASSETS CashandMarketableSecurities -Cashandcashequivalents2,3052,4282,8193,5091,788 -Short-terminvestment1,2431,0221,3141,233360 3,5483,4504,1334,7422,148 TradeReceivables2,6572,3301,8881,8201,311 Inventories3,5983,1622,7292,6692,430 OtherCurrentAssets2,5502,6662,6423,850103 TotalCurrentAssets12,35311,60811,39213,0815,992 Non-CurrentTangibleAssets -Property,plantandequipment25,71024,39824,20323,15219,787 -Non-currenttangibleassetsclassifiedasheldforsale510431373398308 26,22024,82924,57623,55020,095 Non-CurrentIntangibleAssets4,6184,3384,1774,0762,336 DeferredTaxAsset23483849104 OtherNon-CurrentAssets -Investmentinassociates42331615262305 -Investmentproperty1,9911,8631,7311,5391,112 -Otherinvestments1,5269388632594 -Non-currentderivativefinancialinstruments1,7261,1391,2501,478216 -Loansandadvancestocustomers1,9012,1271,8441,4700
  • 39. 39 Appendix 6: Ratio analysis of Greggs plc. and Tesco plc. 2008-2012 2012 2011 2010 2009 2008 Greggs Tesco Greggs Tesco Greggs Tesco Greggs Tesco Greggs Tesco ROE 17.89% 15.81% 22.43% 16.07% 21.53% 15.91% 20.93% 16.57% 23.05% 17.94% Financial leverage 1.45 2.85 1.56 2.84 1.61 3.13 1.70 3.53 1.69 2.54 ROA 12.35% 5.54% 14.40% 5.66% 13.33% 5.08% 12.30% 4.69% 13.61% 7.06% Net Profit margin 5.52% 4.33% 6.35% 4.38% 5.73% 4.10% 5.22% 3.97% 5.43% 4.50% Operating management Gross profit margin 61.10% 7.94% 61.09% 8.30% 61.85% 8.10% 61.67% 7.76% 61.76% 7.67% SG&A expenses margin 53.84% 2.58% 53.85% 2.75% 53.95% 2.68% 54.31% 2.32% 55.30% 2.17% EBITDA margin 11.75% 8.24% 13.02% 8.59% 12.30% 8.51% 11.51% 8.09% 11.88% 8.00% NOPAT margin 5.52% 4.61% 6.34% 4.80% 5.71% 4.51% 5.19% 4.46% 5.33% 4.60% Asset turnover 2.24 1.28 2.27 1.29 2.33 1.24 2.36 1.18 2.51 1.57 Working capital management Operating working capital turnover -21.08 -7.55 -15.42 -7.44 -15.28 -7.87 -13.61 -9.32 -16.07 -10.71 Trade receivables turnover 27.29 24.45 33.12 26.15 29.69 30.14 31.04 29.61 27.68 36.08 Inventories turnover 16.18 18.06 19.11 19.27 21.26 20.85 21.23 20.19 19.77 19.46 Trade payables turnover 3.97 5.78 3.67 5.81 3.6 6.03 3.52 6.22 3.83 6.43 Non current assets management Net non-current assets turnover 2.92 1.78 3 1.79 3.2 1.74 3.51 1.75 3.23 2.03 PP&E turnover 2.78 2.53 2.77 2.5 2.93 2.35 3.12 2.33 2.98 2.39 Financial leverage 1.45 2.85 1.56 2.84 1.61 3.13 1.7 3.53 1.69 2.54 Current liabilities and short term
  • 40. 40 liquidity Current ratio 80.53% 64.17% 68.54% 65.47% 74.77% 71.13% 83.13% 74.34% 53.13% 57.92% Quick ratio 58.30% 32.24% 50.90% 32.60% 59.45% 37.60% 68.54% 37.29% 36.69% 33.44% Cash ratio 24.40% 18.43% 24.73% 19.46% 30.68% 25.81% 42.50% 26.95% 6.00% 20.76% Debt and long term solvency Liabilities to equity ratio 44.78% 185.27% 55.76% 183.98% 61.48% 213.49% 70.15% 253.05% 69.27% 154.06% Debt to equity ratio 0 69.87% 0 70.23% 0 95.70% 0 125.24% 0 70.56%
  • 41. 41 Appendix 7: Ratio calculations Profitability Ratios 𝑅𝑂𝐸 = 𝑅𝑂𝐴 × 𝐹𝑖𝑛𝑎𝑛𝑐𝑖𝑎𝑙  𝐿𝑣𝑒𝑟𝑎𝑔𝑒 𝑅𝑂𝐴 = 𝑁𝑒𝑡  𝑃𝑟𝑜𝑓𝑖𝑡 𝐴𝑠𝑠𝑒𝑡𝑠 = 𝑁𝑒𝑡  𝑃𝑟𝑜𝑓𝑖𝑡  𝑀𝑎𝑟𝑔𝑖𝑛 × 𝐴𝑠𝑠𝑒𝑡𝑠  𝑇𝑢𝑟𝑛𝑜𝑣𝑒𝑟 𝑁𝑒𝑡  𝑃𝑟𝑜𝑓𝑖𝑡  𝑚𝑎𝑟𝑔𝑖𝑛 = 𝑁𝑒𝑡  𝑃𝑟𝑜𝑓𝑖𝑡 𝑆𝑎𝑙𝑒𝑠 𝐴𝑠𝑠𝑒𝑡𝑠  𝑇𝑢𝑟𝑛𝑜𝑣𝑒𝑟 = 𝑆𝑎𝑙𝑒𝑠 𝐴𝑠𝑠𝑒𝑡𝑠 𝐹𝑖𝑛𝑎𝑛𝑐𝑖𝑎𝑙  𝐿𝑒𝑣𝑒𝑟𝑎𝑔𝑒 = 𝐴𝑠𝑠𝑒𝑡𝑠 𝑆ℎ𝑎𝑟𝑒ℎ𝑜𝑙𝑑𝑒𝑠′  𝑒𝑞𝑢𝑖𝑡𝑦 Operating Ratios 𝐺𝑟𝑜𝑠𝑠  𝑃𝑟𝑜𝑓𝑖𝑡  𝑚𝑎𝑟𝑔𝑖𝑛 = 𝑆𝑎𝑙𝑒𝑠 − 𝐶𝑜𝑠𝑡  𝑜𝑓  𝑆𝑎𝑙𝑒𝑠 𝑆𝑎𝑙𝑒𝑠 𝑆𝐺&𝐴  𝑒𝑥𝑝𝑒𝑛𝑠𝑒  𝑚𝑎𝑟𝑔𝑖𝑛 = 𝑆𝐺&𝐴  𝑒𝑥𝑝𝑒𝑛𝑠𝑒 𝑆𝑎𝑙𝑒𝑠 𝑁𝑂𝑃𝐴𝑇  𝑚𝑎𝑟𝑔𝑖𝑛 = 𝑁𝑂𝑃𝐴𝑇 𝑆𝑎𝑙𝑒𝑠 𝐸𝐵𝐼𝑇𝐷𝐴  𝑚𝑎𝑟𝑔𝑖𝑛 = 𝐸𝑎𝑟𝑛𝑖𝑛𝑔𝑠  𝑏𝑒𝑓𝑜𝑟𝑒  𝑖𝑛𝑡𝑒𝑟𝑒𝑠𝑡𝑠, 𝑡𝑎𝑥𝑒𝑠, 𝑑𝑒𝑝𝑟𝑒𝑐𝑖𝑎𝑡𝑖𝑜𝑛  𝑎𝑛𝑑  𝑎𝑚𝑜𝑟𝑡𝑖𝑧𝑎𝑡𝑖𝑜𝑛 𝑆𝑎𝑙𝑒𝑠 Investment Ratios 𝑂𝑝𝑒𝑟𝑎𝑡𝑖𝑛𝑔  𝑤𝑜𝑟𝑘𝑖𝑛𝑔  𝑐𝑎𝑝𝑖𝑡𝑎𝑙 = (𝐶𝑢𝑟𝑟𝑒𝑛𝑡  𝑎𝑠𝑠𝑒𝑡𝑠 − 𝐶𝑎𝑠ℎ  𝑎𝑛𝑑  𝑚𝑎𝑟𝑘𝑒𝑡𝑎𝑏𝑙𝑒  𝑠𝑒𝑐𝑢𝑟𝑖𝑡𝑖𝑒𝑠) − (𝐶𝑢𝑟𝑟𝑒𝑛𝑡  𝑙𝑖𝑎𝑏𝑖𝑙𝑖𝑡𝑖𝑒𝑠 − 𝐶𝑢𝑟𝑟𝑒𝑛𝑡  𝑑𝑒𝑏𝑡  𝑎𝑛𝑑  𝑐𝑢𝑟𝑟𝑒𝑛𝑡  𝑝𝑜𝑟𝑡𝑖𝑜𝑛  𝑜𝑓  𝑛𝑜𝑛 − 𝑐𝑢𝑟𝑟𝑒𝑛𝑡  𝑑𝑒𝑏𝑡) 𝑂𝑝𝑒𝑟𝑎𝑡𝑖𝑛𝑔  𝑤𝑜𝑟𝑘𝑖𝑛𝑔  𝑐𝑎𝑝𝑖𝑡𝑎𝑙  𝑡𝑜  𝑠𝑎𝑙𝑠𝑒𝑠  𝑡𝑢𝑟𝑛𝑜𝑣𝑒𝑟 = 𝑆𝑎𝑙𝑒𝑠 𝑂𝑝𝑒𝑟𝑎𝑡𝑖𝑛𝑔  𝑤𝑜𝑟𝑘𝑖𝑛𝑔  𝑐𝑎𝑝𝑖𝑡𝑎𝑙 𝑇𝑟𝑎𝑑𝑒  𝑟𝑒𝑐𝑒𝑖𝑣𝑎𝑏𝑙𝑒𝑠  𝑡𝑢𝑟𝑛𝑜𝑣𝑒𝑟 = 𝑆𝑎𝑙𝑒𝑠 𝑇𝑟𝑎𝑑𝑒  𝑟𝑒𝑐𝑒𝑖𝑣𝑎𝑏𝑙𝑒𝑠 𝐼𝑛𝑣𝑒𝑛𝑡𝑜𝑟𝑦  𝑡𝑢𝑟𝑛𝑜𝑣𝑒𝑟 = 𝐶𝑜𝑠𝑡  𝑜𝑓  𝑠𝑎𝑙𝑒𝑠 𝐼𝑛𝑣𝑒𝑛𝑡𝑜𝑟𝑦 𝑇𝑟𝑎𝑑𝑒  𝑝𝑎𝑦𝑎𝑏𝑙𝑒𝑠  𝑡𝑢𝑟𝑛𝑜𝑣𝑒𝑟 = 𝐶𝑜𝑠𝑡  𝑜𝑓  𝑠𝑎𝑙𝑒𝑠 𝑇𝑟𝑎𝑑𝑒  𝑝𝑎𝑦𝑎𝑏𝑙𝑒𝑠 𝐷𝑎𝑦𝑠 𝑖𝑛𝑣𝑒𝑛𝑡𝑜𝑟𝑖𝑒𝑠 = 𝐼𝑛𝑣𝑒𝑛𝑡𝑜𝑟𝑖𝑒𝑠 𝐴𝑣𝑒𝑟𝑎𝑔𝑒  𝑐𝑜𝑠𝑡  𝑜𝑓  𝑠𝑎𝑙𝑒𝑠  𝑝𝑒𝑟  𝑑𝑎𝑦 𝐷𝑎𝑦𝑠 𝑝𝑎𝑦𝑎𝑏𝑙𝑒 = 𝑇𝑟𝑎𝑑𝑒  𝑝𝑎𝑦𝑎𝑏𝑙𝑒𝑠 𝐴𝑣𝑒𝑟𝑎𝑔𝑒  𝑐𝑜𝑠𝑡  𝑜𝑓  𝑠𝑎𝑙𝑒𝑠  𝑝𝑒𝑟  𝑑𝑎𝑦 𝑁𝑒𝑡  𝑛𝑜𝑛 − 𝑐𝑢𝑟𝑟𝑒𝑛𝑡  𝑎𝑠𝑠𝑒𝑡  𝑡𝑢𝑟𝑛𝑜𝑣𝑒𝑟 = 𝑆𝑎𝑙𝑒𝑠 𝑁𝑒𝑡  𝑛𝑜𝑛 − 𝑐𝑢𝑟𝑟𝑒𝑛𝑡  𝑎𝑠𝑠𝑒𝑡𝑠
  • 42. 42 𝑃𝑃&𝐸  𝑡𝑢𝑟𝑛𝑜𝑣𝑒𝑟 = 𝑆𝑎𝑙𝑒𝑠 𝑁𝑒𝑡  𝑝𝑟𝑜𝑝𝑒𝑟𝑡𝑦, 𝑝𝑙𝑎𝑛𝑡  𝑎𝑛𝑑  𝑒𝑞𝑢𝑖𝑝𝑚𝑒𝑛𝑡 Financing Ratios 𝐶𝑢𝑟𝑟𝑒𝑛𝑡  𝑟𝑎𝑡𝑖𝑜 = 𝐶𝑢𝑟𝑟𝑒𝑛𝑡  𝑎𝑠𝑠𝑒𝑡𝑠 𝐶𝑢𝑟𝑟𝑒𝑛𝑡  𝑙𝑖𝑎𝑏𝑖𝑙𝑖𝑡𝑖𝑒𝑠 𝑄𝑢𝑖𝑐𝑘  𝑟𝑎𝑡𝑖𝑜 = 𝐶𝑎𝑠ℎ  𝑎𝑛𝑑  𝑚𝑎𝑟𝑘𝑒𝑡  𝑠𝑒𝑐𝑢𝑟𝑖𝑡𝑖𝑒𝑠 + 𝑇𝑟𝑎𝑑𝑒  𝑟𝑒𝑐𝑒𝑖𝑣𝑎𝑏𝑙𝑒𝑠  (𝑛𝑒𝑡) 𝐶𝑢𝑟𝑟𝑒𝑛𝑡  𝑙𝑖𝑎𝑏𝑖𝑙𝑖𝑡𝑖𝑒𝑠 𝐶𝑎𝑠ℎ  𝑟𝑎𝑡𝑖𝑜 = 𝐶𝑎𝑠ℎ  𝑎𝑛𝑑  𝑚𝑎𝑟𝑘𝑒𝑡𝑎𝑏𝑙𝑒  𝑠𝑒𝑐𝑢𝑟𝑖𝑡𝑖𝑒𝑠 𝐶𝑢𝑟𝑟𝑒𝑛𝑡  𝑙𝑖𝑎𝑏𝑖𝑙𝑡𝑖𝑒𝑠 𝑂𝑝𝑒𝑟𝑎𝑡𝑖𝑛𝑔  𝑐𝑎𝑠ℎ  𝑓𝑙𝑜𝑤  𝑟𝑎𝑡𝑖𝑜 = 𝐶𝑎𝑠ℎ  𝑓𝑙𝑜𝑤  𝑓𝑟𝑜𝑚  𝑜𝑝𝑒𝑟𝑎𝑡𝑖𝑜𝑛 𝐶𝑢𝑟𝑟𝑒𝑛𝑡  𝑙𝑖𝑎𝑏𝑖𝑙𝑖𝑡𝑖𝑒𝑠 𝐿𝑖𝑎𝑏𝑖𝑙𝑡𝑖𝑒𝑠  𝑡𝑜  𝑒𝑞𝑢𝑖𝑡𝑦  𝑟𝑎𝑡𝑖𝑜 = 𝑇𝑜𝑡𝑎𝑙  𝑙𝑖𝑎𝑏𝑖𝑙𝑖𝑡𝑖𝑒𝑠 𝑆ℎ𝑎𝑟𝑒ℎ𝑜𝑙𝑑𝑒𝑟𝑠 𝑒𝑞𝑢𝑖𝑡𝑦 𝐷𝑒𝑏𝑡  𝑡𝑜  𝑒𝑞𝑢𝑖𝑡𝑦  𝑟𝑎𝑡𝑖𝑜 = 𝐶𝑢𝑟𝑟𝑒𝑛𝑡  𝑑𝑒𝑏𝑡 + 𝑁𝑜𝑛– 𝑐𝑢𝑟𝑟𝑒𝑛𝑡  𝑑𝑒𝑏𝑡 𝑆ℎ𝑎𝑟𝑒ℎ𝑜𝑙𝑑𝑒𝑟𝑠 𝑒𝑞𝑢𝑖𝑡𝑦 Sustainable growth ratios 𝐷𝑖𝑣𝑖𝑑𝑒𝑛𝑑  𝑝𝑎𝑦𝑜𝑢𝑡  𝑟𝑎𝑡𝑖𝑜 = 𝐶𝑎𝑠ℎ  𝑑𝑖𝑣𝑖𝑑𝑒𝑛𝑑𝑠  𝑝𝑎𝑖𝑑 𝑁𝑒𝑡  𝑝𝑟𝑜𝑓𝑖𝑡 𝑆𝑢𝑠𝑡𝑎𝑖𝑛𝑎𝑏𝑙𝑒  𝑔𝑟𝑜𝑤𝑡ℎ  𝑟𝑎𝑡𝑖𝑜 = 𝑅𝑂𝐸 × (1 − 𝐷𝑖𝑣𝑖𝑑𝑛𝑒𝑑  𝑝𝑎𝑦𝑜𝑢𝑡  𝑟𝑎𝑡𝑖𝑜) 𝐷𝑖𝑣𝑖𝑑𝑒𝑛𝑑  𝑐𝑜𝑣𝑒𝑟𝑎𝑔𝑒 = 𝐸𝑎𝑟𝑛𝑖𝑛𝑔  𝑝𝑒𝑟  𝑠ℎ𝑎𝑟𝑒 𝐷𝑖𝑣𝑖𝑑𝑒𝑛𝑑  𝑝𝑒𝑟  𝑠ℎ𝑎𝑟𝑒
  • 43. 43 Appendix 8:  5  Years'  forecasted  financial  statements  of  Greggs  (£’000) 5 Years'  Forecasting  Income  Statement  of  Greggs  (£’000) Notes F2013 F2014 F2015 F2016 F2017 Revenue *1 767,555 805,932 854,288 905,546 959,878 Cost of sales *2 (299,346) (314,314) (333,172) (353,163) (374,353) Gross Profit 468,208 491,619 521,116 552,383 585,526 Distribution and selling costs *3 (375,104) (394,907) (418,601) (443,717) (470,340) Administrative expenses *4 (38,301) (39,007) (40,949) (44,140) (46,419) Other income *5 0 0 0 0 0 Operating profit 54,803 57,705 61,566 64,525 68,766 Finance income *6 49 49 49 49 49 Profit before tax 54,852 57,754 61,615 64,574 68,815 Income tax *7 (13,165) (13,861) (14,788) (15,498) (16,516) Net profit 41,688 43,893 46,827 49,076 52,300 Dividend *8 20861 22426 24108 25916 27860 Forecasted assumptions Sales growth rate *1 4.50% 5.00% 6.00% 6.00% 6.00% Cost of sales *2 -39.00% -39.00% -39.00% -39.00% -39.00% Distribution and selling costs *3 -48.87% -49.00% -49.00% -49.00% -49.00% Administration cost *4 -4.99% -4.84% -4.79% -4.87% -4.83% Income tax *7 -24% -24% -24% -24% -24% Dividend payout growth rate *8 7.50% 7.50% 7.50% 7.50% 7.50%
  • 44. 44 5  Years'  Partially  Forecasted  Balance  Sheet  of  Greggs  (£’000) Inputs 2010 2011 2012 F2013 F2014 F2015 F2016 F2017 Sales 662,326 701,088 734,502 767,555 805,932 854,288 905,546 959,878 Operating working capital/sales ratio -6.55% -6.48% -4.74% -5.00% -5.50% -6.00% -6.50% -6.50% PPE/store number 152 161 158 157 157 157 157 157 Store number 1487 1571 1671 1731 1791 1851 1911 1971 Outputs Operating working capital -43,354 -45,454 -34,840 -38,378 -44,326 -51,257 -58,860 -62,392 PP&E 226,150 253,264 264,257 271,767 281,187 290,607 300,027 309,447 5 Years' Partially Forcasted cash  flow  statement  of  Greggs  (£’000) F2013 F2014 F2015 F2016 F2017 Net profit 41,688 43,893 46,827 49,076 52,300 Less Finance income 49 49 49 49 49 NOPAT 41,639 43,844 46,778 49,027 52,251 Change in Working Capital (cash excluded) (3,538) (5,949) (6,931) (7,603) (3,532) Change in non current assets (Depreciation adjusted) 7,510 9,420 9,420 9,420 9,420 Cash flow to Equity 37,716 40,421 44,338 47,260 46,411
  • 45. 45 Appendix 9: Words reconciliation Total word count 9359 Less form reference list to end 2212 Less cover and contents 685 Less tables and figures 1514 Main body of text 4948