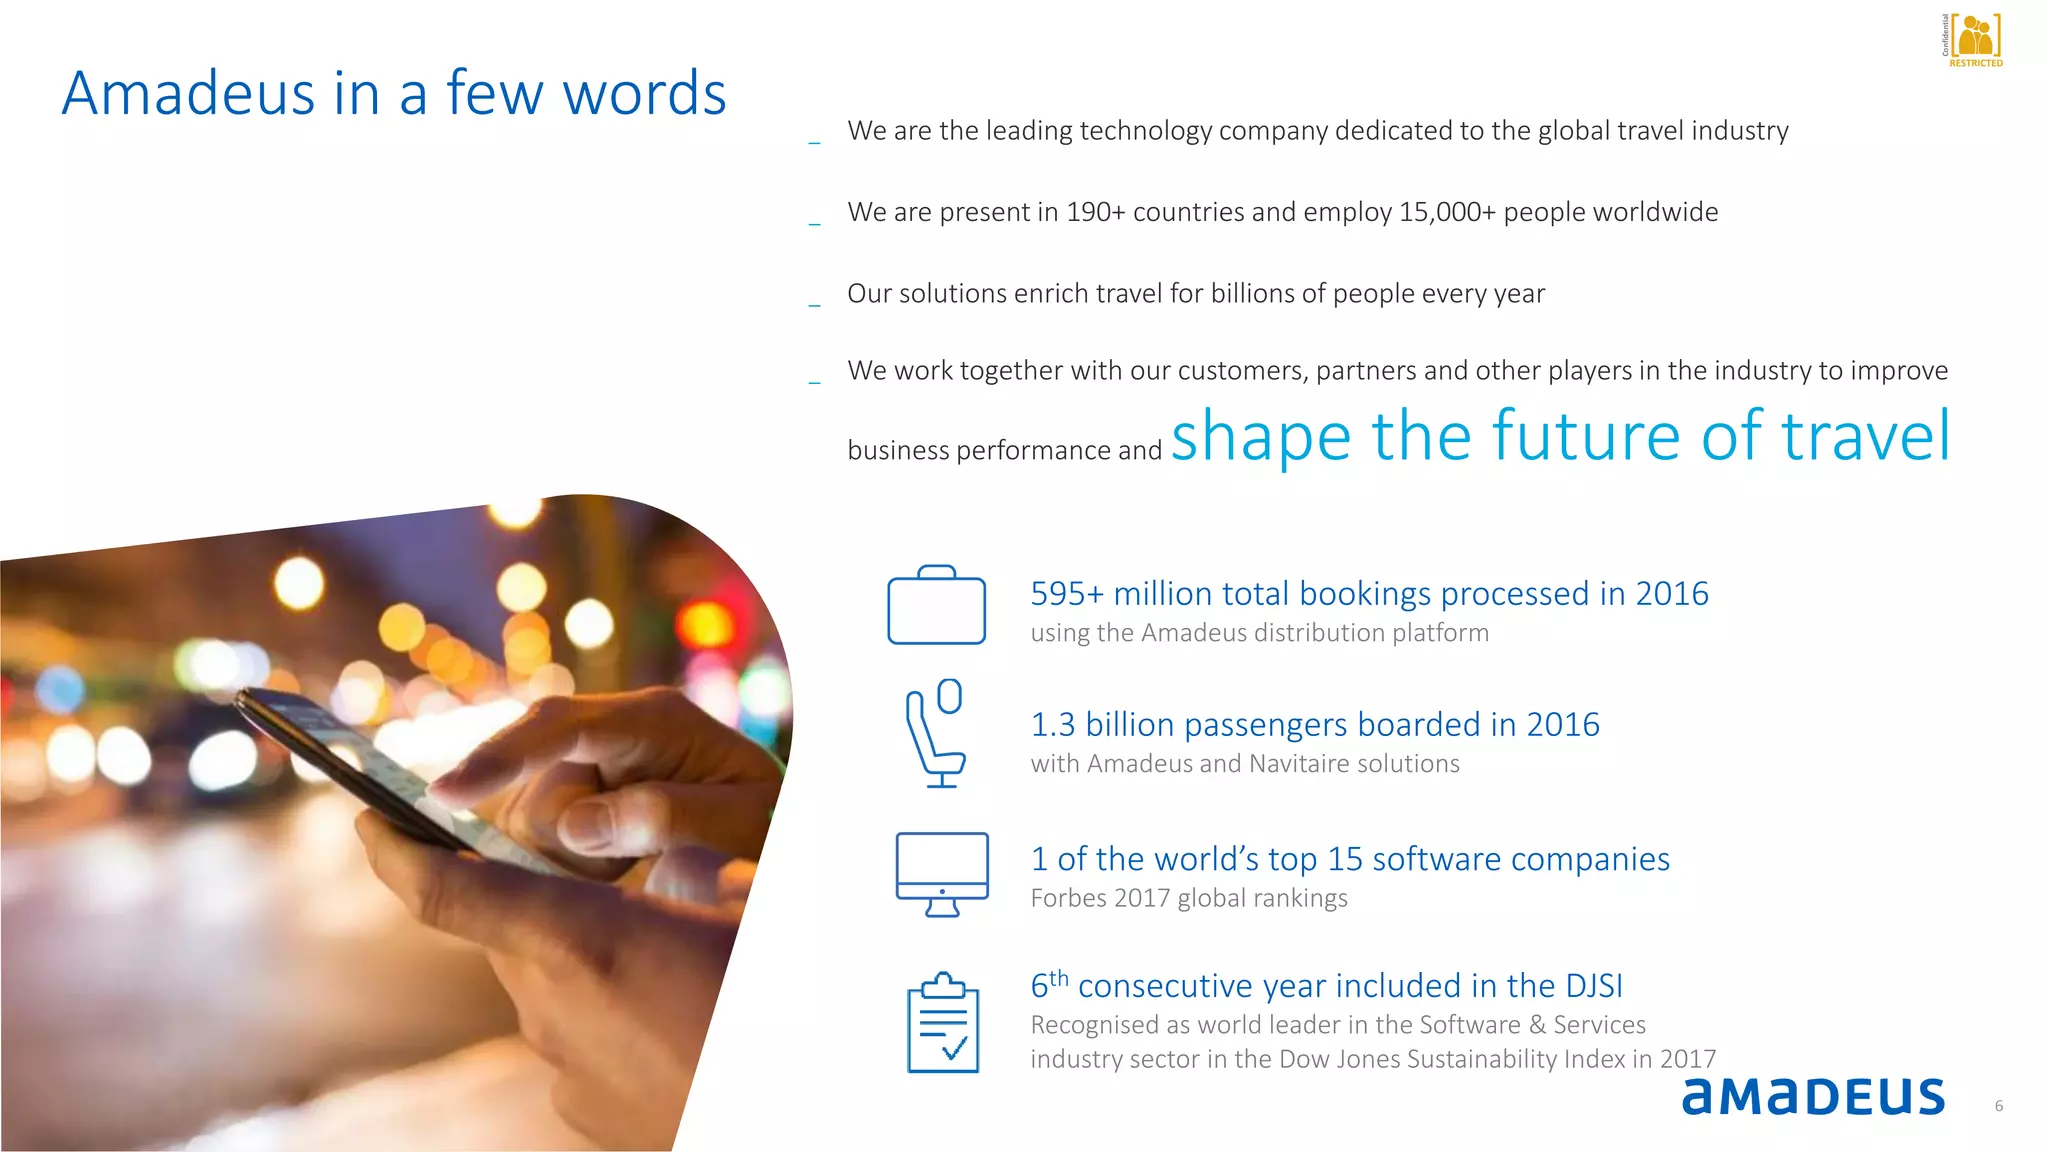
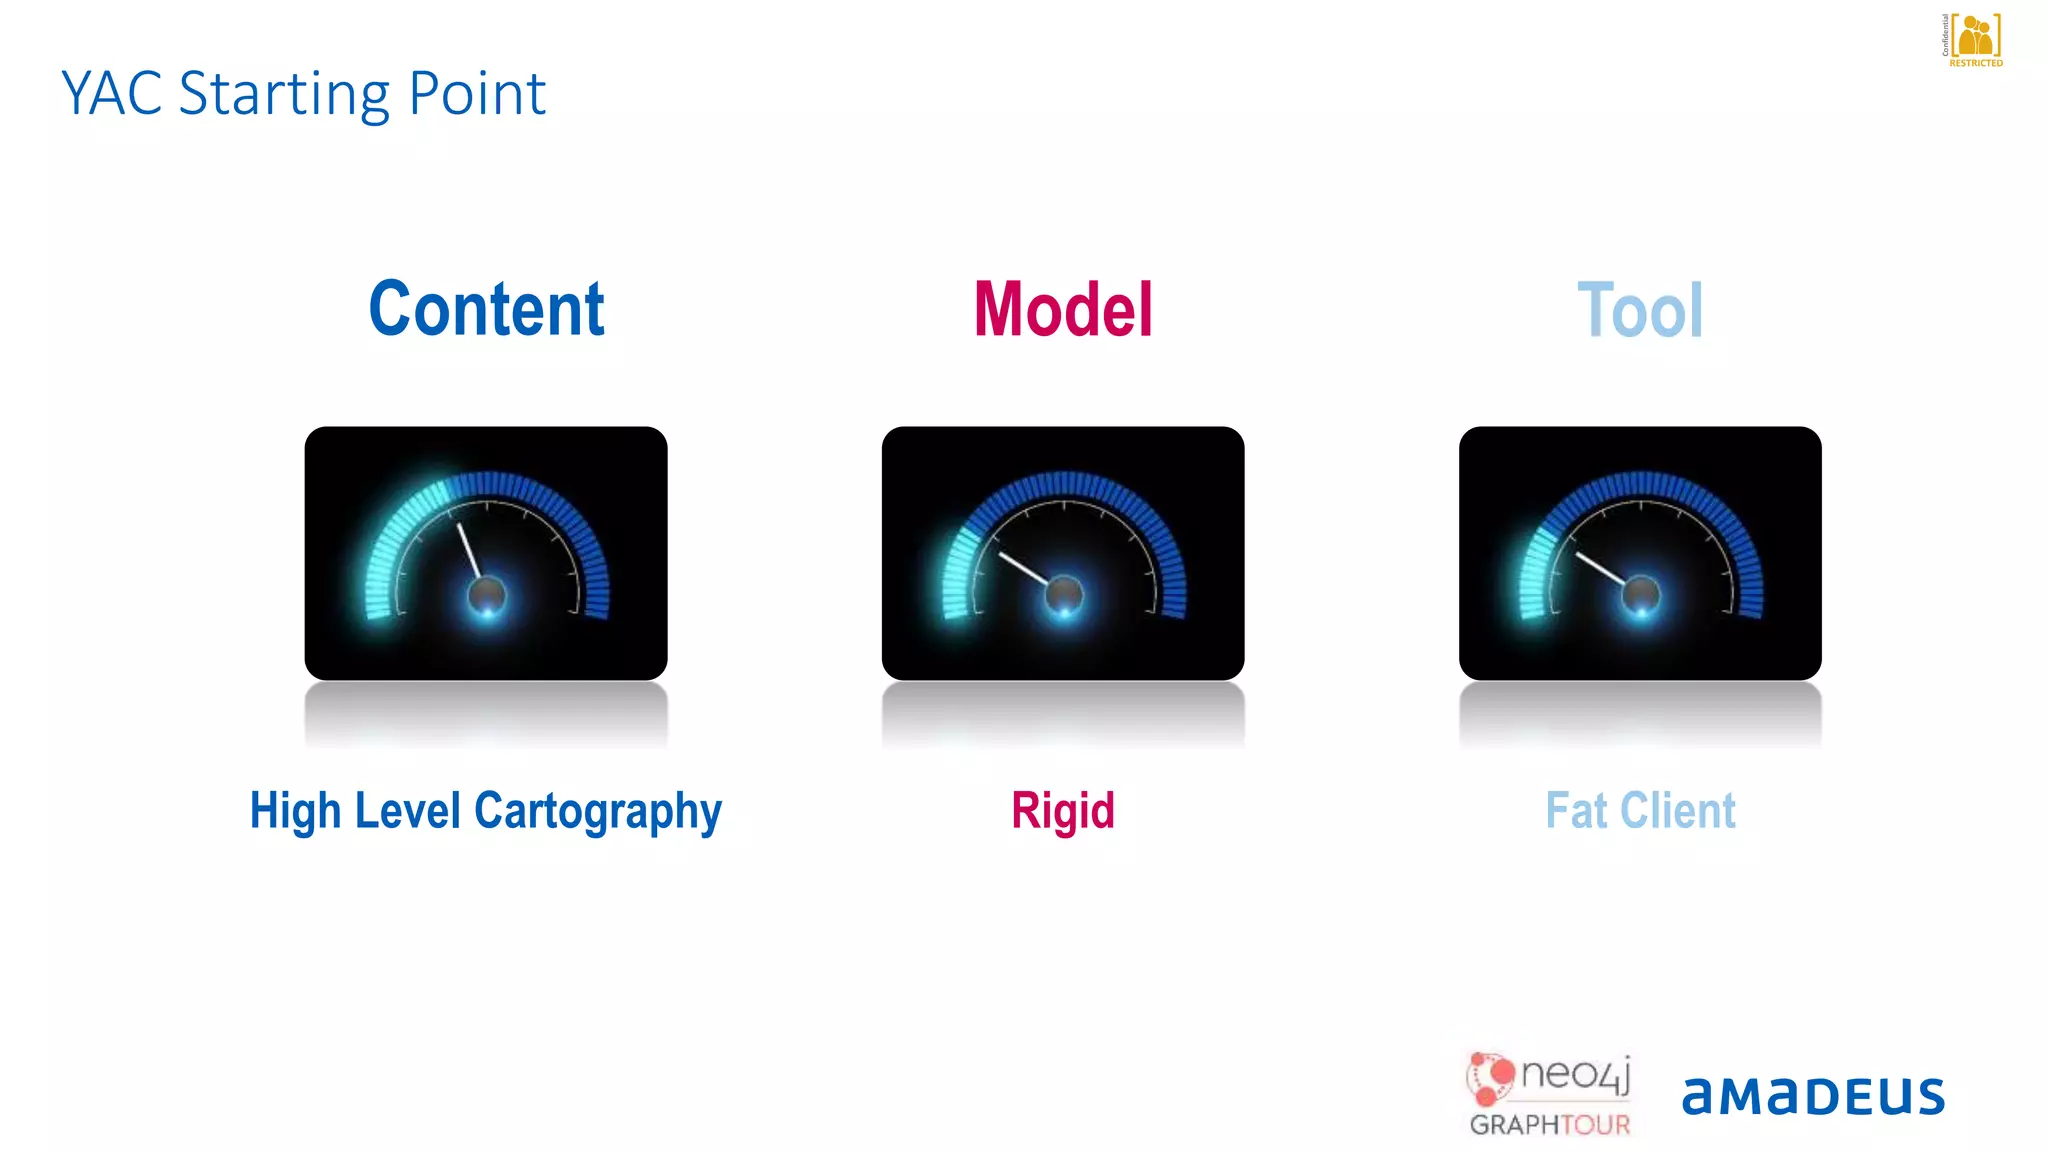
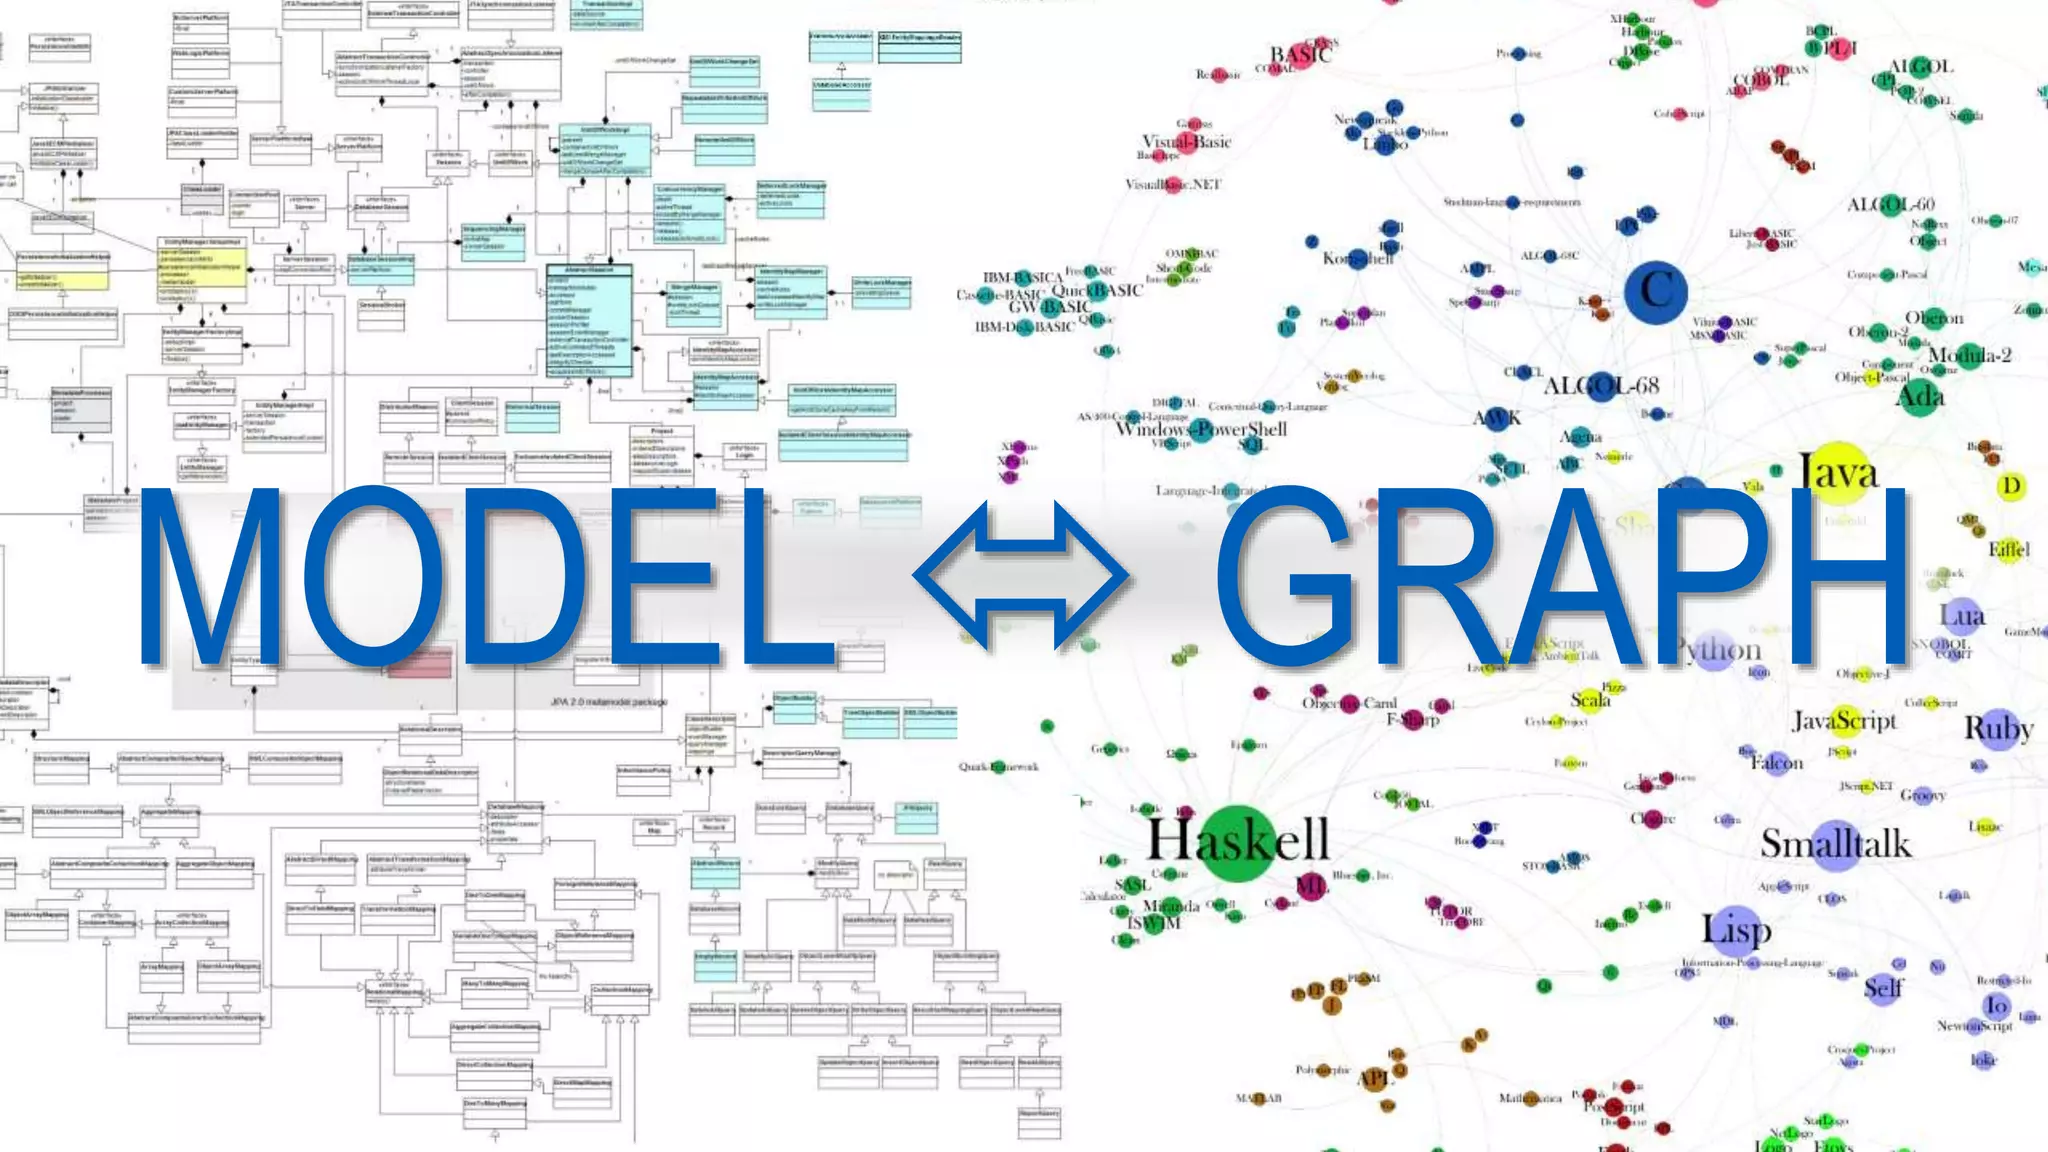
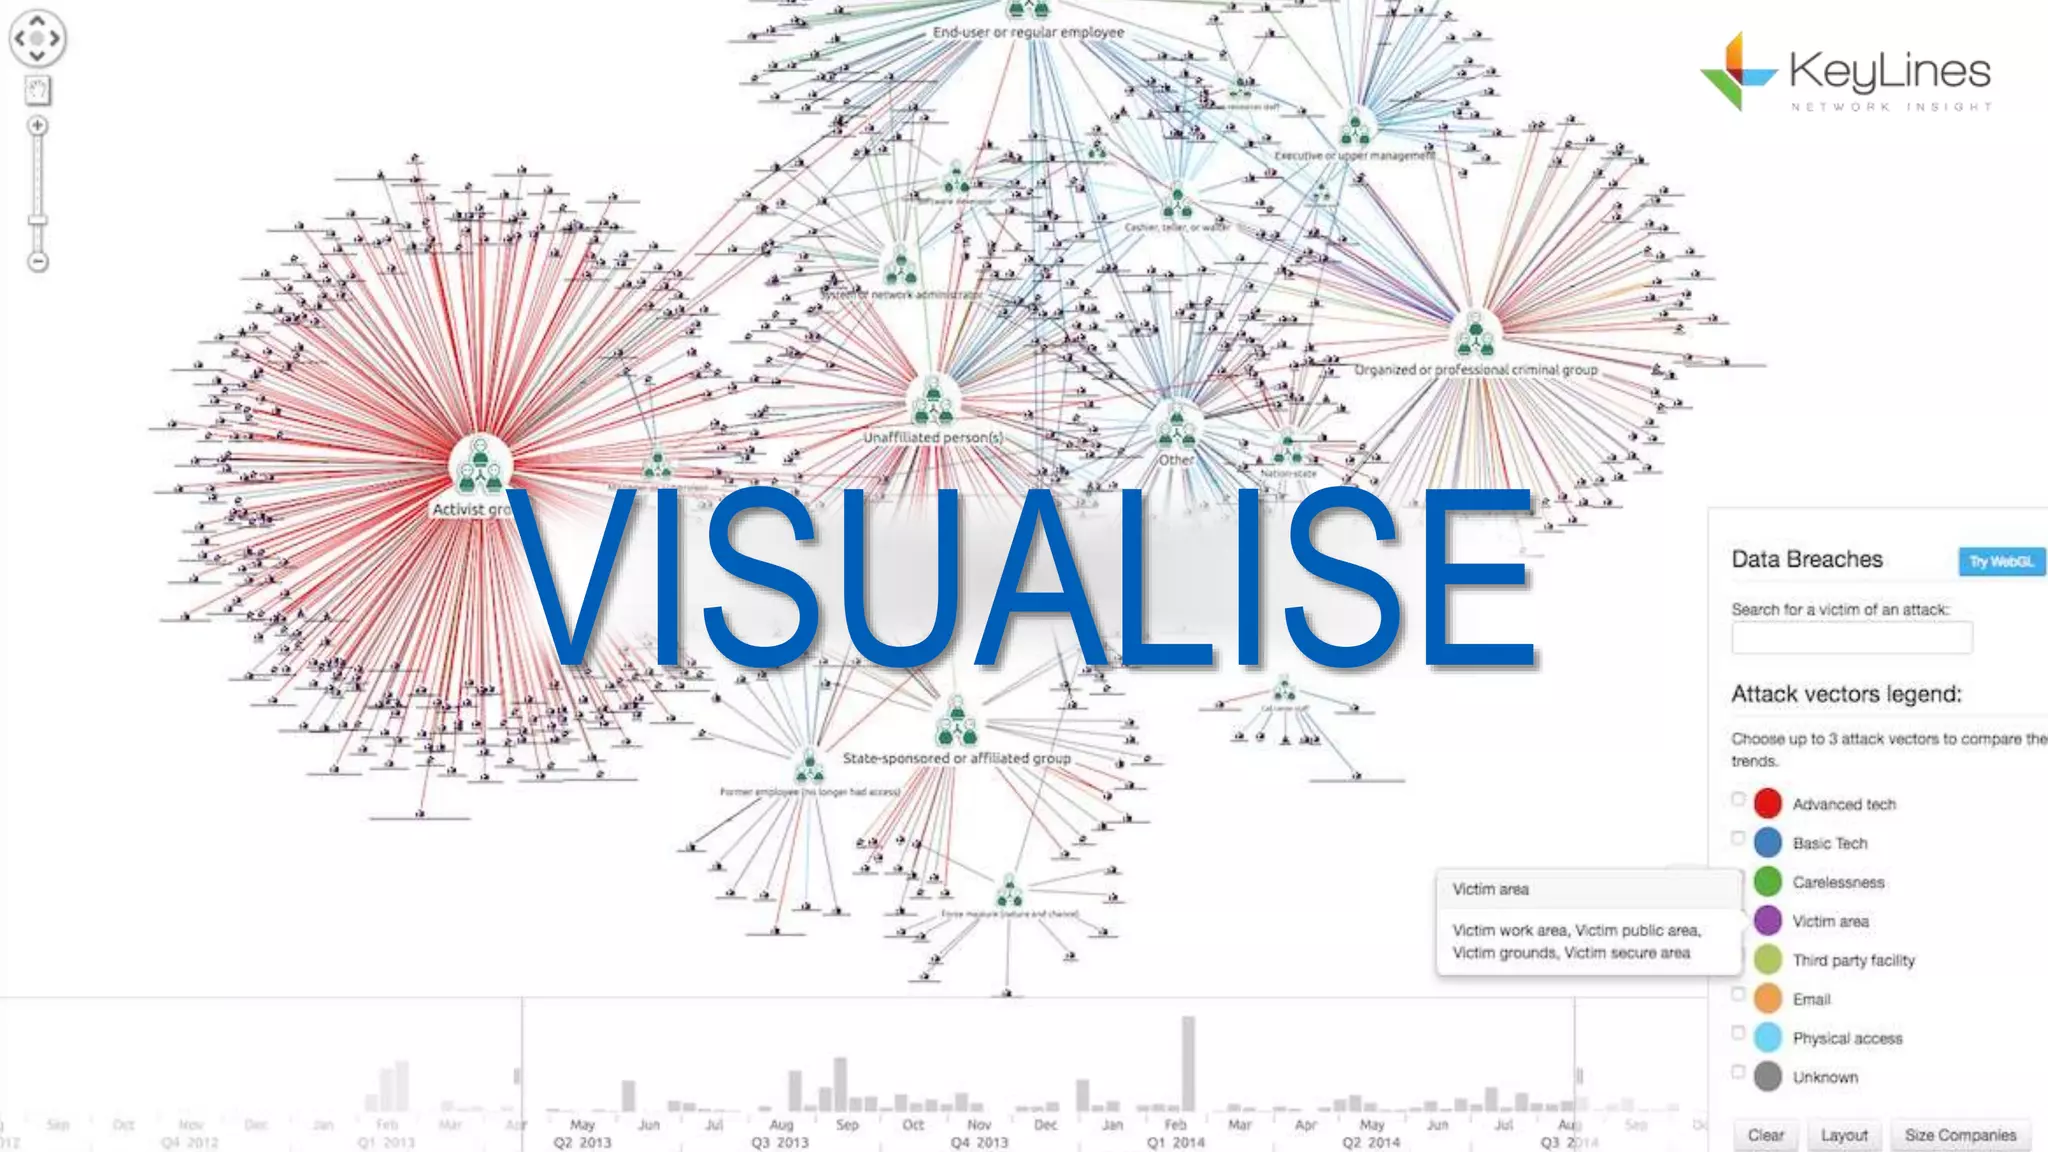
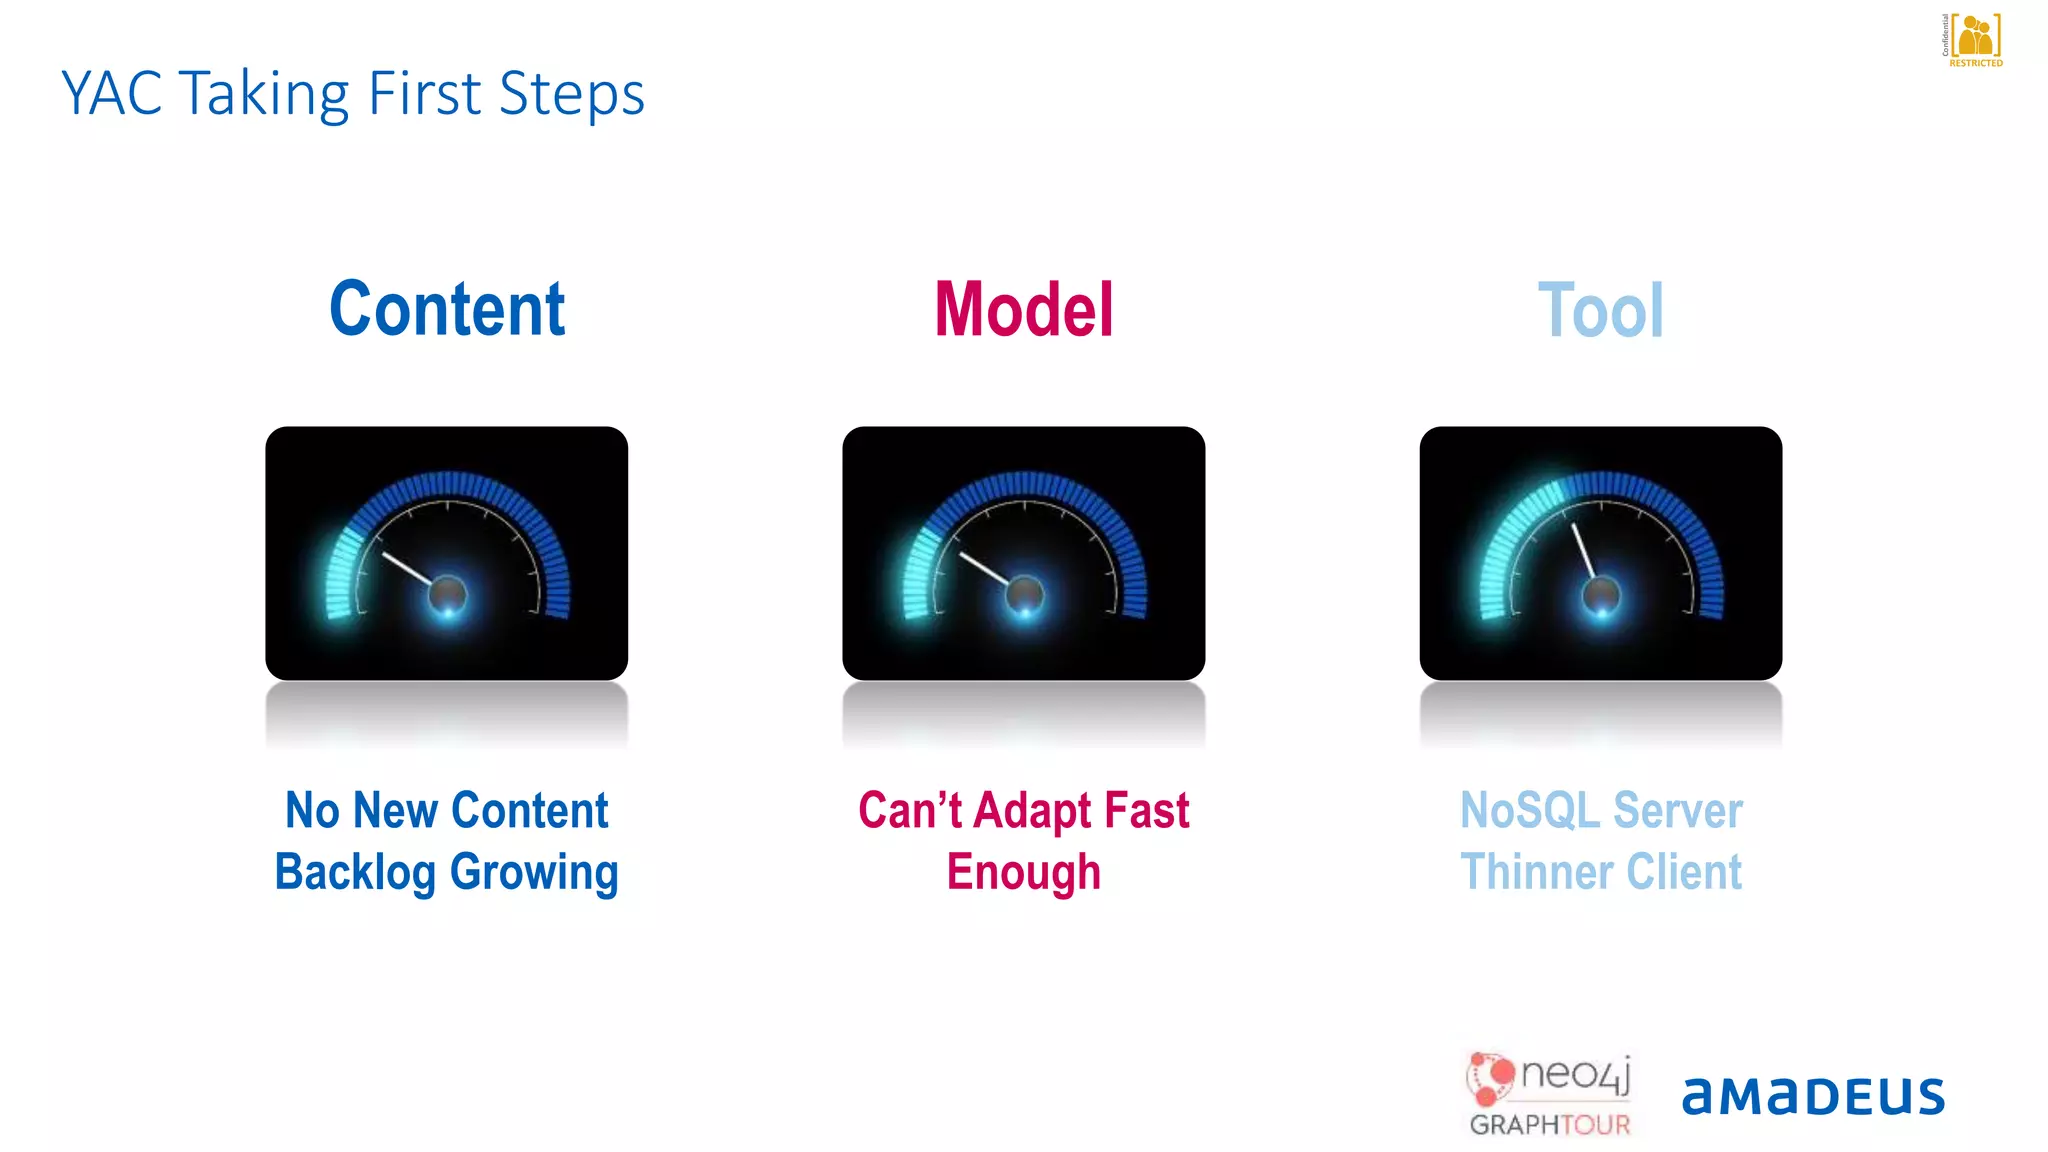
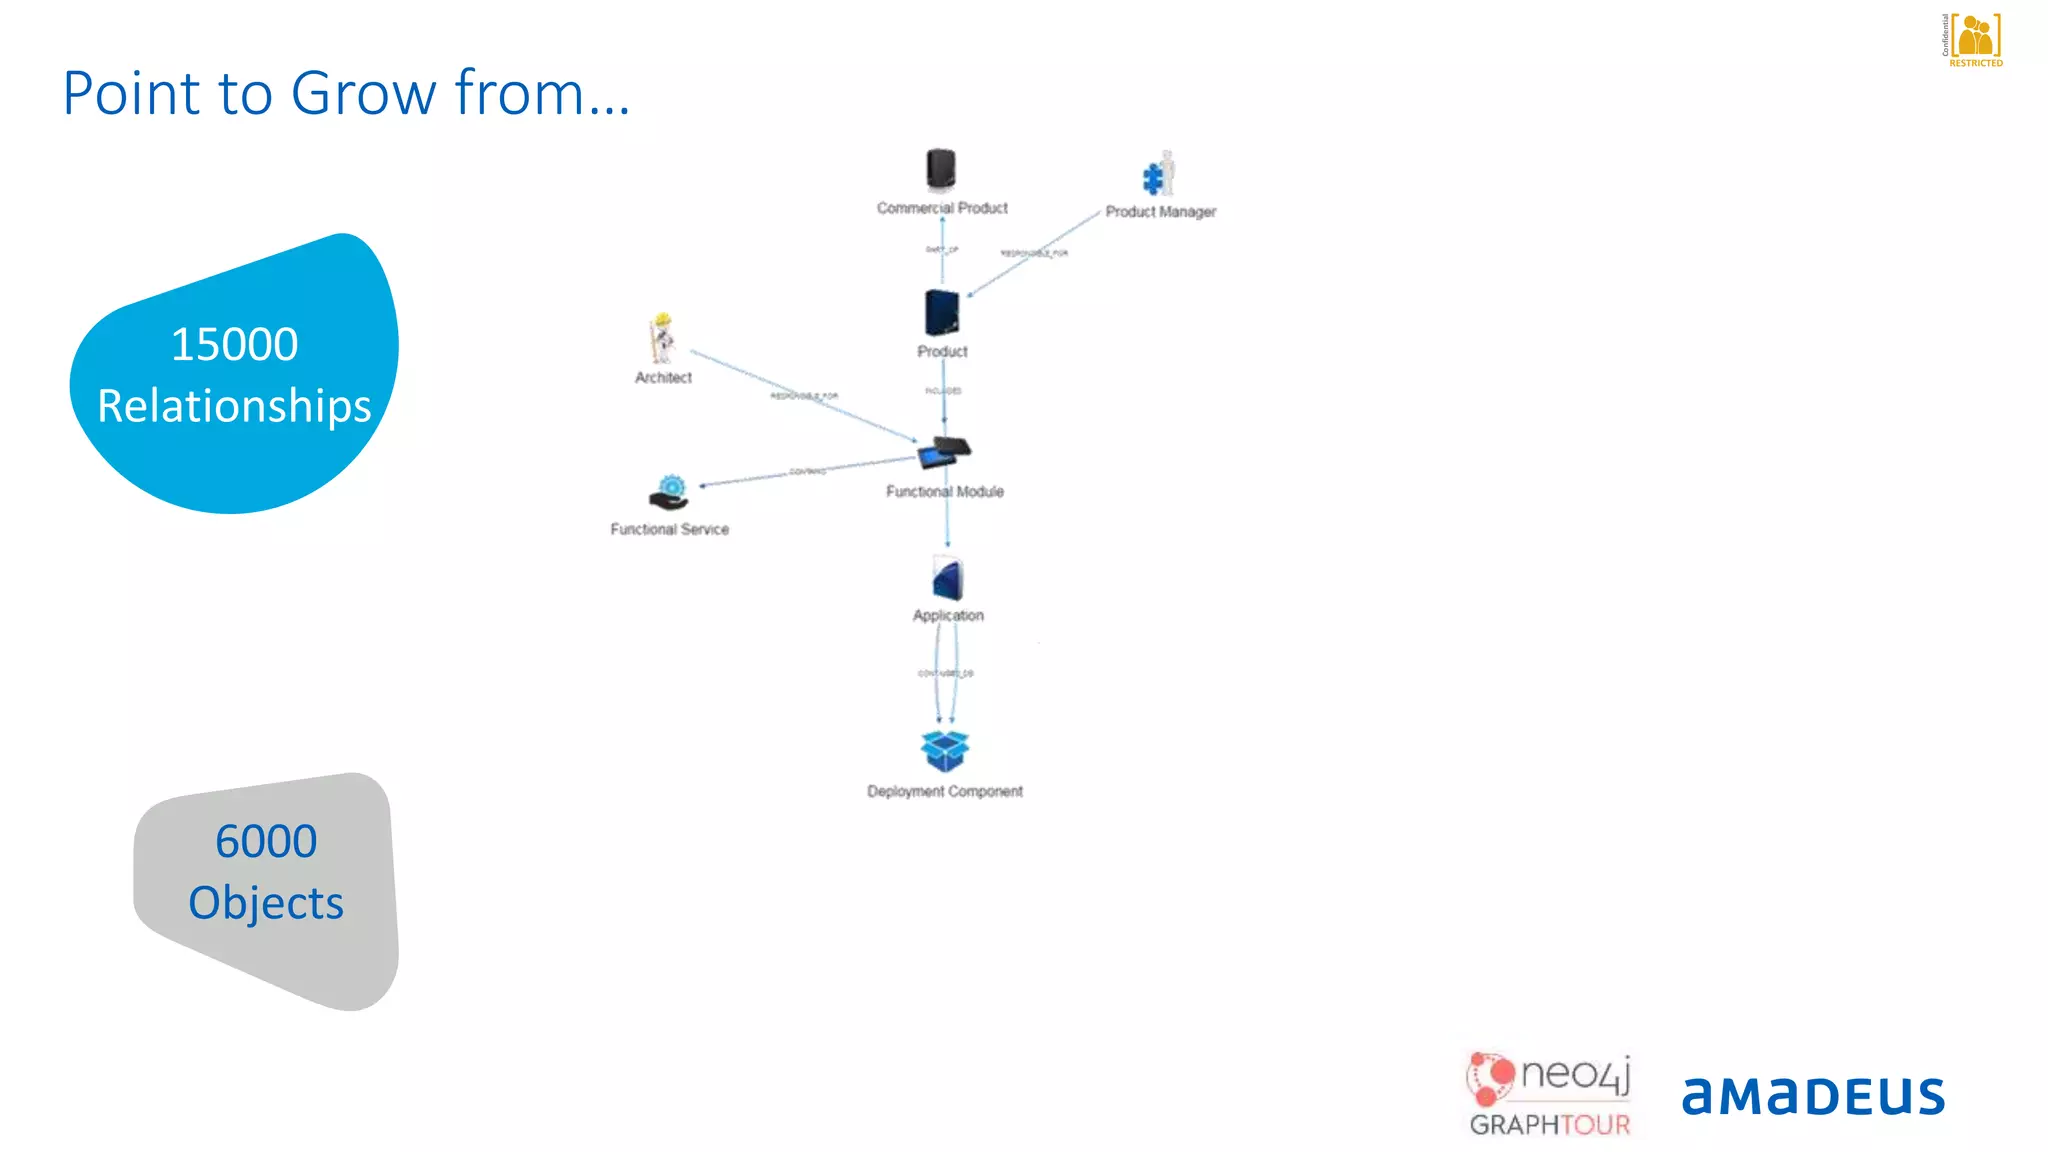
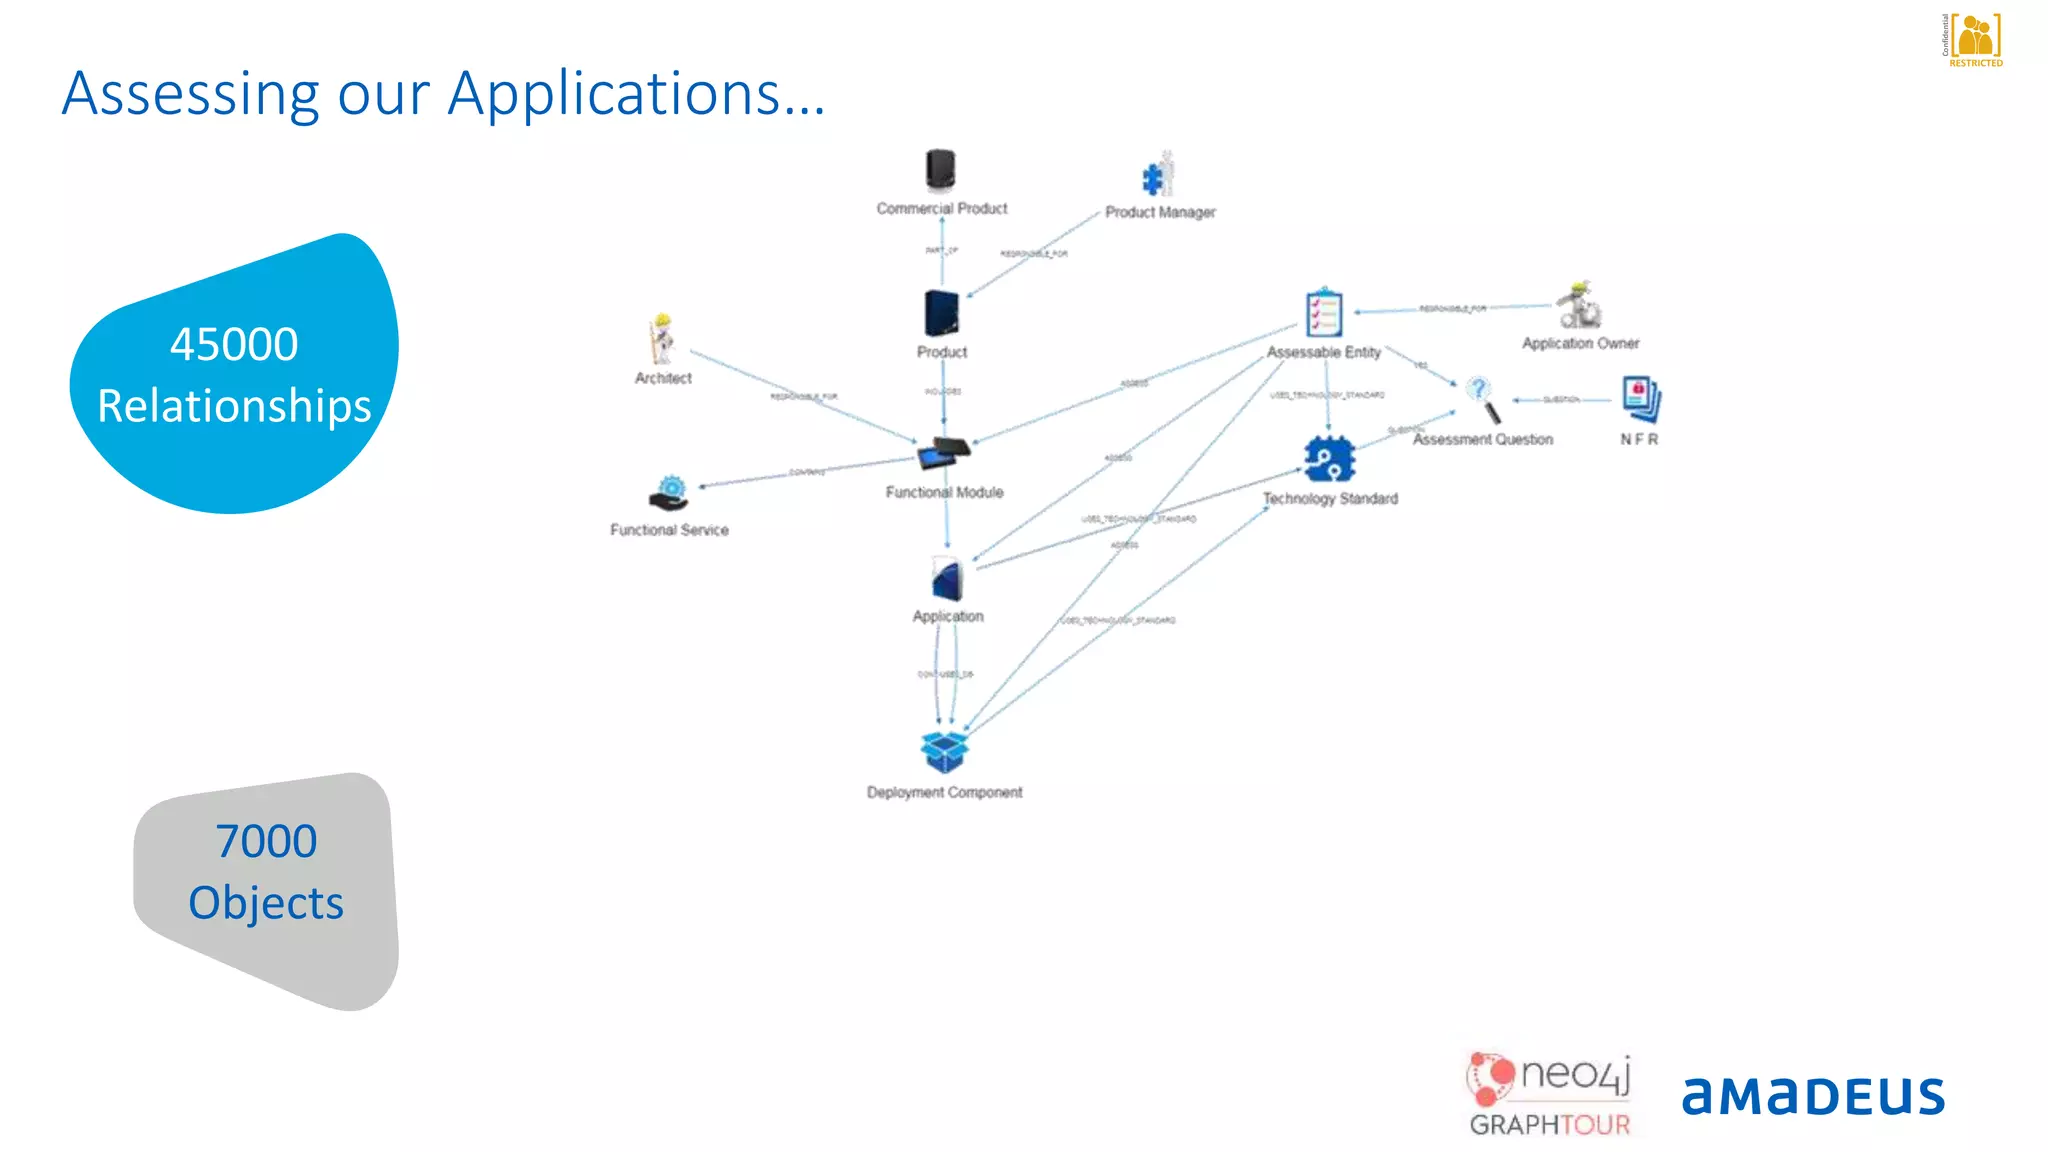
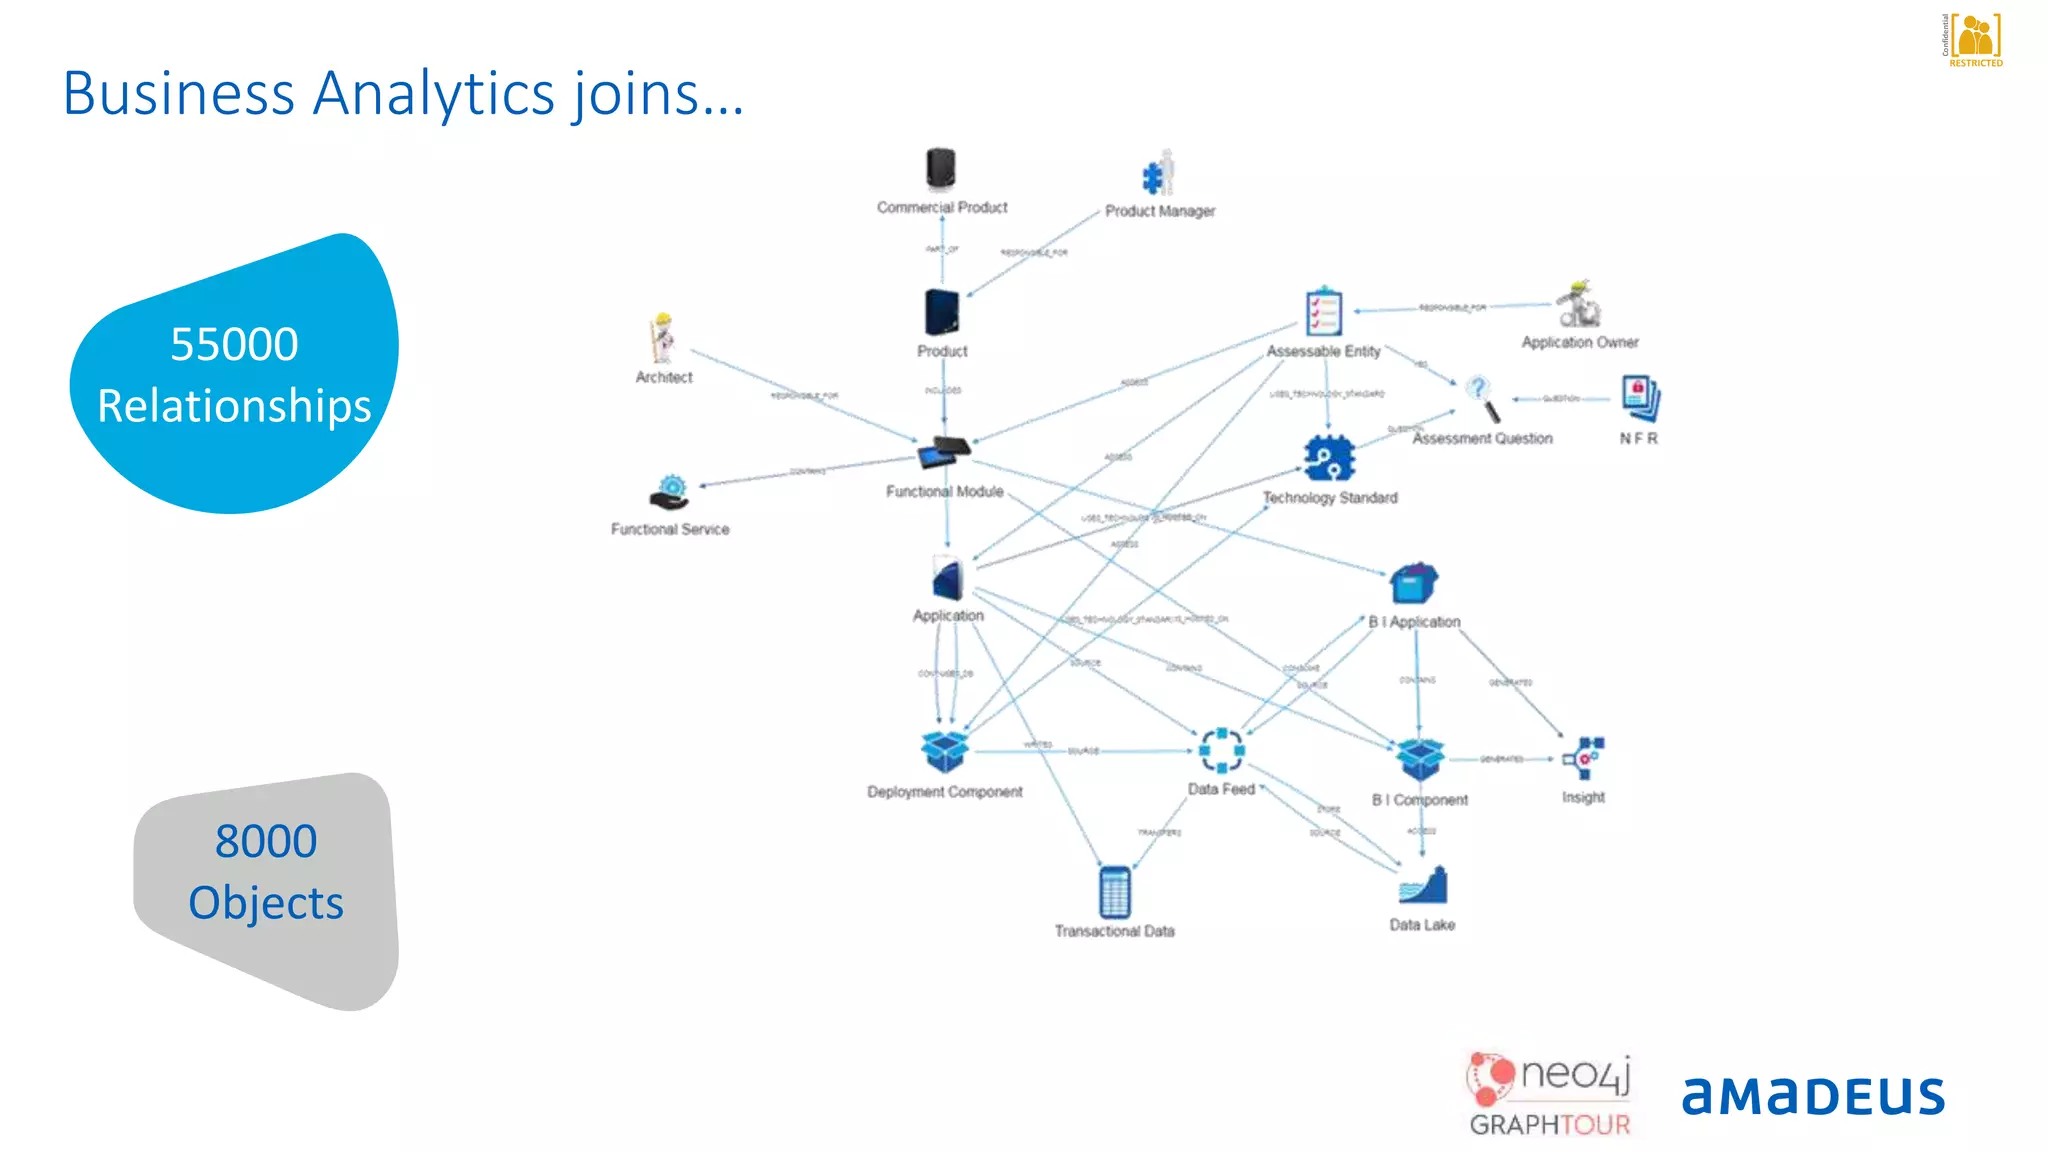
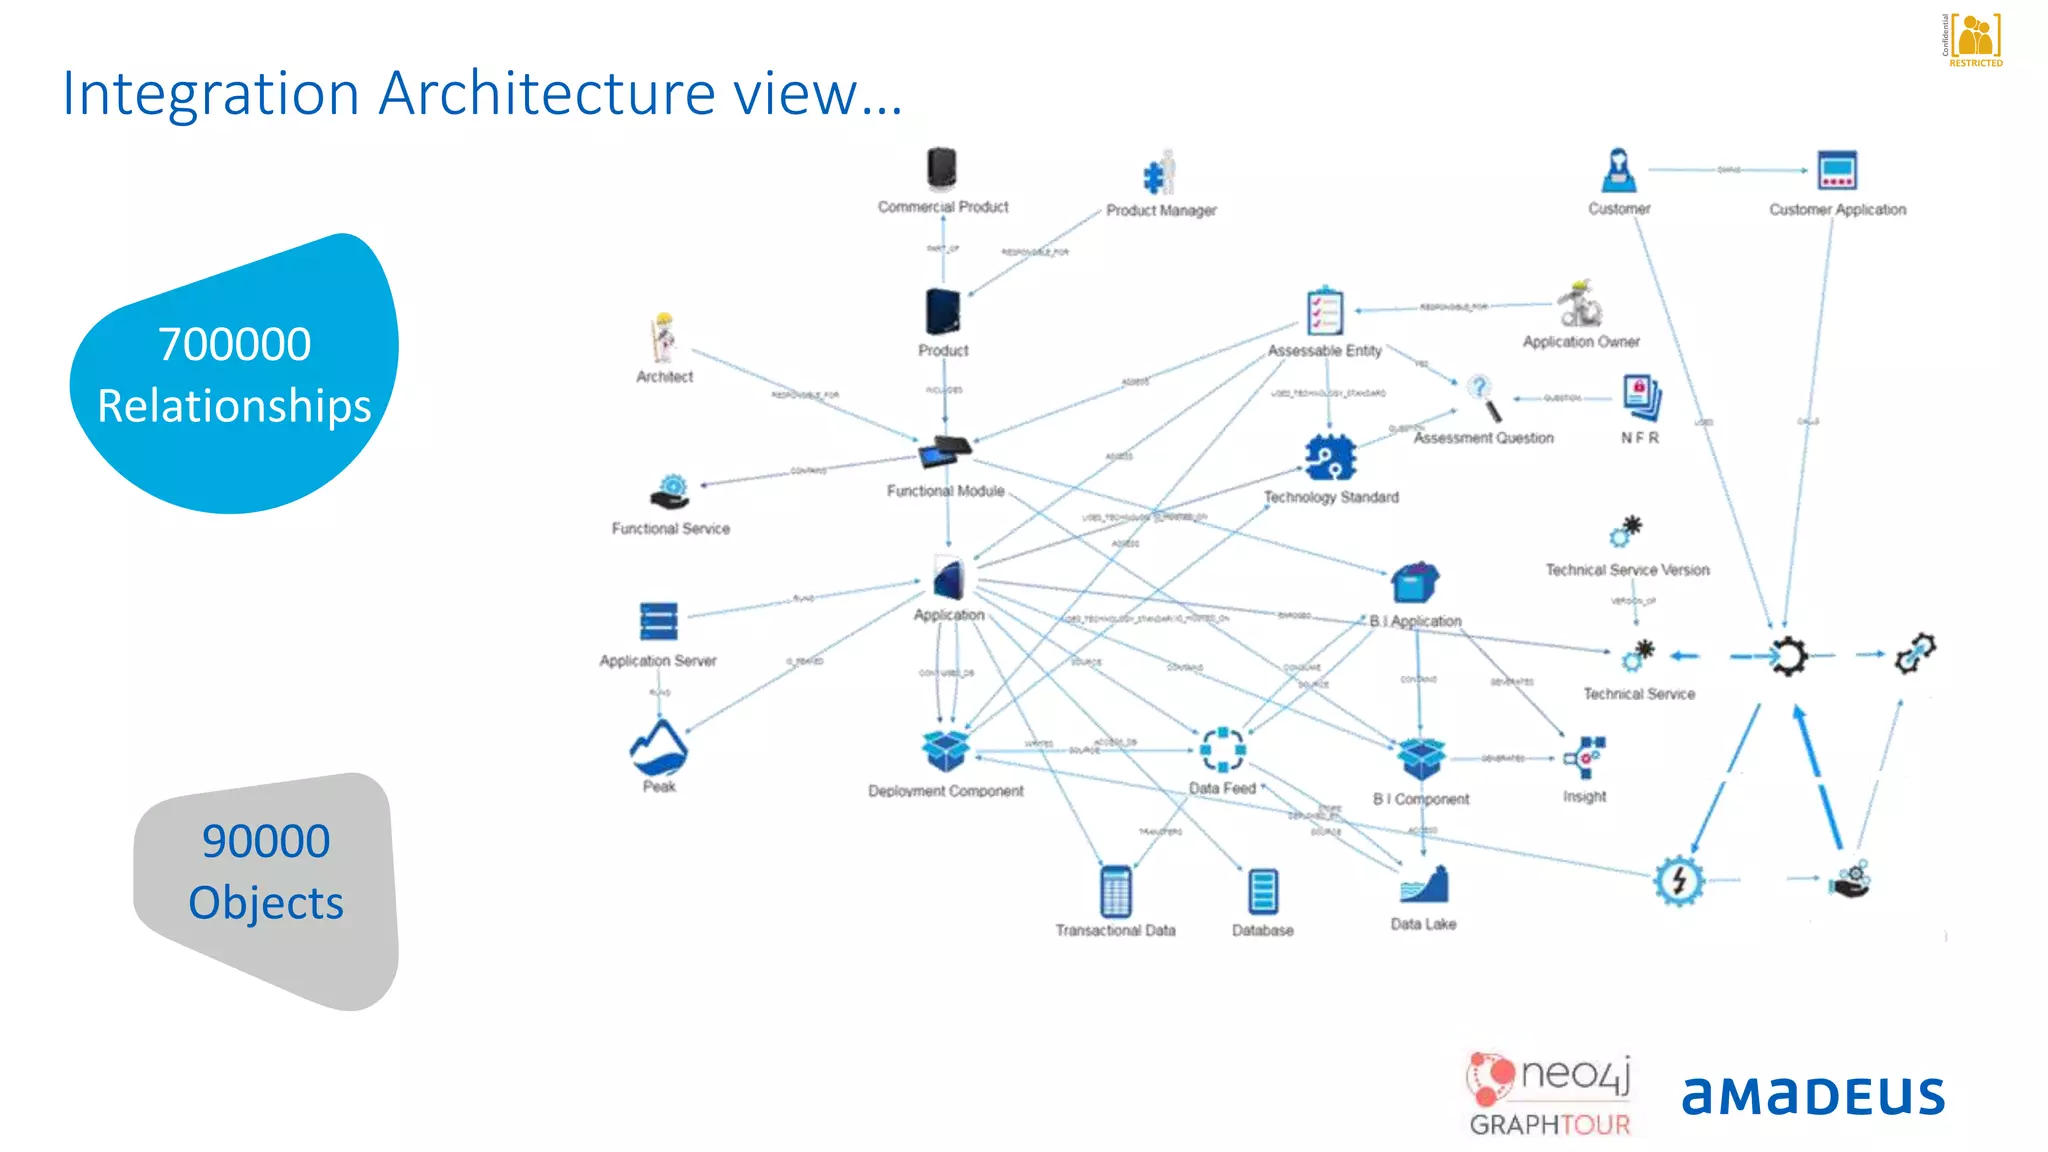
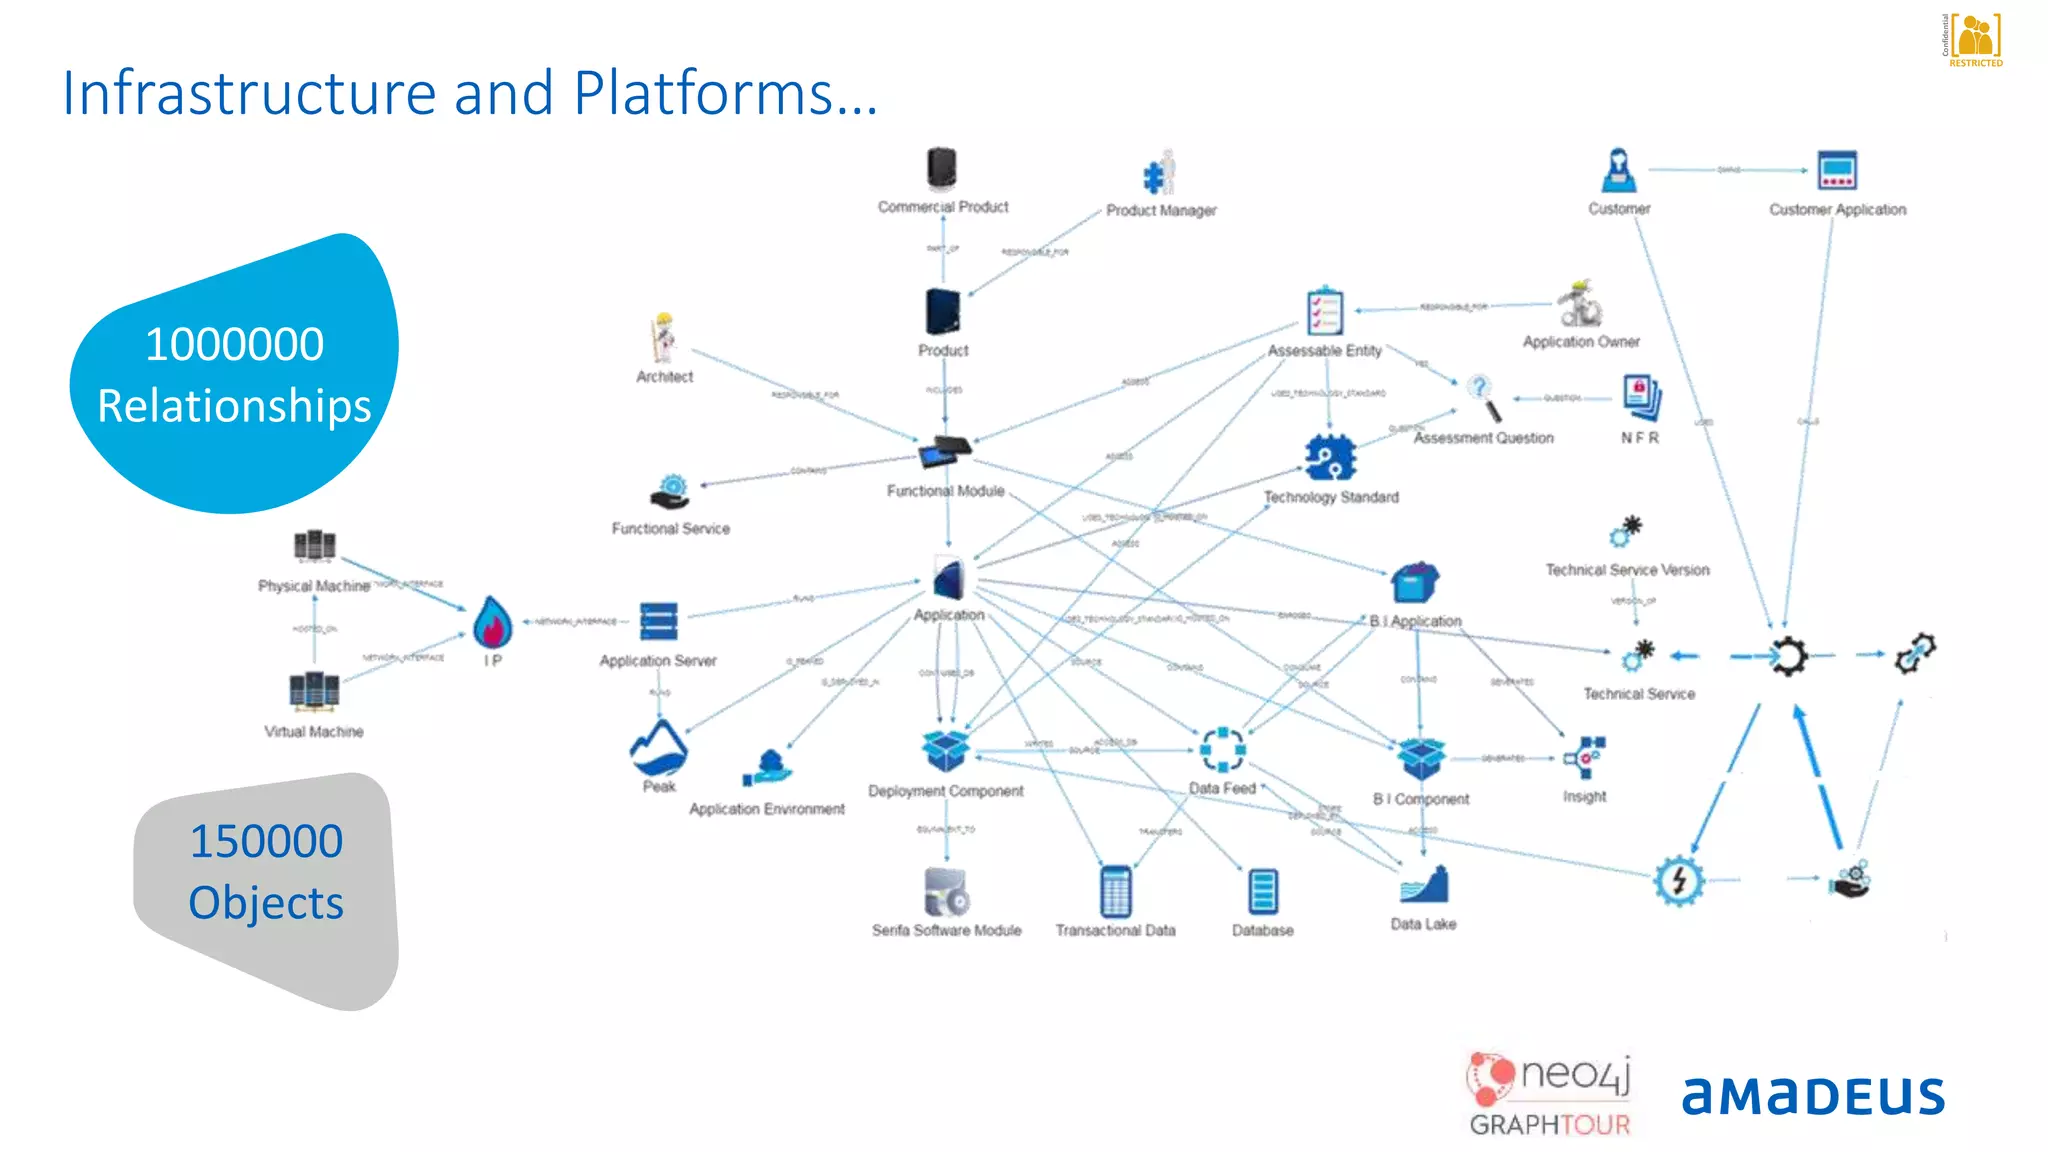
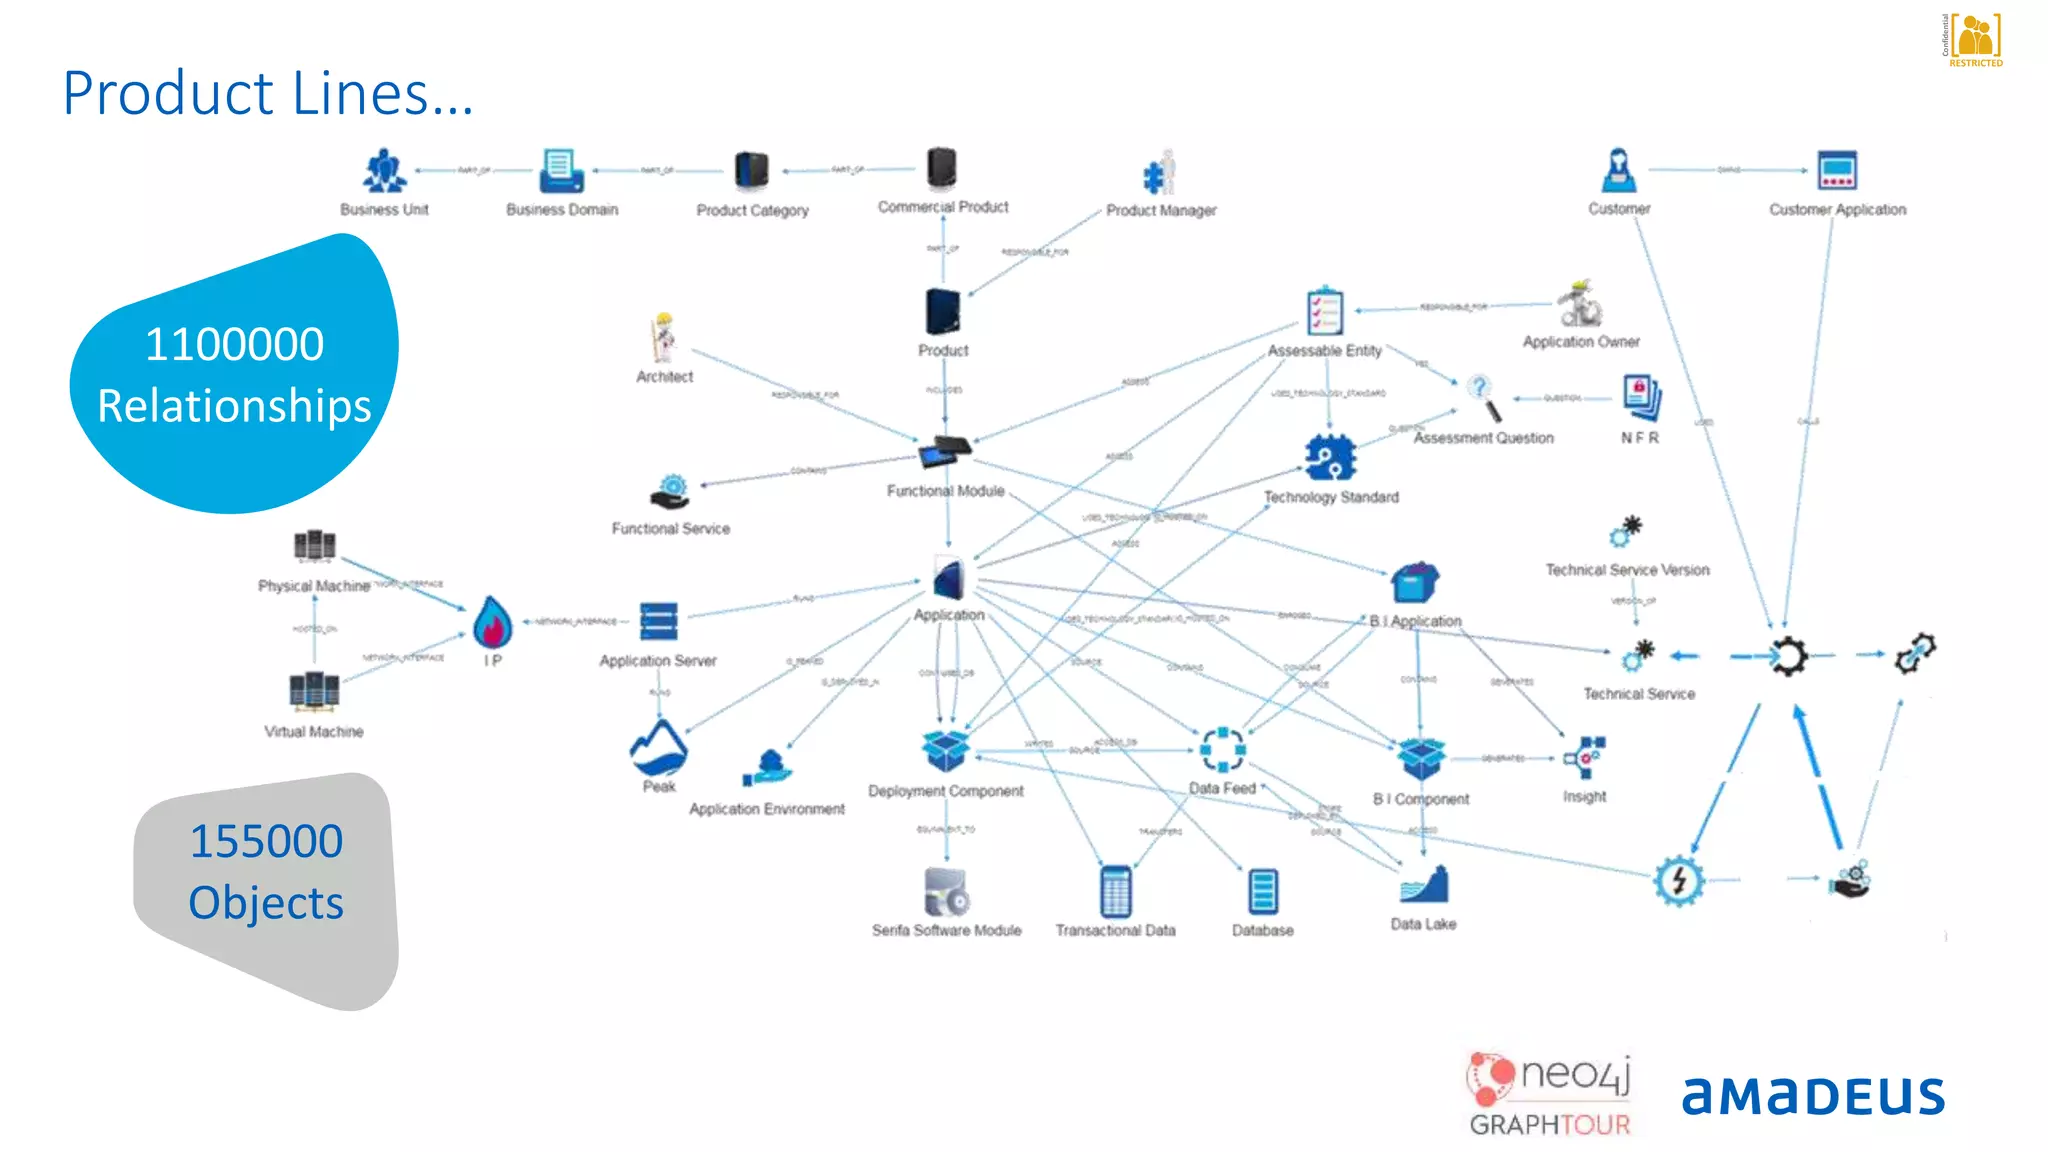
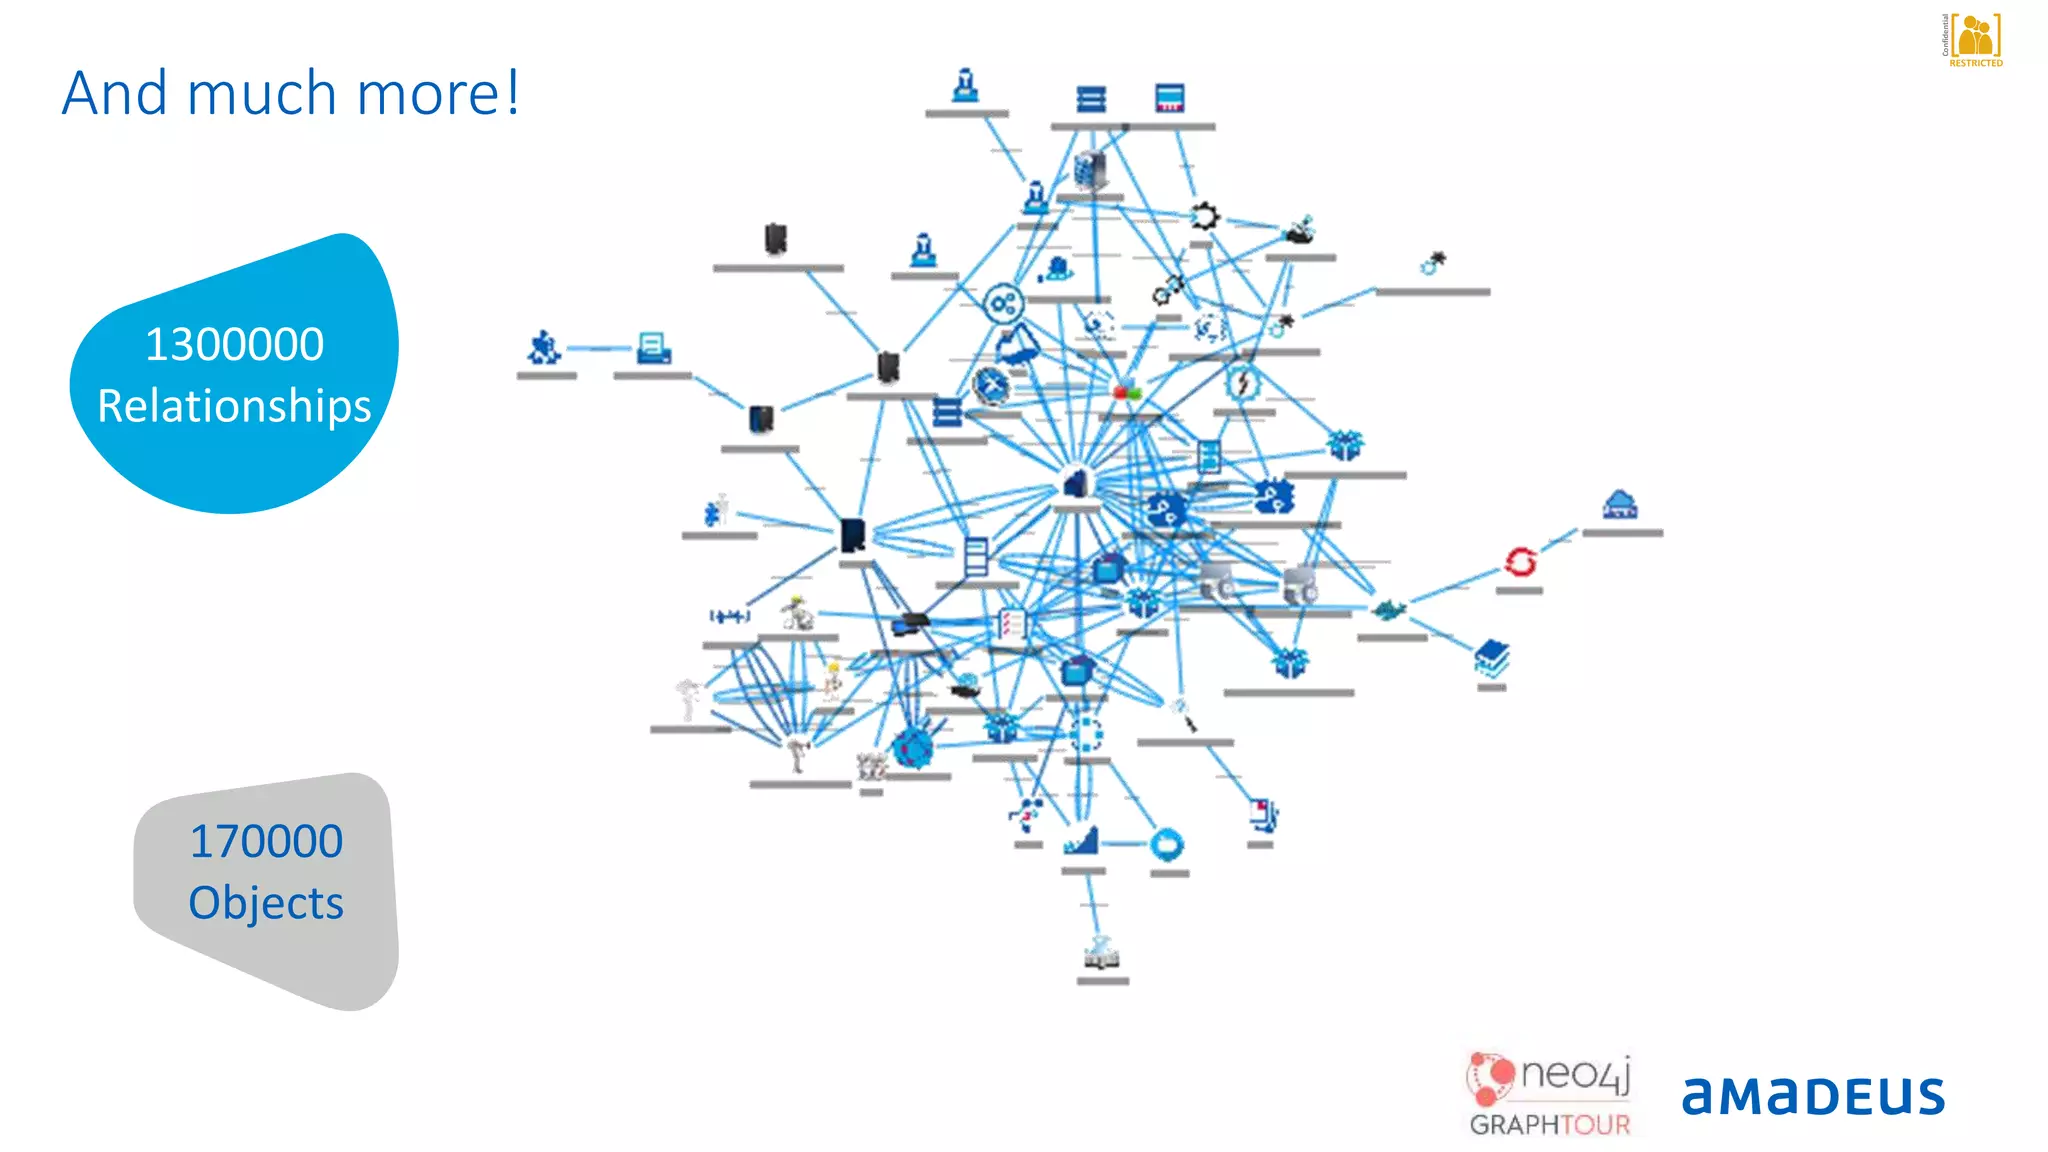
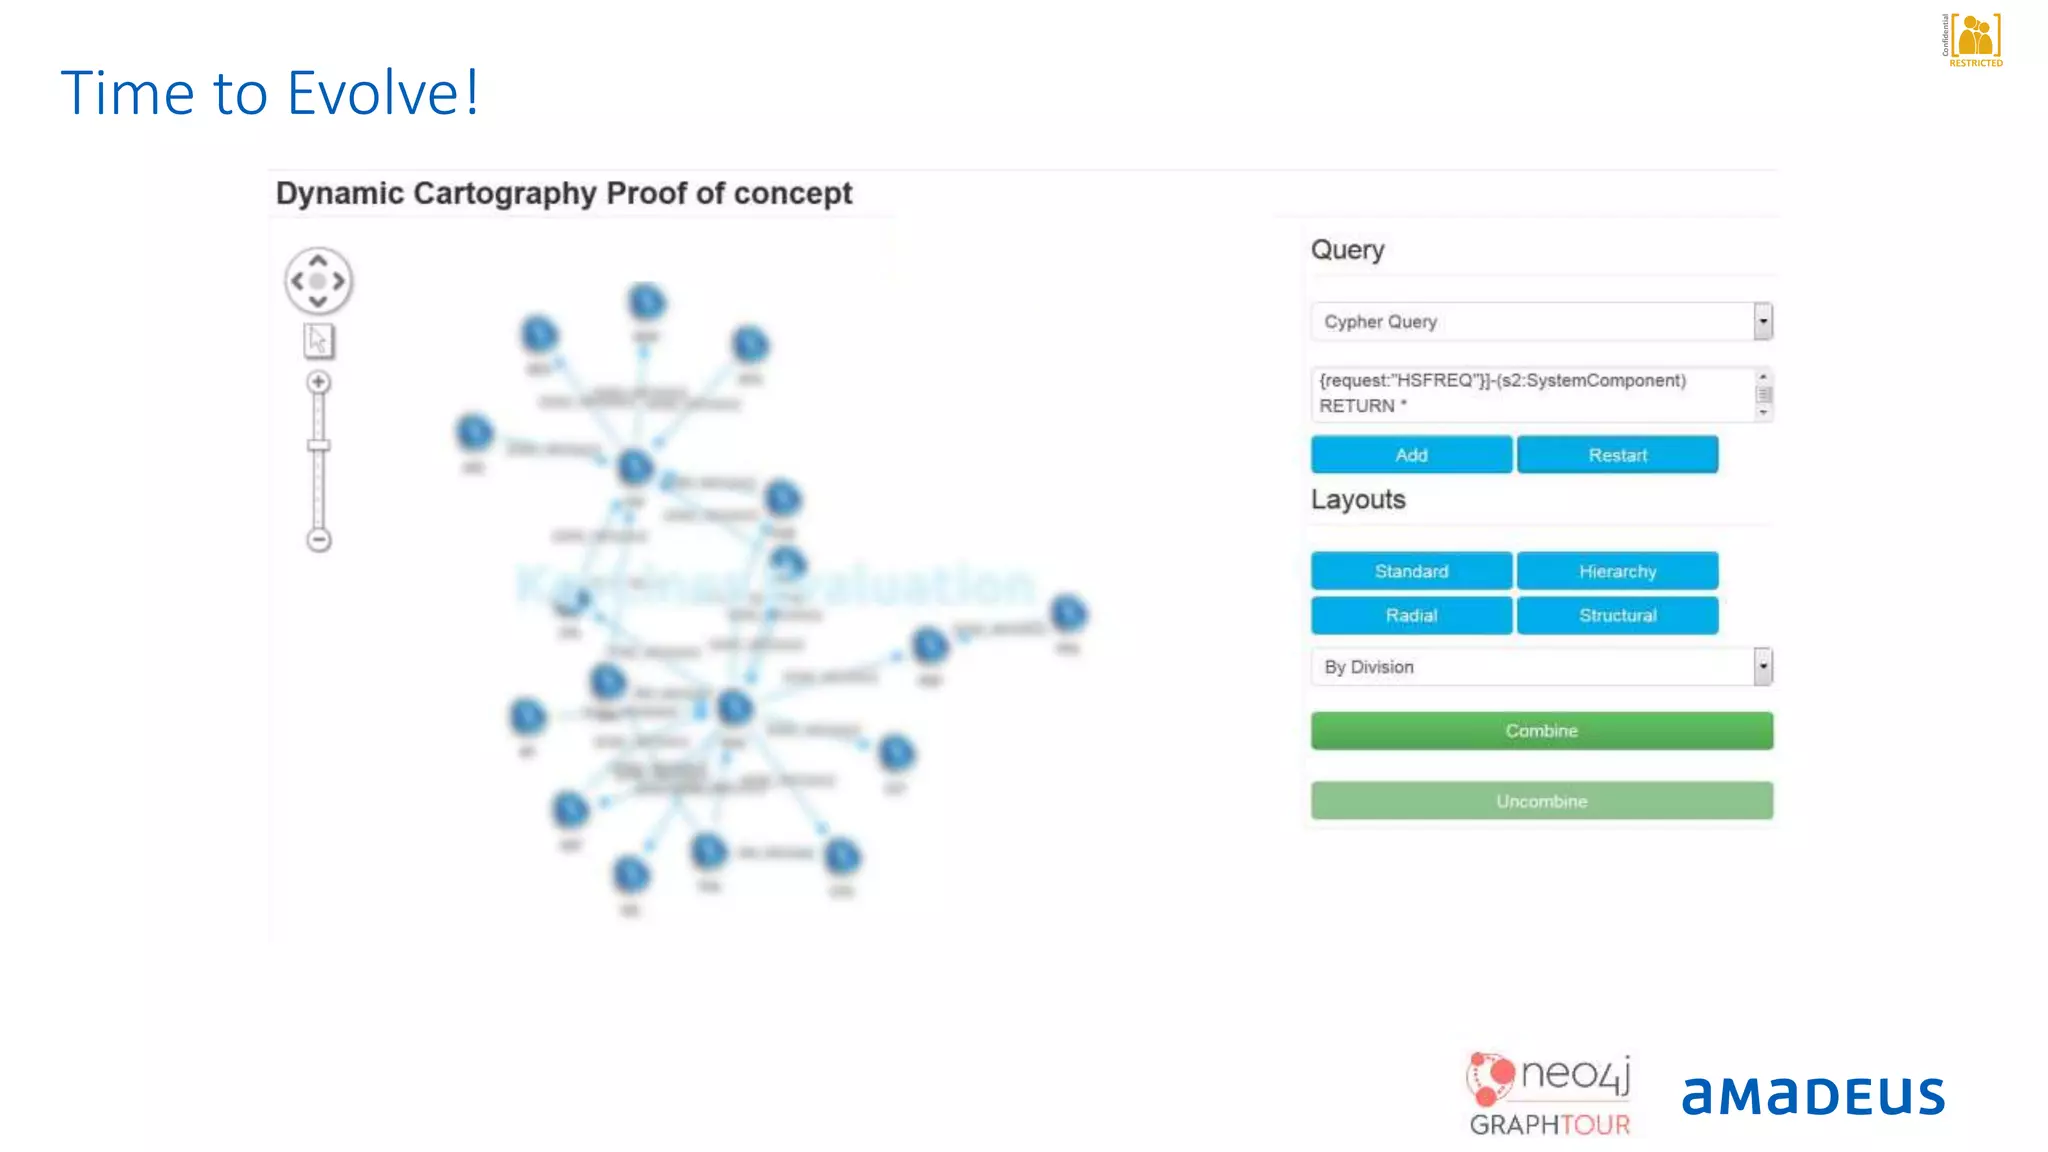
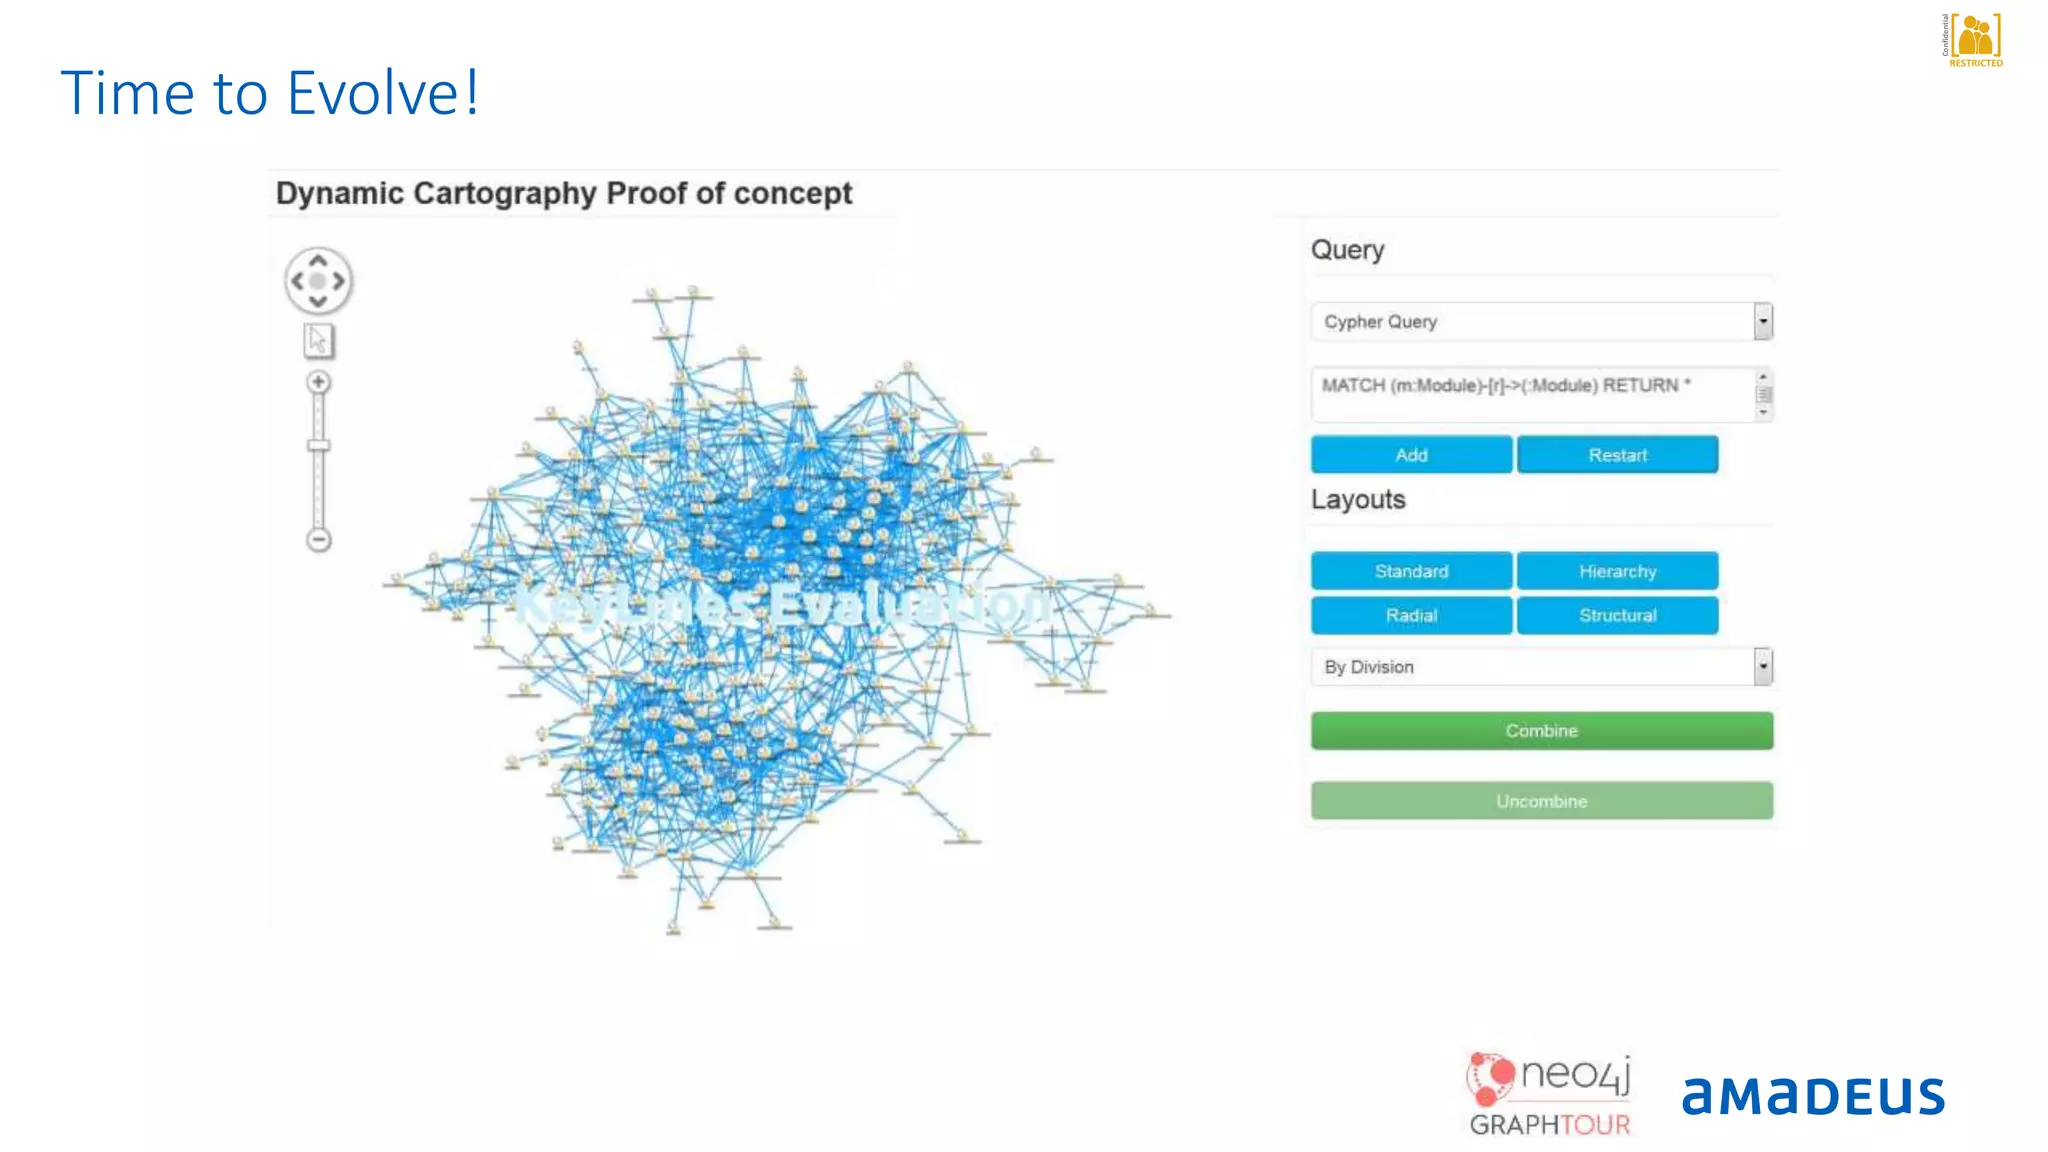
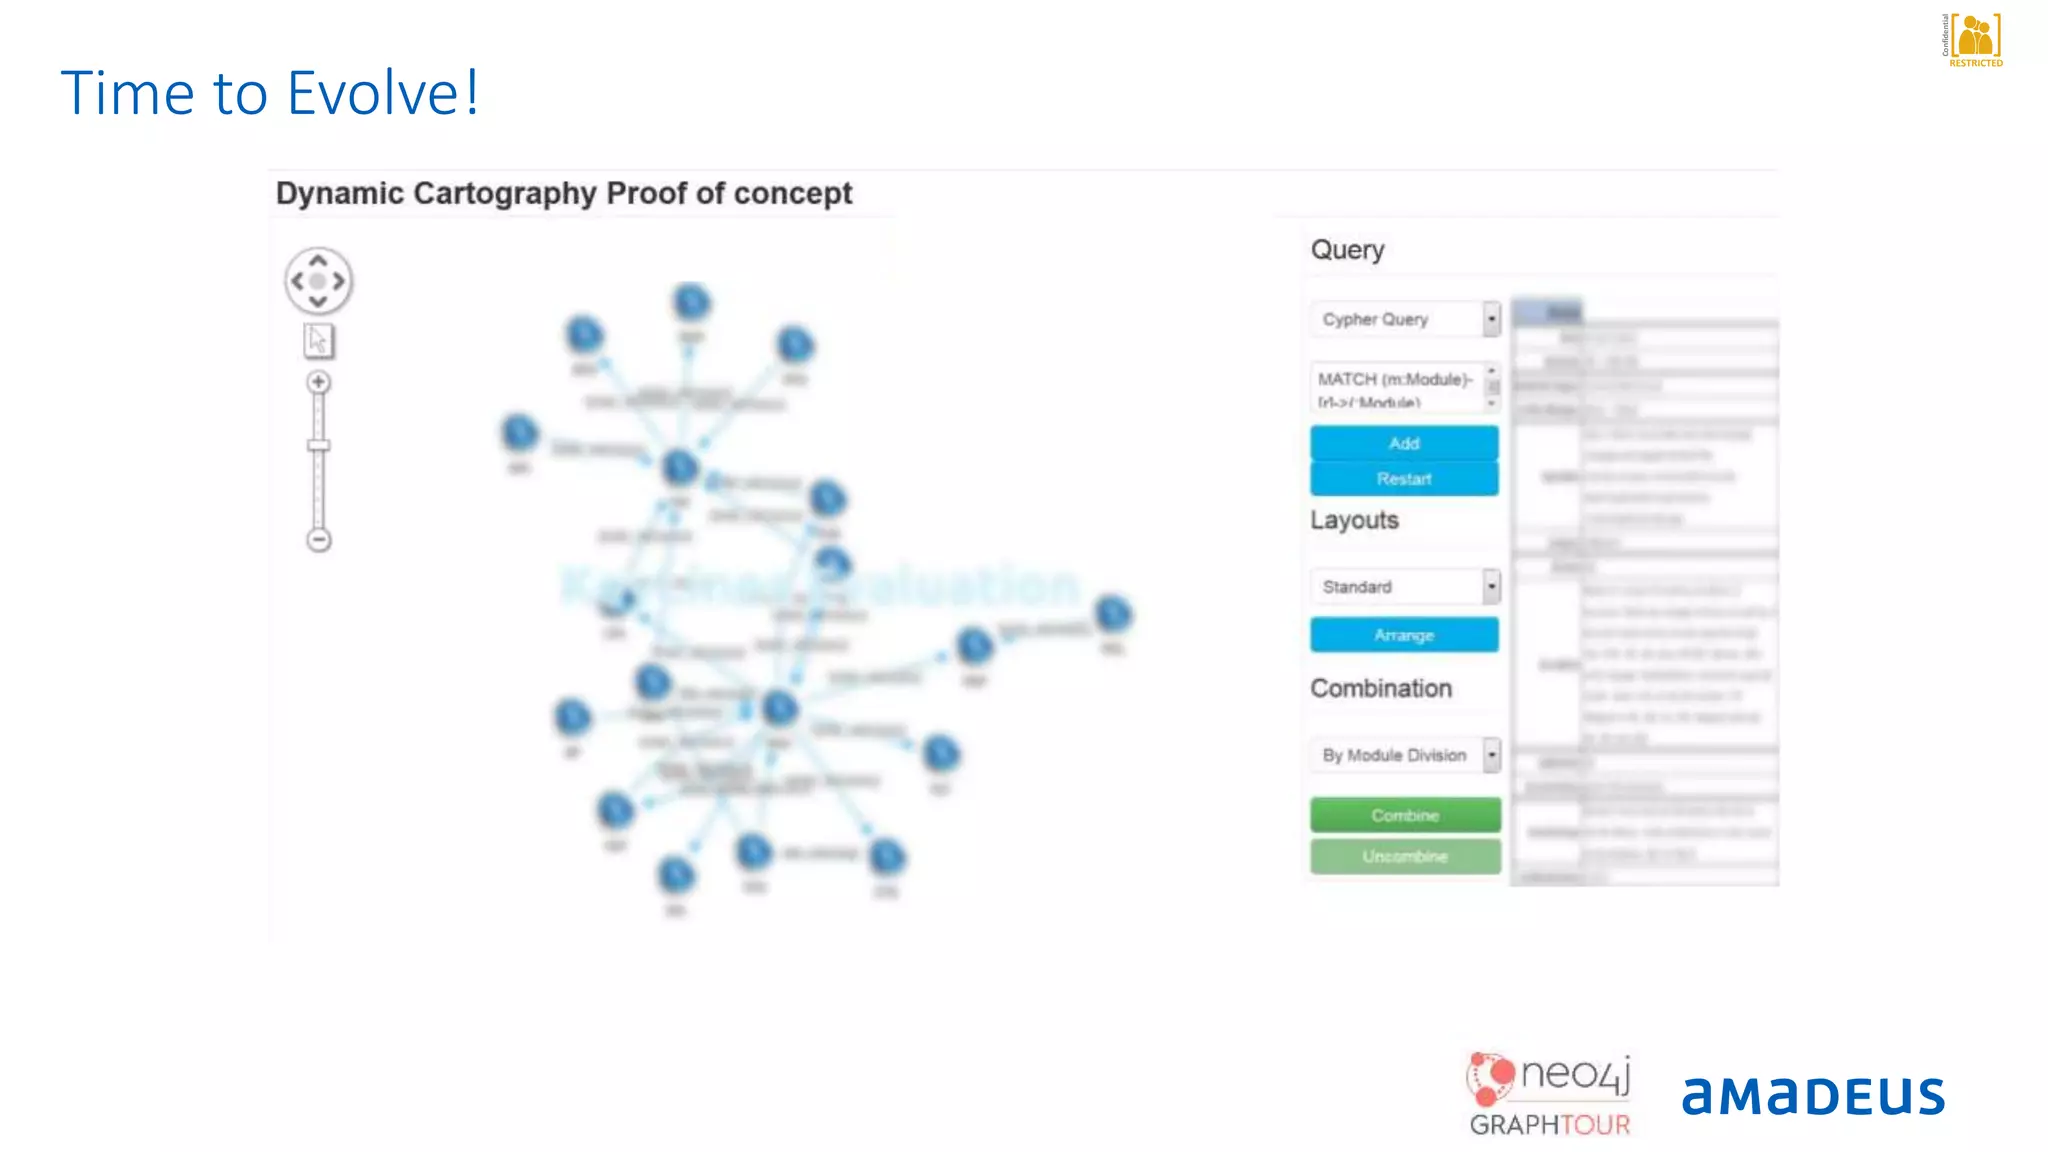
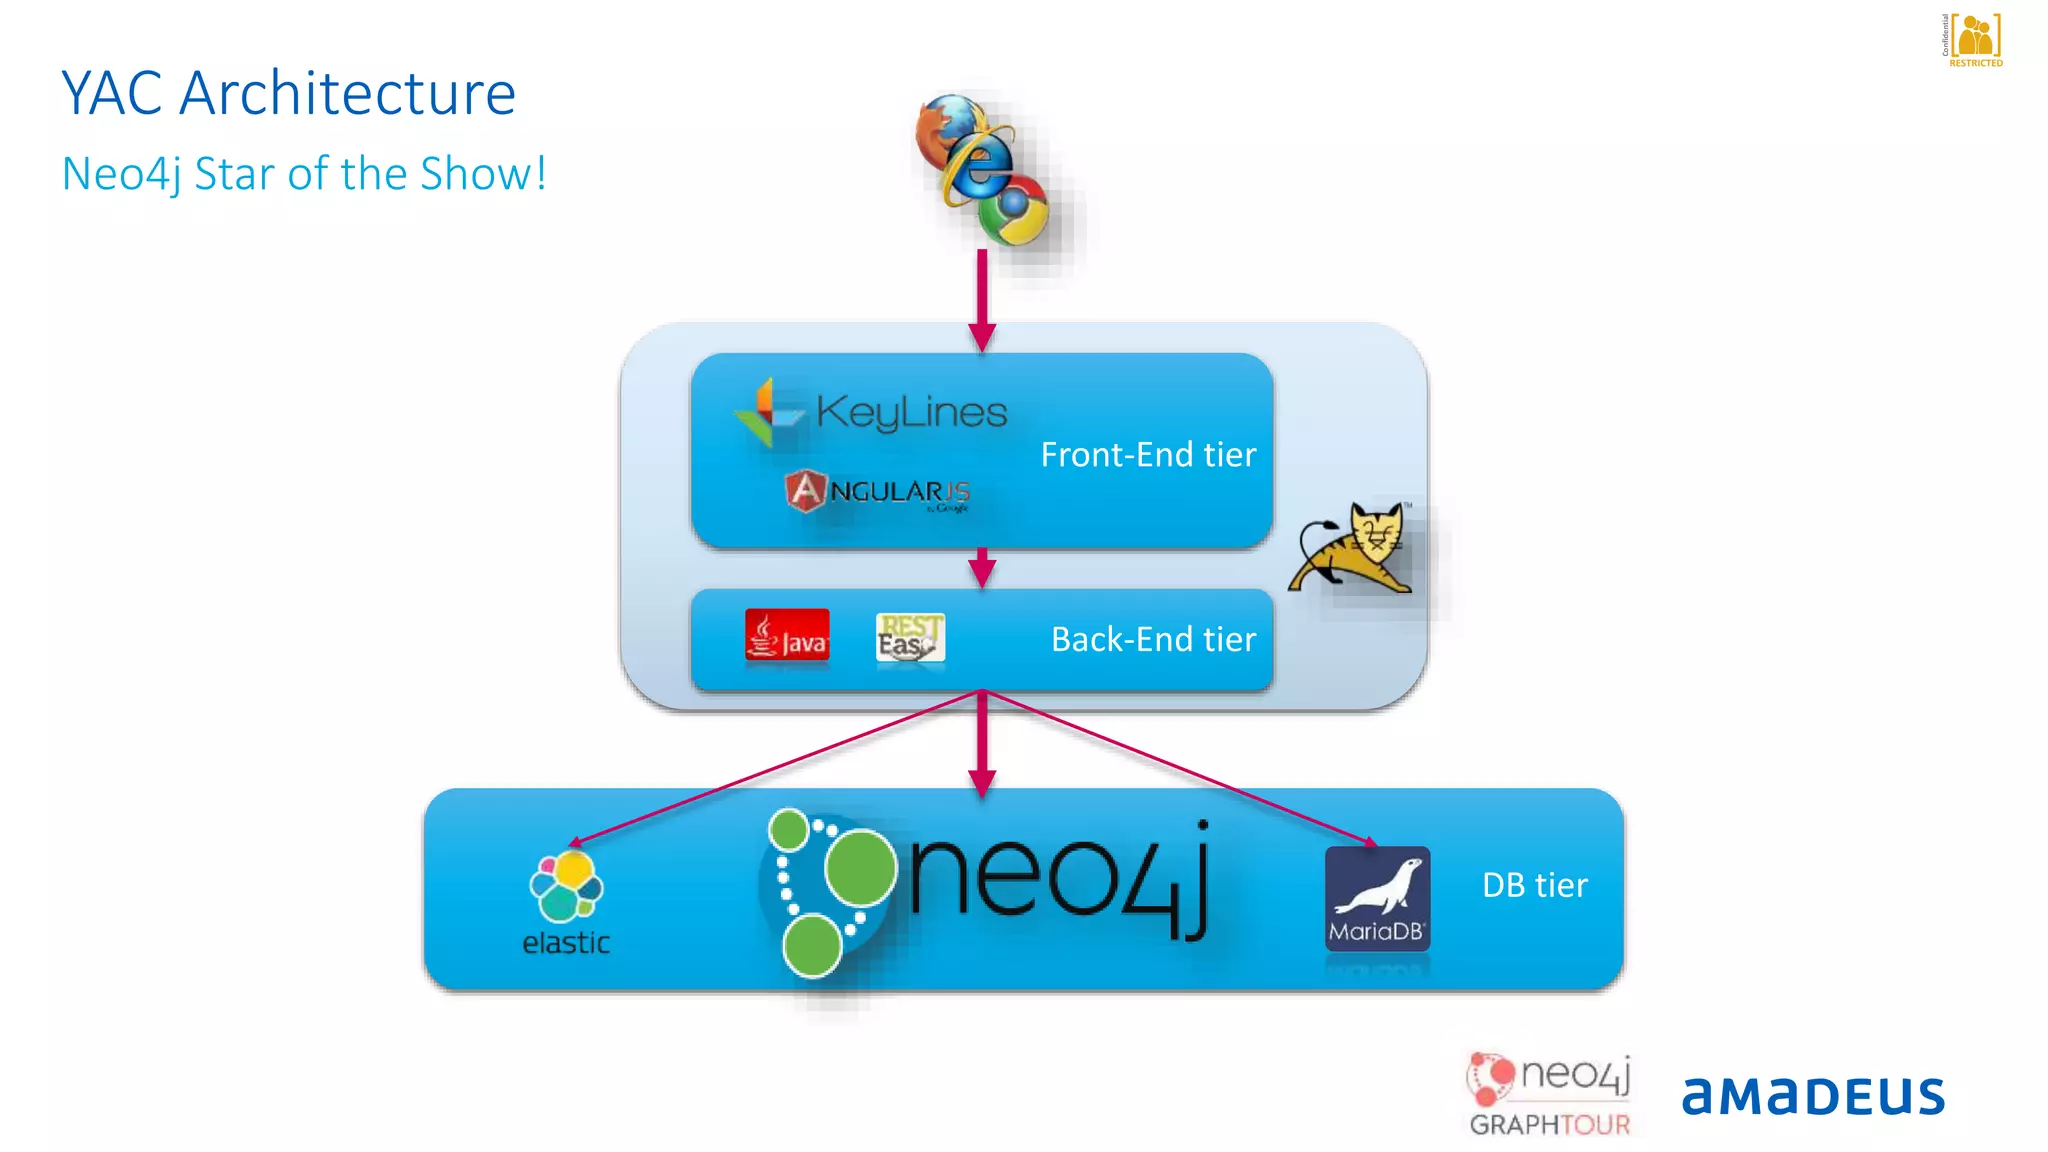
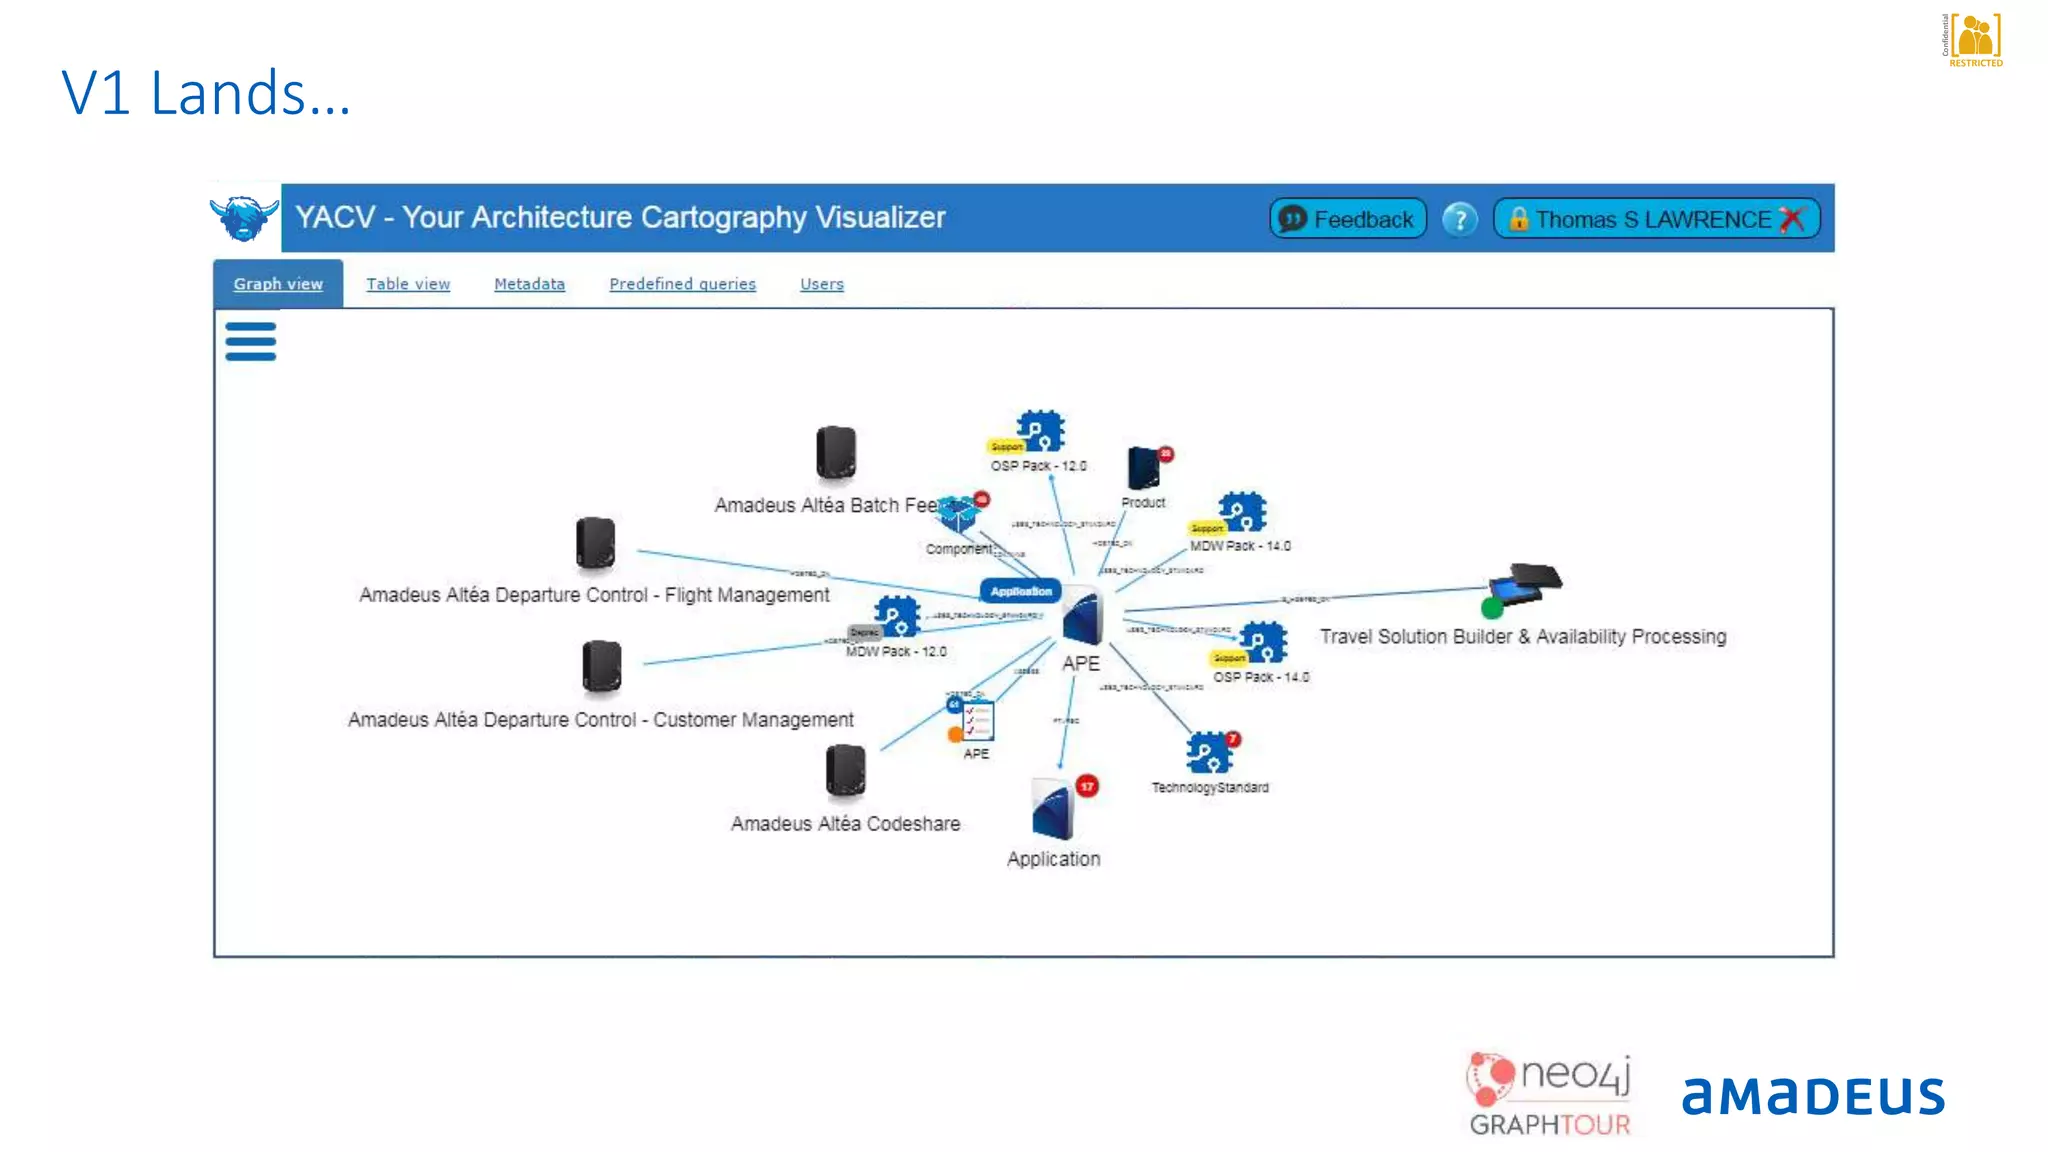
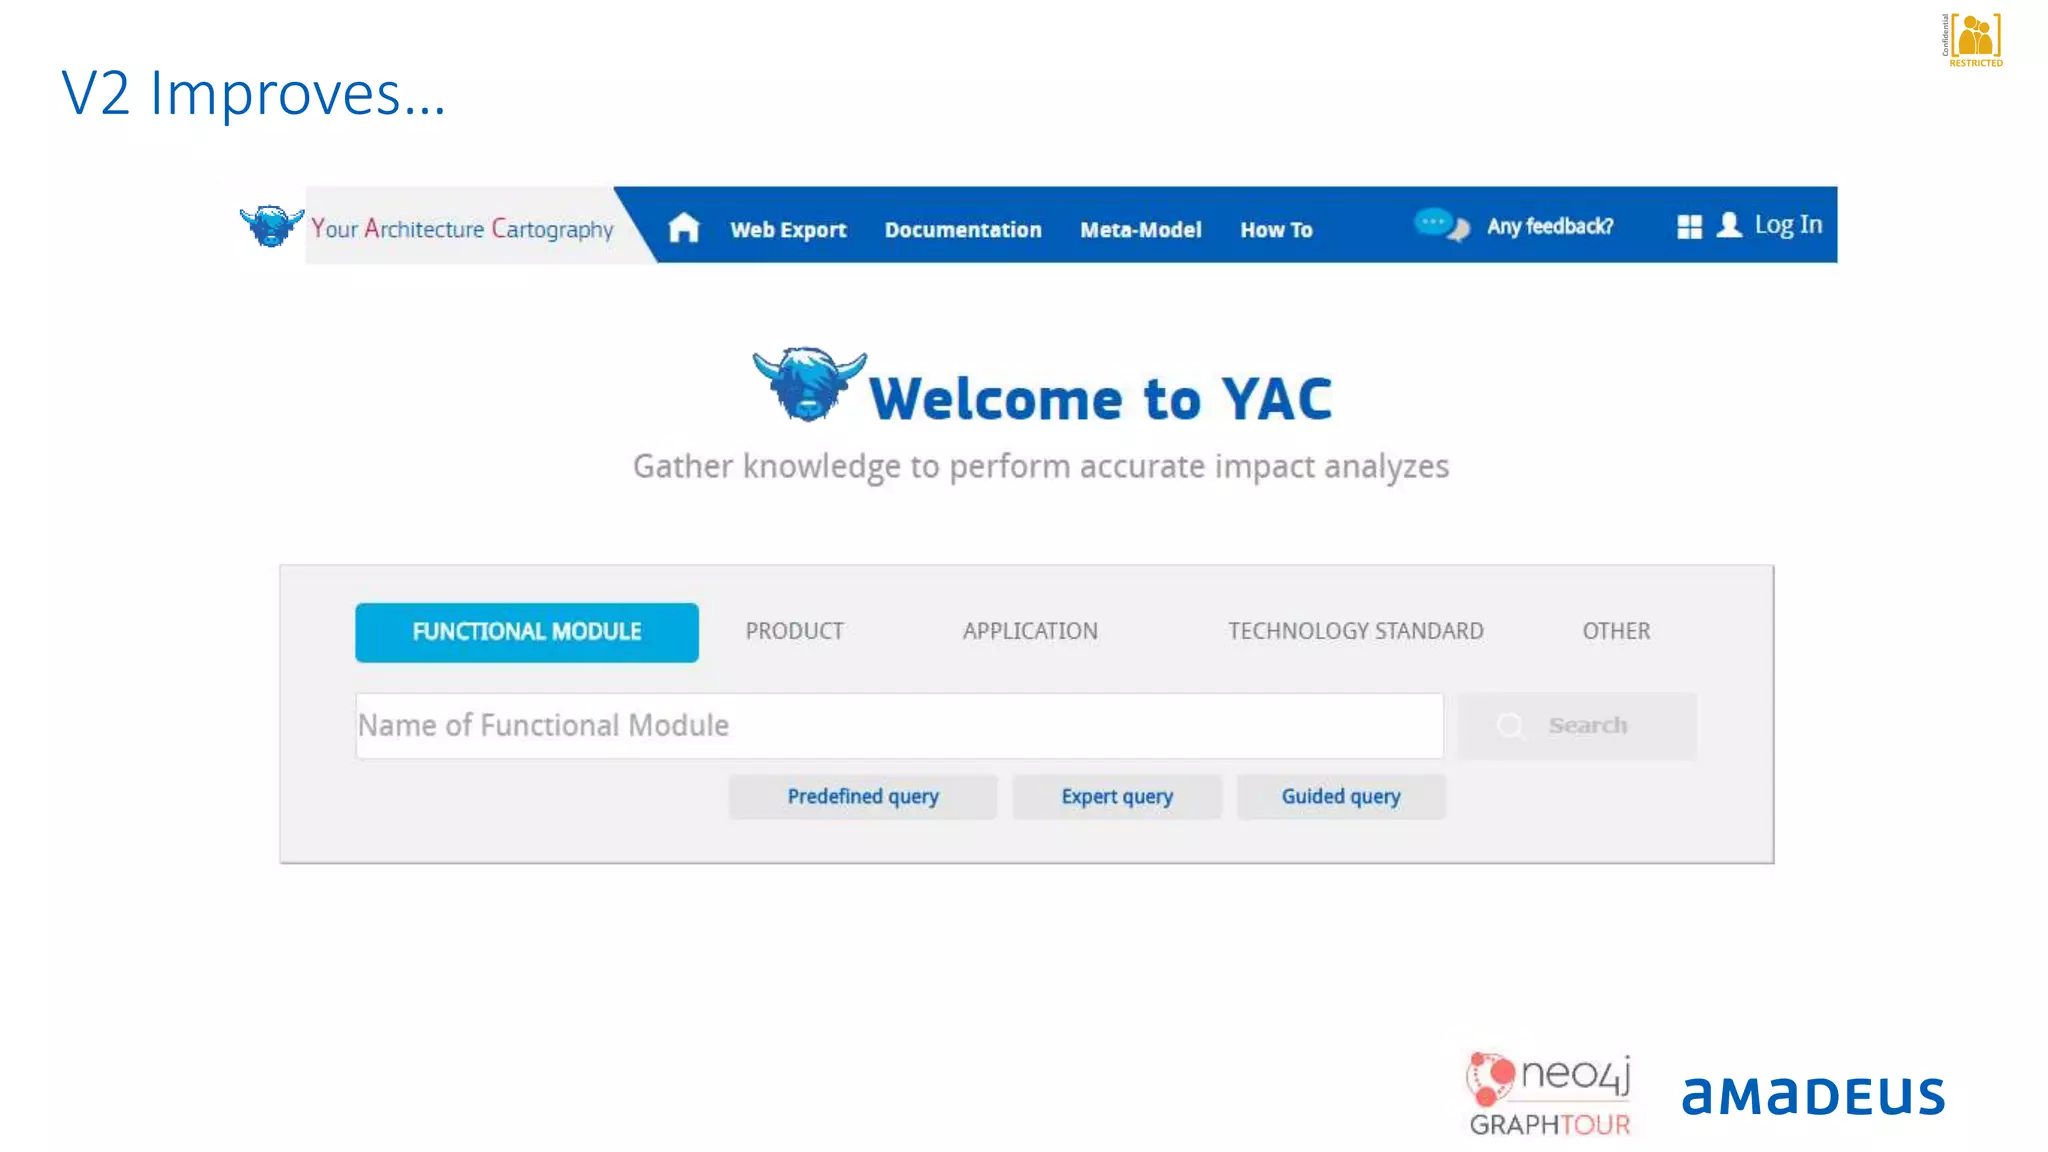
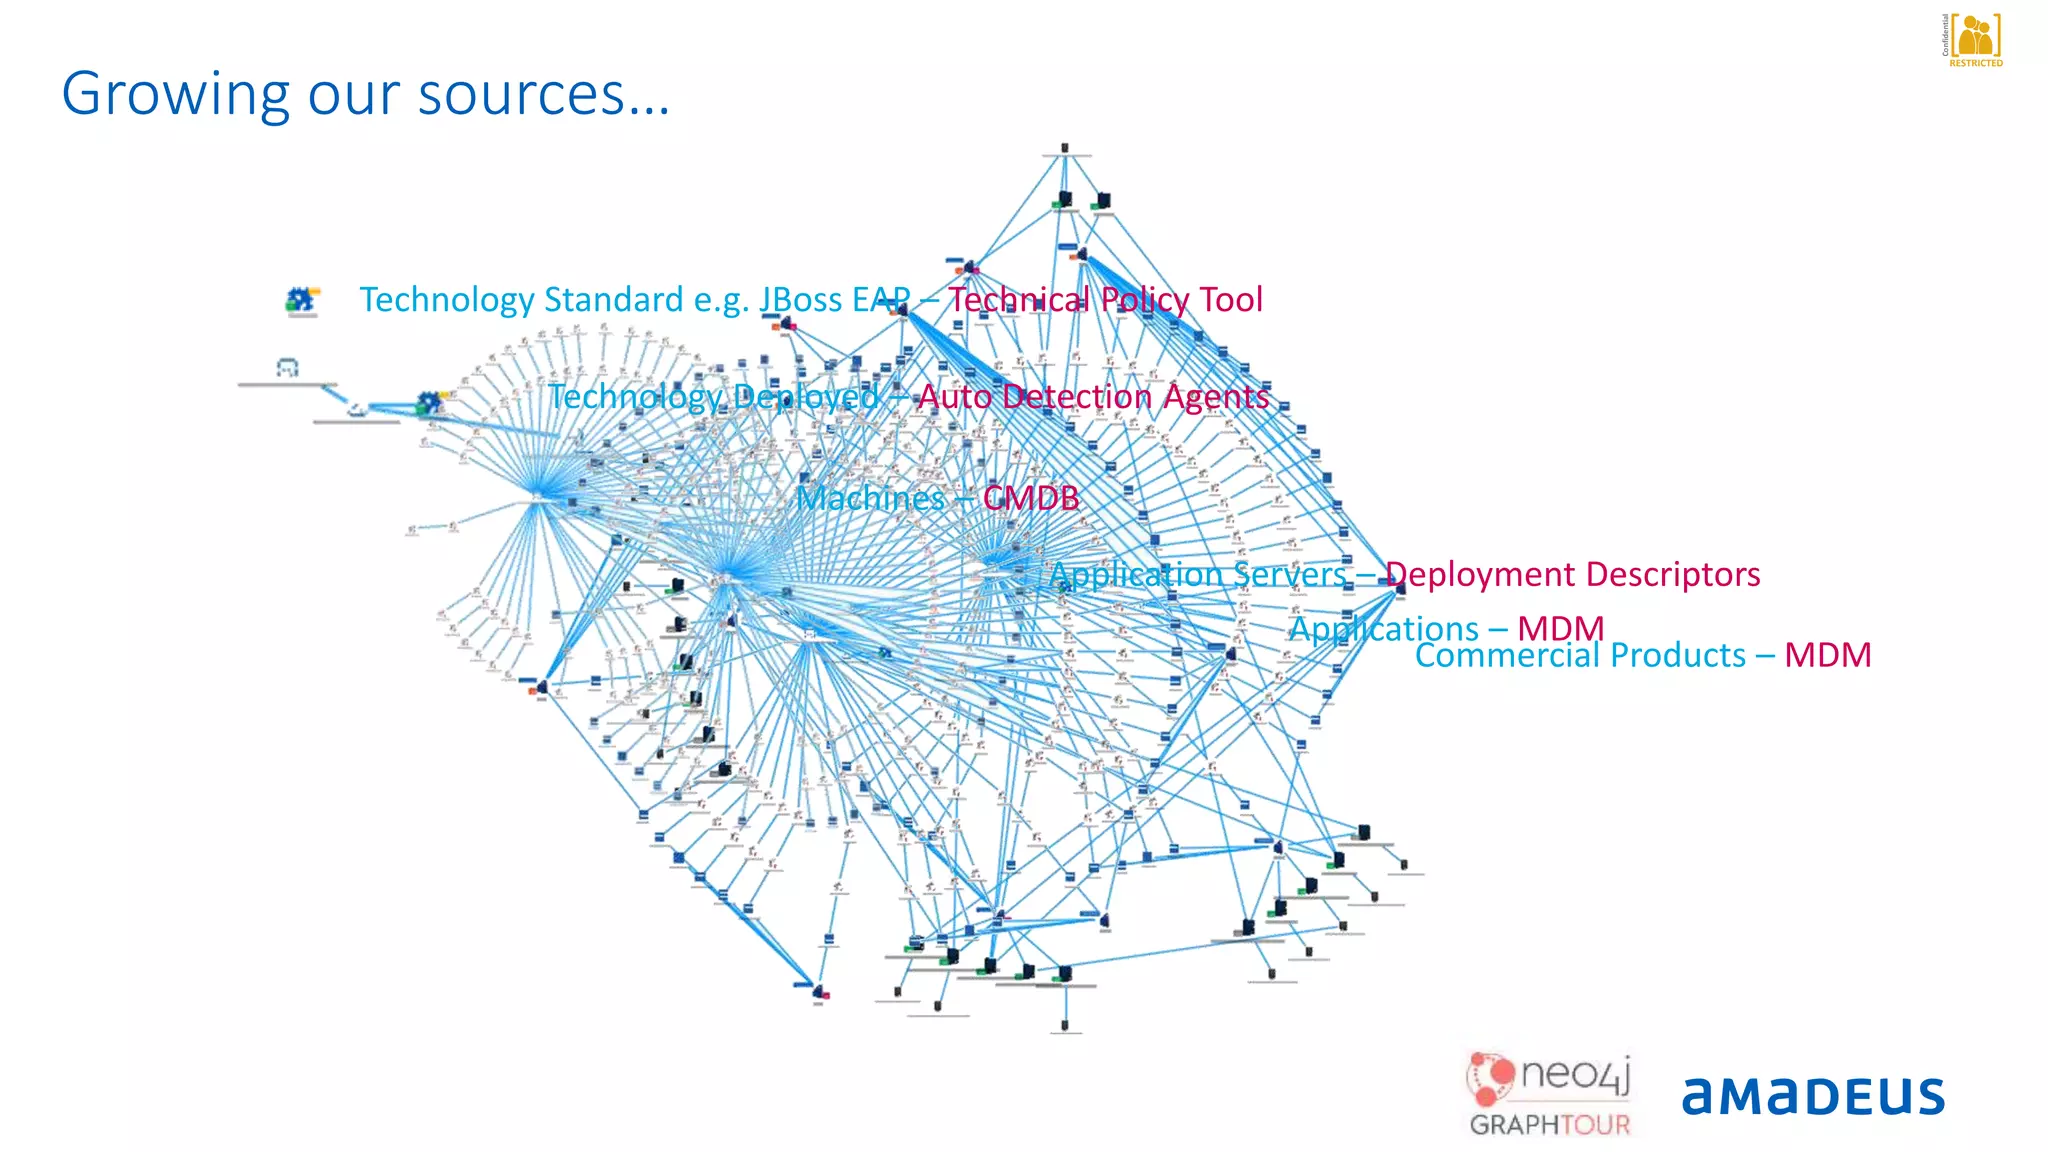
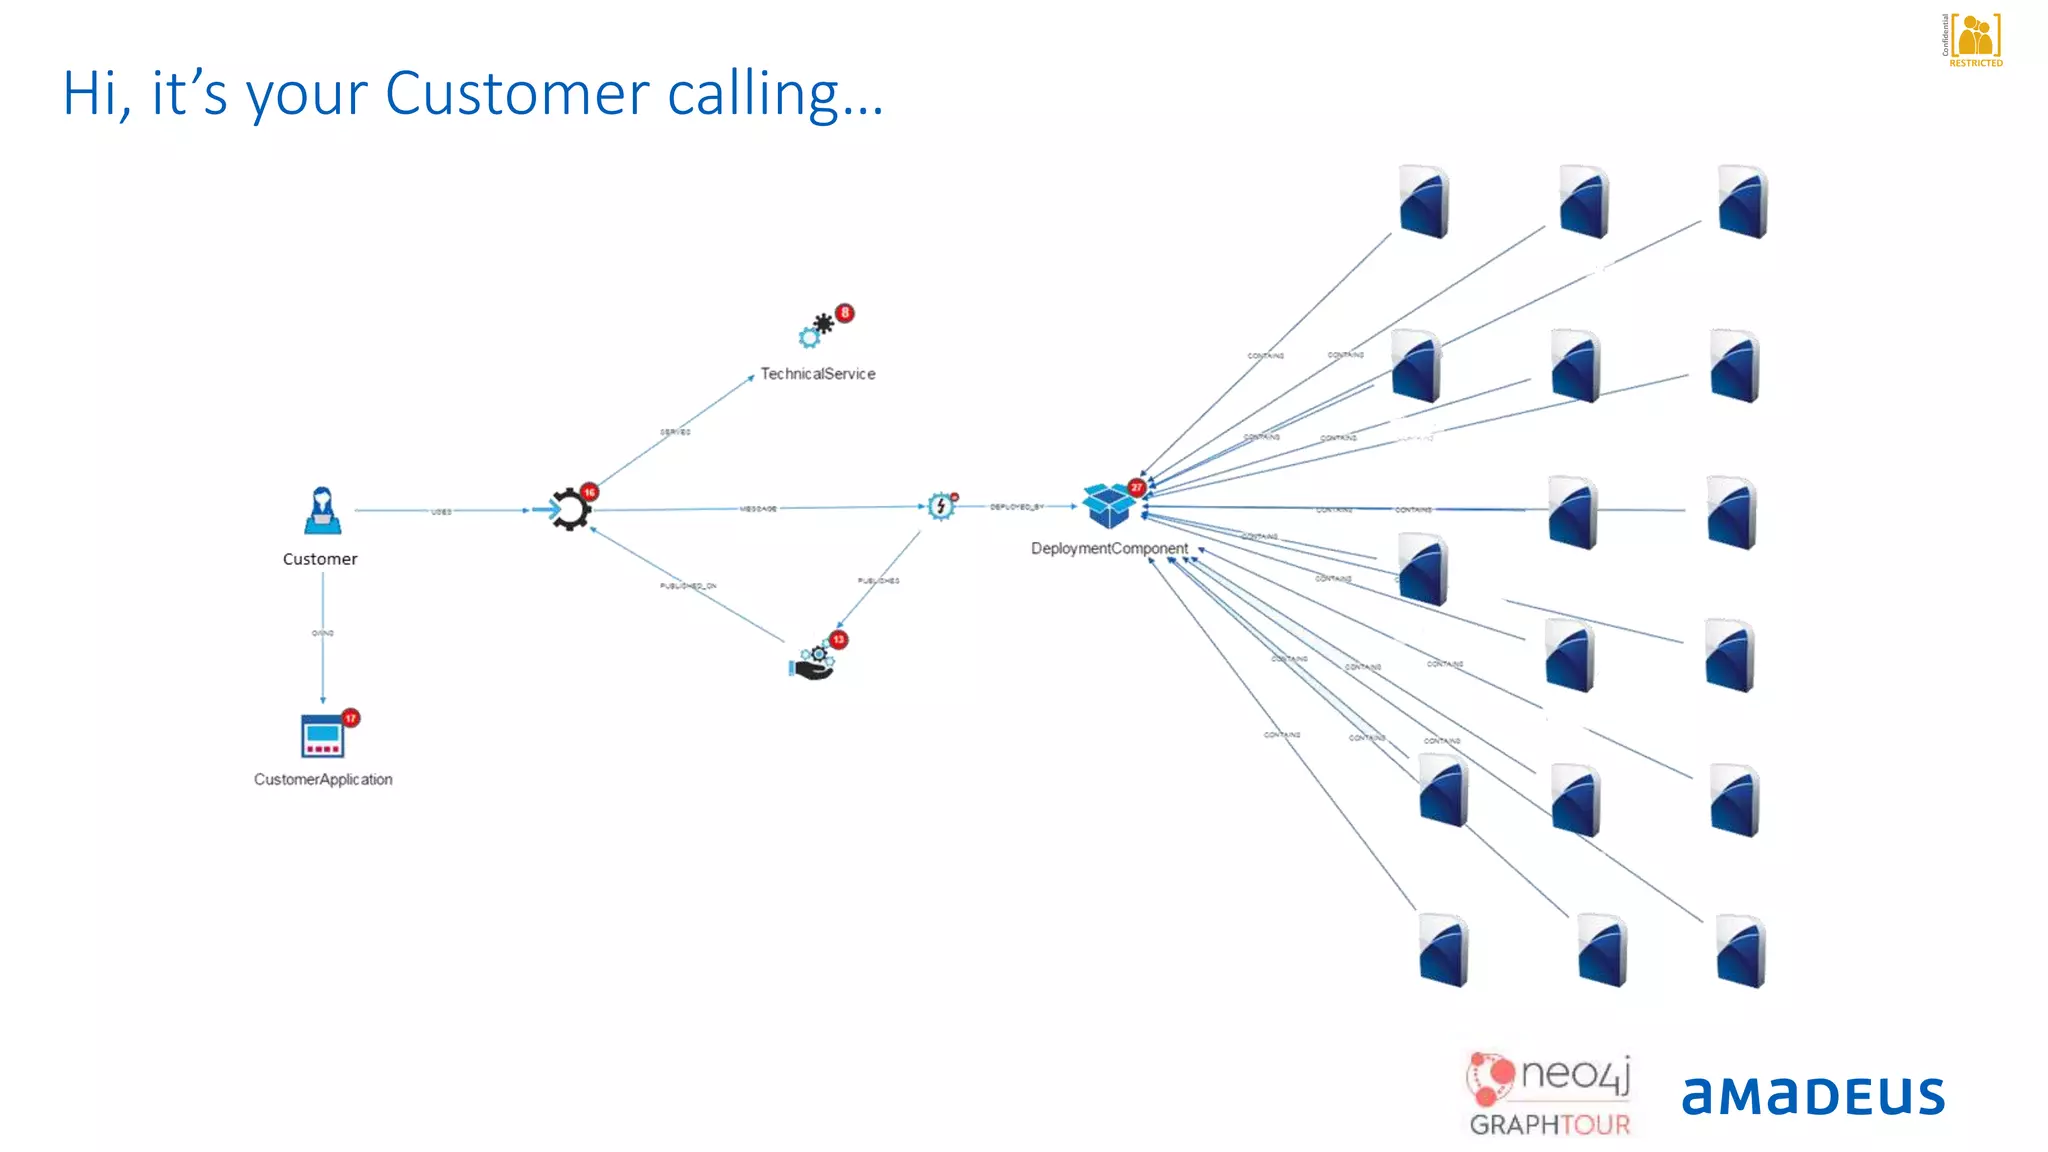
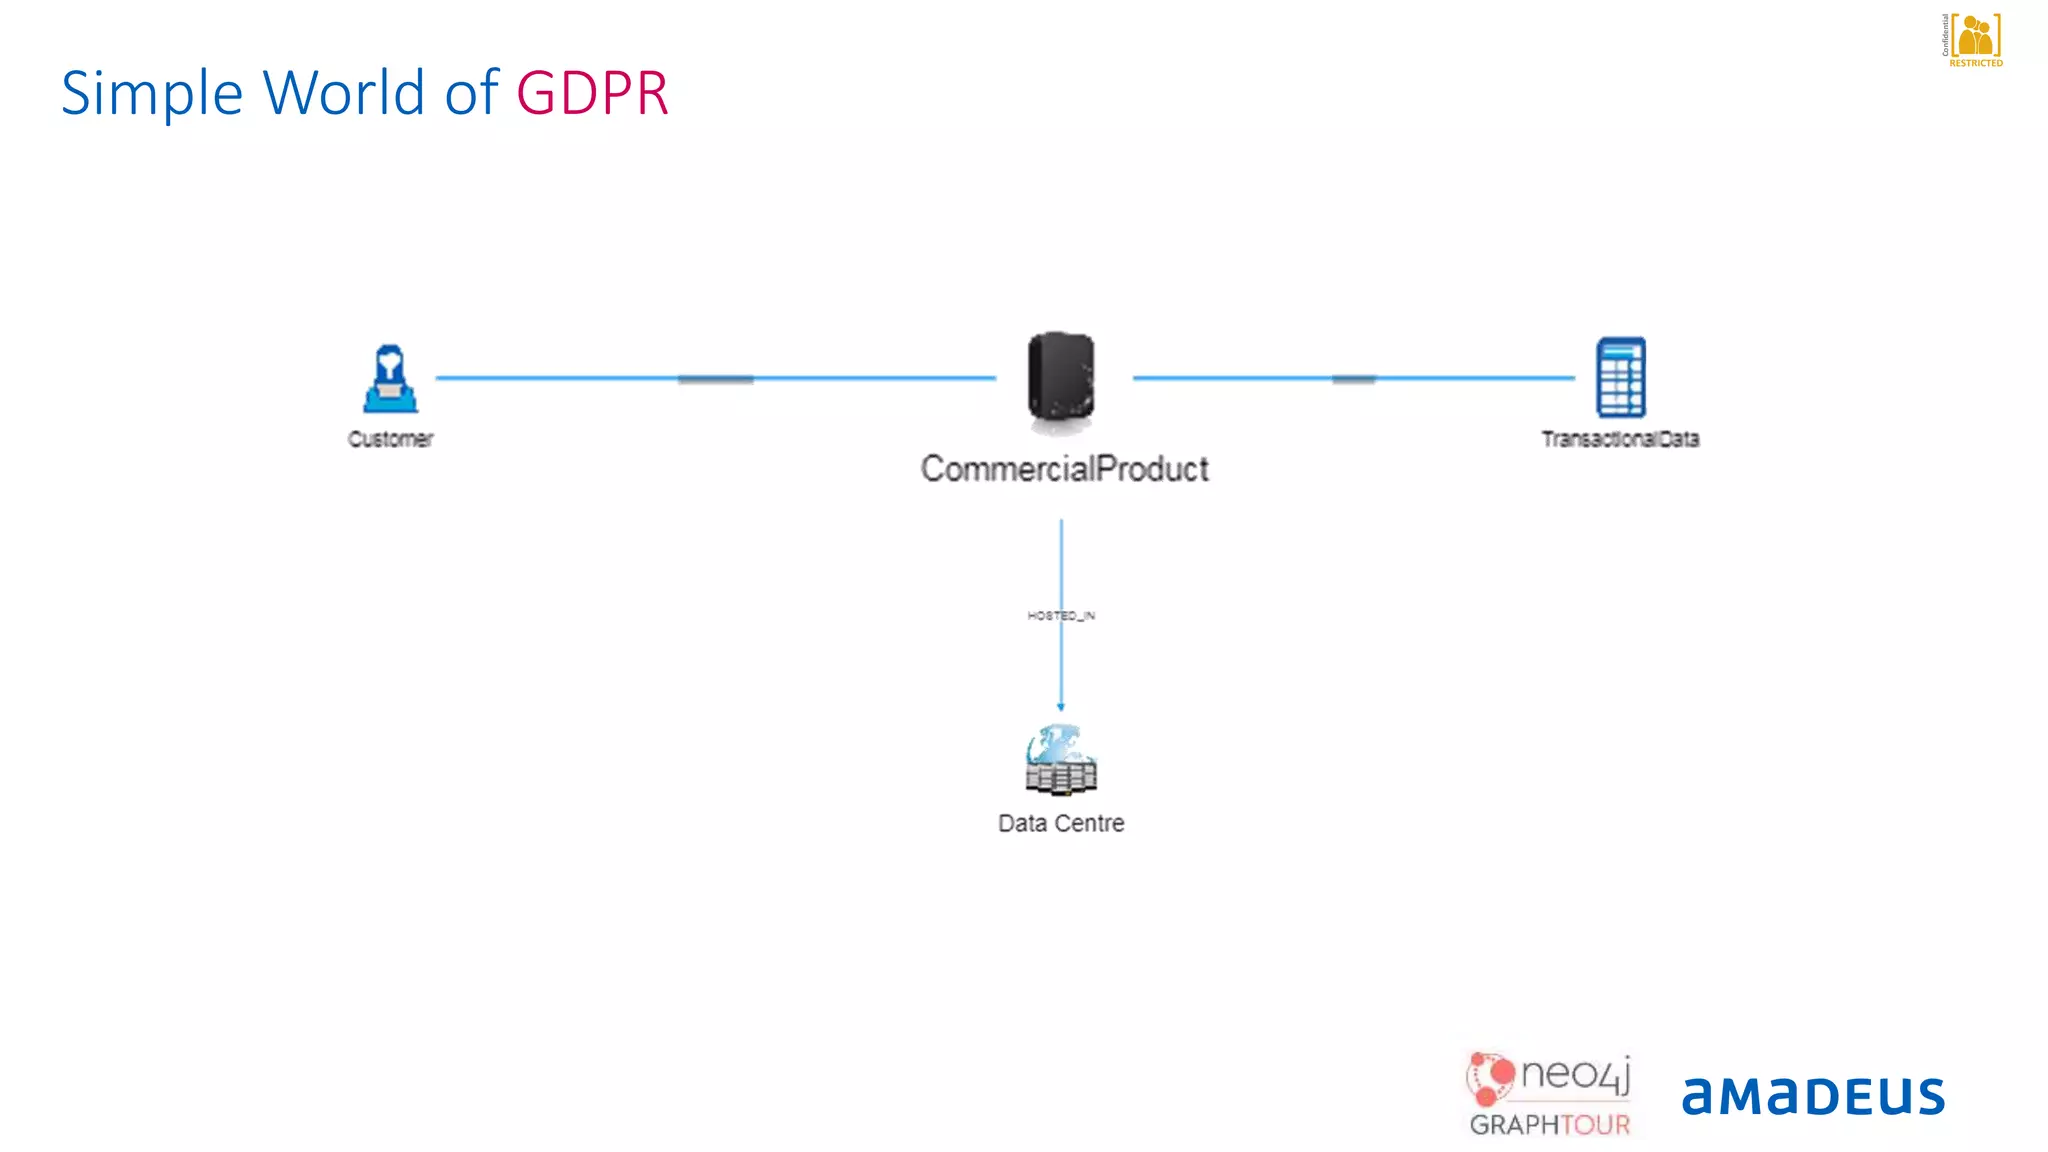
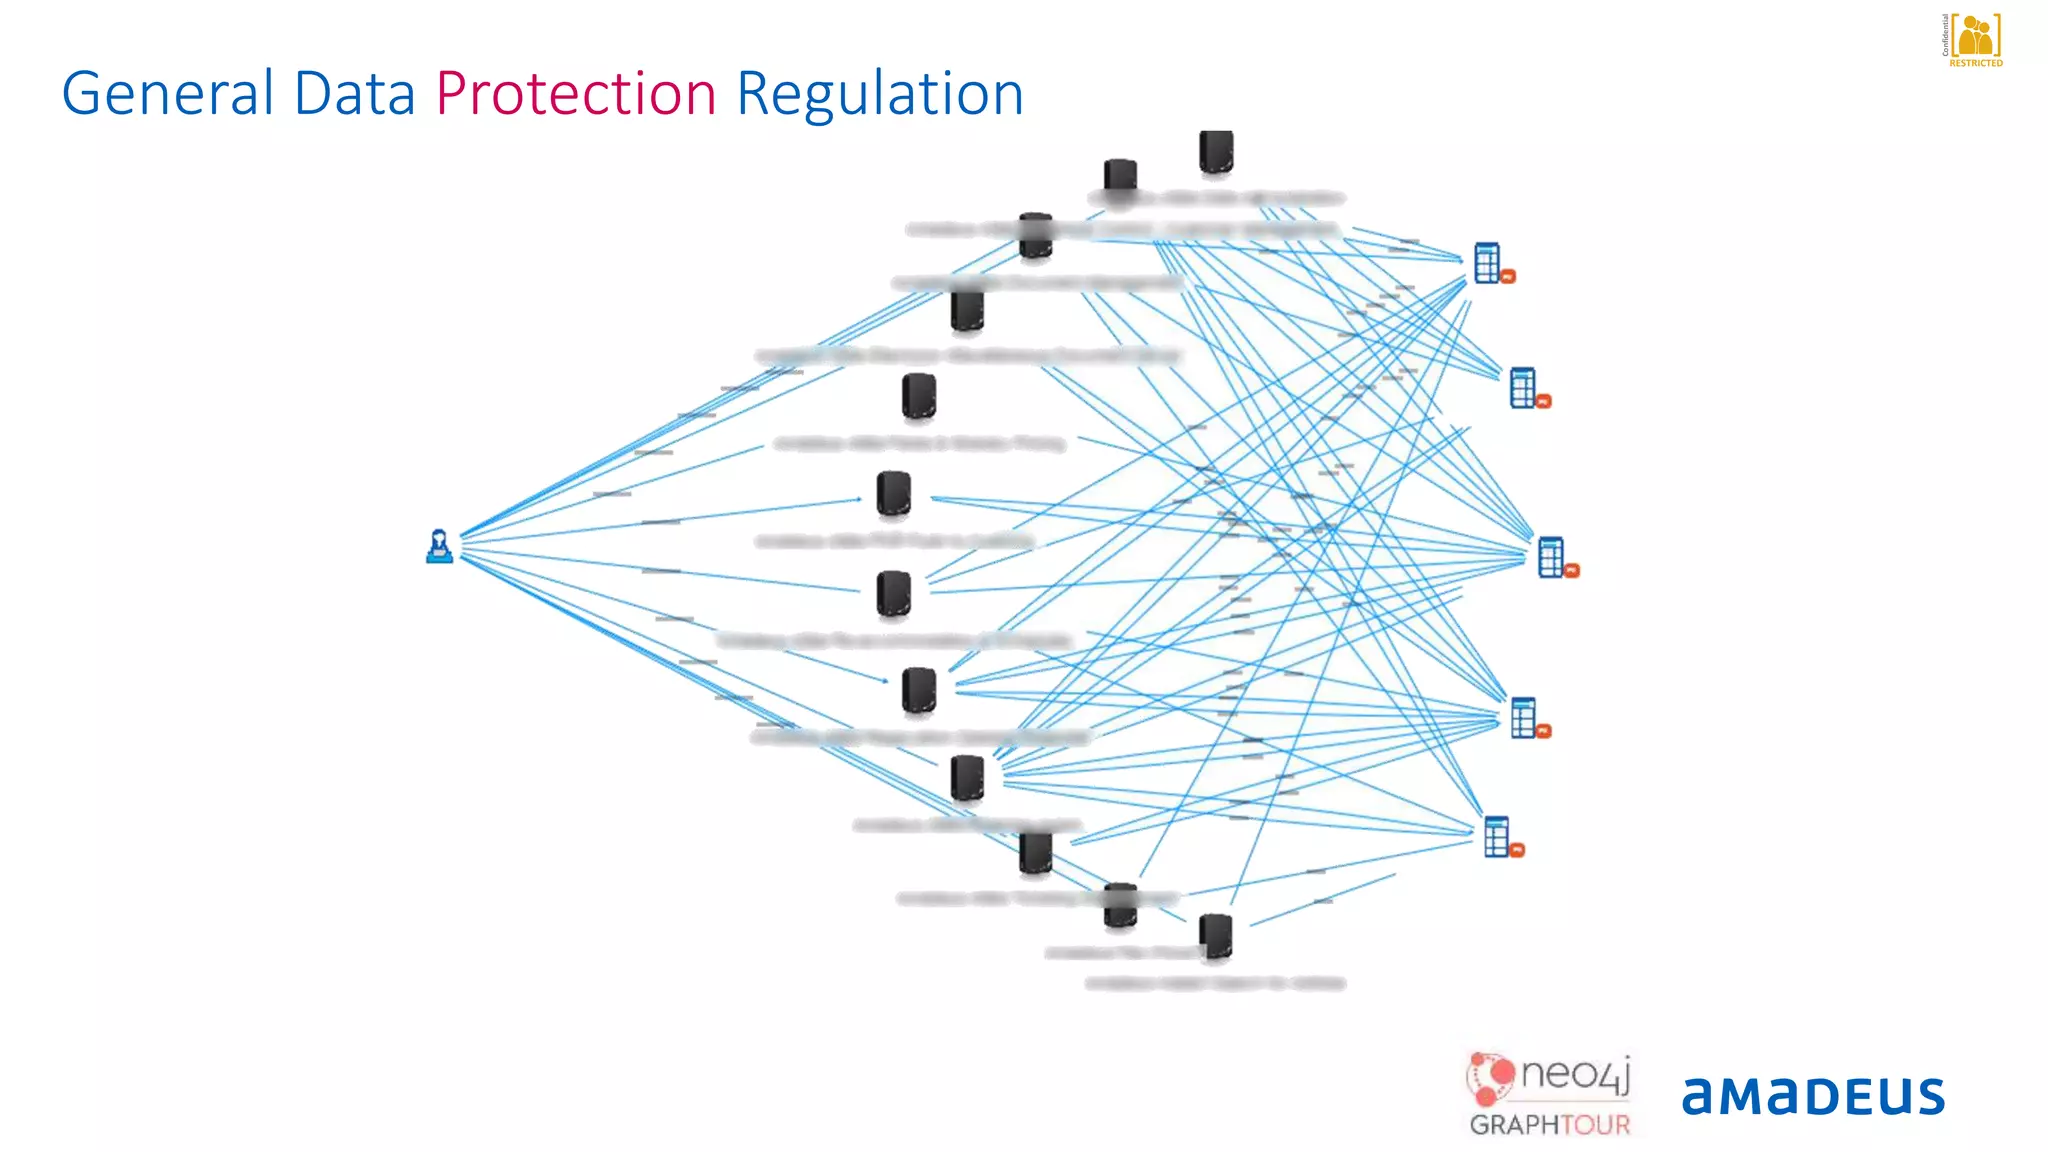
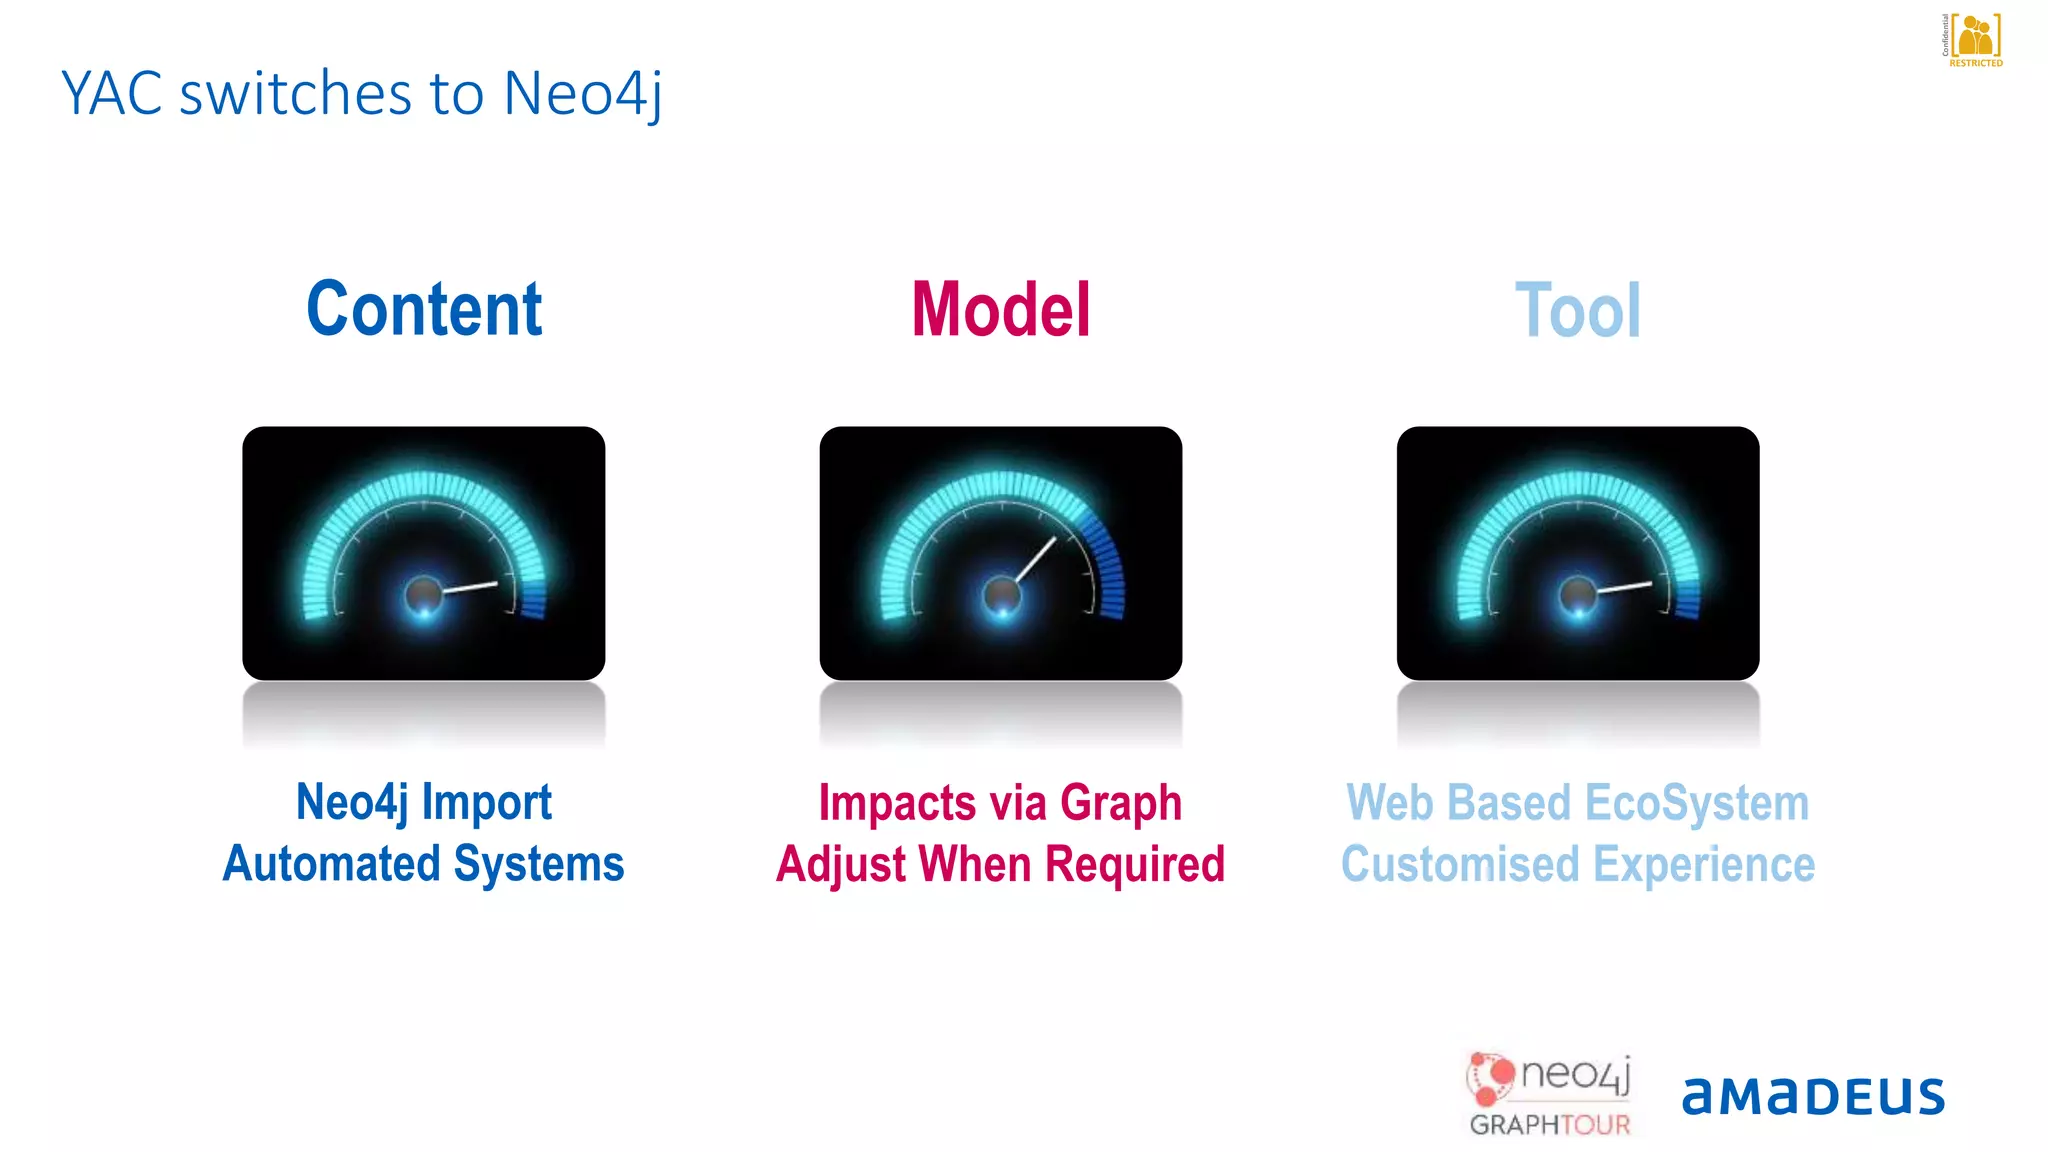
RESTRICTED
Confidential
RESTRICTED
Confidential
Mastering Highly Distributed
Architecture with Neo4j
Thomas Lawrence
Architect @ Amadeus
RESTRICTED
Confidential
Bexhill-on-Sea
© Photograph by Graham Soult
RESTRICTED
Confidential
Sophia Antipolis
RESTRICTED
Confidential
French Riviera
RESTRICTED
Confidential
_ We are the leading technology company dedicated to the global travel industry
_ We are present in 190+ countries and employ 15,000+ people worldwide
_ Our solutions enrich travel for billions of people every year
_ We work together with our customers, partners and other players in the industry to improve
business performance and shape the future of travel
595+ million total bookings processed in 2016
using the Amadeus distribution platform
1.3 billion passengers boarded in 2016
with Amadeus and Navitaire solutions
1 of the world’s top 15 software companies
Forbes 2017 global rankings
Amadeus in a few words
6
6th consecutive year included in the DJSI
Recognised as world leader in the Software & Services
industry sector in the Dow Jones Sustainability Index in 2017
RESTRICTED
Confidential
Research, Development & Innovation
55,000+
transactions
per second
(at peak)
3.8+ bn
transactions
per day (at peak)
40+
research and
development sites
across the world,
from Bangalore to
Boston to Nice
Leading
R&D
investor
In 2016 in the global
travel and technology
industry
€4+ billon
invested in R&D
since 2004
49+
petabytes
of storage
RESTRICTED
Confidential
STORY TIME
RESTRICTED
Confidential
High Level Cartography
RESTRICTED
Confidential
Rigid Model
RESTRICTED
Confidential
Fat Client
RESTRICTED
Confidential
Think
RESTRICTED
Confidential
FLEXIBILITY
RESTRICTED
Confidential
YAC Starting Point
RigidHigh Level Cartography Fat Client
ModelContent Tool
RESTRICTED
Confidential
RESTRICTED
Confidential
MODEL  GRAPH
RESTRICTED
Confidential
EXPLORE
RESTRICTED
Confidential
VISUALISE
RESTRICTED
Confidential
YAC Taking First Steps
Can’t Adapt Fast
Enough
No New Content
Backlog Growing
NoSQL Server
Thinner Client
ModelContent Tool
RESTRICTED
Confidential
RESTRICTED
Confidential
RESTRICTED
Confidential
Expand the Model
©AmadeusITGroupanditsaffiliatesandsubsidiaries
21
RESTRICTED
Confidential
6000
Objects
15000
Relationships
Point to Grow from…
RESTRICTED
Confidential
7000
Objects
45000
Relationships
Assessing our Applications…
RESTRICTED
Confidential
8000
Objects
55000
Relationships
Business Analytics joins…
RESTRICTED
Confidential
90000
Objects
700000
Relationships
Integration Architecture view…
RESTRICTED
Confidential
150000
Objects
1000000
Relationships
Infrastructure and Platforms…
RESTRICTED
Confidential
155000
Objects
1100000
Relationships
Product Lines…
RESTRICTED
Confidential
170000
Objects
1300000
Relationships
And much more!
RESTRICTED
Confidential
RESTRICTED
Confidential
Build the Tool
©AmadeusITGroupanditsaffiliatesandsubsidiaries
29
RESTRICTED
Confidential
Time to Evolve!
RESTRICTED
Confidential
Time to Evolve!
RESTRICTED
Confidential
Time to Evolve!
RESTRICTED
Confidential
YAC Architecture
Neo4j Star of the Show!
DB tier
Back-End tier
Front-End tier
RESTRICTED
Confidential
V1 Lands…
RESTRICTED
Confidential
V2 Improves…
RESTRICTED
Confidential
V3 Simplifies…
RESTRICTED
Confidential
What’s core to you?
RESTRICTED
Confidential
Can I contribute?
RESTRICTED
Confidential
More advanced search? No Problem!
RESTRICTED
Confidential
RESTRICTED
Confidential
Grow the Content
©AmadeusITGroupanditsaffiliatesandsubsidiaries
40
RESTRICTED
Confidential
Technology Standard e.g. JBoss EAP – Technical Policy Tool
Growing our sources…
Application Servers – Deployment Descriptors
Applications – MDM
Commercial Products – MDM
Machines – CMDB
Technology Deployed – Auto Detection Agents
RESTRICTED
Confidential
Hi, it’s your Customer calling…
RESTRICTED
Confidential
Simple World of GDPR
RESTRICTED
Confidential
General Data Protection Regulation
RESTRICTED
Confidential
YAC switches to Neo4j
Impacts via Graph
Adjust When Required
Neo4j Import
Automated Systems
Web Based EcoSystem
Customised Experience
ModelContent Tool
RESTRICTED
Confidential
RESTRICTED
Confidential
TECHNIQUES
RESTRICTED
Confidential
SECURITY
RESTRICTED
Confidential
LESS
RESTRICTED
Confidential
MORE
RESTRICTED
Confidential
We have a GRAPH
We can Openly Explore
We are still Learning
RESTRICTED
Confidential
RESTRICTED
Confidential
You can follow us on:
AmadeusITgroup
amadeus.com
amadeus.com/blog
Thank you!
& Thank You to the YAC Team!!!

GraphTour - Mastering highly distributed architecture with Neo4j

Editor's Notes

  • #7 Amadeus is a technology company dedicated to the world’s travel industry. We offer cutting-edge technology solutions that help key players in the travel industry succeed in their business, and shape the future of travel moving forward. And we do it on a truly global scale. In 2016 Amadeus processed more than 595 million bookings. Together with Navitaire, our systems boarded 1.3 billion passengers. In 2017, Forbes magazine recognized us as one of the world’s top 15 software companies, and Amadeus has been included to the Dow Jones Sustainability Index for five years in a row. We are the only travel technology company in the 2016 DJSI - a key recognition of our commitment to business sustainability, environmental and social practices in all of our operations.
  • #8 All of this is made possible by our robust global operations. We designed, own and operate the world’s largest Data Processing Centre dedicated to travel. This world-class data centre is high-performance and highly-resilient, capable of processing billions of transactions involving sensitive data, securely and reliably, every day. Our global operations are supported by more than 900 employees from more than 45 nationalities and is based on a follow-the-sun model, with specialist support groups in Germany, the US, Australia, India and the United Kingdom.
  • #9 https://www.pressandjournal.co.uk/wp-content/uploads/sites/2/2015/05/Glenfinnan.jpg
  • #10 Use the magicdraw web portal Problem Statement Locked Cartography Using static modeling Shown as fixed views http://allswalls.com/dubai-buildings-skyscrapers-clouds-fog-mist-sunlight-fisheye.html#gal_post_90638_dubai-buildings-skyscrapers-clouds-fog-mist-sunlight-fisheye-wallpaper-1.jpg
  • #11 Use the magicdraw web portal Problem Statement Locked Cartography Using static modeling Shown as fixed views http://www.benecareacademy.com/our-products/benecast-flex/
  • #12 Use the magicdraw web portal Problem Statement Locked Cartography Using static modeling Shown as fixed views IBM image: http://www.pcworld.com/article/258989/the_ibm_ps_2_25_years_of_pc_history.html SimTown: https://www.youtube.com/watch?v=0Wf7ijbuFXM
  • #13 Use the magicdraw web portal Problem Statement Locked Cartography Using static modeling Shown as fixed views http://www.benecareacademy.com/our-products/benecast-flex/
  • #14 Flexible Diagram / Ease of view/explore/query/find Flexible Model Flexible Tool https://phys.org/news/2016-01-flexible-screens.html
  • #15 Chart Progress - joke about rik saying not a graph Model = low and falling Content = low-mid and flat Tool = minus and growin
  • #17 Why – Model = Graph Built a meta-model which links objects together From a different angle we started to see this as a graph Essentially we’re documenting how things interact What are the links and how are these grouped together Showing the dependencies between Applications Which Products share functionalities Where are those functionalities then exposed So lets test out the promise of Graph Databases Left: https://www.google.fr/url?sa=i&rct=j&q=&esrc=s&source=images&cd=&cad=rja&uact=8&ved=0ahUKEwj76smpoM_UAhVFMhoKHfQBCsMQjRwIBw&url=http%3A%2F%2Fstaruml.sourceforge.net%2Fdocs%2Fapi-doc%2FModeling%2520Elements%2FUML%2520Model%2520Elements%2FBehavioral_Elements%2FState_Machines%2Fpackage-summary.html&psig=AFQjCNHByBFWuaOt3Y9fKT43XjwiGWI57g&ust=1498145300965895 Right: https://s3.amazonaws.com/dev.assets.neo4j.com/wp-content/uploads/email-fraud-detection-cc-and-bcc.jpg
  • #18 Why - "Explore" New Content Want to have something more visual Where we can see the links between the objects Moving through the graph to understand the archtiecutre of amadeus Left from: https://martianchronicles.wordpress.com/2010/05/20/the-explorer-analogy-and-us-spaceflight/ Rgith from: https://www.123rf.com/photo_4471204_old-fashioned-compass-on-a-background-an-old-map.html
  • #19 Why - "Visualise & Query“ Graph allows us to visualise in a different manor Using the view to tell us more than any chart or excel sheet can Clusters can be seen where hot-spots are or potential breaking points KeyLines works directly with Neo4j so we have an integrated environment A picture is a 1000 words; so a graph is a 1000 pictures; each waiting to be explored... https://cambridge-intelligence.com/keylines-3-0-supercharge-charts-with-webgl/
  • #20 Chart Progress - joke about rik saying not a graph Model = low and falling Content = low-mid and flat Tool = minus and growin
  • #23 How - Meta-Model Expanding So our first stop was to start to expand the model Can see that this started to grow and rapidly became complex We added new objects to provide more details; more paths The aim: to allow exploring through the graph for new insights However we started to become data scientists to control this
  • #24 How - Meta-Model Expanding So our first stop was to start to expand the model Can see that this started to grow and rapidly became complex We added new objects to provide more details; more paths The aim: to allow exploring through the graph for new insights However we started to become data scientists to control this
  • #25 How - Meta-Model Expanding So our first stop was to start to expand the model Can see that this started to grow and rapidly became complex We added new objects to provide more details; more paths The aim: to allow exploring through the graph for new insights However we started to become data scientists to control this
  • #26 How - Meta-Model Expanding So our first stop was to start to expand the model Can see that this started to grow and rapidly became complex We added new objects to provide more details; more paths The aim: to allow exploring through the graph for new insights However we started to become data scientists to control this
  • #27 How - Meta-Model Expanding So our first stop was to start to expand the model Can see that this started to grow and rapidly became complex We added new objects to provide more details; more paths The aim: to allow exploring through the graph for new insights However we started to become data scientists to control this
  • #28 How - Meta-Model Expanding So our first stop was to start to expand the model Can see that this started to grow and rapidly became complex We added new objects to provide more details; more paths The aim: to allow exploring through the graph for new insights However we started to become data scientists to control this
  • #29 How - Meta-Model Expanding So our first stop was to start to expand the model Can see that this started to grow and rapidly became complex We added new objects to provide more details; more paths The aim: to allow exploring through the graph for new insights However we started to become data scientists to control this
  • #35 Remove the diagram
  • #39 WIKI-LIKE SPIRIT
  • #40 PRE SETUP QUERIES a.k.a. “SHORTCUTS”
  • #42 LOOKING FROM PRODUCT (MDM) TO APP (REPO) TO SERVER (CMDB) TO TECH (ADDM)
  • #43 How - Visualise a graph of the carto, and a table So what can the data we've injested complete? How can the tool help to understand our cartography in new ways? Well what about checking which Customers are using Application via Webservices Here we're using sources from the WebServices Portal (Service Board), Services Integrator Master Agent and Open BackEnd referential While a graph is a very strong tool we all know that a spreadsheet is the preferred business tool I even think this tool will outlast all other tools; love it or hate it, it's here to stay... So we can also run quieres which render as tables Under the same strong graph model is being used and computing as text ready to export as excel sheets https://ncerndyactst.etv.nce.amadeus.net:9443/YAC-INT/?bookId=213 MATCH path=(c:Customer)-[]-(sap:SAP) WHERE c.code IN ["LH","BA","AF","LX","SK"] OPTIONAL MATCH path1=(sap)-[]-(:TechnicalService) OPTIONAL MATCH path2=(sap)-[]-(:BackendType)-[]-(:Component)-[]-(a:Application {name:"PAP"}) OPTIONAL MATCH path3=(sap)-[]-(:MAGPackage)-[]-(:BackendType)-[]-(:Component)-[]-(a) RETURN path,path1,path2,path3
  • #44 CAN WE SHOW THIS?!?! WHO CAN WE CHECK WITH?
  • #46 Chart Progress - joke about rik saying not a graph Model = low and falling Content = low-mid and flat Tool = minus and growin
  • #48 What - Graphing Techniques Simplify the model (KISS) with reference lists for others to refer to e.g. PoC, Application lists etc... Within graphing we've had recommendations from Neo4j consultants on how to use a concept of Golden Record This would allow us to pull in more and more sources while keeping one record to represent the properties required With all still stored in neo4j we can then provide traceability on each object should we need for an audit or such We can also apply machine learning to understand more about how our architectures are linked together Firstly starting to join the world of development and operations so we can share a common language Can even think of history tracking using multiple versions of the node to allow stepping back in time All just through point chasing down the change path https://s-media-cache-ak0.pinimg.com/originals/49/ba/dd/49baddd90dadb33da29ca2d25717ee41.jpg
  • #49 What - More Data tracing data through our systems for regulatory purpose and security checks seen the initial trace from customer to application now to load the payload descriptors (of course as a graph structure) and then using tooling to see the further flows of these messages (CorMeL) there will likely be other areas to learn about like re-use of model elements for messagin helping us improve our data dictionary and provide a similar api for our customers Image from: https://www.selectlegal.co.uk/gdpr-how-will-new-data-protection-changes-affect-law-firms/
  • #50 What – Experience Open up the tool to the community This means you can help provide the next feature Increased confidence through editing capabilitys Building a community around the content And of course there are always new ways to visualise the graph!
  • #51 What – Experience Open up the tool to the community This means you can help provide the next feature Increased confidence through editing capabilitys Building a community around the content And of course there are always new ways to visualise the graph!