Download to read offline


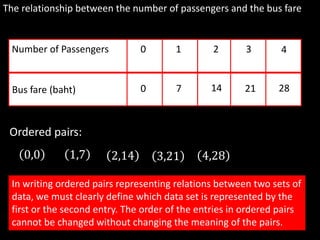
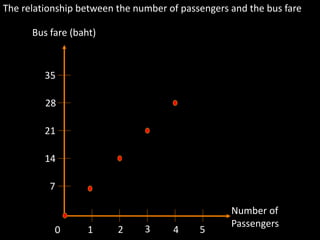
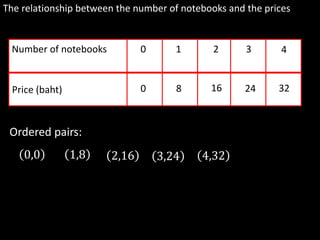
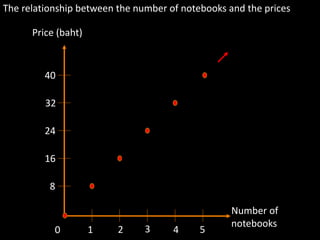
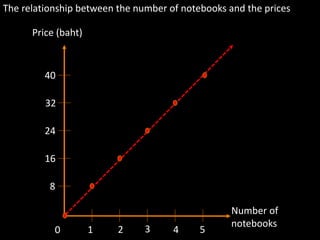
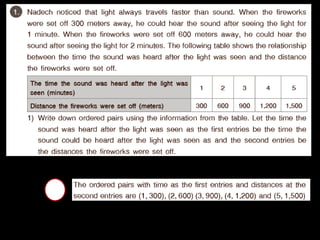
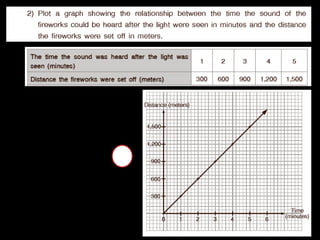

The document discusses the relationship between various data sets, including the number of passengers and bus fare, and the number of notebooks and prices, using ordered pairs to represent these relationships. It also highlights how these relationships can be graphically depicted as straight lines when the quantities are integers and change continuously. The relationships are quantitatively expressed in terms of baht and involve specific numerical data.


