SlideShare a Scribd company logo
1 of 21
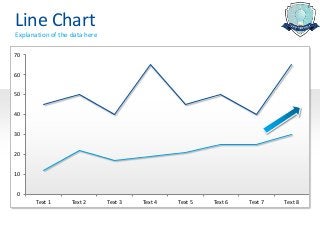
Line Chart
Explanation of the data here

70


60


50


40


30


20


10


 0
       Text 1      Text 2      Text 3   Text 4   Text 5   Text 6   Text 7   Text 8
Column Chart
Explanation of the data here


70

60                                       65                                  65

50
                    50                                     50
40      45                                        45
                                40                                  40
30

20

10

 0
      Text 1       Text 2      Text 3   Text 4   Text 5   Text 6   Text 7   Text 8
3D Column Chart
Explanation of the data here


                               65
      45        50


                          40                       65
                                    45   50
                                              40
Bar Chart
Explanation of the data here


 Description 1                      45

 Description 2                           50

 Description 3                 40

 Description 4                                65

 Description 5                      45

 Description 6                           50

 Description 7                 40

 Description 8                                65

 Description 9                      45

Description 10                           50

Description 11                 40

Description 12                                65
Bubble Chart
Explanation of the data here

                5
                                                   Y-Values
                4


                3


                2


                1


                0
                    0          1   2   3   4   5          6
Star Chart
Explanation of the data here

                6
                                                   Data A
                5                                  Data B

                4

                3

                2

                1

                0
                    0          1   2   3   4   5            6
Histogram
Explanation of the data here


40


                                                    34
30
                                              29          29


20                                      22                      22


                                  14                                  14
10
                            11                                              11
                      8                                                           8

                4                                                                       4
 0         2                                                                                  2
          200   250   300   350   400   450   500   550   600   650   700   750   800   850   900
Conditional Line Charts
     = above target
     = below target

56

54

52

50

48

46

44

42

40
         1      2     3   4   5   6   7   8   9   10   11   12
Pareto Chart
Explanation of the data here


500                                                                100%


400                                                                80%


300                                                                60%


200        220                                                     40%
                               190

100                                                                20%

                                         60
 0
                                                  30       20      0%
          Data 1               Data 2   Data 3   Data 4   Data 5
Multiple Area and Line Charts
Explanation of the data here


 18     Data 1                          Data 2                           Data 3
 16                                                A
 14             A                                                                  A
 12
 10
  8
  6
  4                 B                          B
  2                                                                                 B
  0


                           For example, regardless of the data set, A is always greater than B
Arrow graph
Explanation of the data here

                       1.20
                                         1.00
                       1.00                                0.95

                                                                    0.80
                       0.80
                                                  0.70

                       0.60
                                0.50
                       0.40

                       0.20

                       0.00
                               data 1   data 2   data 3   data 4   data 5
Combination Stacked Bar Chart
Explanation of the data here


 900
                                                       2012 Target
 800         453
                    400                                2012 Hours
 700                                                   2011 Target
 600                                                   2011 Hours
                                           325   300
 500
 400                           252
             402    400                                214
 300                                             325
                                           307
 200                                 125                     150
                               198                     206
 100                                 125                     125
    0
               Data 1           Data 2      Data 3      Data 4
Waterfall graph
Explanation of the data here

  2500


  2000


  1500


  1000


    500

                                                          100
             2000      1500    500   -100   -400   -100         338   338
       0
             Old        A      B      C     D       E     F     G     New
   -500
Broken column
Explanation of the data here

         25                                    Label Name


         20
         10


          0
                   A           B   C   D   E         F
Box Plot / Whisker Plot
Explanation of the data here


80
70
60
50
40
30
20
10
 0
        A         B        C   D   E   F   G   H   I   J
Box Plot / Whisker Plot v2
Explanation of the data here


100
              87                          86                  87
80
                                                     71
60                             64
                                                              58        56
              45
40
                               31.5       33.5       30                 27.5
20
                                                                        12
 0                             -2                    -5
              -15                                             -18
-20

-40                                       -37

-60
         Row 1           Row 2        Row 3      Row 4    Row 5     Row 6
Multiple Bubble Chart
Explanation of the data here
                                                       Data 1    Data 2   Data 3     Data 4      Data 5


    Aug 11 Sep 11 Oct 11 Nov 11 Dec 11 Jan 12 Feb 12 Mar 12 Apr 12 May 12 Jun 12   Jul 12   Aug 12 Sep 12
Thermometer & Gauges
Explanation of the data here

                                           100   100

             80
                                           80    80

                               Target      60    60

                               Last year
                                           40    40
                               Actual
                                           20    20
                                                       Increase
                                            0    0     Mercury
Bullet table
Year to date report


YTD Report
                       Target         Ranges                     Normalised
         YTD    2012   2013     Poor       OK       YTD   2012     Target     Poor   OK   Bullet Graph
Data 1   1100   1000   1200     600        900      18     17       20        10     15   ────────────────┼─
Data 2   2182   711    3200     500        2700     14     4        20         3     17   ───┼──────────
Data 3   172    171     400     250        350       9     9        20        13     18   ────────┼
Data 4    13     59     100      75            90    3     12       20        15     18   ───            │
Data 5   840    309    1800     1200       1500      9     3        20        13     17   ──┼──────
Data 6   2876   1950   10000    4000       6000      6     4        20         8     12   ───┼──
Data 7    8      0      30       20            25    5     0        20        13     17   ─────
Data 8   504    1418   2375     1800       2200      4     12       20        15     19   ────           │
Dot table
How to create a dot table using the REPT function


                                Data       Dot Chart
               Data 1            2           l
               Data 2            4                l
               Data 3            5                      l
               Data 4            2             l
               Data 5            6                          l
               Data 6            12                                             l
               Data 7            11                                         l
               Data 8            4                  l
               Data 9            7                              l
               Data 10           10                                     l
               Data 11           9                                  l
               Data 12           7                              l
Data driven
Graphs & Charts
 Alesandra Blakeston

More Related Content

More from Alesandra Blakeston

More from Alesandra Blakeston (8)

Six thinking hats
Six thinking hatsSix thinking hats
Six thinking hats
 
Lean 6sigma and DMAIC
Lean 6sigma and DMAICLean 6sigma and DMAIC
Lean 6sigma and DMAIC
 
Your Favourite Quotes
Your Favourite QuotesYour Favourite Quotes
Your Favourite Quotes
 
6 steps to effect and embrace change in the workplace
6 steps to effect and embrace change in the workplace6 steps to effect and embrace change in the workplace
6 steps to effect and embrace change in the workplace
 
Training, learning and development quotes
Training, learning and development quotesTraining, learning and development quotes
Training, learning and development quotes
 
How to Make Great PowerPoint Slides
How to Make Great PowerPoint SlidesHow to Make Great PowerPoint Slides
How to Make Great PowerPoint Slides
 
What is 5s
What is 5sWhat is 5s
What is 5s
 
Bubbles
BubblesBubbles
Bubbles
 

Recently uploaded

It will be International Nurses' Day on 12 May
It will be International Nurses' Day on 12 MayIt will be International Nurses' Day on 12 May
It will be International Nurses' Day on 12 MayNZSG
 
VIP Call Girls In Saharaganj ( Lucknow ) 🔝 8923113531 🔝 Cash Payment (COD) 👒
VIP Call Girls In Saharaganj ( Lucknow  ) 🔝 8923113531 🔝  Cash Payment (COD) 👒VIP Call Girls In Saharaganj ( Lucknow  ) 🔝 8923113531 🔝  Cash Payment (COD) 👒
VIP Call Girls In Saharaganj ( Lucknow ) 🔝 8923113531 🔝 Cash Payment (COD) 👒anilsa9823
 
Best Basmati Rice Manufacturers in India
Best Basmati Rice Manufacturers in IndiaBest Basmati Rice Manufacturers in India
Best Basmati Rice Manufacturers in IndiaShree Krishna Exports
 
Yaroslav Rozhankivskyy: Три складові і три передумови максимальної продуктивн...
Yaroslav Rozhankivskyy: Три складові і три передумови максимальної продуктивн...Yaroslav Rozhankivskyy: Три складові і три передумови максимальної продуктивн...
Yaroslav Rozhankivskyy: Три складові і три передумови максимальної продуктивн...Lviv Startup Club
 
Best VIP Call Girls Noida Sector 40 Call Me: 8448380779
Best VIP Call Girls Noida Sector 40 Call Me: 8448380779Best VIP Call Girls Noida Sector 40 Call Me: 8448380779
Best VIP Call Girls Noida Sector 40 Call Me: 8448380779Delhi Call girls
 
Boost the utilization of your HCL environment by reevaluating use cases and f...
Boost the utilization of your HCL environment by reevaluating use cases and f...Boost the utilization of your HCL environment by reevaluating use cases and f...
Boost the utilization of your HCL environment by reevaluating use cases and f...Roland Driesen
 
Insurers' journeys to build a mastery in the IoT usage
Insurers' journeys to build a mastery in the IoT usageInsurers' journeys to build a mastery in the IoT usage
Insurers' journeys to build a mastery in the IoT usageMatteo Carbone
 
Call Girls Pune Just Call 9907093804 Top Class Call Girl Service Available
Call Girls Pune Just Call 9907093804 Top Class Call Girl Service AvailableCall Girls Pune Just Call 9907093804 Top Class Call Girl Service Available
Call Girls Pune Just Call 9907093804 Top Class Call Girl Service AvailableDipal Arora
 
Enhancing and Restoring Safety & Quality Cultures - Dave Litwiller - May 2024...
Enhancing and Restoring Safety & Quality Cultures - Dave Litwiller - May 2024...Enhancing and Restoring Safety & Quality Cultures - Dave Litwiller - May 2024...
Enhancing and Restoring Safety & Quality Cultures - Dave Litwiller - May 2024...Dave Litwiller
 
Call Girls in Gomti Nagar - 7388211116 - With room Service
Call Girls in Gomti Nagar - 7388211116  - With room ServiceCall Girls in Gomti Nagar - 7388211116  - With room Service
Call Girls in Gomti Nagar - 7388211116 - With room Servicediscovermytutordmt
 
Regression analysis: Simple Linear Regression Multiple Linear Regression
Regression analysis:  Simple Linear Regression Multiple Linear RegressionRegression analysis:  Simple Linear Regression Multiple Linear Regression
Regression analysis: Simple Linear Regression Multiple Linear RegressionRavindra Nath Shukla
 
Grateful 7 speech thanking everyone that has helped.pdf
Grateful 7 speech thanking everyone that has helped.pdfGrateful 7 speech thanking everyone that has helped.pdf
Grateful 7 speech thanking everyone that has helped.pdfPaul Menig
 
Progress Report - Oracle Database Analyst Summit
Progress  Report - Oracle Database Analyst SummitProgress  Report - Oracle Database Analyst Summit
Progress Report - Oracle Database Analyst SummitHolger Mueller
 
Monte Carlo simulation : Simulation using MCSM
Monte Carlo simulation : Simulation using MCSMMonte Carlo simulation : Simulation using MCSM
Monte Carlo simulation : Simulation using MCSMRavindra Nath Shukla
 
KYC-Verified Accounts: Helping Companies Handle Challenging Regulatory Enviro...
KYC-Verified Accounts: Helping Companies Handle Challenging Regulatory Enviro...KYC-Verified Accounts: Helping Companies Handle Challenging Regulatory Enviro...
KYC-Verified Accounts: Helping Companies Handle Challenging Regulatory Enviro...Any kyc Account
 
Sales & Marketing Alignment: How to Synergize for Success
Sales & Marketing Alignment: How to Synergize for SuccessSales & Marketing Alignment: How to Synergize for Success
Sales & Marketing Alignment: How to Synergize for SuccessAggregage
 
7.pdf This presentation captures many uses and the significance of the number...
7.pdf This presentation captures many uses and the significance of the number...7.pdf This presentation captures many uses and the significance of the number...
7.pdf This presentation captures many uses and the significance of the number...Paul Menig
 
0183760ssssssssssssssssssssssssssss00101011 (27).pdf
0183760ssssssssssssssssssssssssssss00101011 (27).pdf0183760ssssssssssssssssssssssssssss00101011 (27).pdf
0183760ssssssssssssssssssssssssssss00101011 (27).pdfRenandantas16
 
Event mailer assignment progress report .pdf
Event mailer assignment progress report .pdfEvent mailer assignment progress report .pdf
Event mailer assignment progress report .pdftbatkhuu1
 
Mysore Call Girls 8617370543 WhatsApp Number 24x7 Best Services
Mysore Call Girls 8617370543 WhatsApp Number 24x7 Best ServicesMysore Call Girls 8617370543 WhatsApp Number 24x7 Best Services
Mysore Call Girls 8617370543 WhatsApp Number 24x7 Best ServicesDipal Arora
 

Recently uploaded (20)

It will be International Nurses' Day on 12 May
It will be International Nurses' Day on 12 MayIt will be International Nurses' Day on 12 May
It will be International Nurses' Day on 12 May
 
VIP Call Girls In Saharaganj ( Lucknow ) 🔝 8923113531 🔝 Cash Payment (COD) 👒
VIP Call Girls In Saharaganj ( Lucknow  ) 🔝 8923113531 🔝  Cash Payment (COD) 👒VIP Call Girls In Saharaganj ( Lucknow  ) 🔝 8923113531 🔝  Cash Payment (COD) 👒
VIP Call Girls In Saharaganj ( Lucknow ) 🔝 8923113531 🔝 Cash Payment (COD) 👒
 
Best Basmati Rice Manufacturers in India
Best Basmati Rice Manufacturers in IndiaBest Basmati Rice Manufacturers in India
Best Basmati Rice Manufacturers in India
 
Yaroslav Rozhankivskyy: Три складові і три передумови максимальної продуктивн...
Yaroslav Rozhankivskyy: Три складові і три передумови максимальної продуктивн...Yaroslav Rozhankivskyy: Три складові і три передумови максимальної продуктивн...
Yaroslav Rozhankivskyy: Три складові і три передумови максимальної продуктивн...
 
Best VIP Call Girls Noida Sector 40 Call Me: 8448380779
Best VIP Call Girls Noida Sector 40 Call Me: 8448380779Best VIP Call Girls Noida Sector 40 Call Me: 8448380779
Best VIP Call Girls Noida Sector 40 Call Me: 8448380779
 
Boost the utilization of your HCL environment by reevaluating use cases and f...
Boost the utilization of your HCL environment by reevaluating use cases and f...Boost the utilization of your HCL environment by reevaluating use cases and f...
Boost the utilization of your HCL environment by reevaluating use cases and f...
 
Insurers' journeys to build a mastery in the IoT usage
Insurers' journeys to build a mastery in the IoT usageInsurers' journeys to build a mastery in the IoT usage
Insurers' journeys to build a mastery in the IoT usage
 
Call Girls Pune Just Call 9907093804 Top Class Call Girl Service Available
Call Girls Pune Just Call 9907093804 Top Class Call Girl Service AvailableCall Girls Pune Just Call 9907093804 Top Class Call Girl Service Available
Call Girls Pune Just Call 9907093804 Top Class Call Girl Service Available
 
Enhancing and Restoring Safety & Quality Cultures - Dave Litwiller - May 2024...
Enhancing and Restoring Safety & Quality Cultures - Dave Litwiller - May 2024...Enhancing and Restoring Safety & Quality Cultures - Dave Litwiller - May 2024...
Enhancing and Restoring Safety & Quality Cultures - Dave Litwiller - May 2024...
 
Call Girls in Gomti Nagar - 7388211116 - With room Service
Call Girls in Gomti Nagar - 7388211116  - With room ServiceCall Girls in Gomti Nagar - 7388211116  - With room Service
Call Girls in Gomti Nagar - 7388211116 - With room Service
 
Regression analysis: Simple Linear Regression Multiple Linear Regression
Regression analysis:  Simple Linear Regression Multiple Linear RegressionRegression analysis:  Simple Linear Regression Multiple Linear Regression
Regression analysis: Simple Linear Regression Multiple Linear Regression
 
Grateful 7 speech thanking everyone that has helped.pdf
Grateful 7 speech thanking everyone that has helped.pdfGrateful 7 speech thanking everyone that has helped.pdf
Grateful 7 speech thanking everyone that has helped.pdf
 
Progress Report - Oracle Database Analyst Summit
Progress  Report - Oracle Database Analyst SummitProgress  Report - Oracle Database Analyst Summit
Progress Report - Oracle Database Analyst Summit
 
Monte Carlo simulation : Simulation using MCSM
Monte Carlo simulation : Simulation using MCSMMonte Carlo simulation : Simulation using MCSM
Monte Carlo simulation : Simulation using MCSM
 
KYC-Verified Accounts: Helping Companies Handle Challenging Regulatory Enviro...
KYC-Verified Accounts: Helping Companies Handle Challenging Regulatory Enviro...KYC-Verified Accounts: Helping Companies Handle Challenging Regulatory Enviro...
KYC-Verified Accounts: Helping Companies Handle Challenging Regulatory Enviro...
 
Sales & Marketing Alignment: How to Synergize for Success
Sales & Marketing Alignment: How to Synergize for SuccessSales & Marketing Alignment: How to Synergize for Success
Sales & Marketing Alignment: How to Synergize for Success
 
7.pdf This presentation captures many uses and the significance of the number...
7.pdf This presentation captures many uses and the significance of the number...7.pdf This presentation captures many uses and the significance of the number...
7.pdf This presentation captures many uses and the significance of the number...
 
0183760ssssssssssssssssssssssssssss00101011 (27).pdf
0183760ssssssssssssssssssssssssssss00101011 (27).pdf0183760ssssssssssssssssssssssssssss00101011 (27).pdf
0183760ssssssssssssssssssssssssssss00101011 (27).pdf
 
Event mailer assignment progress report .pdf
Event mailer assignment progress report .pdfEvent mailer assignment progress report .pdf
Event mailer assignment progress report .pdf
 
Mysore Call Girls 8617370543 WhatsApp Number 24x7 Best Services
Mysore Call Girls 8617370543 WhatsApp Number 24x7 Best ServicesMysore Call Girls 8617370543 WhatsApp Number 24x7 Best Services
Mysore Call Girls 8617370543 WhatsApp Number 24x7 Best Services
 

Make your charts look amazing

  • 1. Line Chart Explanation of the data here 70 60 50 40 30 20 10 0 Text 1 Text 2 Text 3 Text 4 Text 5 Text 6 Text 7 Text 8
  • 2. Column Chart Explanation of the data here 70 60 65 65 50 50 50 40 45 45 40 40 30 20 10 0 Text 1 Text 2 Text 3 Text 4 Text 5 Text 6 Text 7 Text 8
  • 3. 3D Column Chart Explanation of the data here 65 45 50 40 65 45 50 40
  • 4. Bar Chart Explanation of the data here Description 1 45 Description 2 50 Description 3 40 Description 4 65 Description 5 45 Description 6 50 Description 7 40 Description 8 65 Description 9 45 Description 10 50 Description 11 40 Description 12 65
  • 5. Bubble Chart Explanation of the data here 5 Y-Values 4 3 2 1 0 0 1 2 3 4 5 6
  • 6. Star Chart Explanation of the data here 6 Data A 5 Data B 4 3 2 1 0 0 1 2 3 4 5 6
  • 7. Histogram Explanation of the data here 40 34 30 29 29 20 22 22 14 14 10 11 11 8 8 4 4 0 2 2 200 250 300 350 400 450 500 550 600 650 700 750 800 850 900
  • 8. Conditional Line Charts = above target = below target 56 54 52 50 48 46 44 42 40 1 2 3 4 5 6 7 8 9 10 11 12
  • 9. Pareto Chart Explanation of the data here 500 100% 400 80% 300 60% 200 220 40% 190 100 20% 60 0 30 20 0% Data 1 Data 2 Data 3 Data 4 Data 5
  • 10. Multiple Area and Line Charts Explanation of the data here 18 Data 1 Data 2 Data 3 16 A 14 A A 12 10 8 6 4 B B 2 B 0 For example, regardless of the data set, A is always greater than B
  • 11. Arrow graph Explanation of the data here 1.20 1.00 1.00 0.95 0.80 0.80 0.70 0.60 0.50 0.40 0.20 0.00 data 1 data 2 data 3 data 4 data 5
  • 12. Combination Stacked Bar Chart Explanation of the data here 900 2012 Target 800 453 400 2012 Hours 700 2011 Target 600 2011 Hours 325 300 500 400 252 402 400 214 300 325 307 200 125 150 198 206 100 125 125 0 Data 1 Data 2 Data 3 Data 4
  • 13. Waterfall graph Explanation of the data here 2500 2000 1500 1000 500 100 2000 1500 500 -100 -400 -100 338 338 0 Old A B C D E F G New -500
  • 14. Broken column Explanation of the data here 25 Label Name 20 10 0 A B C D E F
  • 15. Box Plot / Whisker Plot Explanation of the data here 80 70 60 50 40 30 20 10 0 A B C D E F G H I J
  • 16. Box Plot / Whisker Plot v2 Explanation of the data here 100 87 86 87 80 71 60 64 58 56 45 40 31.5 33.5 30 27.5 20 12 0 -2 -5 -15 -18 -20 -40 -37 -60 Row 1 Row 2 Row 3 Row 4 Row 5 Row 6
  • 17. Multiple Bubble Chart Explanation of the data here Data 1 Data 2 Data 3 Data 4 Data 5 Aug 11 Sep 11 Oct 11 Nov 11 Dec 11 Jan 12 Feb 12 Mar 12 Apr 12 May 12 Jun 12 Jul 12 Aug 12 Sep 12
  • 18. Thermometer & Gauges Explanation of the data here 100 100 80 80 80 Target 60 60 Last year 40 40 Actual 20 20 Increase 0 0 Mercury
  • 19. Bullet table Year to date report YTD Report Target Ranges Normalised YTD 2012 2013 Poor OK YTD 2012 Target Poor OK Bullet Graph Data 1 1100 1000 1200 600 900 18 17 20 10 15 ────────────────┼─ Data 2 2182 711 3200 500 2700 14 4 20 3 17 ───┼────────── Data 3 172 171 400 250 350 9 9 20 13 18 ────────┼ Data 4 13 59 100 75 90 3 12 20 15 18 ─── │ Data 5 840 309 1800 1200 1500 9 3 20 13 17 ──┼────── Data 6 2876 1950 10000 4000 6000 6 4 20 8 12 ───┼── Data 7 8 0 30 20 25 5 0 20 13 17 ───── Data 8 504 1418 2375 1800 2200 4 12 20 15 19 ──── │
  • 20. Dot table How to create a dot table using the REPT function Data Dot Chart Data 1 2 l Data 2 4 l Data 3 5 l Data 4 2 l Data 5 6 l Data 6 12 l Data 7 11 l Data 8 4 l Data 9 7 l Data 10 10 l Data 11 9 l Data 12 7 l
  • 21. Data driven Graphs & Charts Alesandra Blakeston