Download to read offline

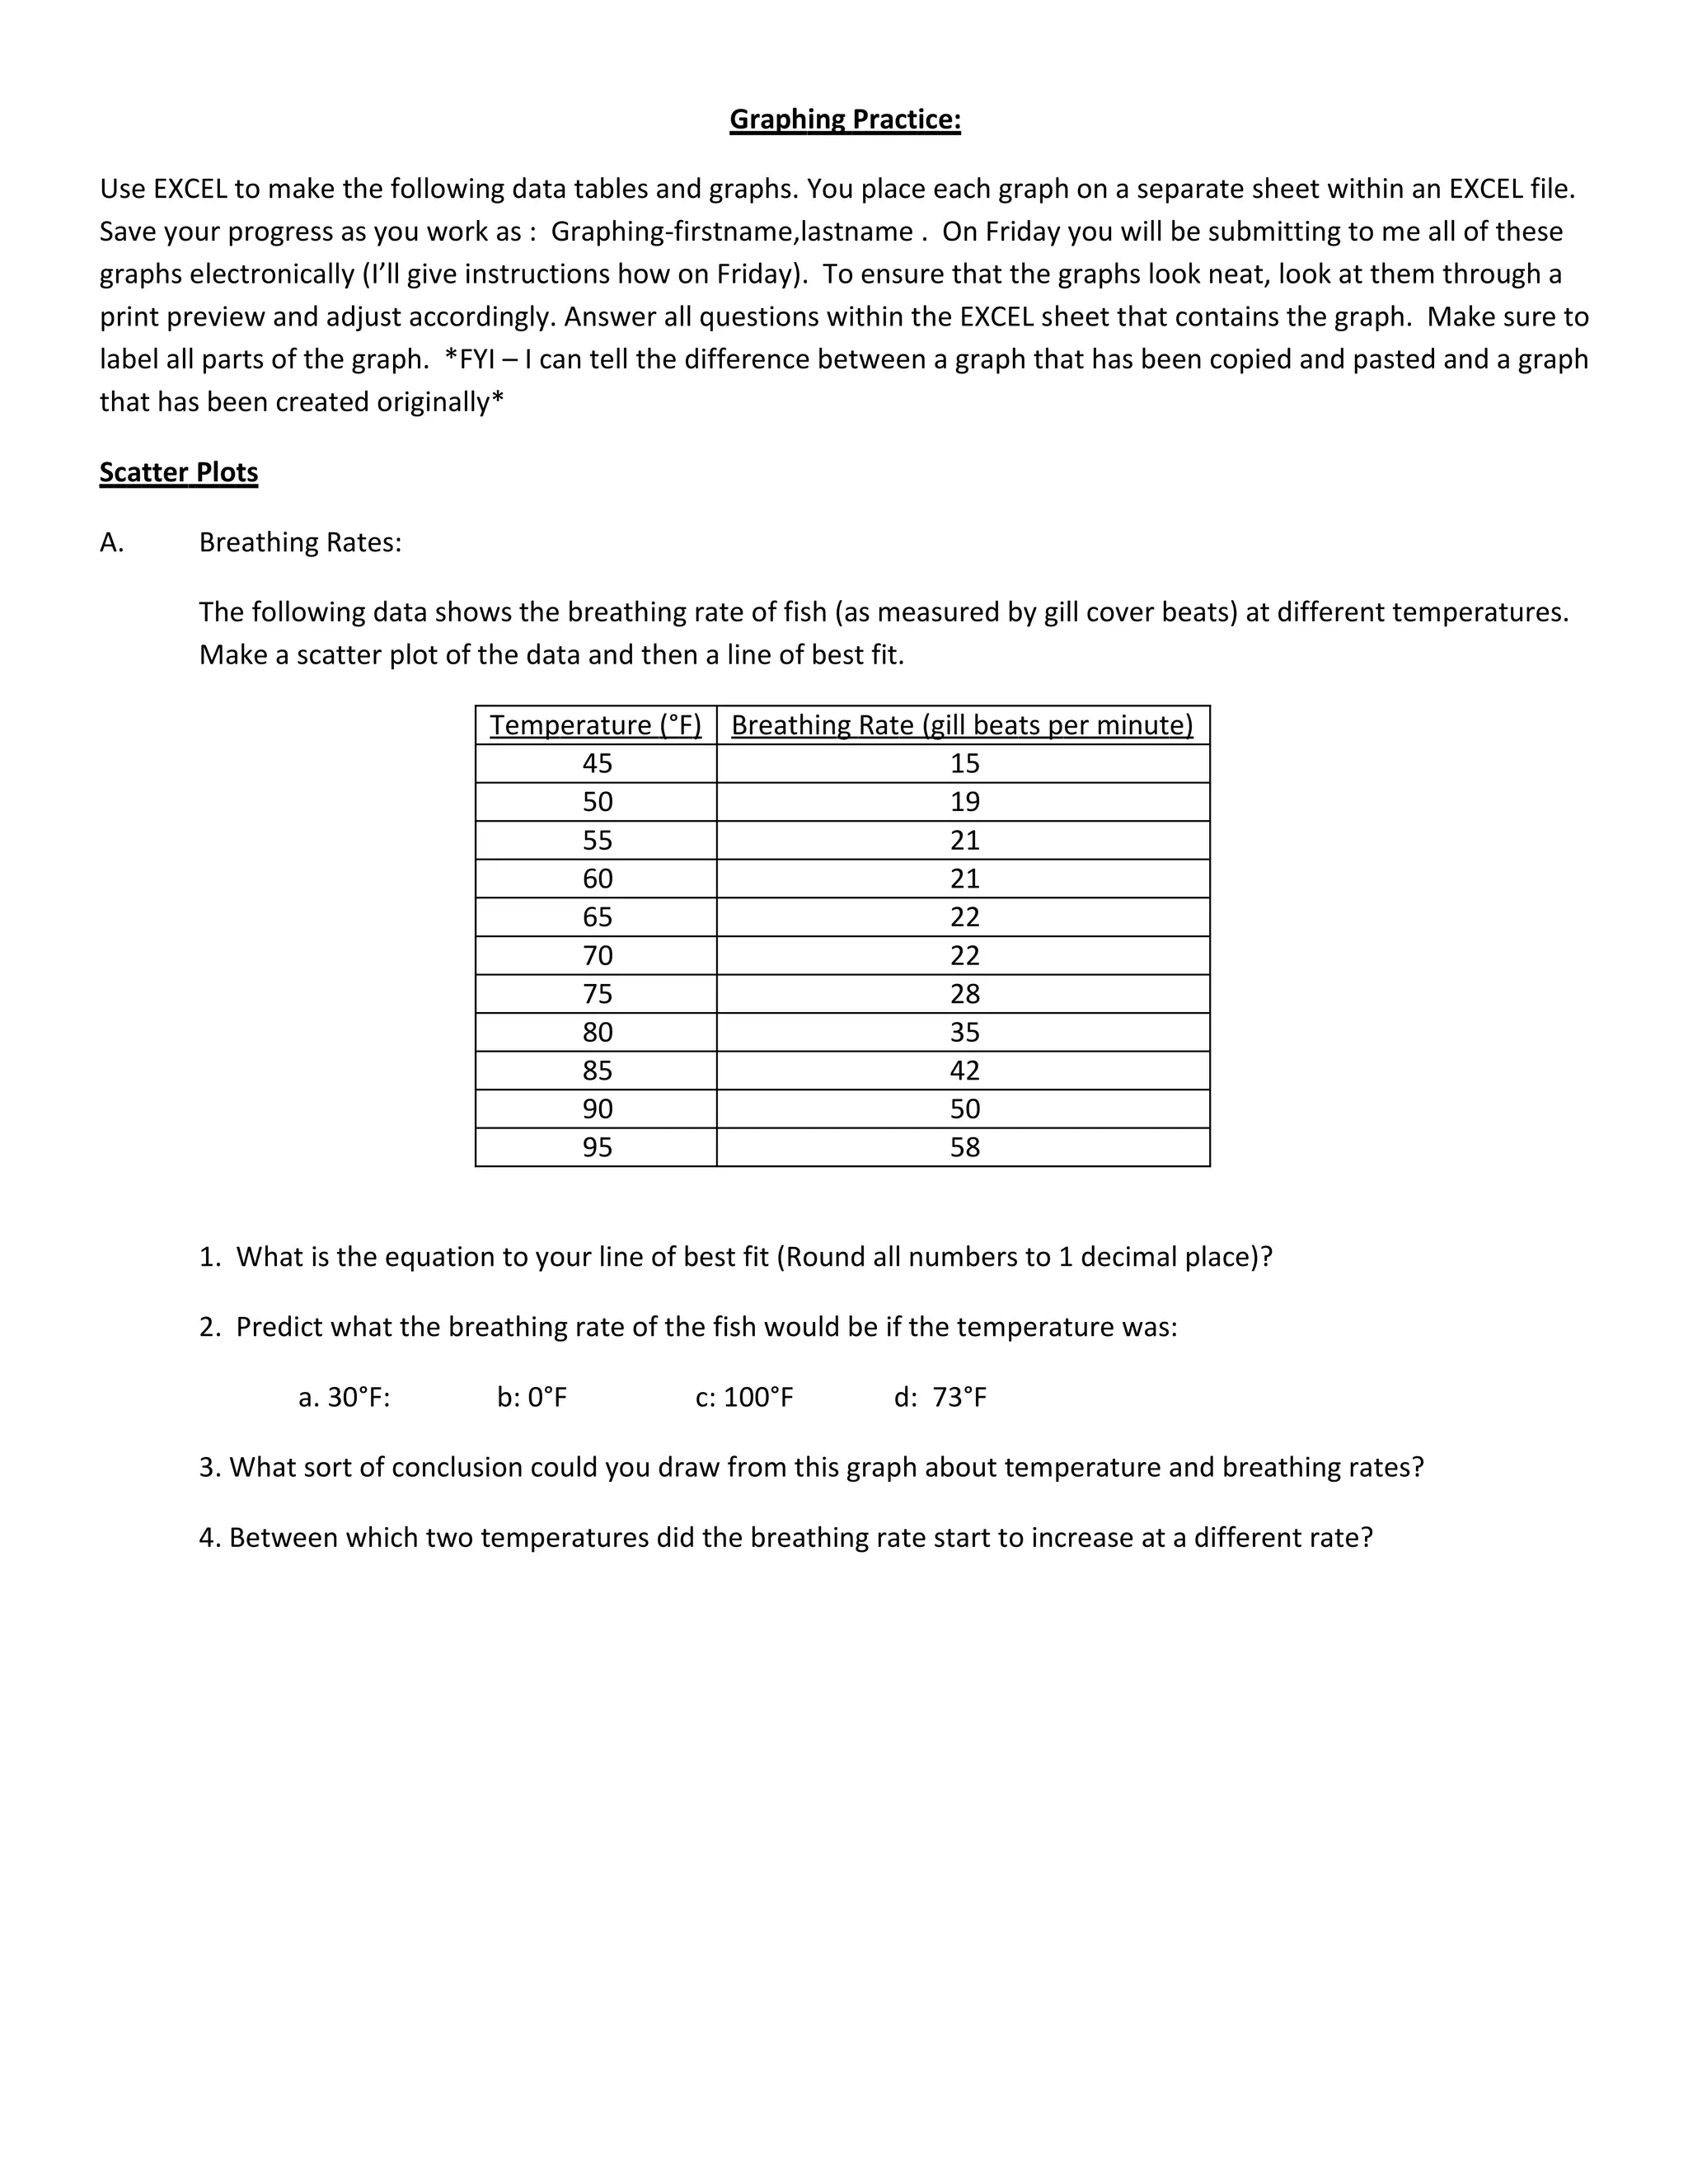
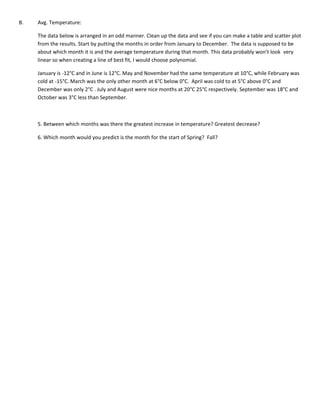
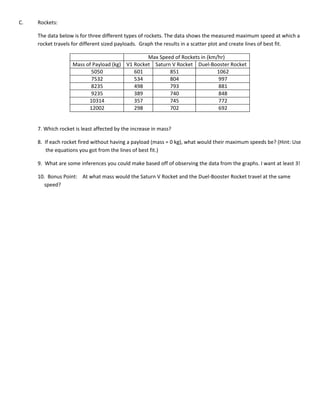
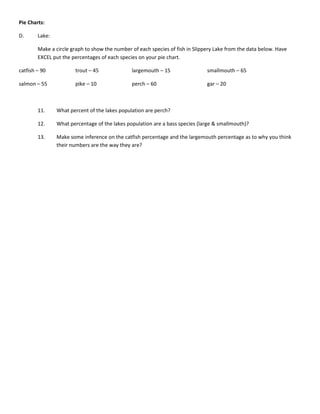
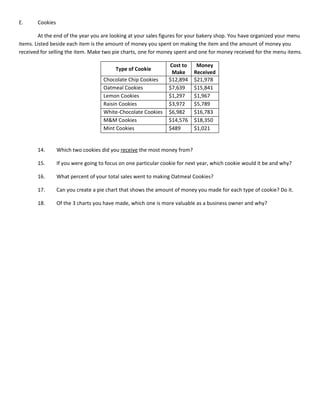
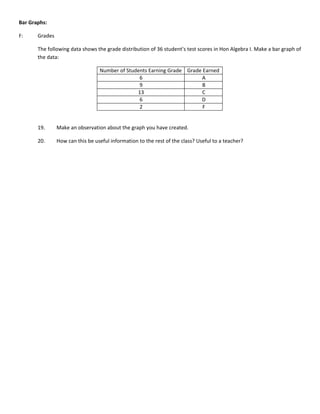
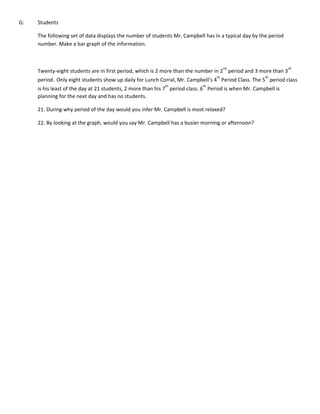

This document provides instructions for students to create various graphs in Excel using different datasets. Students are asked to make scatter plots, line graphs, pie charts and bar graphs representing fish breathing rates, average temperatures, rocket speeds, lake fish populations, cookie sales and more. They must label axes, title graphs, answer analysis questions and submit their Excel file electronically by the deadline.