Graph results
•Download as PPTX, PDF•
0 likes•209 views
The document appears to contain the results of a survey with 10 multiple choice questions. For each question, the percentages of respondents who selected each possible answer are shown in bar graphs. The questions asked about topics like favorite films, frequency of website visits, price points, types of online content, and genres.
Report
Share
Report
Share

Recommended
NO1 Pandit Black magic/kala jadu,manpasand shadi in lahore,karachi rawalpindi islamabad usa uae pakistan amil baba in canada uk Divorce problem uk all amil baba in karachi,lahore,pakistan online love marriage usa astrologer Canada
NO1 Pandit Black magic/kala jadu,manpasand shadi in lahore,karachi rawalpindi...
NO1 Pandit Black magic/kala jadu,manpasand shadi in lahore,karachi rawalpindi...Amil Baba Dawood bangali
More Related Content
Recently uploaded
NO1 Pandit Black magic/kala jadu,manpasand shadi in lahore,karachi rawalpindi islamabad usa uae pakistan amil baba in canada uk Divorce problem uk all amil baba in karachi,lahore,pakistan online love marriage usa astrologer Canada
NO1 Pandit Black magic/kala jadu,manpasand shadi in lahore,karachi rawalpindi...
NO1 Pandit Black magic/kala jadu,manpasand shadi in lahore,karachi rawalpindi...Amil Baba Dawood bangali
Recently uploaded (8)
NO1 Pandit Black magic/kala jadu,manpasand shadi in lahore,karachi rawalpindi...
NO1 Pandit Black magic/kala jadu,manpasand shadi in lahore,karachi rawalpindi...
NO1 Uk Amil Baba In Lahore Kala Jadu In Lahore Best Amil In Lahore Amil In La...
NO1 Uk Amil Baba In Lahore Kala Jadu In Lahore Best Amil In Lahore Amil In La...
Featured
Featured (20)
Product Design Trends in 2024 | Teenage Engineerings
Product Design Trends in 2024 | Teenage Engineerings
How Race, Age and Gender Shape Attitudes Towards Mental Health
How Race, Age and Gender Shape Attitudes Towards Mental Health
AI Trends in Creative Operations 2024 by Artwork Flow.pdf
AI Trends in Creative Operations 2024 by Artwork Flow.pdf
Content Methodology: A Best Practices Report (Webinar)
Content Methodology: A Best Practices Report (Webinar)
How to Prepare For a Successful Job Search for 2024
How to Prepare For a Successful Job Search for 2024
Social Media Marketing Trends 2024 // The Global Indie Insights
Social Media Marketing Trends 2024 // The Global Indie Insights
Trends In Paid Search: Navigating The Digital Landscape In 2024
Trends In Paid Search: Navigating The Digital Landscape In 2024
5 Public speaking tips from TED - Visualized summary
5 Public speaking tips from TED - Visualized summary
Google's Just Not That Into You: Understanding Core Updates & Search Intent
Google's Just Not That Into You: Understanding Core Updates & Search Intent
The six step guide to practical project management
The six step guide to practical project management
Beginners Guide to TikTok for Search - Rachel Pearson - We are Tilt __ Bright...
Beginners Guide to TikTok for Search - Rachel Pearson - We are Tilt __ Bright...
Graph results
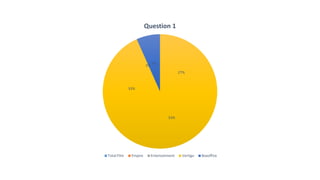
- 1. Question 1 0% 7% 27% 33% 33% Total Film Empire Entertainment Vertigo Boxoffice
- 7. Question 7 0% 25% 13% Red Black 62% Orange Red Black Orange Red