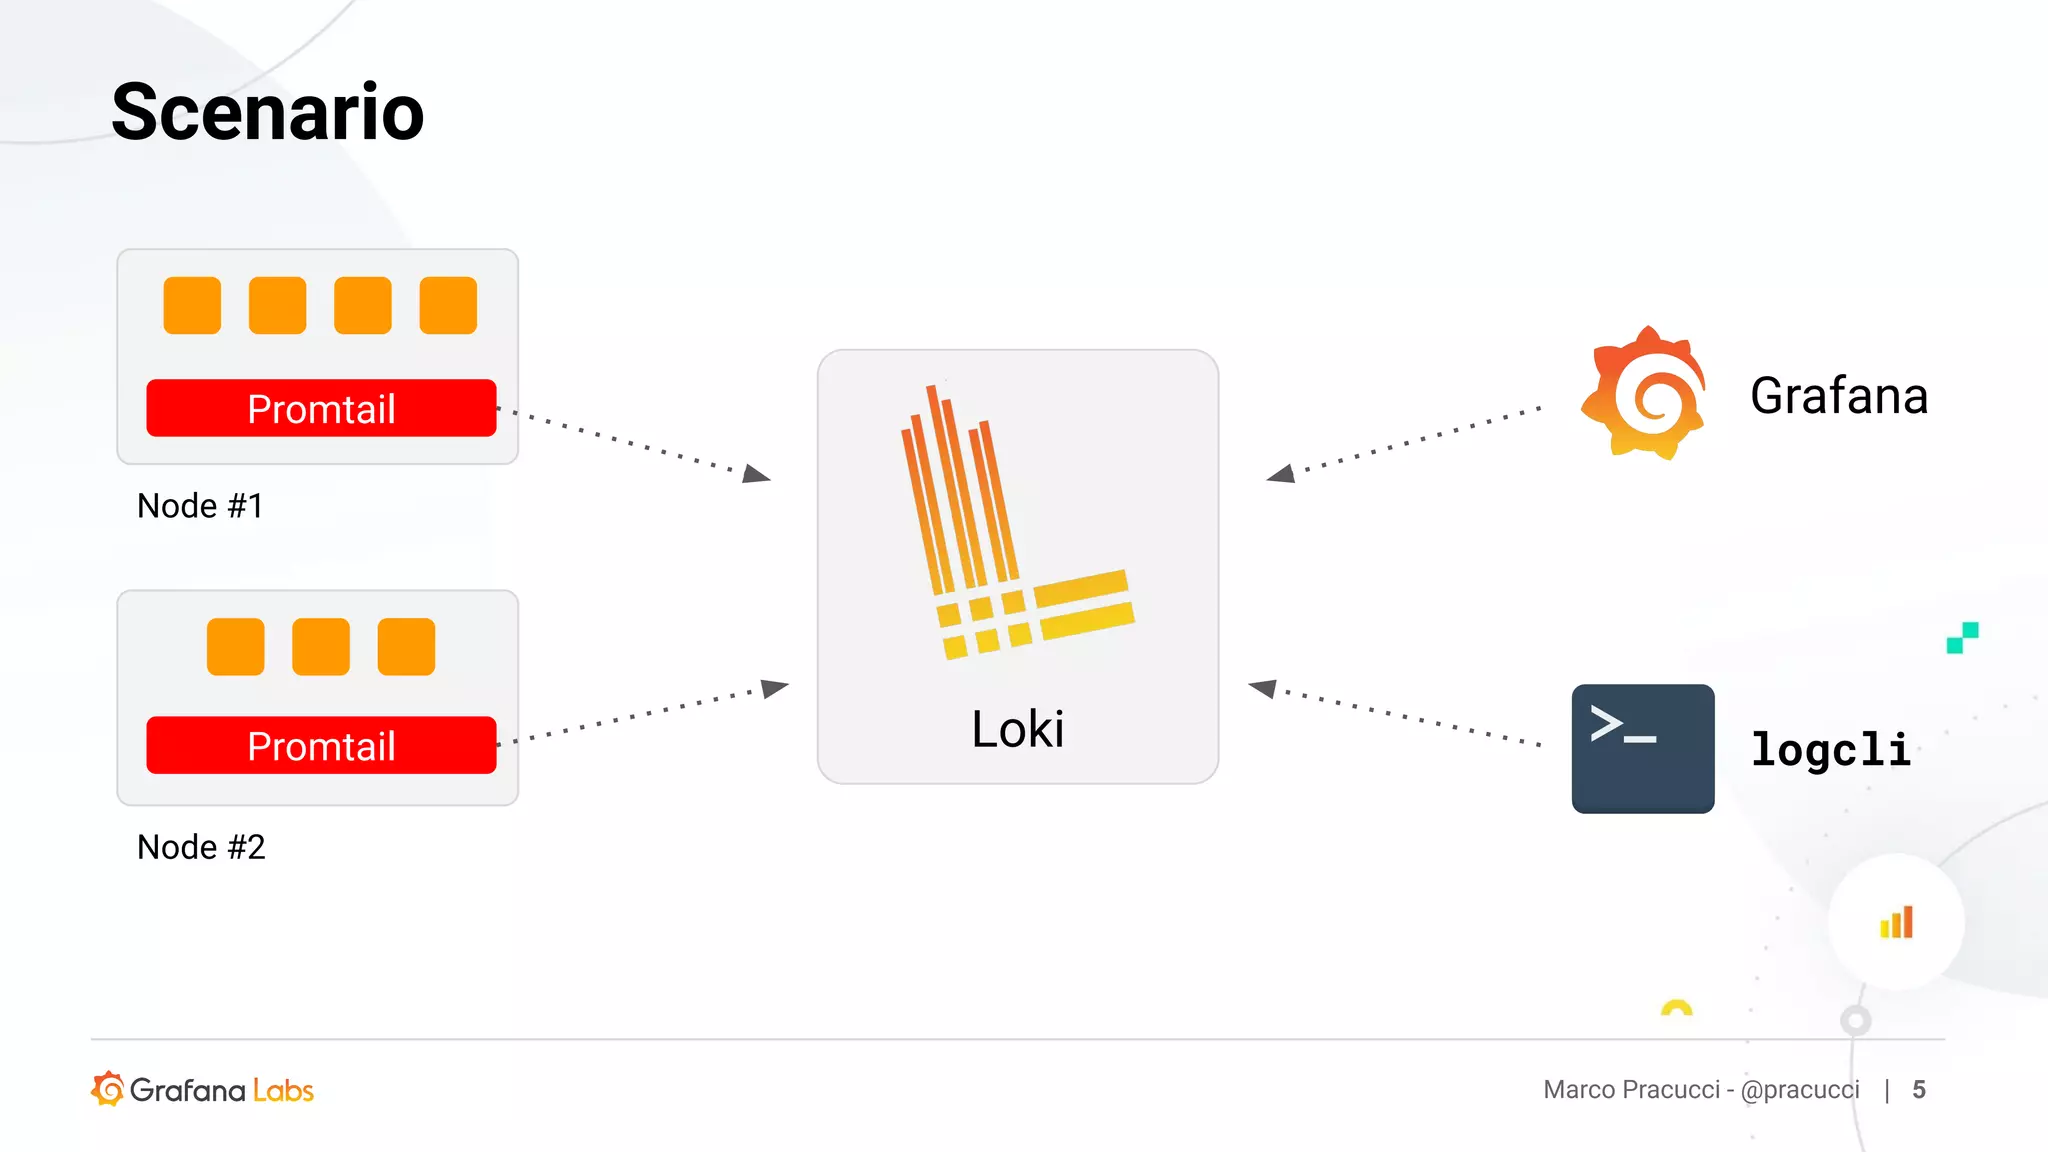
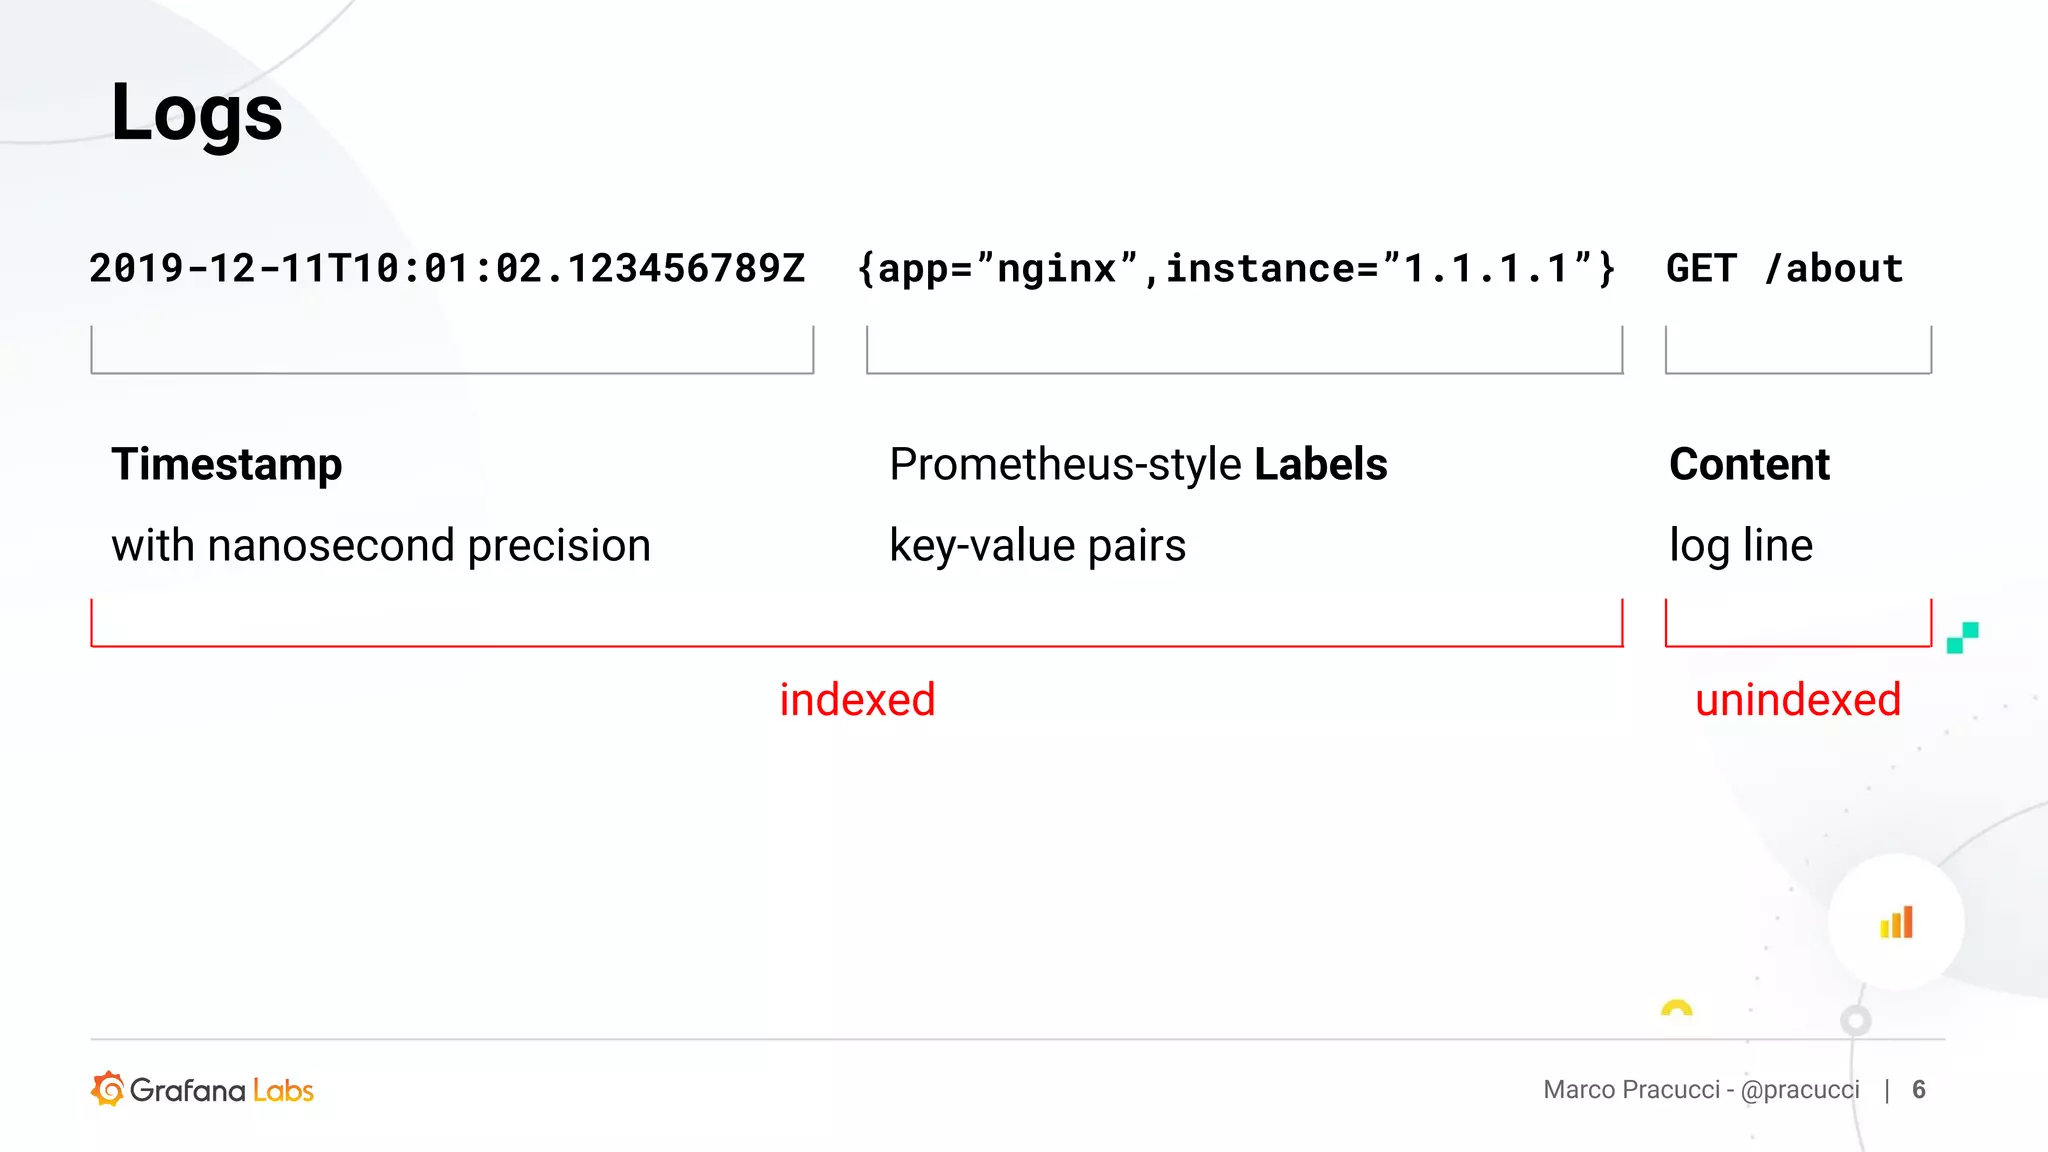
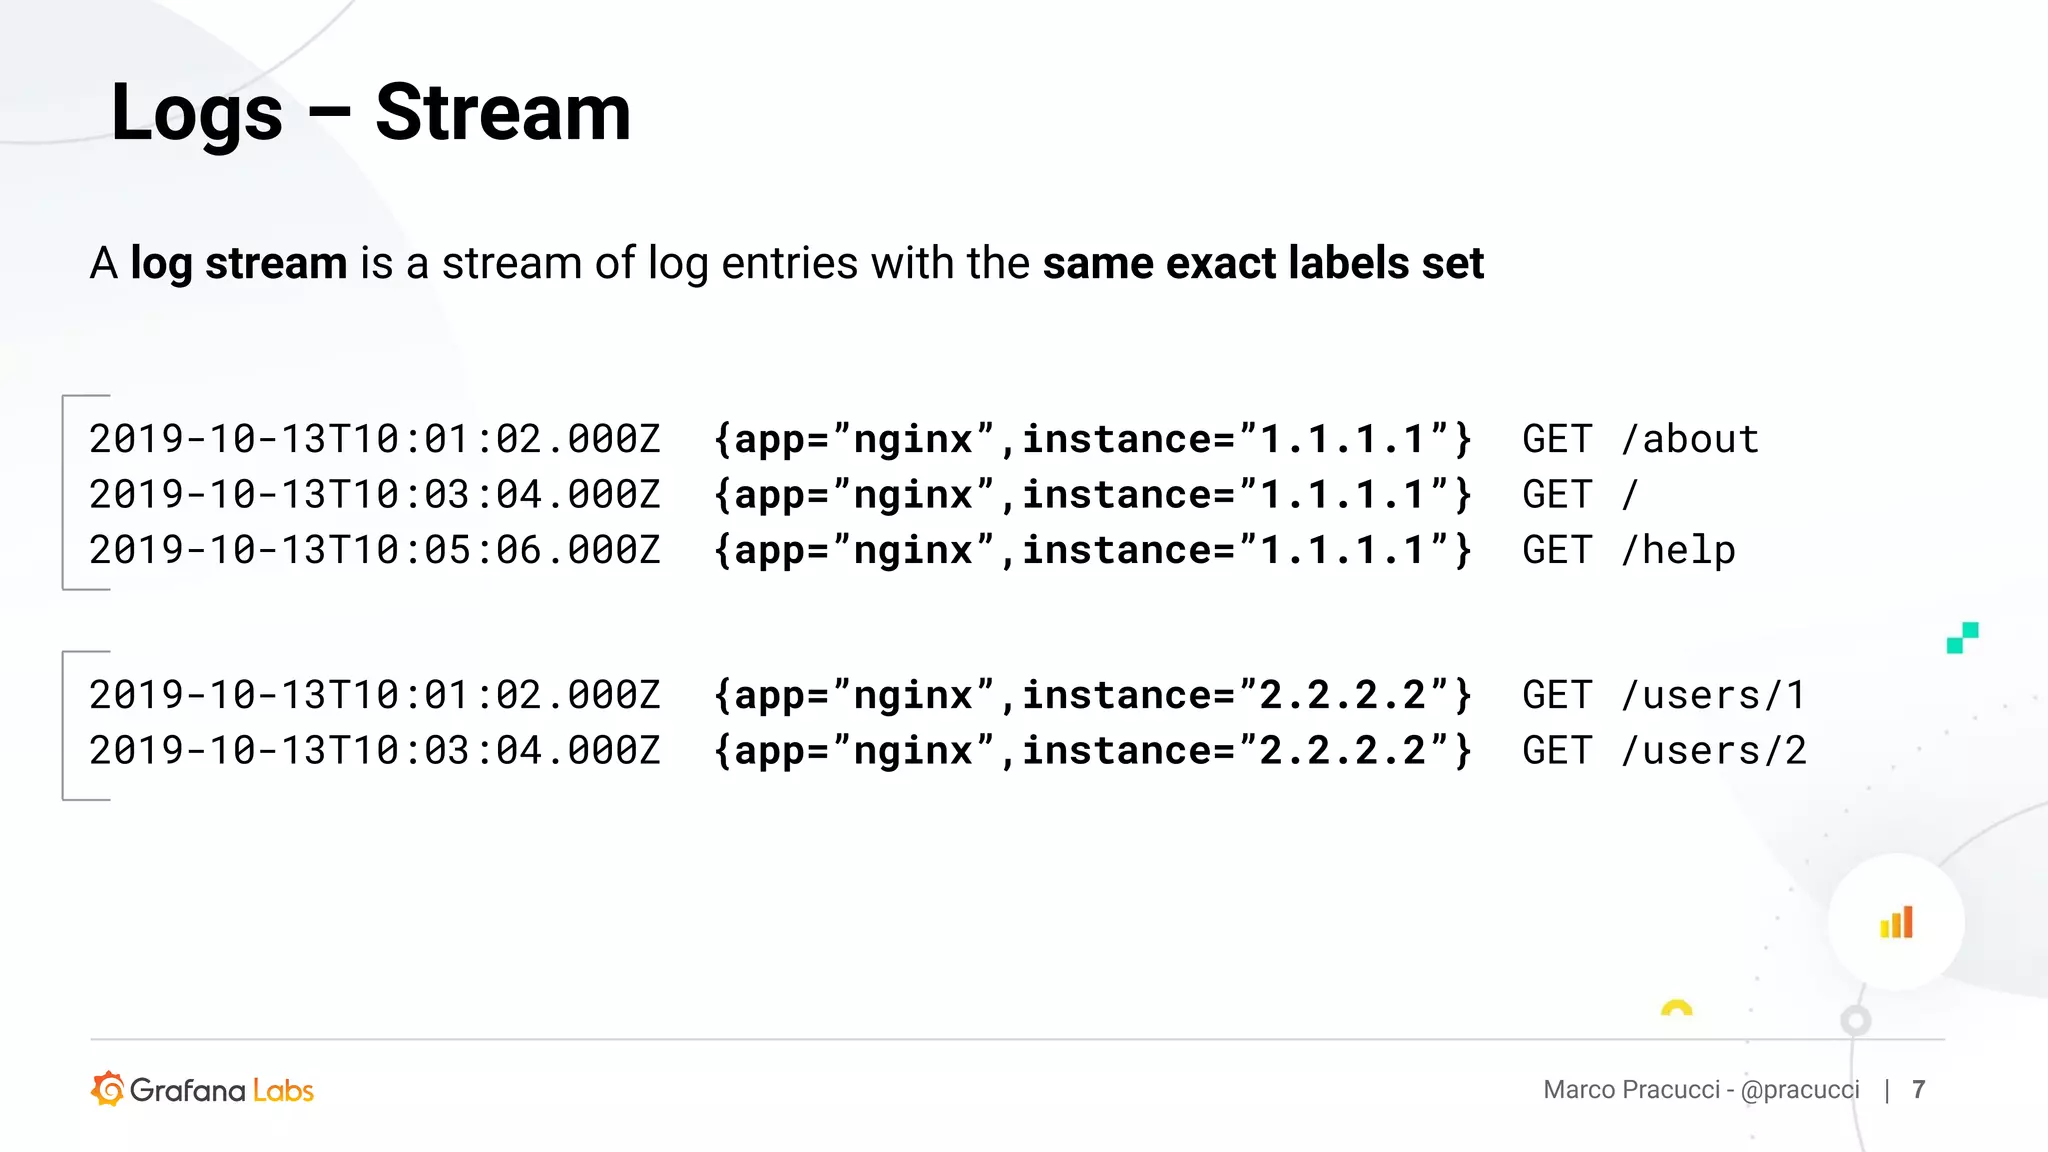
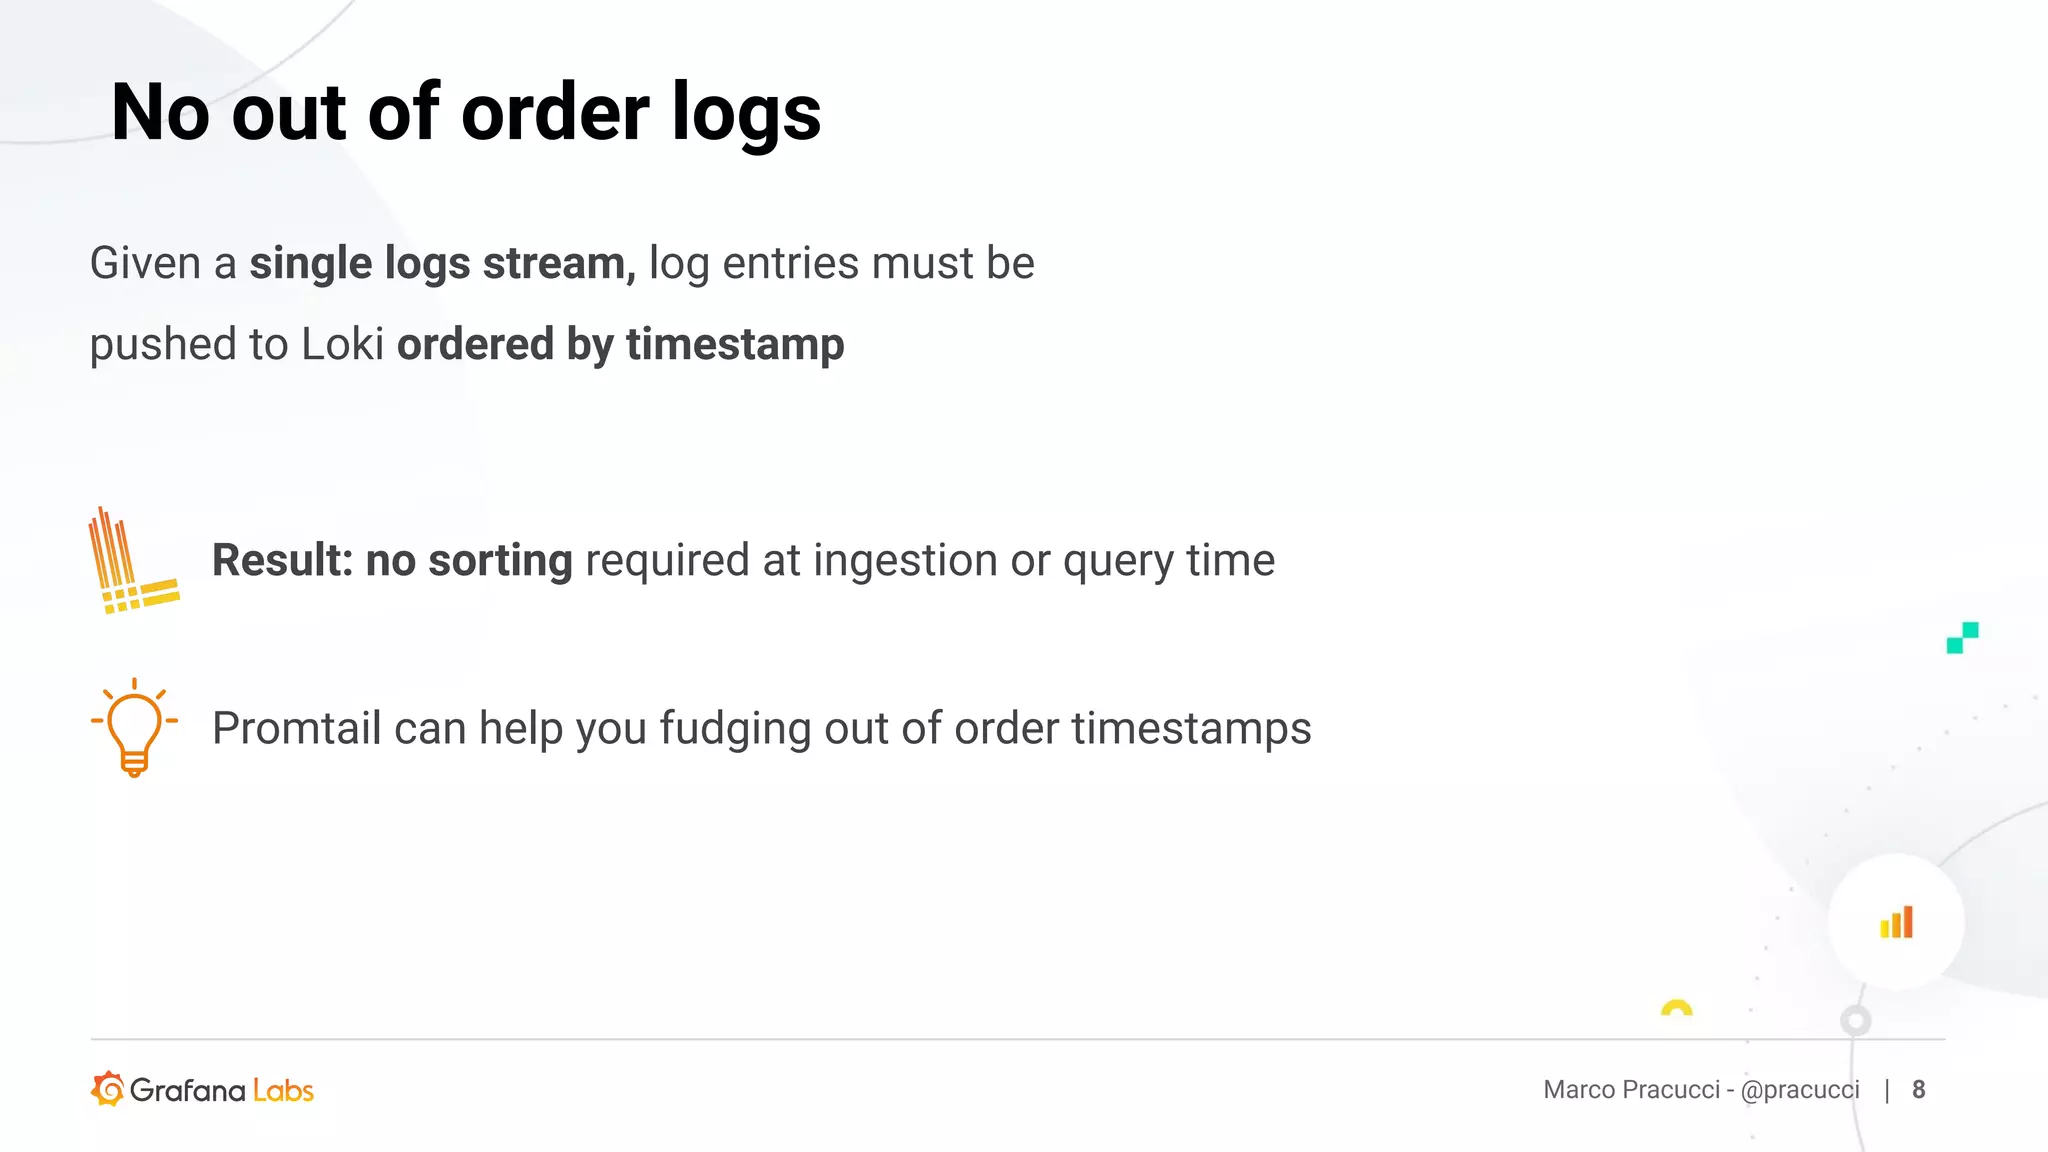
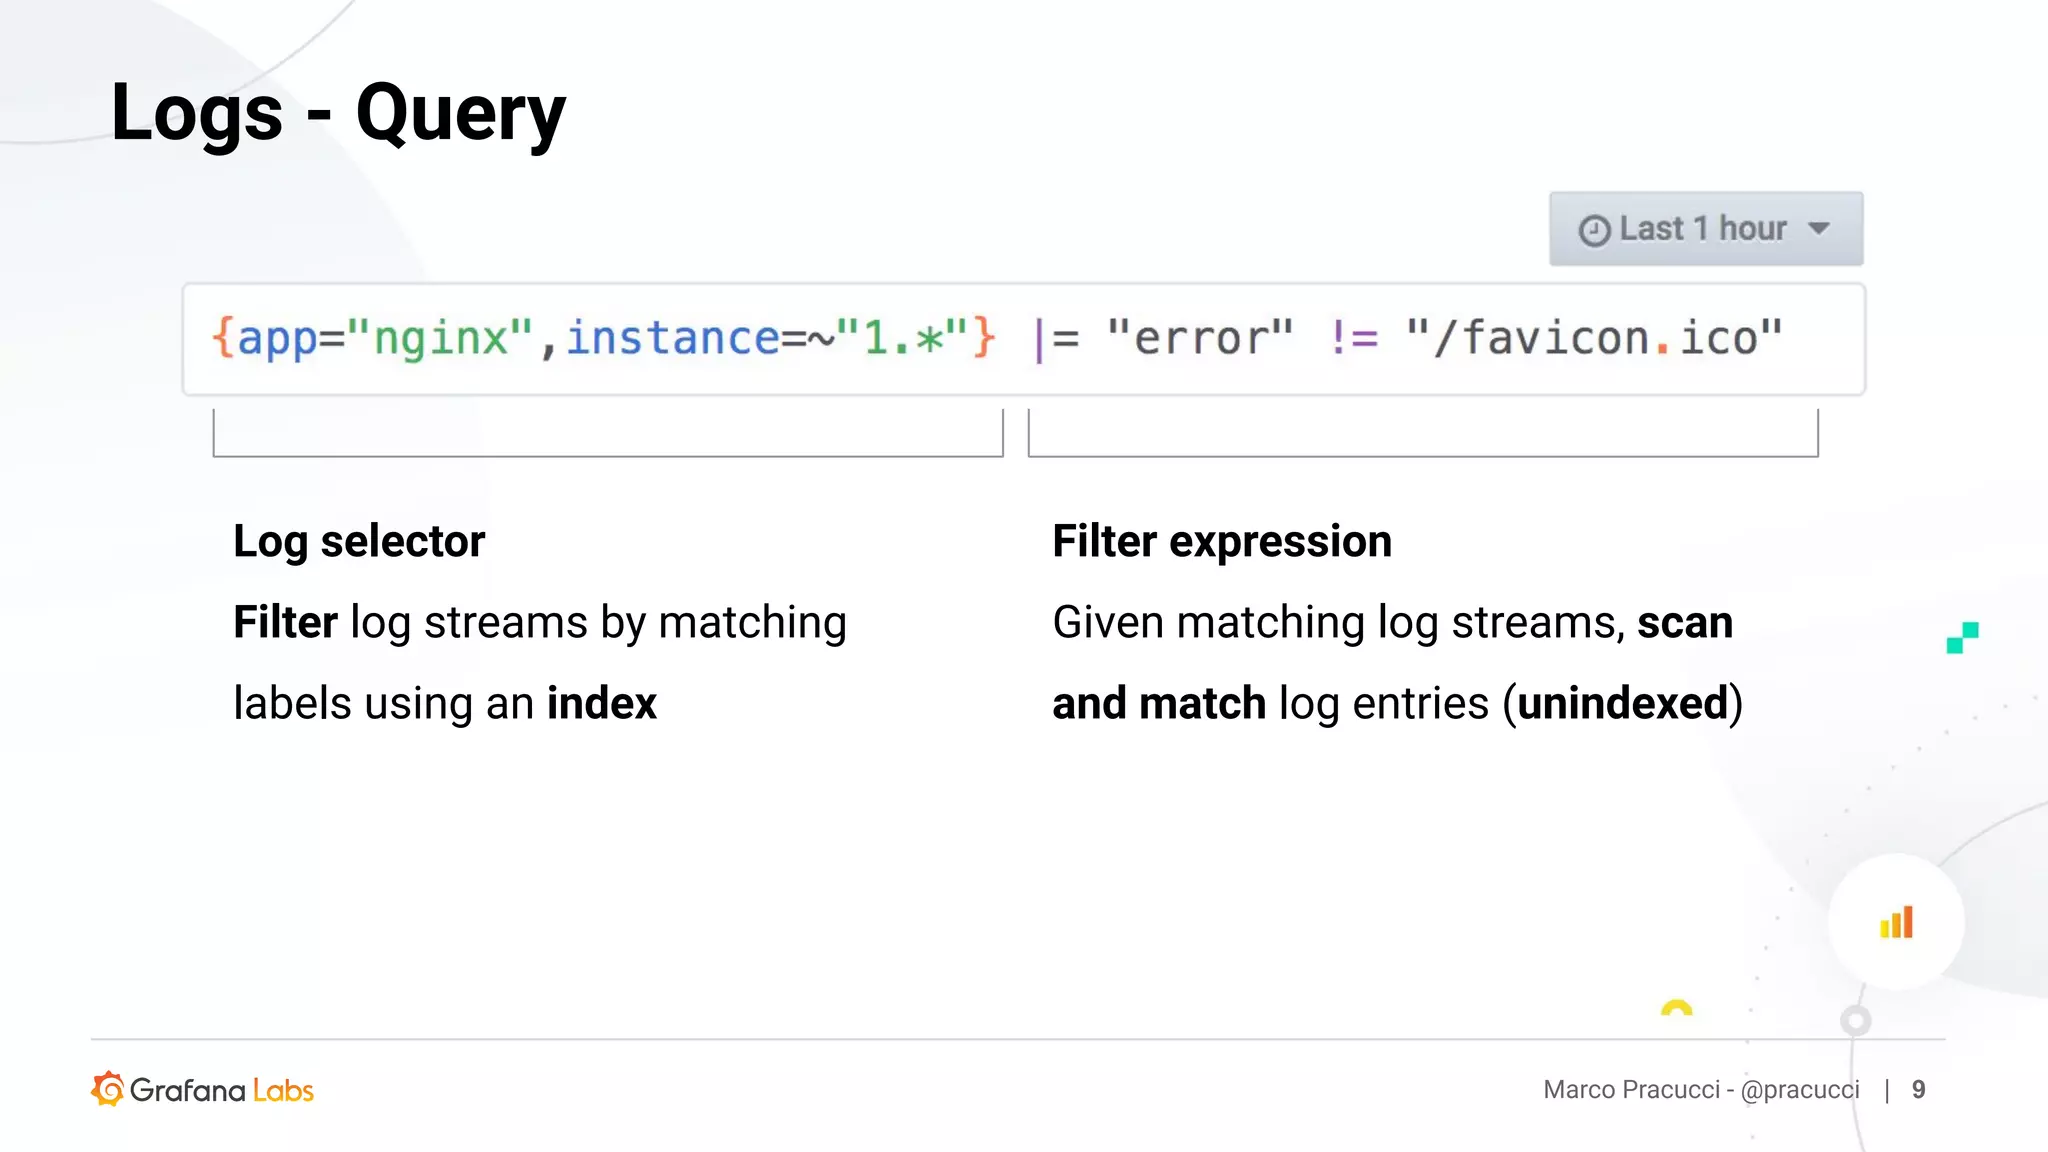
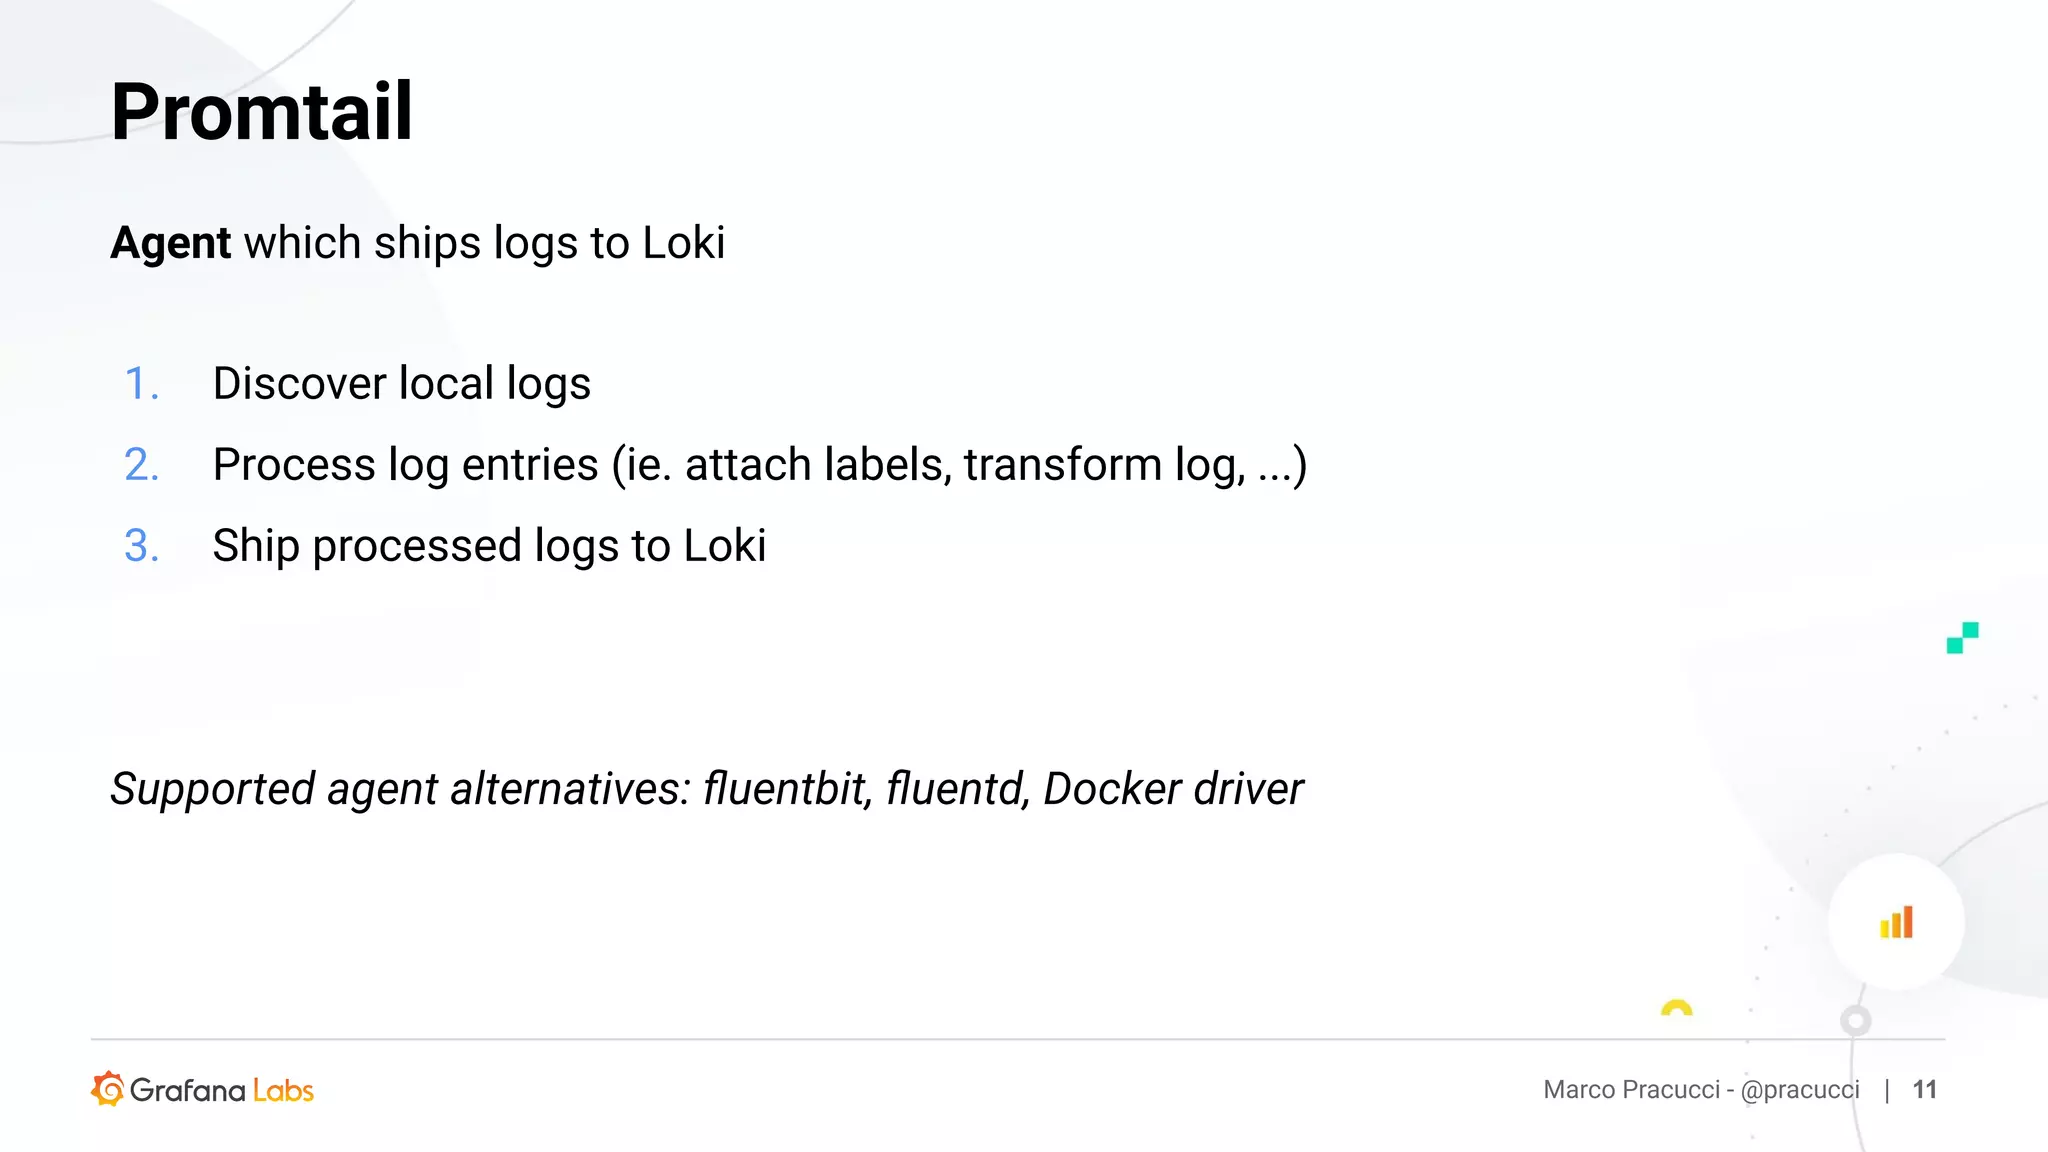
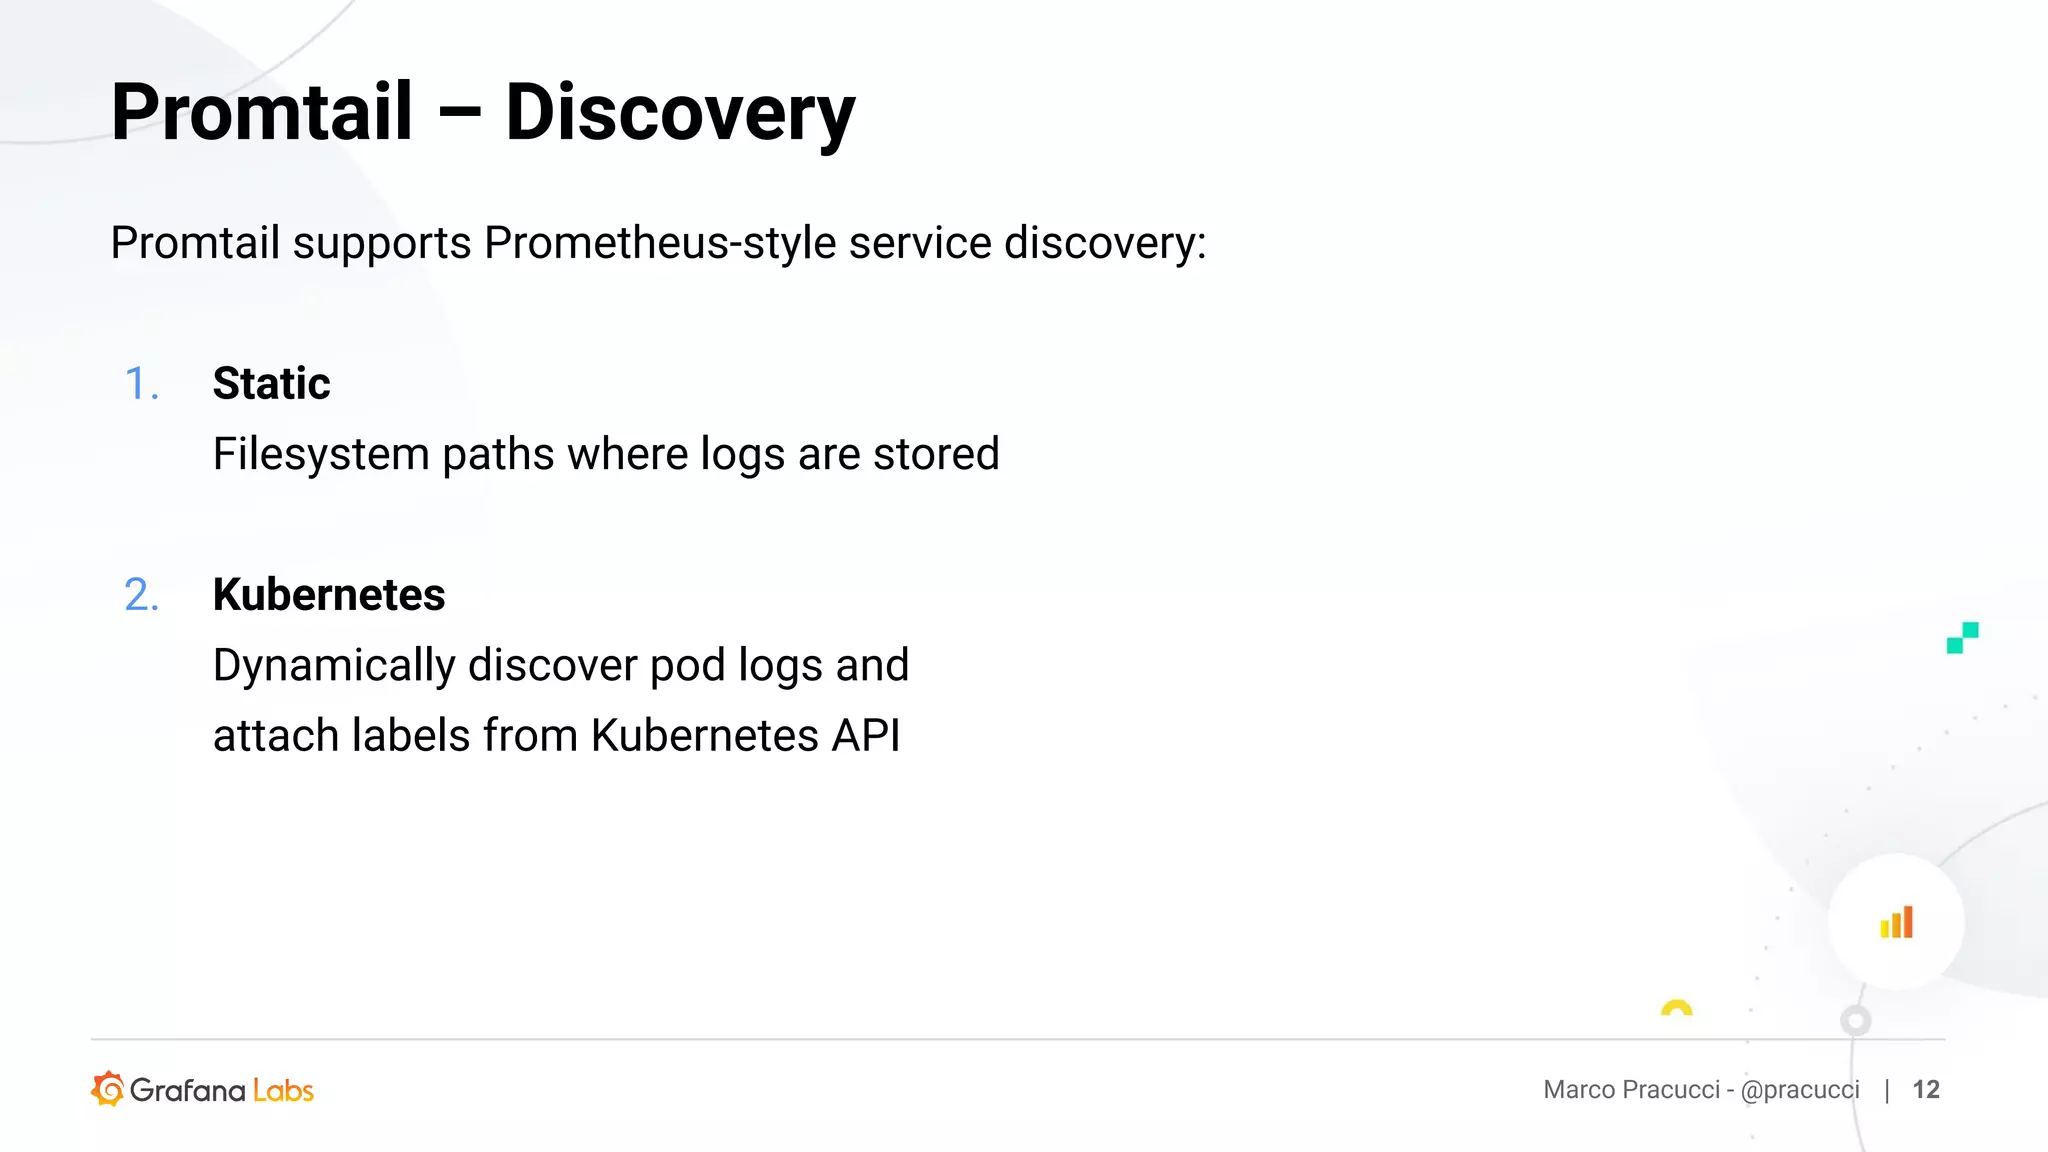
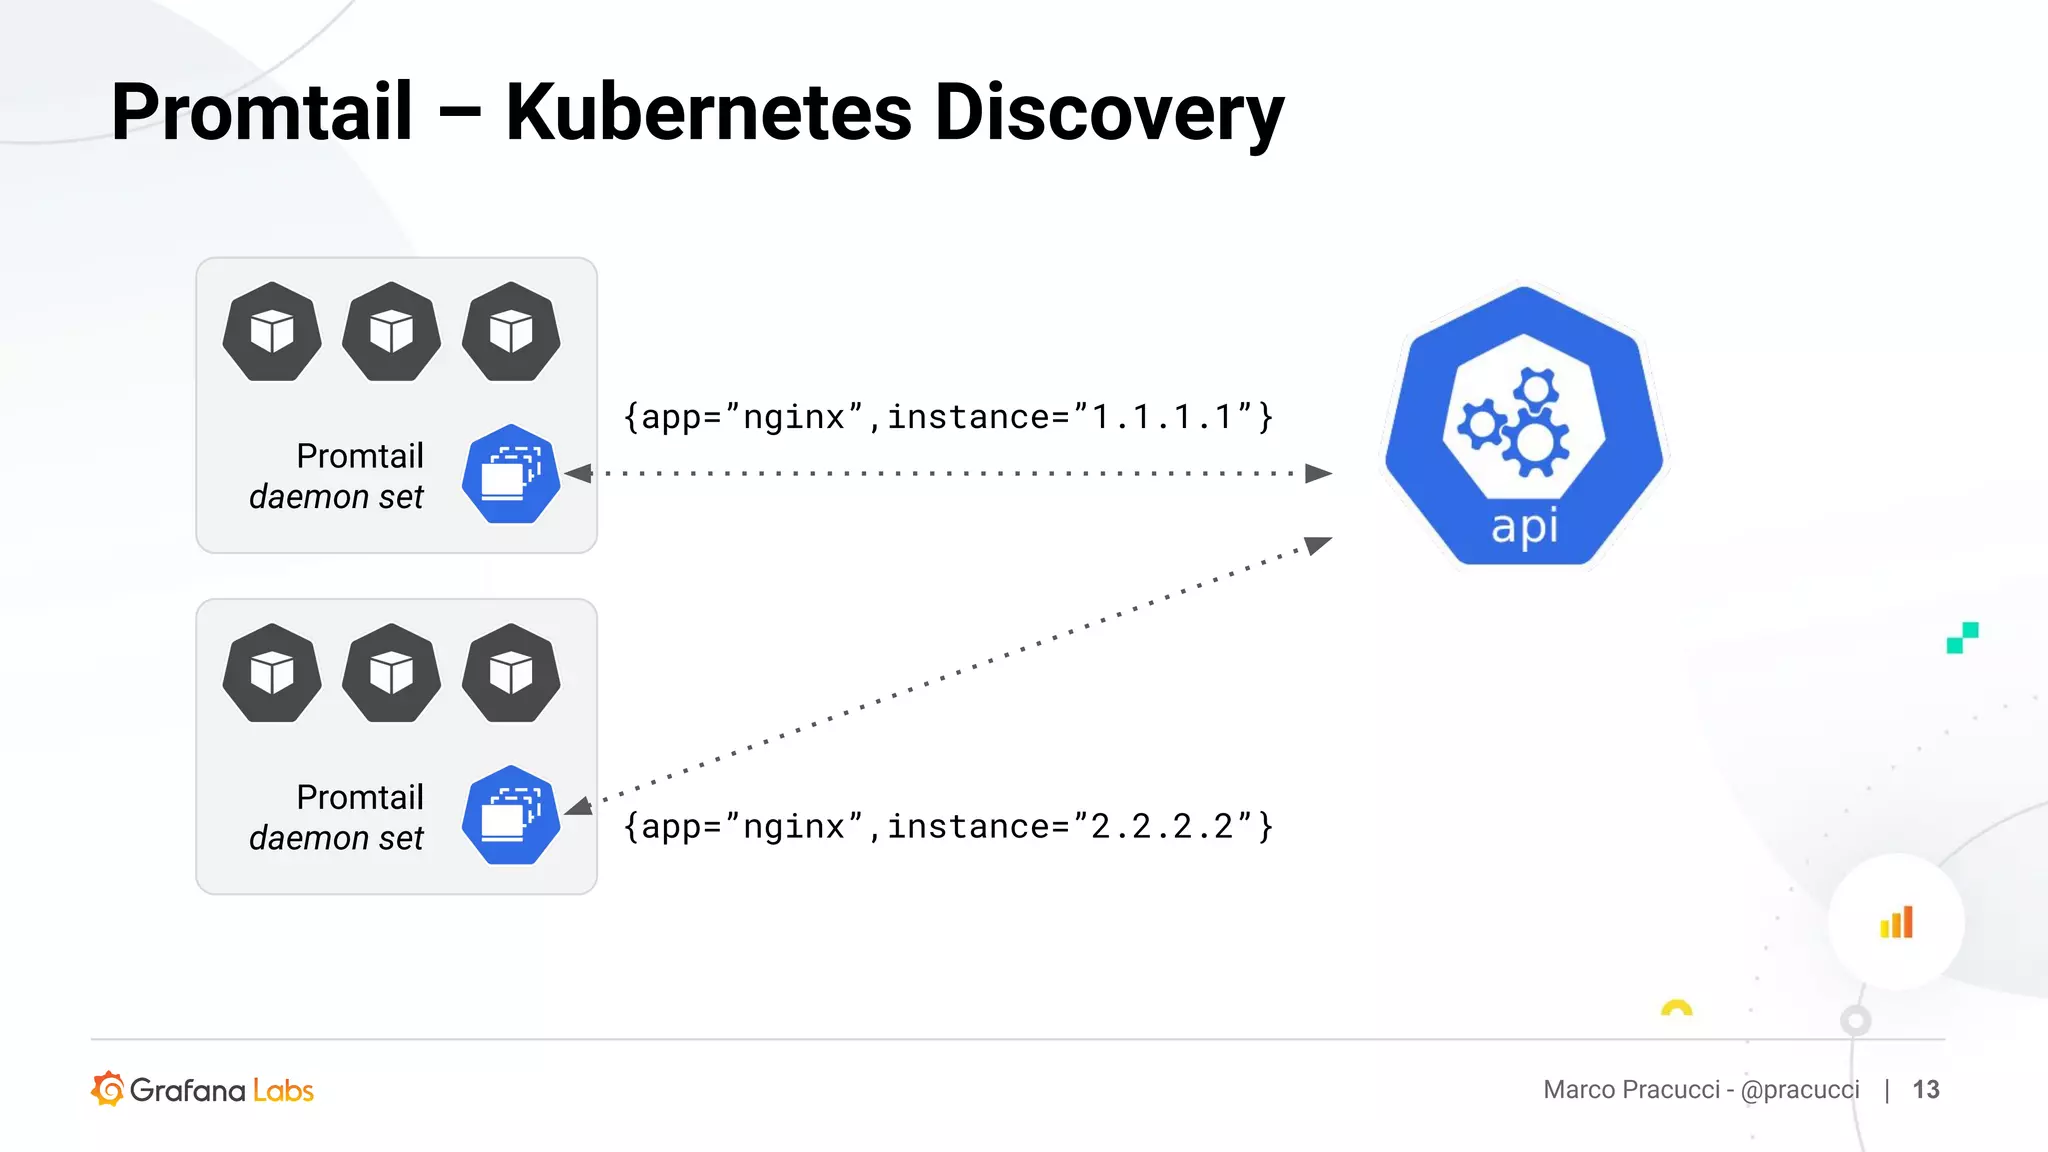
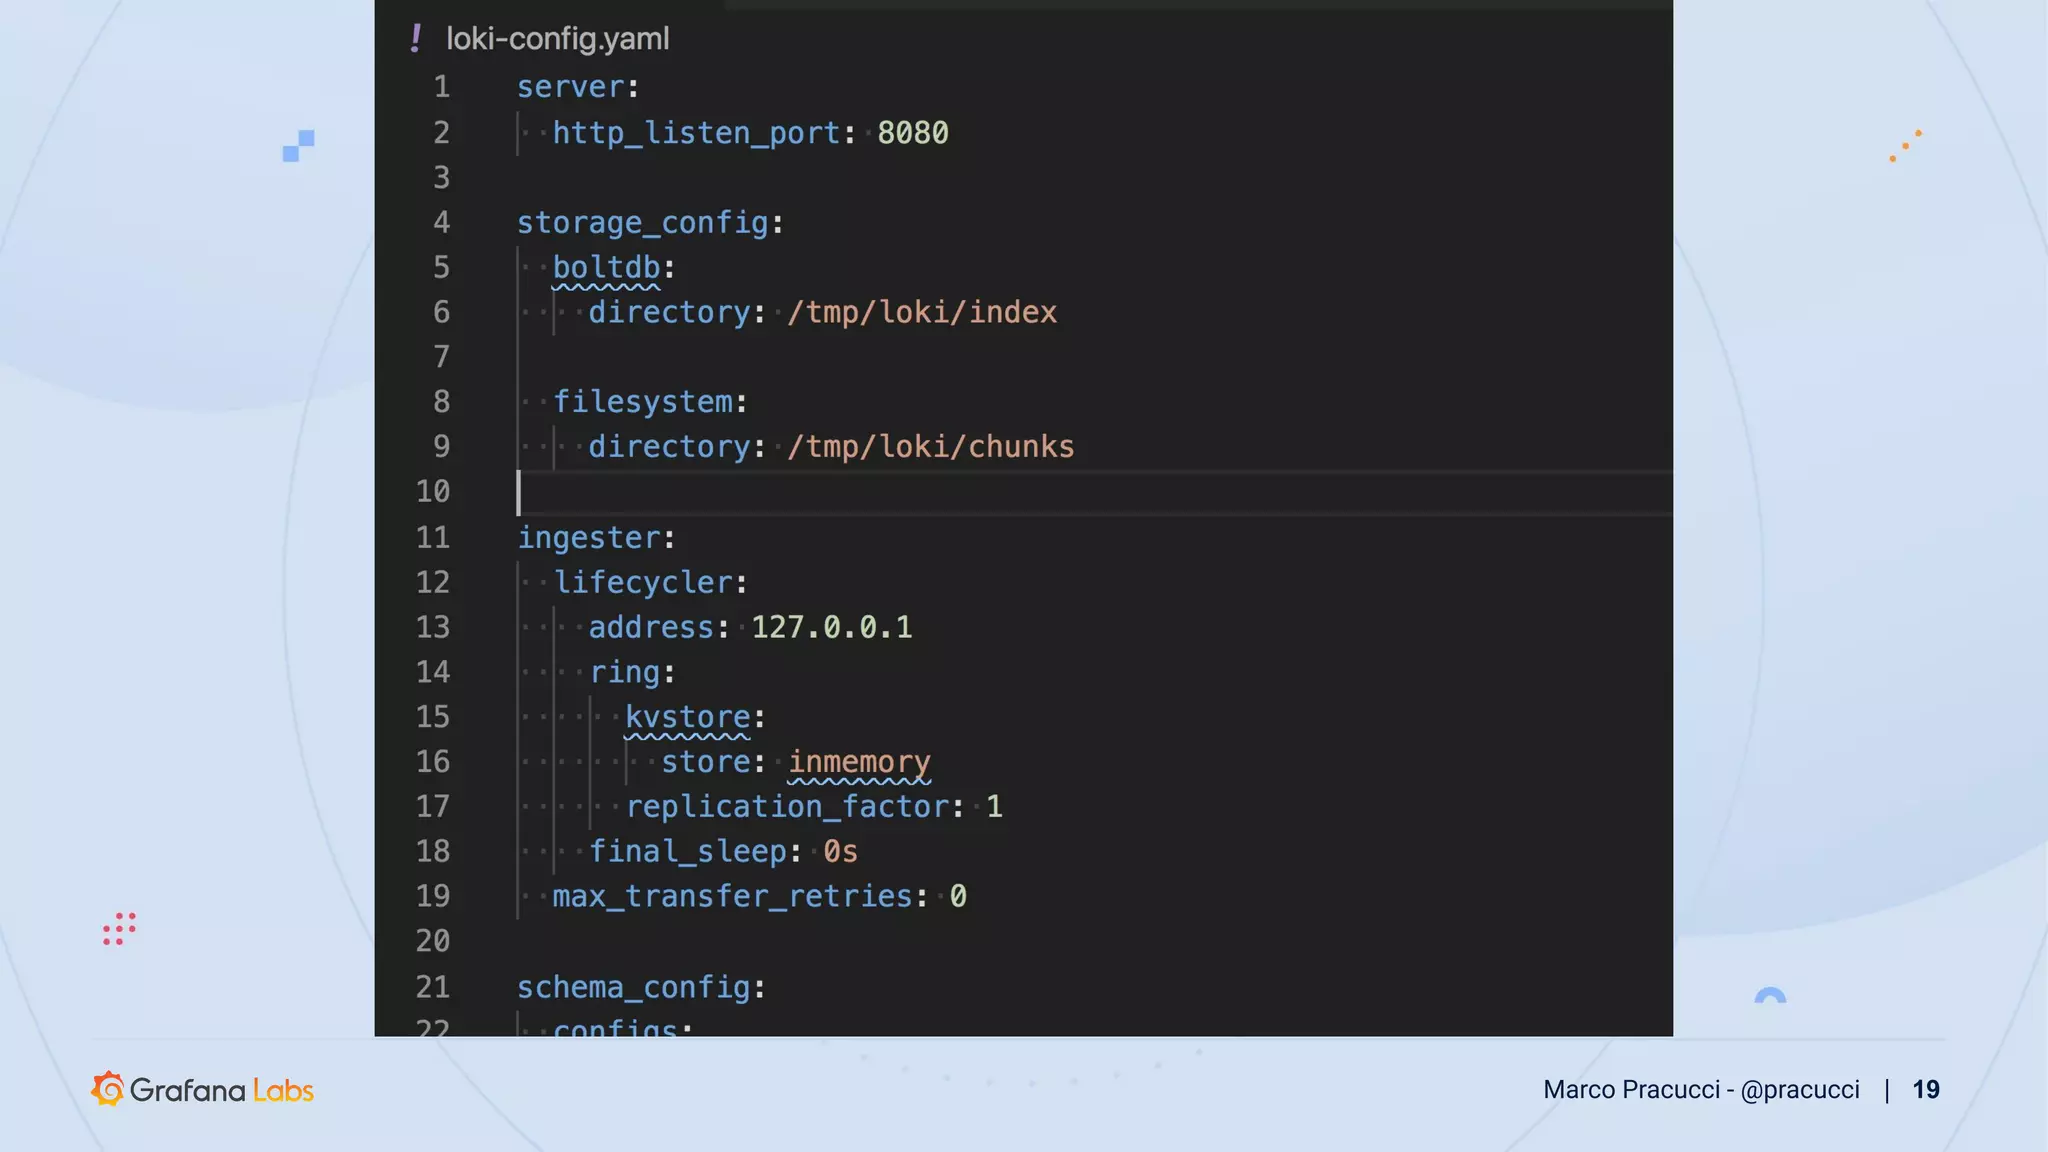
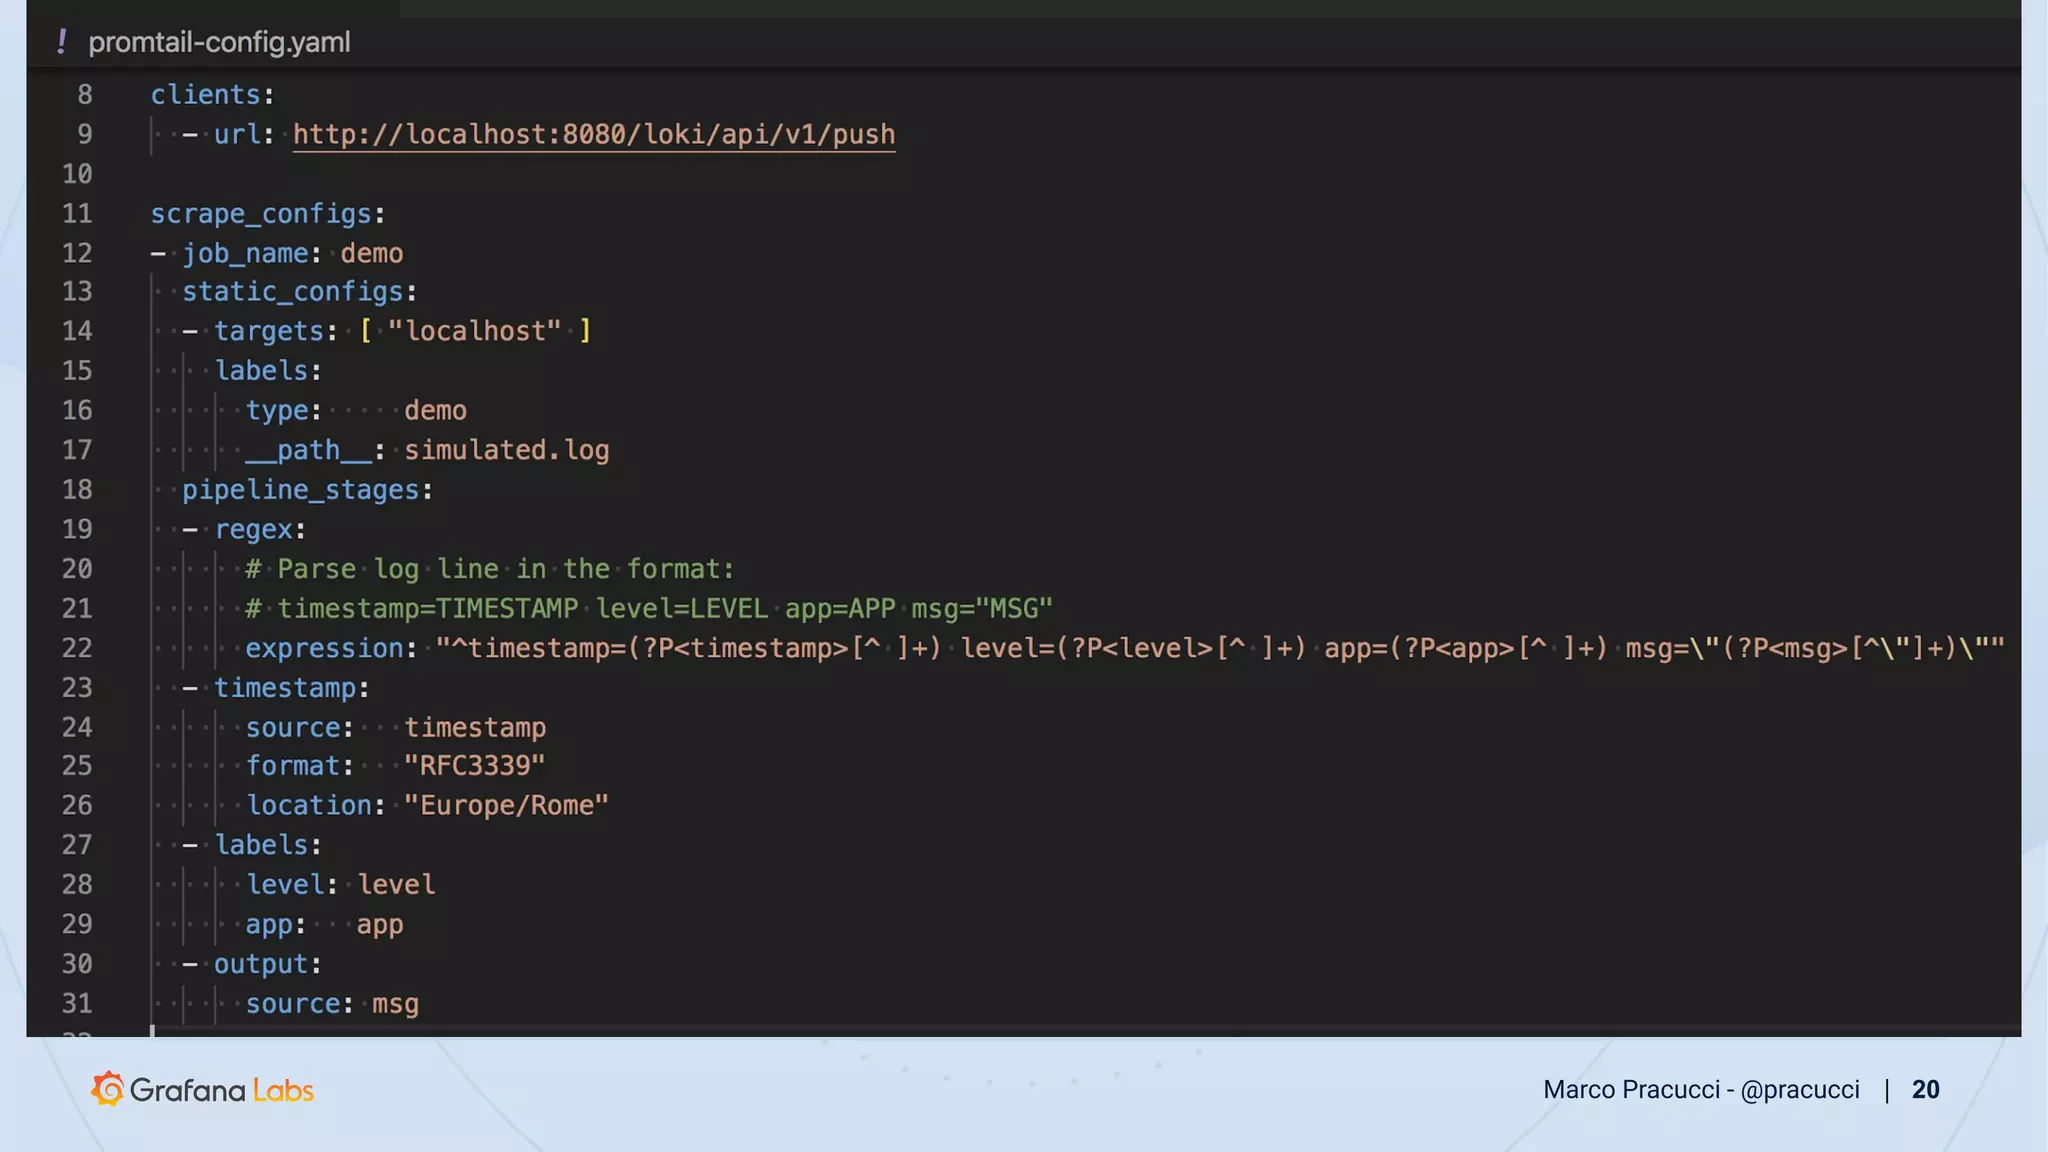
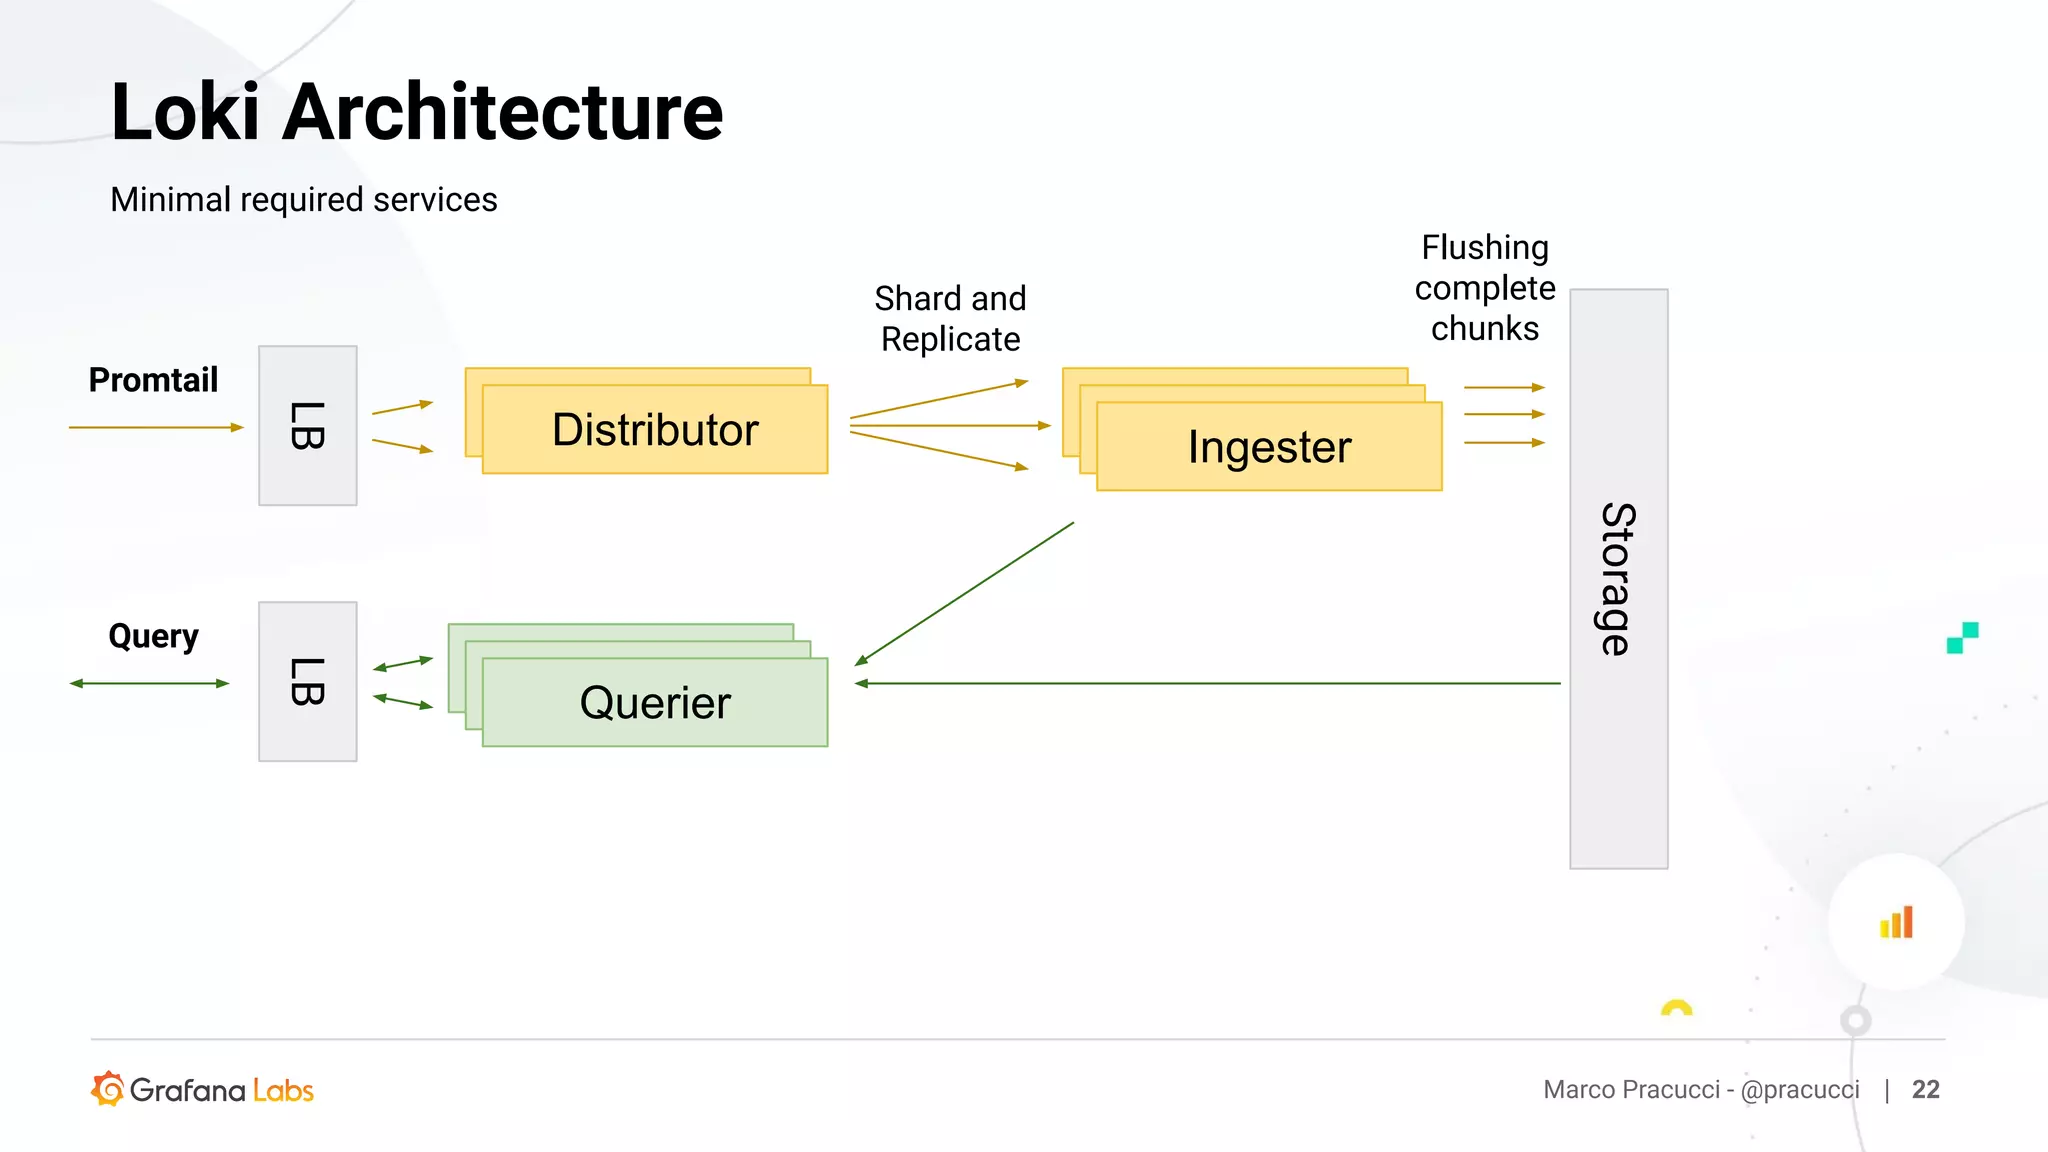
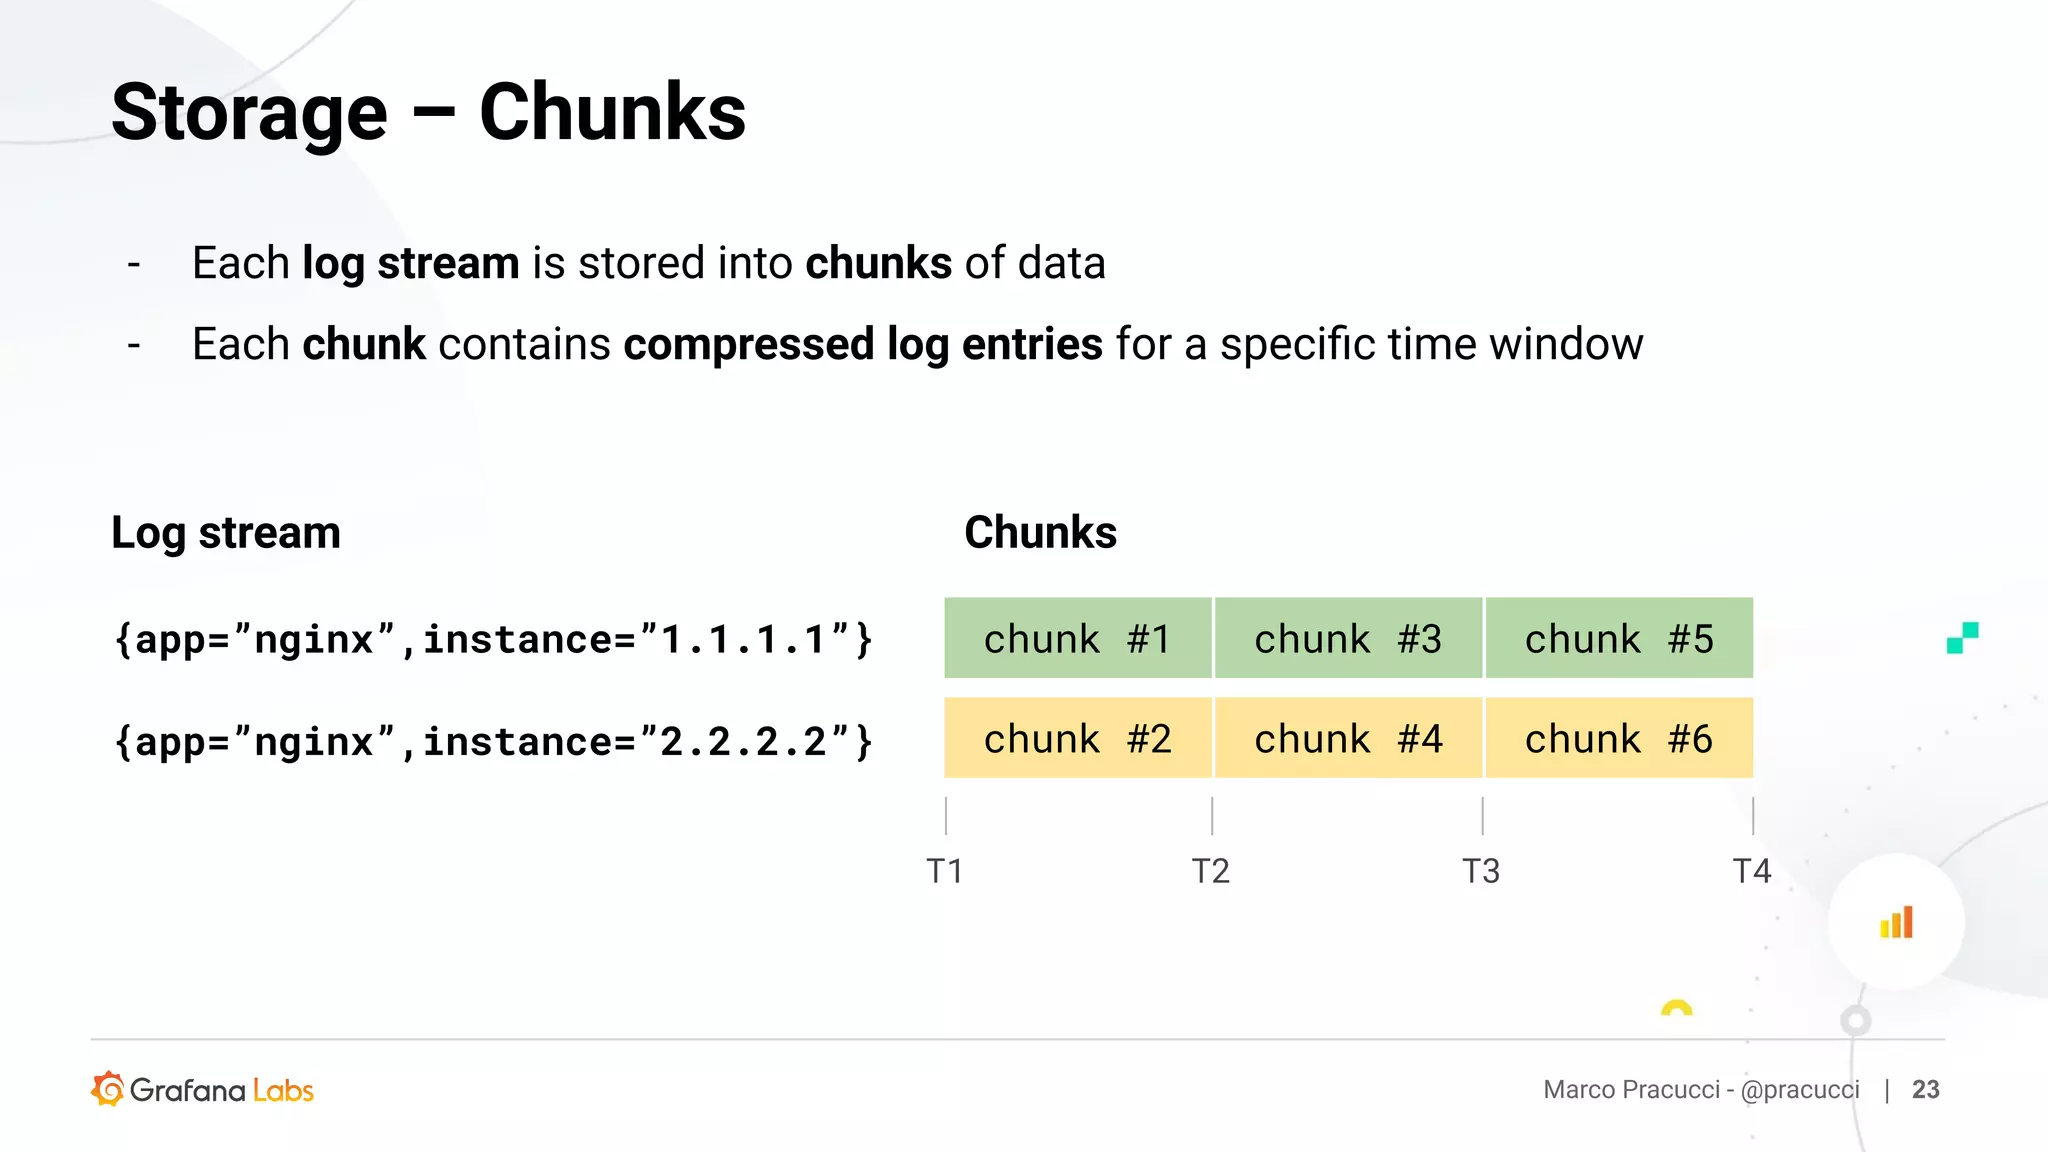
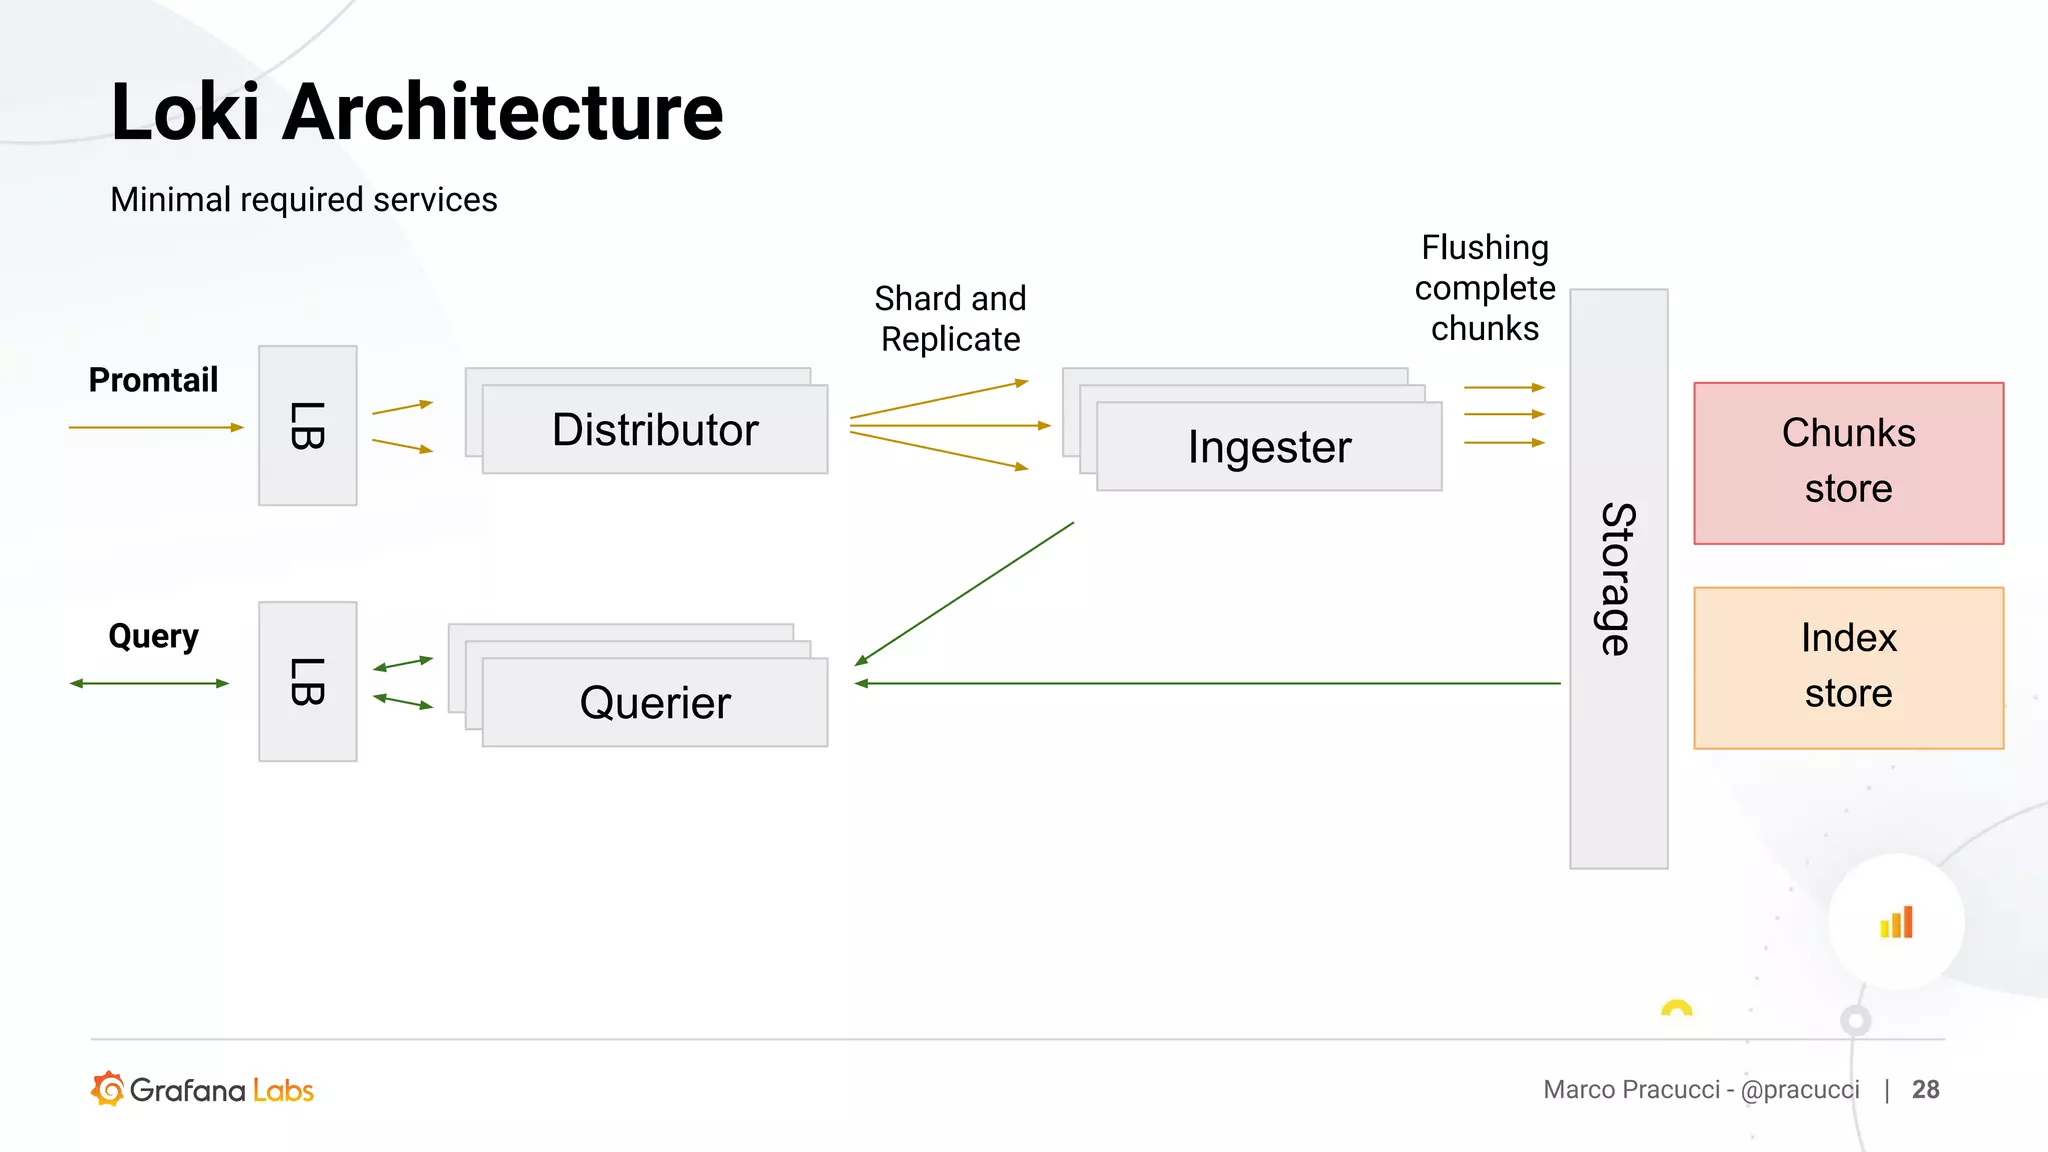
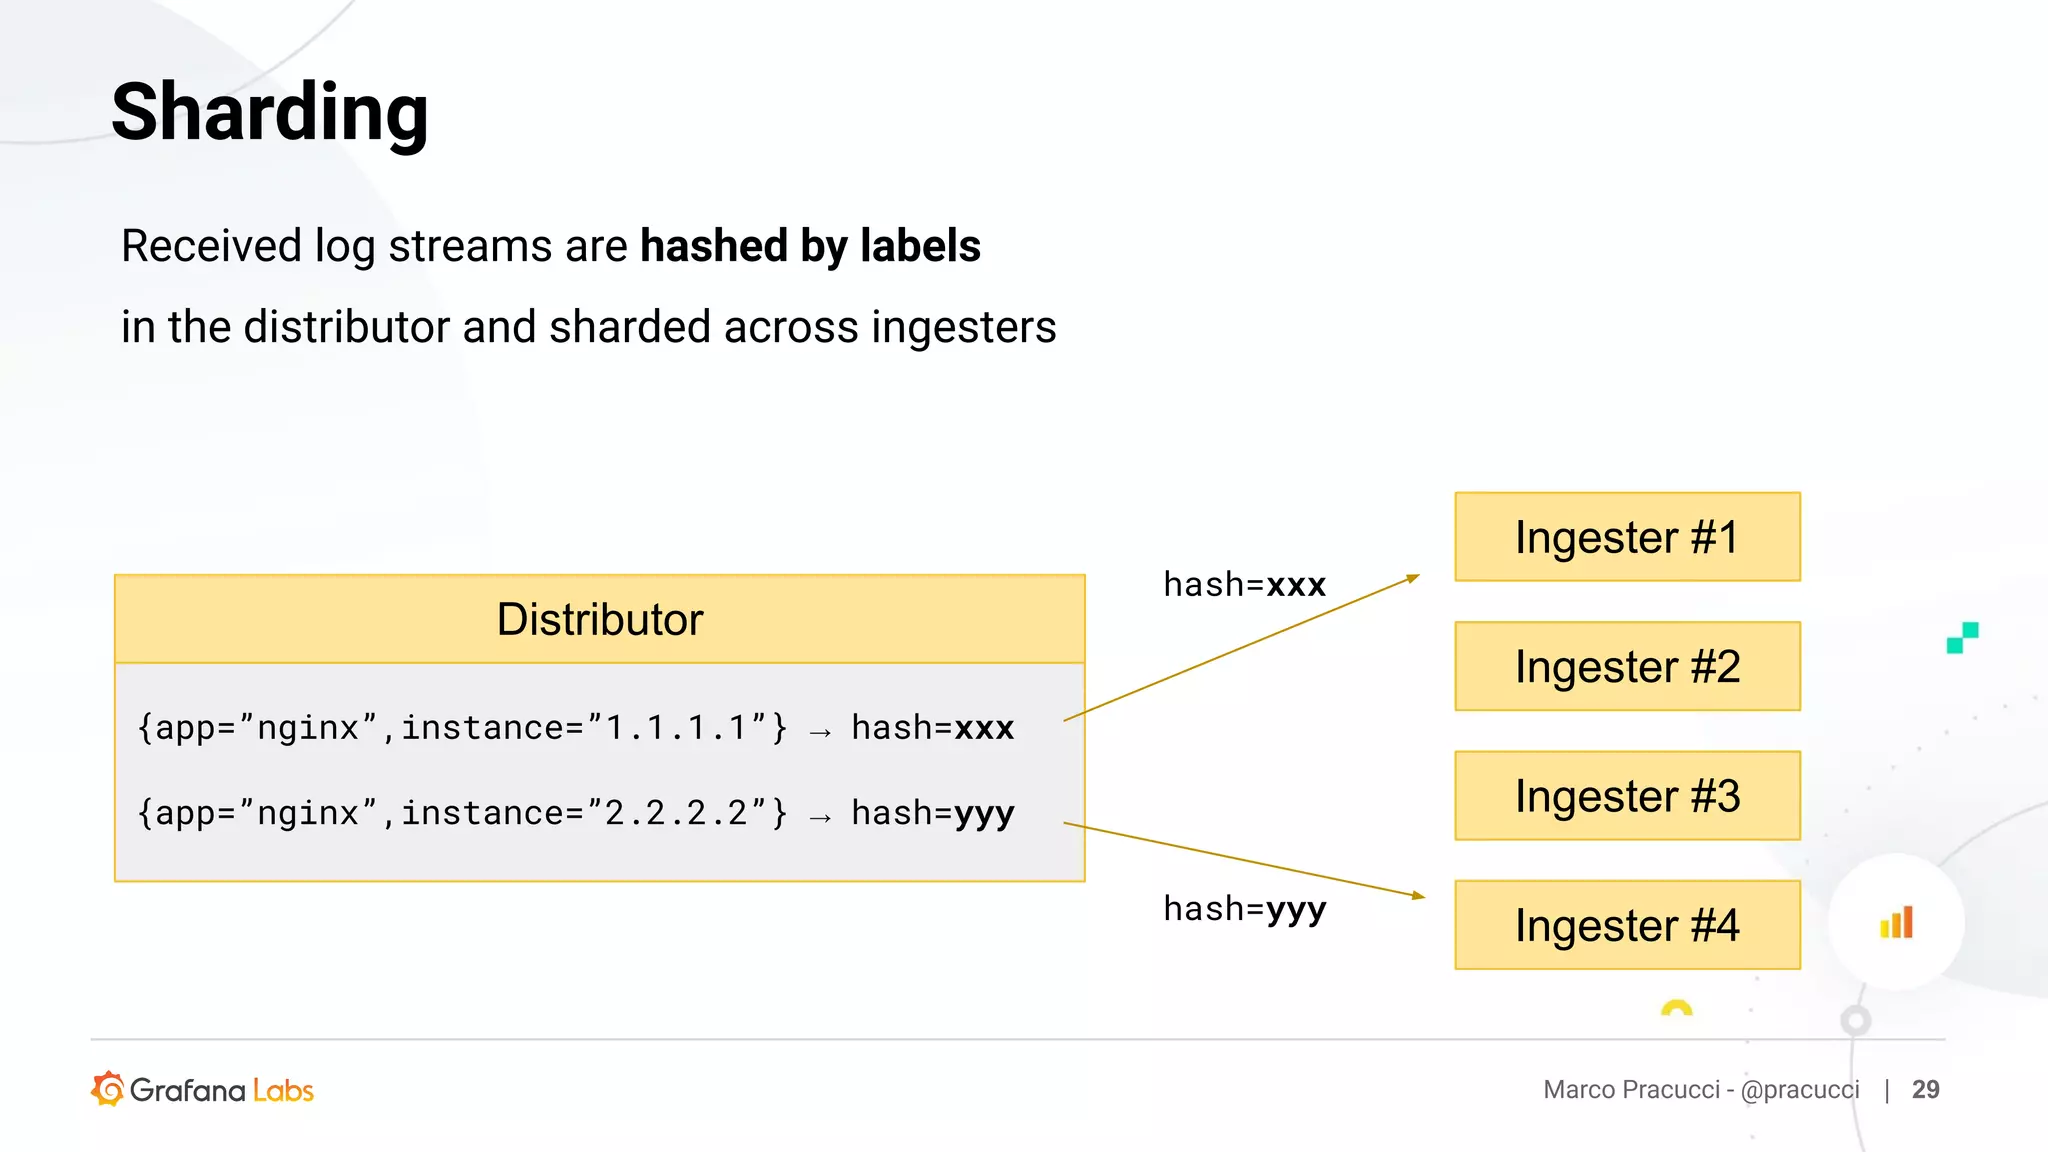
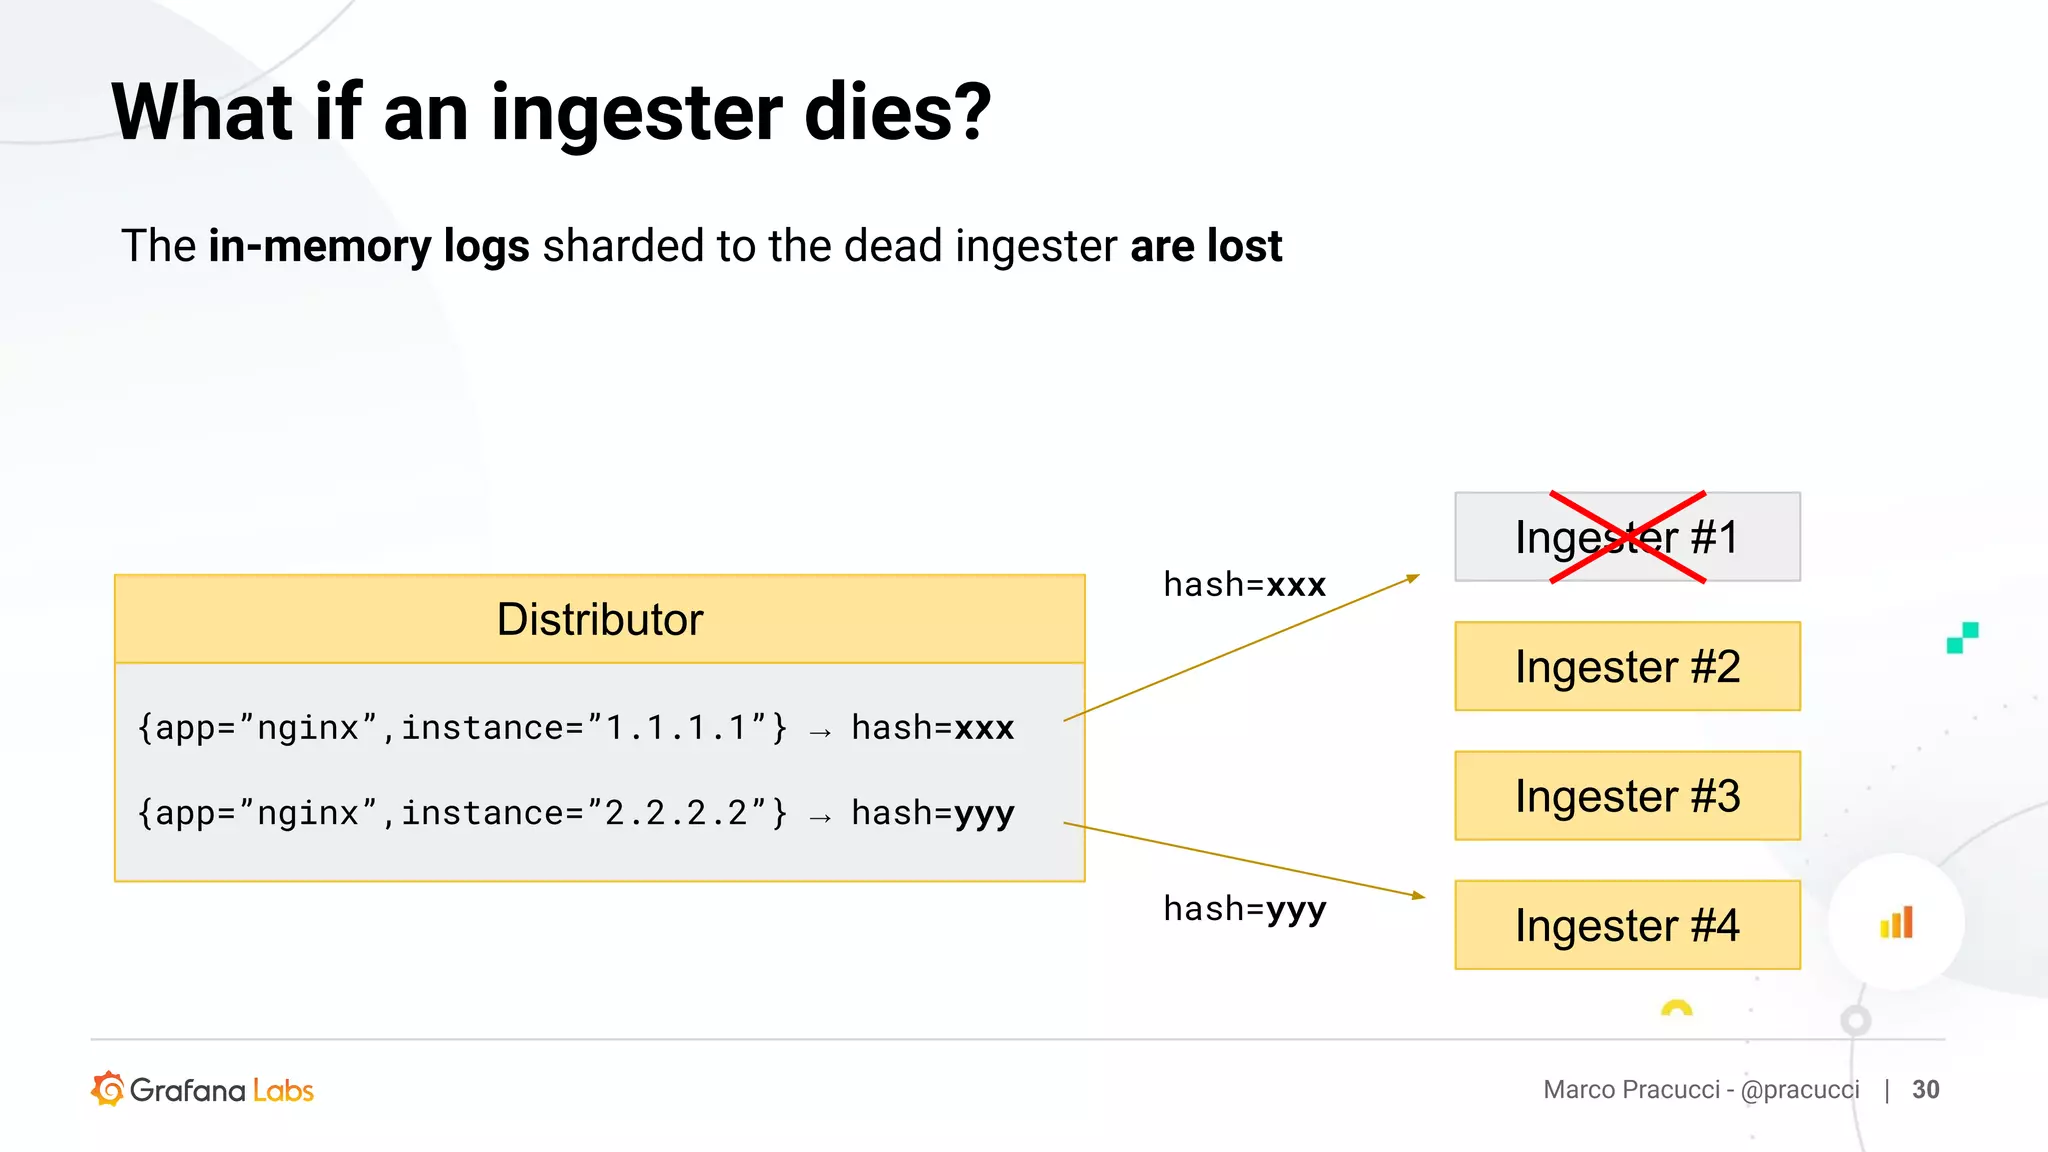
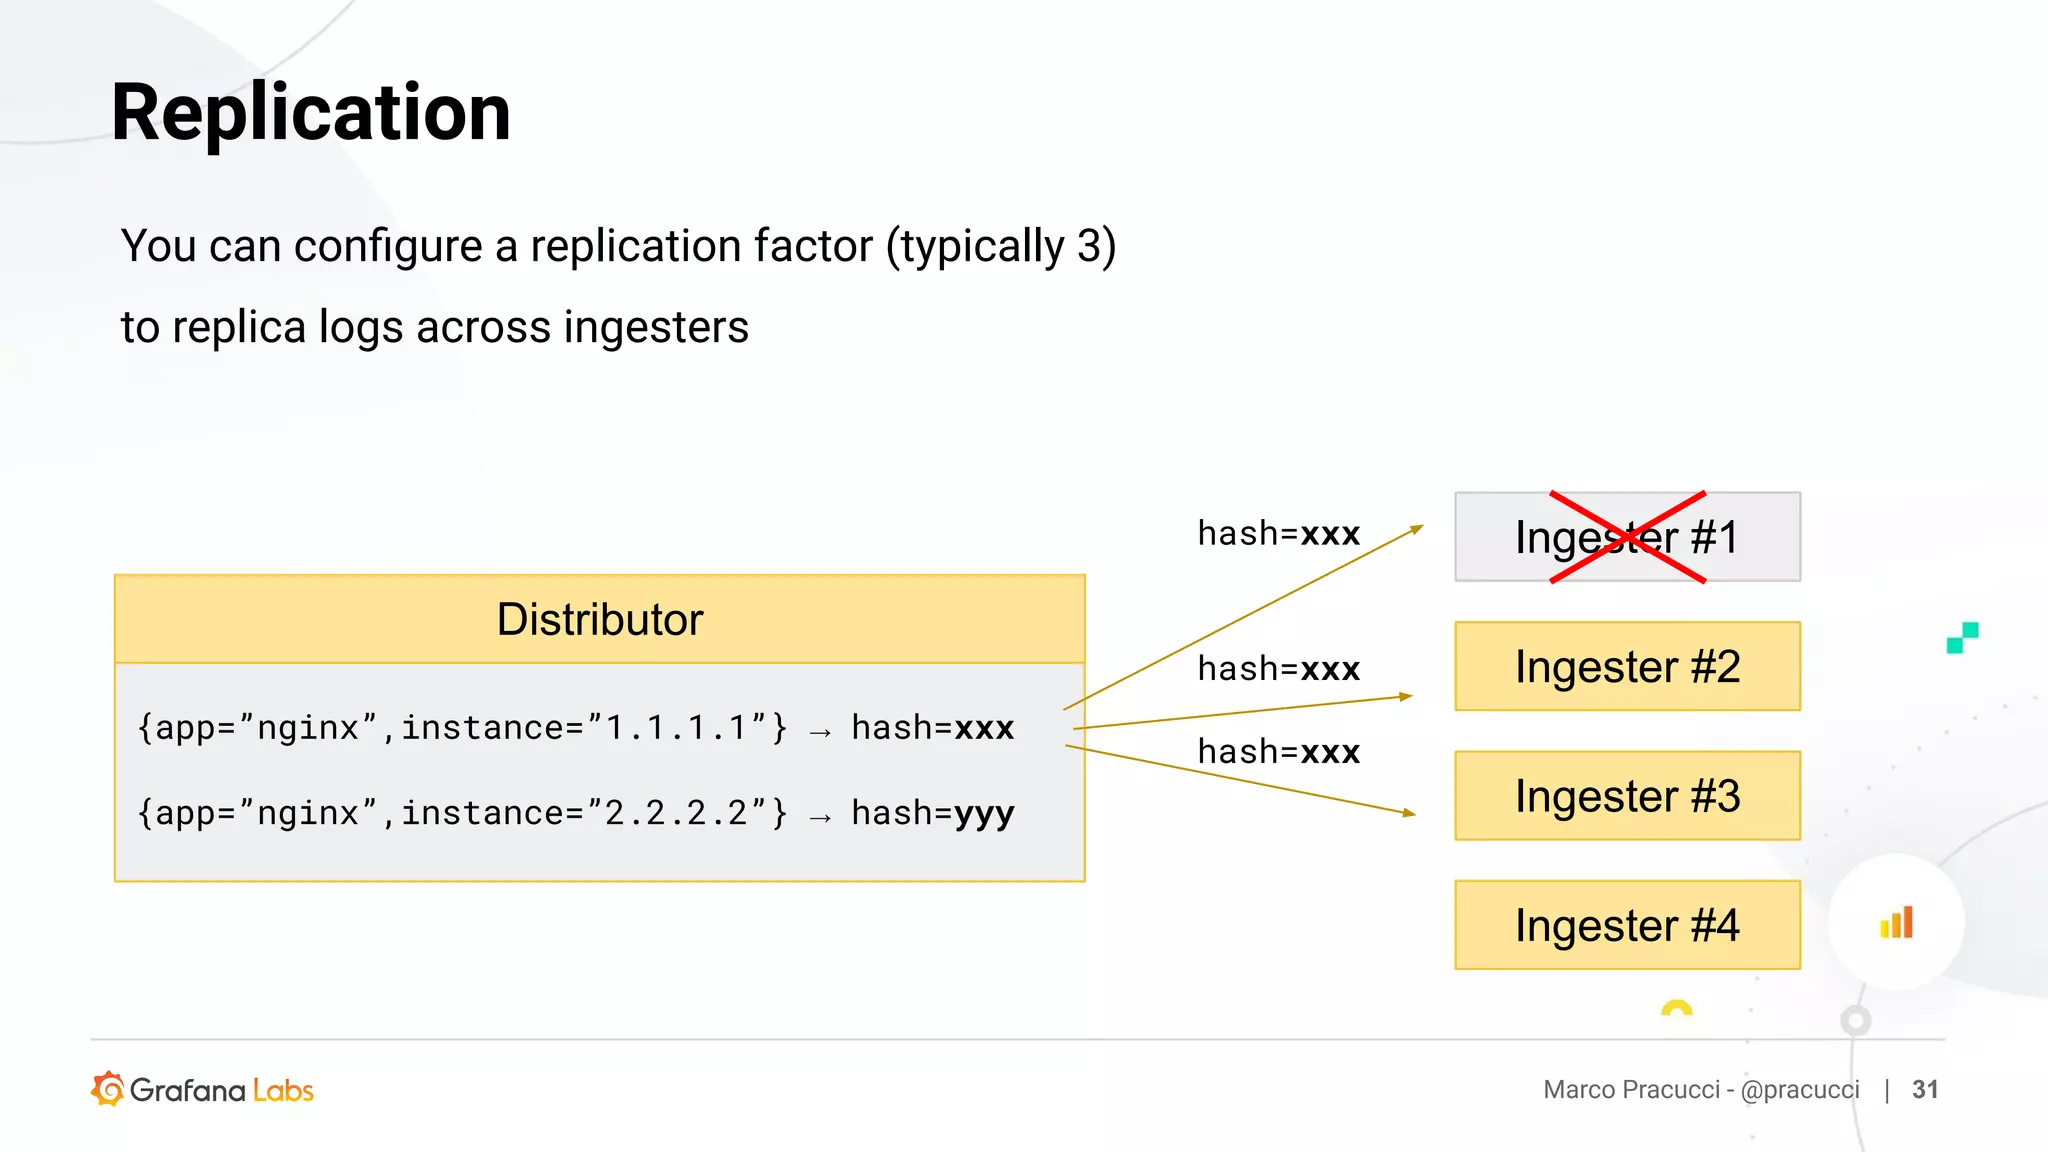
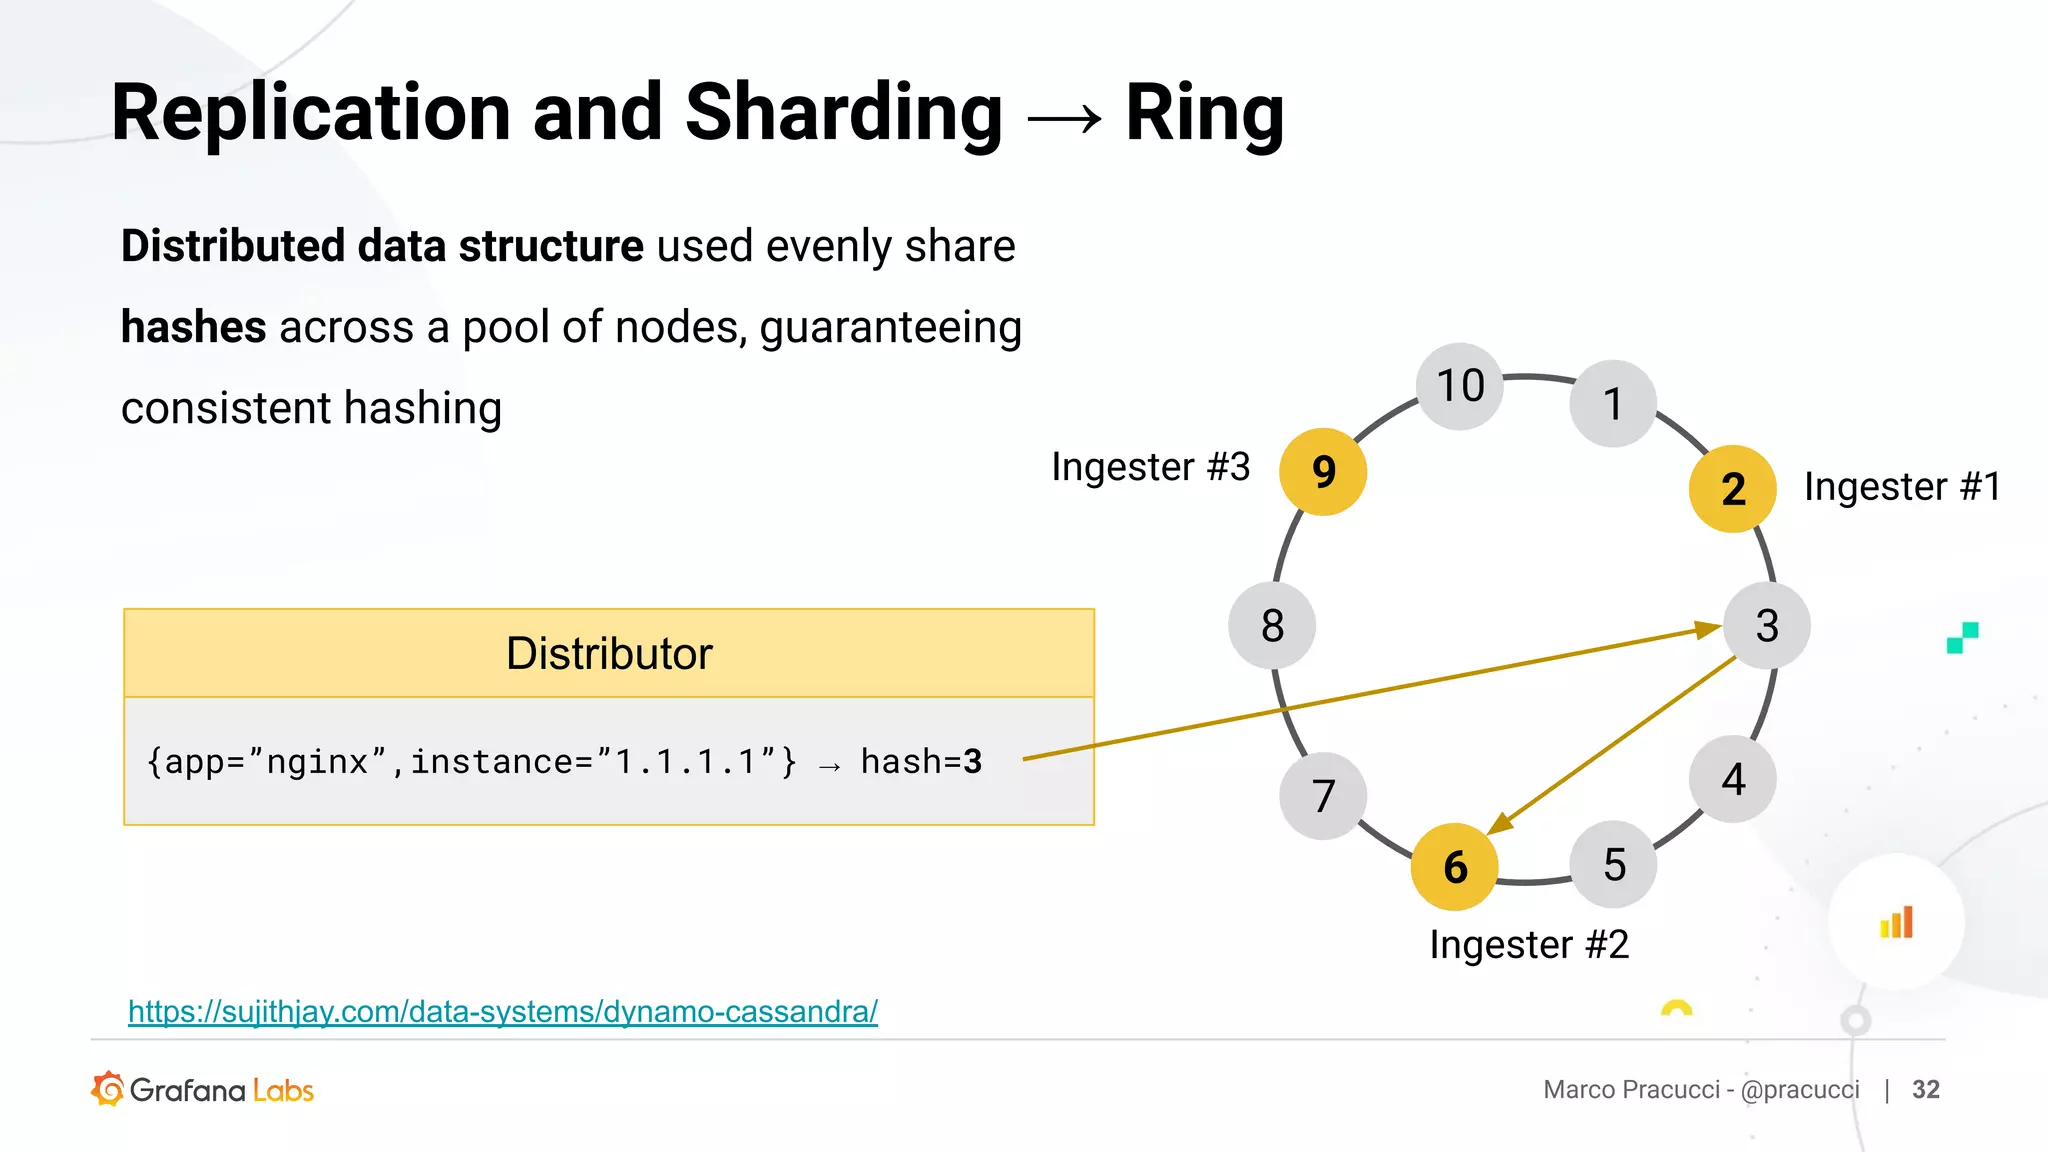
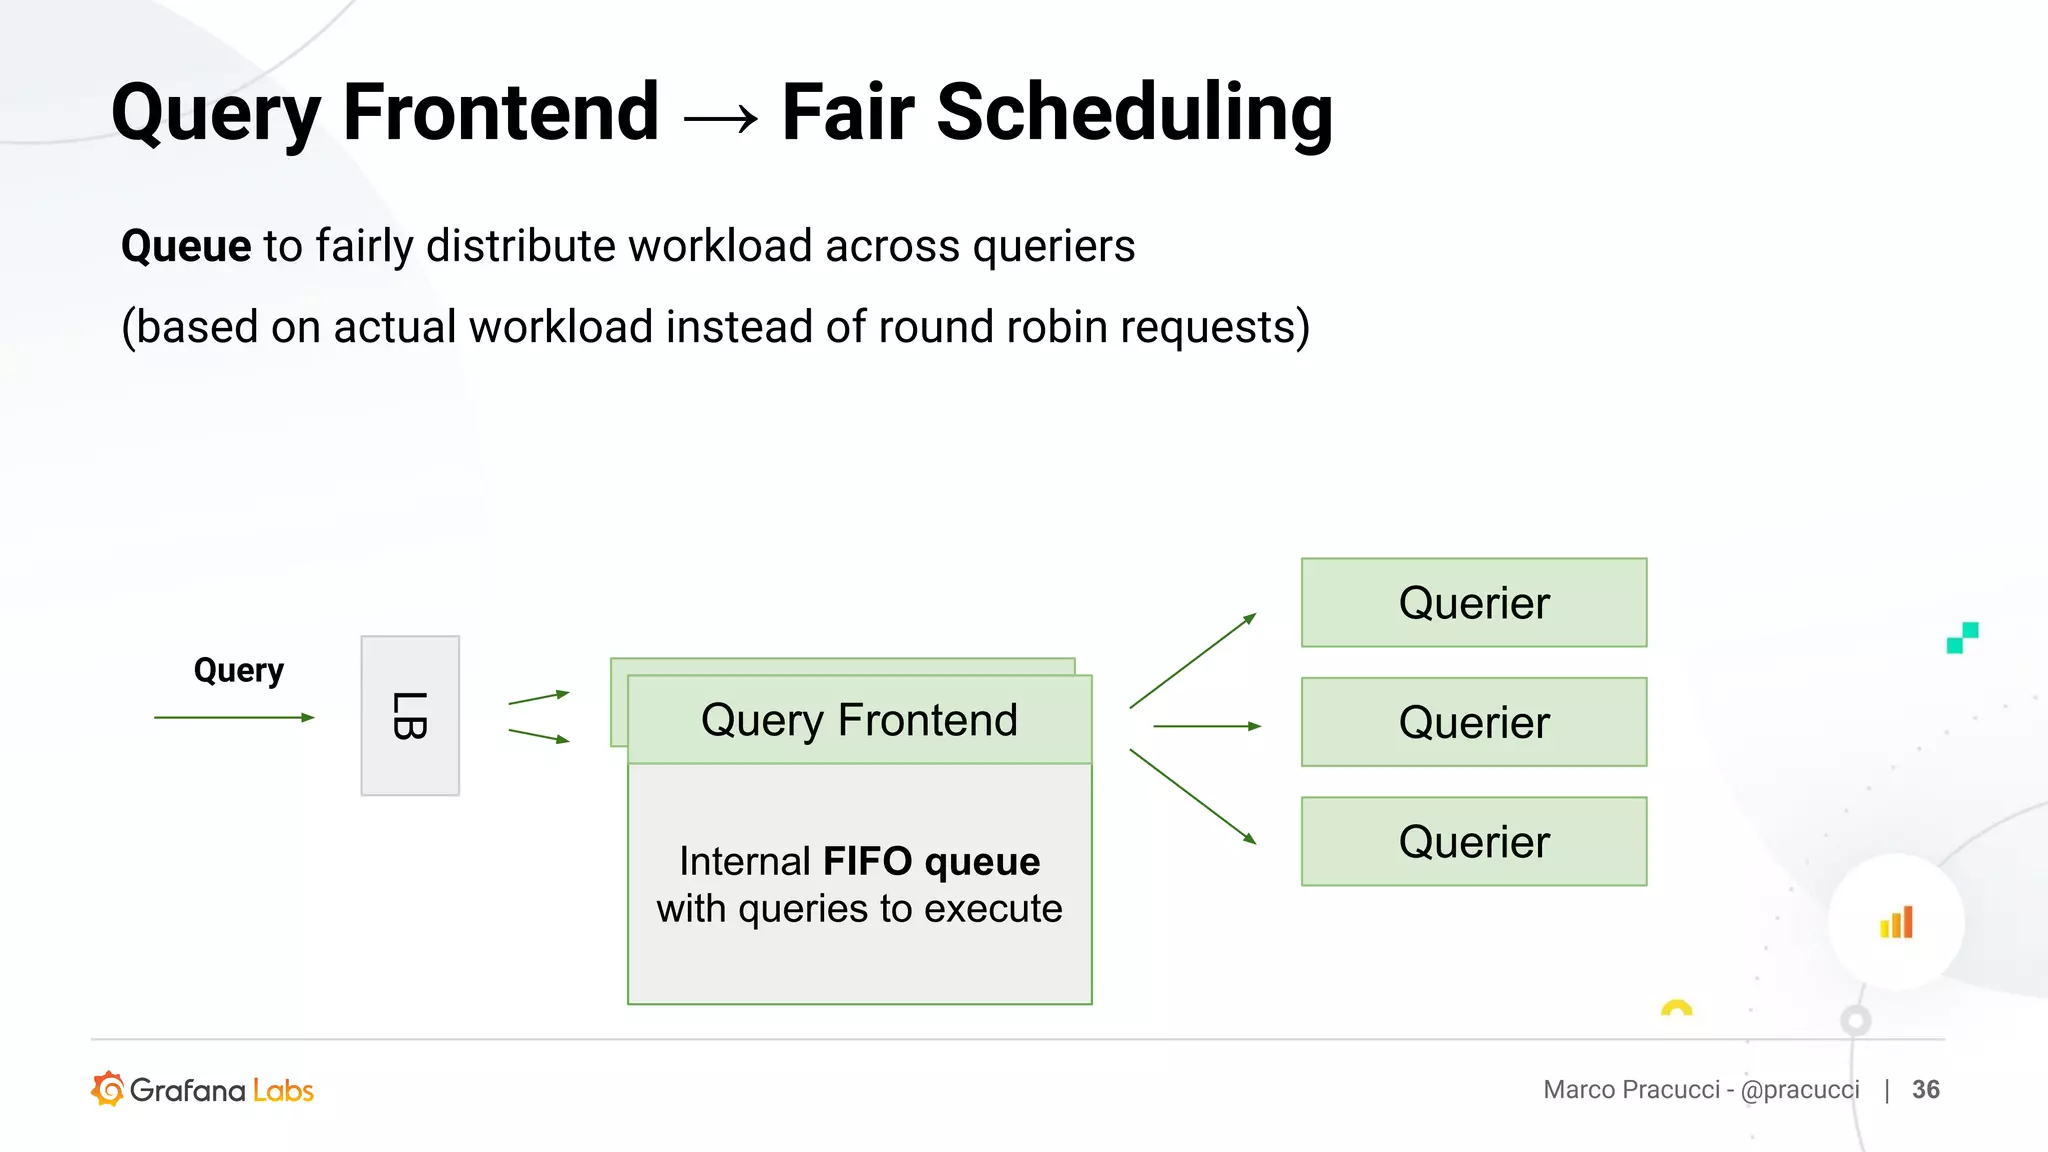
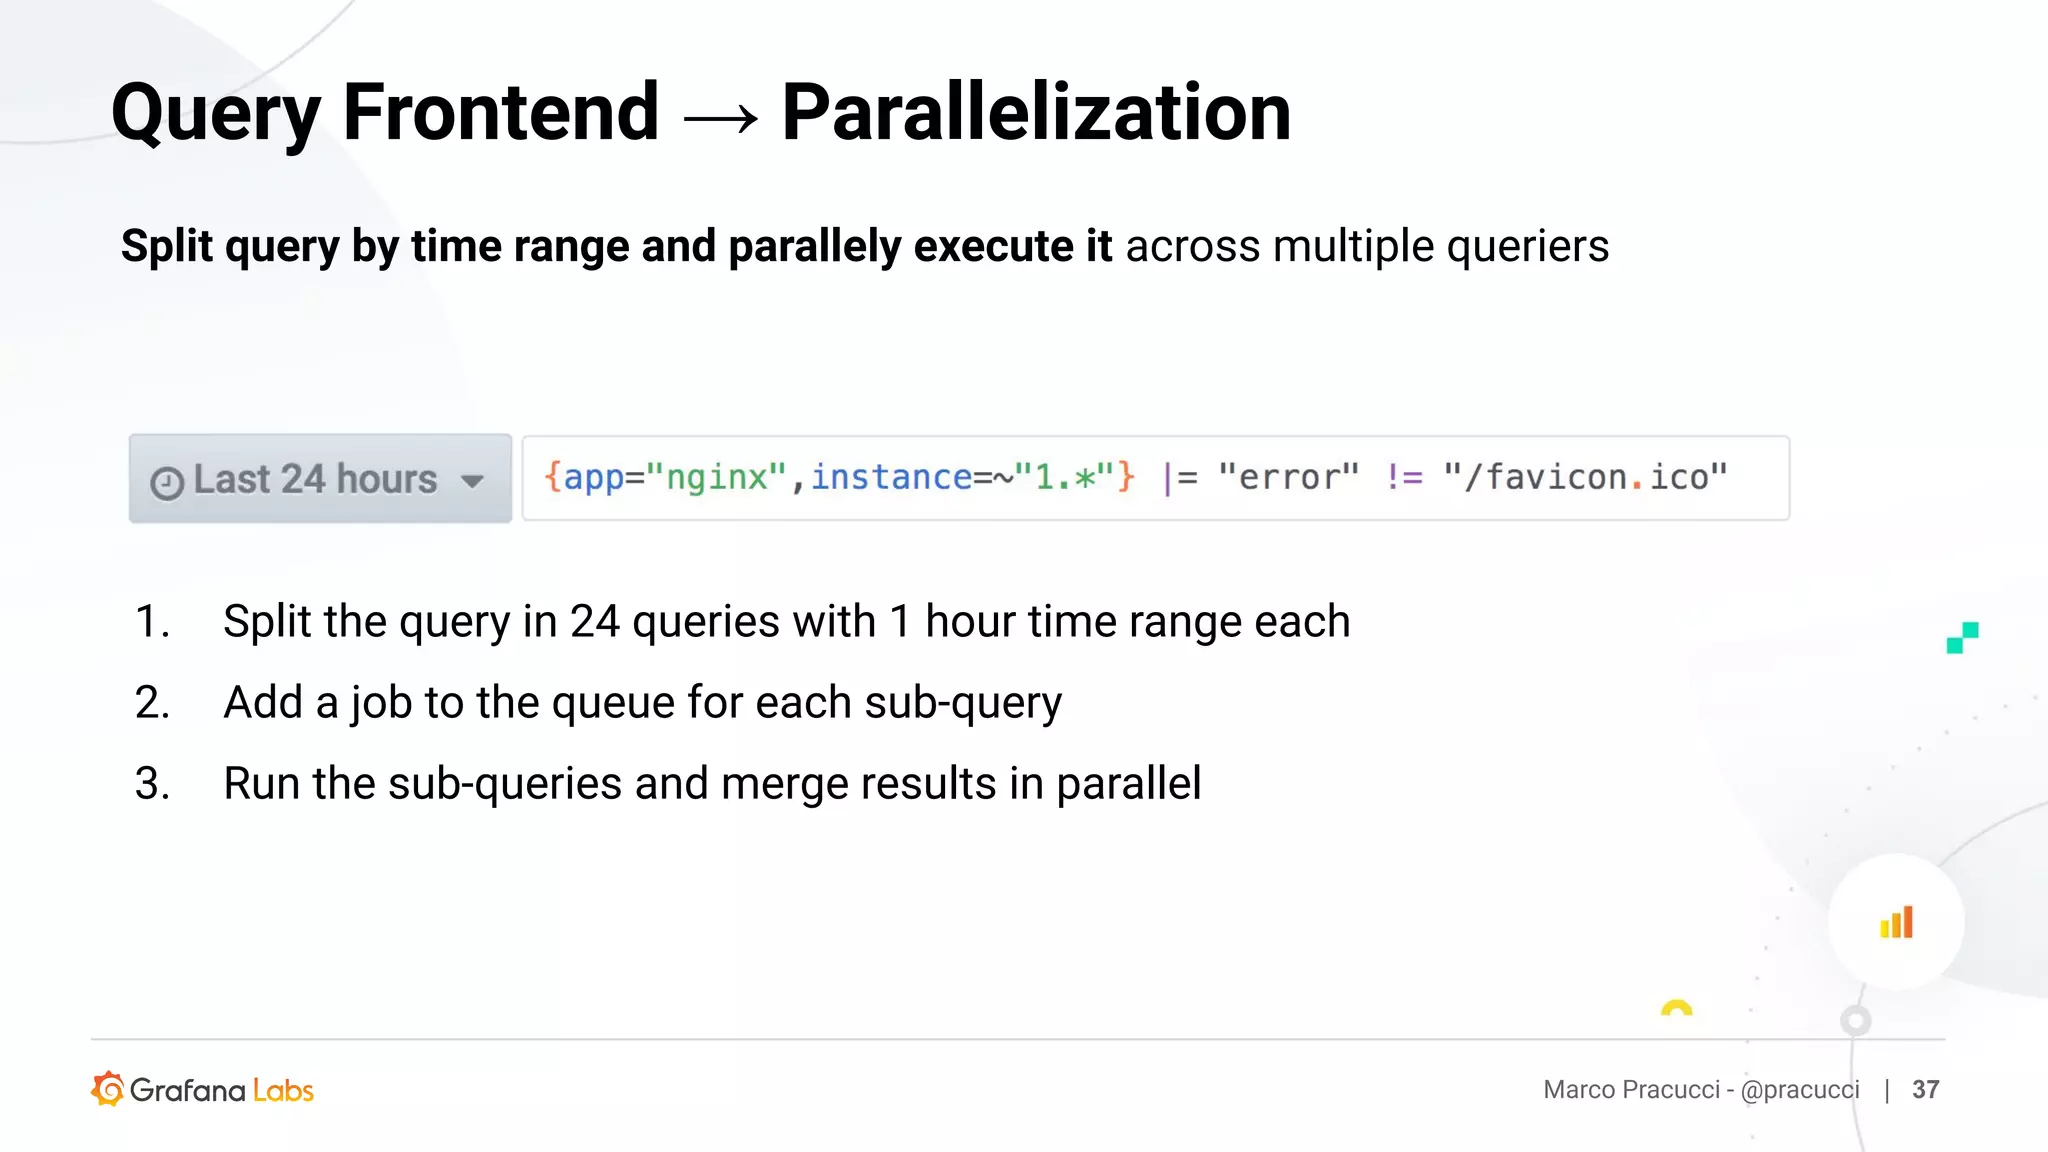
Like Prometheus, but for Logs
Grafana Loki
December 2018
On the OSS Path to Full Observability with Grafana
Marco Pracucci - @pracucci | 2
Today
Marco Pracucci - @pracucci | 3
Marco Pracucci
- Software engineer at Grafana Labs
- Loki contributor and user
- Cortex maintainer
Marco Pracucci - @pracucci | 4
Hello!
Marco Pracucci - @pracucci | 5
Scenario
Node #1
Node #2
LokiPromtail
Promtail Grafana
logcli
Marco Pracucci - @pracucci | 6
Logs
2019-12-11T10:01:02.123456789Z {app=”nginx”,instance=”1.1.1.1”} GET /about
Timestamp
with nanosecond precision
Content
log line
Prometheus-style Labels
key-value pairs
indexed unindexed
Marco Pracucci - @pracucci | 7
Logs – Stream
2019-10-13T10:01:02.000Z {app=”nginx”,instance=”1.1.1.1”} GET /about
2019-10-13T10:03:04.000Z {app=”nginx”,instance=”1.1.1.1”} GET /
2019-10-13T10:05:06.000Z {app=”nginx”,instance=”1.1.1.1”} GET /help
A log stream is a stream of log entries with the same exact labels set
2019-10-13T10:01:02.000Z {app=”nginx”,instance=”2.2.2.2”} GET /users/1
2019-10-13T10:03:04.000Z {app=”nginx”,instance=”2.2.2.2”} GET /users/2
Given a single logs stream, log entries must be
pushed to Loki ordered by timestamp
Marco Pracucci - @pracucci | 8
No out of order logs
Promtail can help you fudging out of order timestamps
Result: no sorting required at ingestion or query time
Filter expression
Given matching log streams, scan
and match log entries (unindexed)
Marco Pracucci - @pracucci | 9
Logs - Query
Log selector
Filter log streams by matching
labels using an index
Marco Pracucci - @pracucci | 10
https://twitter.com/alicegoldfuss/status/981947777256079360
Marco Pracucci - @pracucci | 11
Agent which ships logs to Loki
1. Discover local logs
2. Process log entries (ie. attach labels, transform log, ...)
3. Ship processed logs to Loki
Supported agent alternatives: fluentbit, fluentd, Docker driver
Promtail
Promtail supports Prometheus-style service discovery:
1. Static
Filesystem paths where logs are stored
2. Kubernetes
Dynamically discover pod logs and
attach labels from Kubernetes API
Marco Pracucci - @pracucci | 12
Promtail – Discovery
Marco Pracucci - @pracucci | 13
Promtail – Kubernetes Discovery
Promtail
daemon set
Promtail
daemon set
{app=”nginx”,instance=”1.1.1.1”}
{app=”nginx”,instance=”2.2.2.2”}
Single Binary
- Testing
- Small installations
- This demo
Marco Pracucci - @pracucci | 14
How to run Loki
Microservices
- Horizontal scalability
- Large installations
- After the demo
Loki as a Service
Grafana Cloud
Hosted Logs
Demo
Marco Pracucci - @pracucci | 15
Marco Pracucci - @pracucci | 16
Marco Pracucci - @pracucci | 17
Marco Pracucci - @pracucci | 18
Marco Pracucci - @pracucci | 19
Marco Pracucci - @pracucci | 20
Architecture & Storage
Deep Dive into Loki
Marco Pracucci - @pracucci | 21
Marco Pracucci - @pracucci | 22
Loki Architecture
Distributor Ingester
Minimal required services
Storage
Promtail
LB
Querier
Query
LB Shard and
Replicate
Flushing
complete
chunks
Marco Pracucci - @pracucci | 23
Storage – Chunks
- Each log stream is stored into chunks of data
- Each chunk contains compressed log entries for a specific time window
{app=”nginx”,instance=”1.1.1.1”}
Log stream Chunks
chunk #1
T1 T2
chunk #3
T3
{app=”nginx”,instance=”2.2.2.2”}
chunk #5
T4
chunk #2 chunk #4 chunk #6
Marco Pracucci - @pracucci | 24
Storage – Chunks
Inside each chunk, log entries are sorted by timestamp
chunk #1
2019-10-13T10:01:00Z 2019-10-13T10:30:21Z
2019-10-13T10:01:02.000000000Z GET /about
2019-10-13T10:03:04.000000000Z GET /
2019-10-13T10:05:06.000000000Z GET /help
Marco Pracucci - @pracucci | 25
Storage - Chunks
Chunks are filled up in memory in the ingesters,
and flushed to the storage once completed
(max chunk size or idle time reached)
Supported backends:
S3 DynamoDB GCS BigTable Cassandra Filesystem
(single node)
Marco Pracucci - @pracucci | 26
Storage – Chunks index
Chunks are indexed by labels and time range for a fast access at query time
{app=”nginx”,instance=”1.1.1.1”} chunk #1T1
chunk #3
{app=”nginx”,instance=”2.2.2.2”} chunk #2T1
T2
T2
T2
T3{app=”nginx”,instance=”1.1.1.1”}
Labels set From To Reference to
Marco Pracucci - @pracucci | 27
Storage – Chunks index
Chunks index is stored in a key-value store
BoltDB
(single node)
DynamoDB BigTable Cassandra
Supported backends:
Marco Pracucci - @pracucci | 28
Loki Architecture
Minimal required services
Chunks
store
Index
store
Distributor Ingester
Querier
Storage
Promtail
Query
LBLB Shard and
Replicate
Flushing
complete
chunks
Marco Pracucci - @pracucci | 29
Sharding
Distributor
Ingester #1
Ingester #2
Ingester #4
Received log streams are hashed by labels
in the distributor and sharded across ingesters
{app=”nginx”,instance=”1.1.1.1”} → hash=xxx
{app=”nginx”,instance=”2.2.2.2”} → hash=yyy
hash=xxx
hash=yyy
Ingester #3
Ingester #1
Marco Pracucci - @pracucci | 30
What if an ingester dies?
Distributor
The in-memory logs sharded to the dead ingester are lost
{app=”nginx”,instance=”1.1.1.1”} → hash=xxx
{app=”nginx”,instance=”2.2.2.2”} → hash=yyy
hash=xxx
hash=yyy
Ingester #2
Ingester #4
Ingester #3
You can configure a replication factor (typically 3)
to replica logs across ingesters
Marco Pracucci - @pracucci | 31
Replication
Distributor
{app=”nginx”,instance=”1.1.1.1”} → hash=xxx
{app=”nginx”,instance=”2.2.2.2”} → hash=yyy
hash=xxx Ingester #1
Ingester #2
Ingester #4
Ingester #3
hash=xxx
hash=xxx
Ingester #1
6
29
Distributed data structure used evenly share
hashes across a pool of nodes, guaranteeing
consistent hashing
Marco Pracucci - @pracucci | 32
Replication and Sharding → Ring
2 Ingester #1
6
Ingester #2
9Ingester #3
1
3
4
5
7
8
10
Distributor
{app=”nginx”,instance=”1.1.1.1”} → hash=3
https://sujithjay.com/data-systems/dynamo-cassandra/
The ring data structure is stored on a backend key-value store:
- Consul
- Etcd
- Gossip (experimental)
Marco Pracucci - @pracucci | 33
Replication and Sharding → Ring
No strong persistence required
I.e. we run Loki with 1 single in-memory Consul instance
- Caching
- Multi-tenancy
- ...
Marco Pracucci - @pracucci | 34
There’s much more ...
Marco Pracucci - @pracucci | 35
Query Frontend
Querier
Query
LB
Query Frontend
Optional service sitting in front of queriers
aiming to speed up query performances
Querier
Querier
Internal FIFO queue
with queries to execute
Marco Pracucci - @pracucci | 36
Query Frontend → Fair Scheduling
Querier
Query
LB
Query Frontend Querier
Querier
Queue to fairly distribute workload across queriers
(based on actual workload instead of round robin requests)
Marco Pracucci - @pracucci | 37
Query Frontend → Parallelization
Split query by time range and parallely execute it across multiple queriers
1. Split the query in 24 queries with 1 hour time range each
2. Add a job to the queue for each sub-query
3. Run the sub-queries and merge results in parallel
Thanks!
Questions?

Grafana Loki: like Prometheus, but for Logs

  • 1.
    Like Prometheus, butfor Logs Grafana Loki
  • 2.
    December 2018 On theOSS Path to Full Observability with Grafana Marco Pracucci - @pracucci | 2
  • 3.
  • 4.
    Marco Pracucci - Softwareengineer at Grafana Labs - Loki contributor and user - Cortex maintainer Marco Pracucci - @pracucci | 4 Hello!
  • 5.
    Marco Pracucci -@pracucci | 5 Scenario Node #1 Node #2 LokiPromtail Promtail Grafana logcli
  • 6.
    Marco Pracucci -@pracucci | 6 Logs 2019-12-11T10:01:02.123456789Z {app=”nginx”,instance=”1.1.1.1”} GET /about Timestamp with nanosecond precision Content log line Prometheus-style Labels key-value pairs indexed unindexed
  • 7.
    Marco Pracucci -@pracucci | 7 Logs – Stream 2019-10-13T10:01:02.000Z {app=”nginx”,instance=”1.1.1.1”} GET /about 2019-10-13T10:03:04.000Z {app=”nginx”,instance=”1.1.1.1”} GET / 2019-10-13T10:05:06.000Z {app=”nginx”,instance=”1.1.1.1”} GET /help A log stream is a stream of log entries with the same exact labels set 2019-10-13T10:01:02.000Z {app=”nginx”,instance=”2.2.2.2”} GET /users/1 2019-10-13T10:03:04.000Z {app=”nginx”,instance=”2.2.2.2”} GET /users/2
  • 8.
    Given a singlelogs stream, log entries must be pushed to Loki ordered by timestamp Marco Pracucci - @pracucci | 8 No out of order logs Promtail can help you fudging out of order timestamps Result: no sorting required at ingestion or query time
  • 9.
    Filter expression Given matchinglog streams, scan and match log entries (unindexed) Marco Pracucci - @pracucci | 9 Logs - Query Log selector Filter log streams by matching labels using an index
  • 10.
    Marco Pracucci -@pracucci | 10 https://twitter.com/alicegoldfuss/status/981947777256079360
  • 11.
    Marco Pracucci -@pracucci | 11 Agent which ships logs to Loki 1. Discover local logs 2. Process log entries (ie. attach labels, transform log, ...) 3. Ship processed logs to Loki Supported agent alternatives: fluentbit, fluentd, Docker driver Promtail
  • 12.
    Promtail supports Prometheus-styleservice discovery: 1. Static Filesystem paths where logs are stored 2. Kubernetes Dynamically discover pod logs and attach labels from Kubernetes API Marco Pracucci - @pracucci | 12 Promtail – Discovery
  • 13.
    Marco Pracucci -@pracucci | 13 Promtail – Kubernetes Discovery Promtail daemon set Promtail daemon set {app=”nginx”,instance=”1.1.1.1”} {app=”nginx”,instance=”2.2.2.2”}
  • 14.
    Single Binary - Testing -Small installations - This demo Marco Pracucci - @pracucci | 14 How to run Loki Microservices - Horizontal scalability - Large installations - After the demo Loki as a Service Grafana Cloud Hosted Logs
  • 15.
    Demo Marco Pracucci -@pracucci | 15
  • 16.
    Marco Pracucci -@pracucci | 16
  • 17.
    Marco Pracucci -@pracucci | 17
  • 18.
    Marco Pracucci -@pracucci | 18
  • 19.
    Marco Pracucci -@pracucci | 19
  • 20.
    Marco Pracucci -@pracucci | 20
  • 21.
    Architecture & Storage DeepDive into Loki Marco Pracucci - @pracucci | 21
  • 22.
    Marco Pracucci -@pracucci | 22 Loki Architecture Distributor Ingester Minimal required services Storage Promtail LB Querier Query LB Shard and Replicate Flushing complete chunks
  • 23.
    Marco Pracucci -@pracucci | 23 Storage – Chunks - Each log stream is stored into chunks of data - Each chunk contains compressed log entries for a specific time window {app=”nginx”,instance=”1.1.1.1”} Log stream Chunks chunk #1 T1 T2 chunk #3 T3 {app=”nginx”,instance=”2.2.2.2”} chunk #5 T4 chunk #2 chunk #4 chunk #6
  • 24.
    Marco Pracucci -@pracucci | 24 Storage – Chunks Inside each chunk, log entries are sorted by timestamp chunk #1 2019-10-13T10:01:00Z 2019-10-13T10:30:21Z 2019-10-13T10:01:02.000000000Z GET /about 2019-10-13T10:03:04.000000000Z GET / 2019-10-13T10:05:06.000000000Z GET /help
  • 25.
    Marco Pracucci -@pracucci | 25 Storage - Chunks Chunks are filled up in memory in the ingesters, and flushed to the storage once completed (max chunk size or idle time reached) Supported backends: S3 DynamoDB GCS BigTable Cassandra Filesystem (single node)
  • 26.
    Marco Pracucci -@pracucci | 26 Storage – Chunks index Chunks are indexed by labels and time range for a fast access at query time {app=”nginx”,instance=”1.1.1.1”} chunk #1T1 chunk #3 {app=”nginx”,instance=”2.2.2.2”} chunk #2T1 T2 T2 T2 T3{app=”nginx”,instance=”1.1.1.1”} Labels set From To Reference to
  • 27.
    Marco Pracucci -@pracucci | 27 Storage – Chunks index Chunks index is stored in a key-value store BoltDB (single node) DynamoDB BigTable Cassandra Supported backends:
  • 28.
    Marco Pracucci -@pracucci | 28 Loki Architecture Minimal required services Chunks store Index store Distributor Ingester Querier Storage Promtail Query LBLB Shard and Replicate Flushing complete chunks
  • 29.
    Marco Pracucci -@pracucci | 29 Sharding Distributor Ingester #1 Ingester #2 Ingester #4 Received log streams are hashed by labels in the distributor and sharded across ingesters {app=”nginx”,instance=”1.1.1.1”} → hash=xxx {app=”nginx”,instance=”2.2.2.2”} → hash=yyy hash=xxx hash=yyy Ingester #3
  • 30.
    Ingester #1 Marco Pracucci- @pracucci | 30 What if an ingester dies? Distributor The in-memory logs sharded to the dead ingester are lost {app=”nginx”,instance=”1.1.1.1”} → hash=xxx {app=”nginx”,instance=”2.2.2.2”} → hash=yyy hash=xxx hash=yyy Ingester #2 Ingester #4 Ingester #3
  • 31.
    You can configurea replication factor (typically 3) to replica logs across ingesters Marco Pracucci - @pracucci | 31 Replication Distributor {app=”nginx”,instance=”1.1.1.1”} → hash=xxx {app=”nginx”,instance=”2.2.2.2”} → hash=yyy hash=xxx Ingester #1 Ingester #2 Ingester #4 Ingester #3 hash=xxx hash=xxx Ingester #1
  • 32.
    6 29 Distributed data structureused evenly share hashes across a pool of nodes, guaranteeing consistent hashing Marco Pracucci - @pracucci | 32 Replication and Sharding → Ring 2 Ingester #1 6 Ingester #2 9Ingester #3 1 3 4 5 7 8 10 Distributor {app=”nginx”,instance=”1.1.1.1”} → hash=3 https://sujithjay.com/data-systems/dynamo-cassandra/
  • 33.
    The ring datastructure is stored on a backend key-value store: - Consul - Etcd - Gossip (experimental) Marco Pracucci - @pracucci | 33 Replication and Sharding → Ring No strong persistence required I.e. we run Loki with 1 single in-memory Consul instance
  • 34.
    - Caching - Multi-tenancy -... Marco Pracucci - @pracucci | 34 There’s much more ...
  • 35.
    Marco Pracucci -@pracucci | 35 Query Frontend Querier Query LB Query Frontend Optional service sitting in front of queriers aiming to speed up query performances Querier Querier
  • 36.
    Internal FIFO queue withqueries to execute Marco Pracucci - @pracucci | 36 Query Frontend → Fair Scheduling Querier Query LB Query Frontend Querier Querier Queue to fairly distribute workload across queriers (based on actual workload instead of round robin requests)
  • 37.
    Marco Pracucci -@pracucci | 37 Query Frontend → Parallelization Split query by time range and parallely execute it across multiple queriers 1. Split the query in 24 queries with 1 hour time range each 2. Add a job to the queue for each sub-query 3. Run the sub-queries and merge results in parallel
  • 38.