Download to read offline

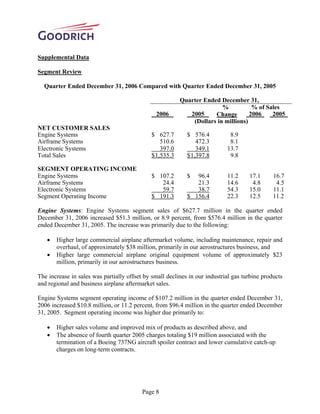
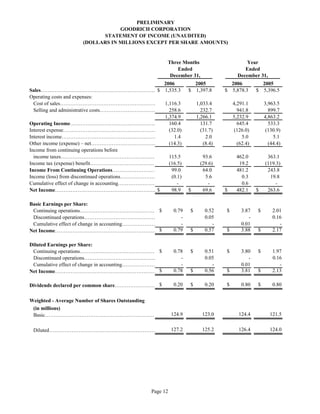
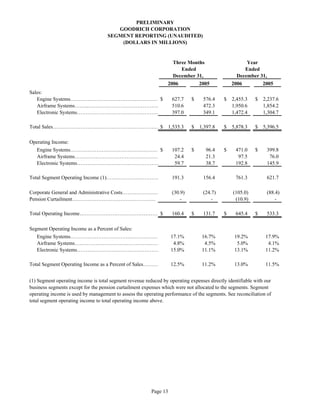
Goodrich announced strong financial results for Q4 2006 and full year 2006. Sales increased 10% in Q4 and net income per share grew 39%. For full year 2006, sales rose to $5.9 billion and net income per share increased to $3.81. Goodrich increased its 2007 outlook with sales expected to be $6.2-6.4 billion and net income per share of $2.95-3.15. Goodrich also expects net cash from operations to be 60-75% of net income for 2007.


