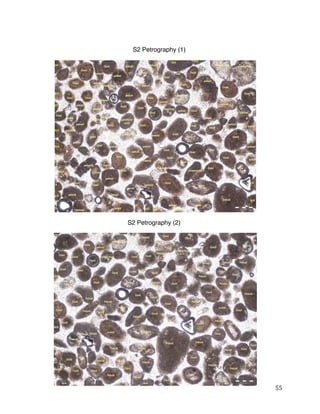
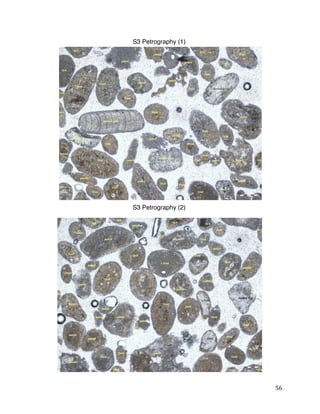
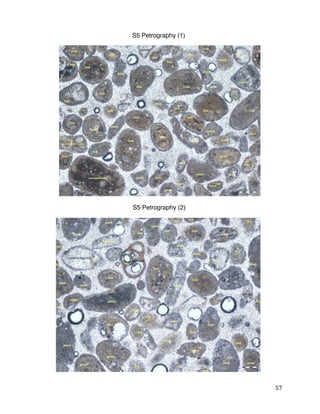
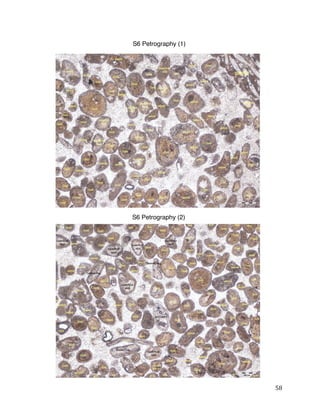
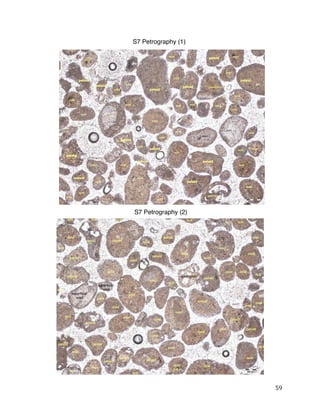
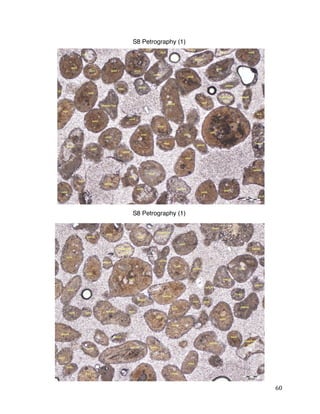
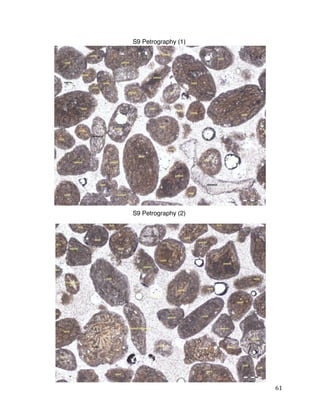
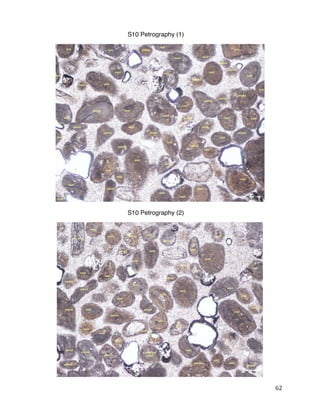
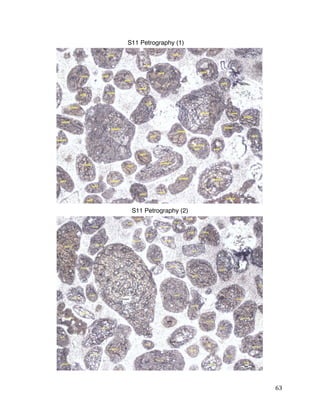
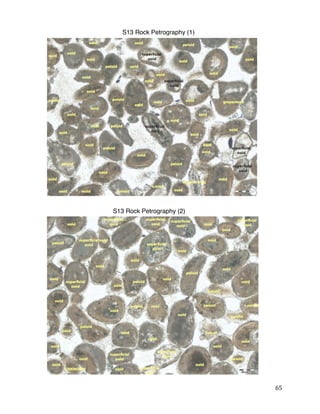
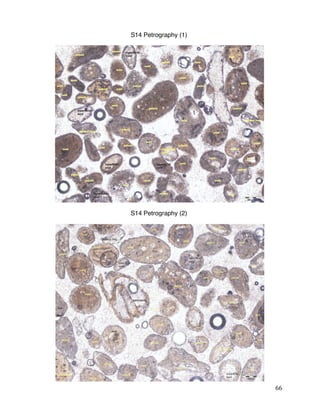
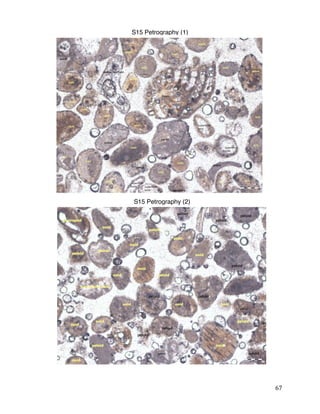
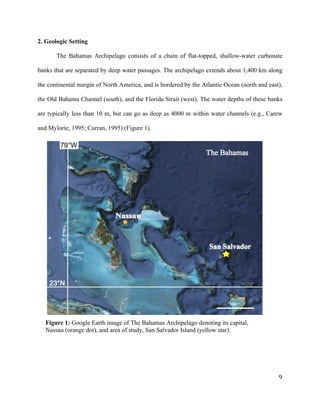
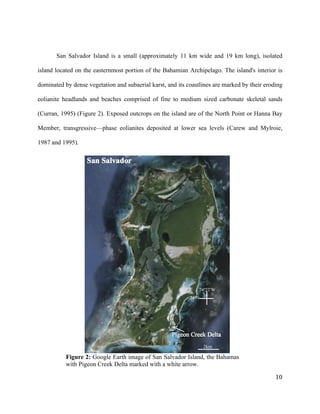
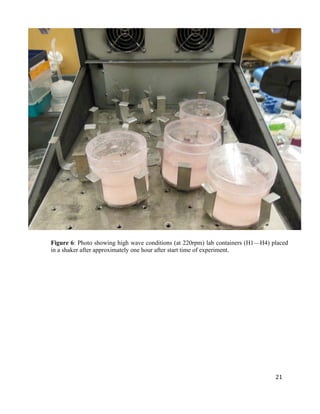
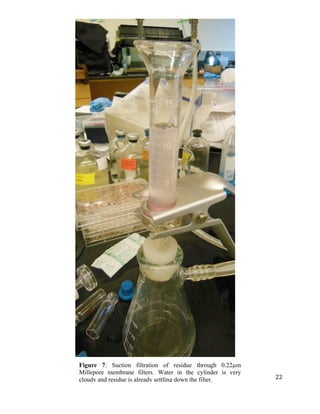
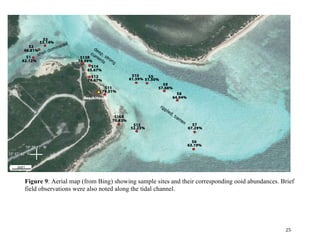
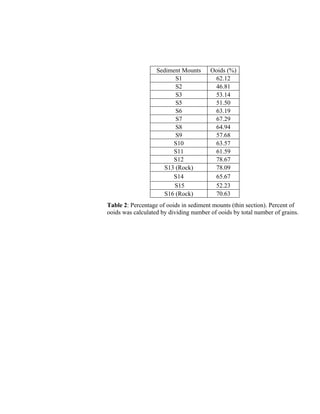
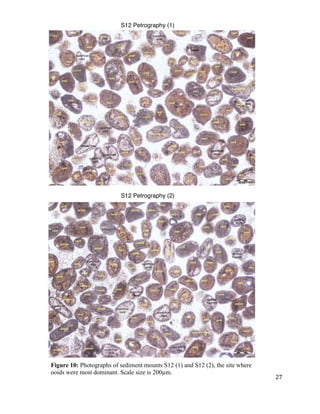
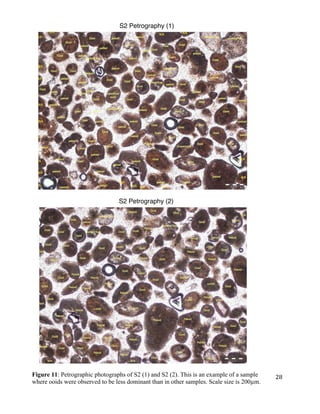
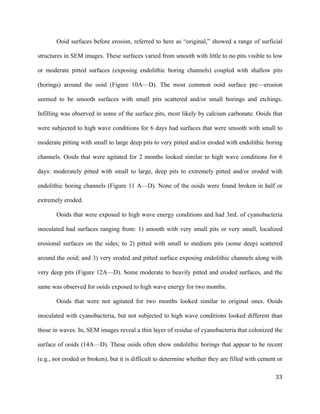
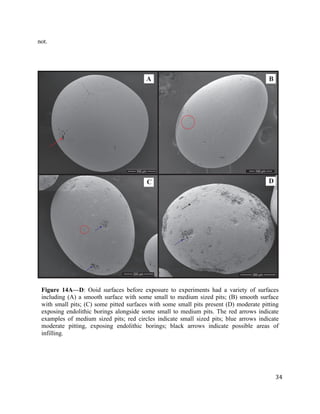
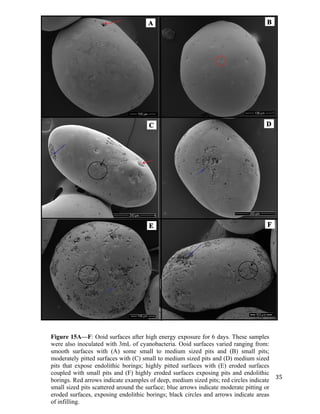
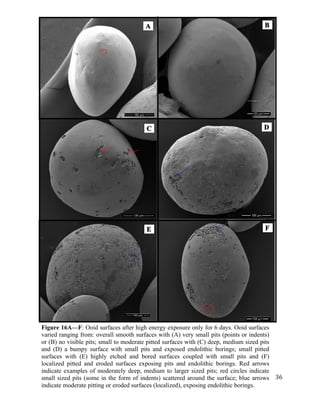
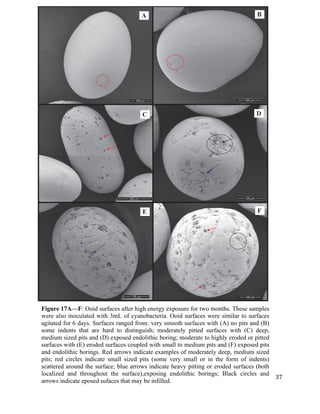
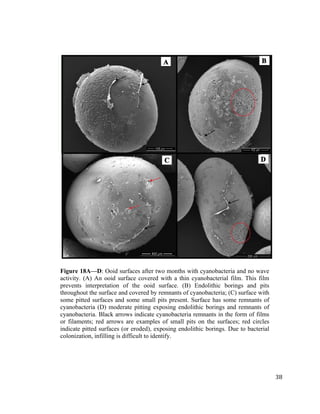
SlideShare a Scribd company logo
Ooid Formation at Pigeon Creek Delta, San Salvador Island, Bahamas
Kiara J. Gomez
Submitted to the Department of Geosciences
of Smith College
in partial fulfillment
for the requirements for the degree of
Bachelor of Arts
Sara B. Pruss, Honors Project Advisor
May 12, 2014


2	
  
Abstract
Ooids are small spherical to ellipsoidal coated grains, characterized by concentric layers
of calcium carbonate. Despite the ubiquity of these grains in the geologic past, their formation,
including their accretion and shaping, is still the subject of debate. In 2013, a targeted collection
of sand containing ooids was performed in subtidal and beach settings along Pigeon Creek Delta
on San Salvador Island, The Bahamas. Thirteen samples were taken in the tidal channel at
different locations and it was determined that ooids were most abundant at localized sites along
the tidal delta, suggesting that ooids are actively forming in the tidal channel and transported
onto beachshores. To characterize the organic matter associated with ooids, samples were
examined for lipid biomarkers at MIT. As in previous work, our results showed characteristically
long-chain normal fatty acids (FA) and a distinguishable even-over-odd carbon number
compounds with very small abundances of iso— and anteiso—FA. These results suggest that
organic matter in Pigeon Creek ooids is dominated by bacterial communities like cyanobacteria
and sulfate reducing bacteria, suggesting that microbes are present on ooid surfaces as well as in
the water column. To assess the role of abrasion in ooid formation, preexisting ooid sand
collections from Cat Island, Bahamas, were used in accretion and erosion experiments where
ooids were rolled under high wave conditions from 6 days to 2 months both with and without
cyanobacteria. Despite producing different amounts of carbonate mud during erosion
experiments, ooid surfaces were not broken in half or extremely eroded. This multidisciplinary
project has revealed that: 1) ooids are actively forming and accumulating in shallow portions of
the tidal channel (sites S7 and S8), and are being transported to the beach through flood tides; 2)
cyanobacteria are colonizing ooid surfaces, but whether they contribute to ooid formation is
uncertain; and 3) high wave agitation causes the outer layers of ooids to erode (breakdown) and
get rounded as carbonate mud is produced. Further work will require additional multidisciplinary
approaches to understand the mechanics of ooid formation, and explore the relationship between
bacterial communities and ooids.


3	
  
Aknowledgements
Partial funding for field work in January 2013 was provided by the Mellon Mays
Fellowship, Sara Pruss and the Smith College Geosciences Department. Further financial support
was provided by the Nancy Kershaw Tomlinson Memorial Fund. My sincerest gratitude is
extended to Sara Pruss for giving me the opportunity to conduct this research and for her advice,
support, and encouragement throughout my time at Smith College. Also, my deepest gratitude to
Roger Summons, Aimee Gillespie, Tanja Bosak and Guilio Mariotti from MIT for collaborating
with me on this project, and to my friends Kayla Clark and Corinne Ducey for being there for
me. Thanks to Mike Vollinger for assistance with thin sections, Jennifer Leman for field
assistance, Al Curran for help and guidance in the field;, and Judith Wopereis for techincal help
with the SEM. I would also like to especially thank the members of the Sara Pruss lab for
encouragement and helpful discussions as well as Pamela Nolan Young, Naomi Miller, and the
Mellon Mays family for believing in and cheering for me. Lastly, I thank all of the faculty, staff
and students of the Department of Geosciences for their utmost help and encouragement
throughout my career at Smith College.


4	
  
Table of Contents
Abstract……....................................................................................................................................2
Acknowledgements…......................................................................................................................3
1. Introduction .................................................................................................................................6
1.1 Previous experimental work on ooids............................................................................7
1.2 Previous biomarker research on ooids...........................................................................8
2. Geologic Setting ..........................................................................................................................9
2.1 Pigeon Creek................................................................................................................11
3. Methods......................................................................................................................................16
3.1 Sampling and Sieving..................................................................................................16
3.2 Lipid Extraction and Derivitization.............................................................................17
3.3 Gas Chromatography-Mass Spectrometry (GC-MS) Analysis....................................18
3.4 Lab Erosion Experiments.............................................................................................18
3.5 Scan Electron Microscopy (SEM)...............................................................................19
4. Results........................................................................................................................................23
4.1 Petrography..................................................................................................................23
4.2 Organic Geochemistry.................................................................................................29
4.3 Lab Experiments..........................................................................................................31
5. Discussion................................................................................................................................. 39
5.1 Petrography..................................................................................................................39
5.2 Biomarkers...................................................................................................................40
5.3 Experimental................................................................................................................42
6. Conclusions............................................................................................................................... 43
References......................................................................................................................................45
Appendix A....................................................................................................................................49
Appendix B....................................................................................................................................54
List of Figures and Tables
Figures
1. Locality map of the Bahamas Archipelago.
2. Locality map of San Salvador Island.
3. Pigeon Creek Delta tidal range and current speed graph.
4. Locality map of Pigeon Creek Delta, San Salvador, the Bahamas.
5. Field image of Outcrop 1
6. Image of lab methods, showing containers under high wave conditions
7. Image of lab methods, showing suction filtration of residue
8. Loose sand photographs (site S1 and S9)
9. Locality map of Pigeon Creek Delta, San Salvador, the Bahamas—with ooid abundances.
10. Petrographic photographs of S12
11. Petrographic photographs of S2
12. Total ion chromatograms of unsieved, bulk and sieved samples
13. Graph of residue concentrations


5	
  
14. SEM images of ooid surfaces before exposure to lab conditions
15. SEM images of ooid surfaces (high energy exposure for 6 days and w/cyanobacteria)
16. SEM images of ooid surfaces (high energy exposure for 2 months)
17. SEM images of ooid surfaces (high energy exposure for 2 months and w/cyanobacteria)
18. SEM images of ooid surfaces (no wave activity for 2 months and w/cyanobacteria)
List of Figures and Tables
Figures
1. Locality map of the Bahamas Archipelago..................................................................................9
2. Locality map of San Salvador Island.........................................................................................10
3. Pigeon Creek Delta tidal range and current speed graph. .........................................................13
4. Locality map of Pigeon Creek Delta, San Salvador, the Bahamas............................................14
5. Field image of Outcrop 1...........................................................................................................15
6. Image of lab methods, showing containers under high wave conditions..................................21
7. Image of lab methods, showing suction filtration of residue.....................................................22
8. Loose sand photographs (site S1 and S9)..................................................................................24
9. Locality map of Pigeon Creek Delta, San Salvador, the Bahamas—with ooid abundances.....25
10. Petrographic photographs of S12.............................................................................................27
11. Petrographic photographs of S2...............................................................................................28
12. Total ion chromatograms of unsieved, bulk and sieved samples.............................................30
13. Graph of residue concentraitions.............................................................................................32
14. SEM images of ooid surfaces before exposure to lab conditions............................................34
15. SEM images of ooid surfaces (high energy exposure for 6 days and w/cyanobacteria).........35
16. SEM images of ooid surfaces (high energy exposure for 2 months).......................................36
17. SEM images of ooid surfaces (high energy exposure for 2 months and w/cyanobacteria).....37
18. SEM images of ooid surfaces (no wave activity for 2 months and w/cyanobacteria).............38	
  
Tables
1. Description of conditions for trial 1 and trial 2..........................................................................20
2. Percentage of ooids and unknown particles...............................................................................26


6	
  
1. Introduction
Ooids—small spherical to ellipsoidal coated grains—are characterized by concentric
layers of calcium carbonate and are prevalent throughout the geological record (e.g., Rodgers,
1954; Flügel, 1982; Richter, 1983). Modern ooids are thought to form within agitated, shallow
carbonate environments (Boardman and Carney, 1996), like in certain areas of the Bahamas
today. Ooids are commonly 2 mm in size or smaller, and “giant” ooids (pisoids) have been
documented from the Proterozoic, and rarely in the Phanerozoic (see Trower and Grotzinger,
2010 for a review). Despite the ubiquity of these grains in the geologic past, ooid formation and
mechanics are still major subjects of debate. In particular, there has been a long—standing
discussion about biological controls (i.e. organic matter and cyanobacteria) on ooid formation
(e.g., Suess and Fütterer, 1972; Fabricus, 1977; Folk and Lynch, 2001; Duguid et al., 2010;
Gillespie, 2013; Summons et al., 2013).
To date, most areas of modern ooid accumulation occur in a handful of locations of the
Bahamas, such as Exuma, Cat Island and Joulter’s Cay, Andros Island (Mylroie et al., 2006;
Glumac et al., 2012; Summons et al., 2013). Aside from the Bahamas, ooids in marine
environments are also documented in Shark Bay, Australia (Summons et., 2013), and in
hypersaline and freshwater environments such as the Dead Sea (Garber, 1981), Red Sea
(Friedman, 1978), and Great Salt Lake (Sandberg, 1975; Reitner et al., 1997).
There are three major factors that are believed to control ooid lamina formation, they are
described as: 1) a chemical factor that promotes ooid precipitation during supersaturation; 2) an
abiotic (or physical) factor that encompasses wave agitation and current activity, causing the
ooid to tumble on the sea floor and accrete its layers; and 3) a biological factor linked with
microbial activity that enables calcium carbonate precipitation (indirect and/or direct), and thus
promoting ooid growth (see Fabricus, 1977 and Davies, 1978 for review).


7	
  
The association between organic matter and ooids has also been long established, but still
not well understood (Morse and Mackenzie, 1990; Flügel, 2004; Summons et al., 2013). Most of
the recent work has focused on modern Bahamian ooids. In Summons et al. (2013) and
Edgecomb et al. (2013), for example, microbial communities were found inhabiting Bahamian
ooids, suggesting their presence as a potential control of ooid formation and a mechanism that
promotes calcium carbonate precipitation. Other studies suggest ooid formation is a purely
abiotic process that is dependent on physical and chemical factors (Duguid et al., 2010). As a
middle ground, Diaz et al. (2013) found that ooid formation in active environments (high energy)
can potentially be a synergistic combination of microbial activity that influences carbonate
precipitation and abiotic factors.
Several geological studies have been conducted at a variety of locations throughout
Pigeon Creek Lagoon and the nearby open—ocean Snow Bay Lagoon on San Salvador Island,
The Bahamas (Thalman, 1983; Mitchell, 1986), but there are currently no detailed studies on the
sedimentary processes (i.e. ooid formation) along the tidal channel and delta. In addition, limited
information exists on modern tidal creek environments, especially on Pigeon Creek Delta. This
project examined subtidal bulk sand and rock samples collected from the Pigeon Creek tidal
channel and adjacent areas in order to determine the locations in which ooids are forming and to
ascertain the mechanisms that contribute to their formation in this area.
1.1 Previous experimental work on ooids
Several experiments have been performed on ooids in lab—controlled settings to assess
the relative importance of organic matter, agitation, and settling in ooid formation. Overall, there
seems to be a disagreement in the role of agitation in ooid formation. Several studies on


8	
  
Bahamian ooids have suggested that both agitation and supersaturation are critical factors in the
formation of ooids (i.e., Cloud, 1962; Broecker and Takahashi, 1966; Bathurst, 1975). In one
study, a series of agitation experiments led to a wide—accepted theory that agitation and
abrasion (or erosion) are fundamental to the growth cycle of ooids (Weyl, 1967). The growth
cycle proposed by Weyl (1967) included four stages: 1) a rapid ooid precipitation stage as
traction processes occur along the seafloor; 2) an overgrowth stage where precipitation then
begins to slow; 3) a resting stage as the ooid is buried; and 4) a growth stage proceeding erosion.
A recent study that focused on the role of abrasion in ooid formation suggested that ooids under
agitated conditions produced a fair amount of carbonate mud as the particles abraded themselves,
suggesting a mechanism for ooid breakdown (or erosion) (Van Ee and Wanless, 2008). In this
project, we performed lab experiments to ascertain the role of abrasion in shaping ooids and its
relationship with ooid accretion.
1.2 Previous biomarker research on ooids
Lipid biomarkers are specific organic products that can be traced to their natural source
or origin. They can be used as a tool to provide information on the origin of organic matter
within an environment. In recent years, studies have focused on the biomarkers preserved within
ooids to assess the roles and types of microbial communities that are present during ooid
formation in marine (Edgecomb et al., 2013; Gillespie, 2013; Summons et al., 2013) and lake
settings (Corsetti et al., 2013). Here, we used lipid biomarkers to understand and characterize the
organic matter associated with ooids along Pigeon Creek Delta, an ebb tidal delta that is not
dominated by ooids.


9	
  
2. Geologic Setting
The Bahamas Archipelago consists of a chain of flat-topped, shallow-water carbonate
banks that are separated by deep water passages. The archipelago extends about 1,400 km along
the continental margin of North America, and is bordered by the Atlantic Ocean (north and east),
the Old Bahama Channel (south), and the Florida Strait (west). The water depths of these banks
are typically less than 10 m, but can go as deep as 4000 m within water channels (e.g., Carew
and Mylorie, 1995; Curran, 1995) (Figure 1).
Figure 1: Google Earth image of The Bahamas Archipelago denoting its capital,
Nassau (orange dot), and area of study, San Salvador Island (yellow star).
50km


10	
  
San Salvador Island is a small (approximately 11 km wide and 19 km long), isolated
island located on the easternmost portion of the Bahamian Archipelago. The island's interior is
dominated by dense vegetation and subaerial karst, and its coastlines are marked by their eroding
eolianite headlands and beaches comprised of fine to medium sized carbonate skeletal sands
(Curran, 1995) (Figure 2). Exposed outcrops on the island are of the North Point or Hanna Bay
Member, transgressive—phase eolianites deposited at lower sea levels (Carew and Mylroie,
1987 and 1995).
Figure 2: Google Earth image of San Salvador Island, the Bahamas
with Pigeon Creek Delta marked with a white arrow.
24ºN
74º27’W
2km


11	
  
2.1. Pigeon Creek
Pigeon Creek consists of two arms (tidal creeks) of a lagoon located in the southeast,
windward corner of San Salvador (23°57’N, 74°29’W) (Figure 2). These two portions merge at a
narrow creek or inlet, where tidal currents reach up to >70 cm/s and create an ebb-tidal delta
channel called Pigeon Creek Delta (Boardman and Kelley, 1996). A description of the sediment
distribution throughout Pigeon Creek can be found in Mitchell (1986). The study suggests that
peloids dominate throughout Pigeon Creek, and that ooids were once the dominant grain type
during the Pleistoocene.
The tidal velocities and ranges vary throughout the channel. Some of the maximum-
recorded velocities (~11-17 meters/minute) throughout Pigeon Creek were measured near the
tidal channel (Figure 3). These tidal currents have also been observed as one of the main
mechanism of erosion and sediment transport up Pigeon Creek Delta during high tide (or flood
tide), and seaward during low tide (ebb tide) (Boardman and Carney, 1996; Mitchell, 1986). The
strongest erosional force for coarse sediment has been observed during the ebb current
(Boardman and Carney, 1996). Other work that focused on the morphology of Pigeon Creek
concluded that the tidal channel and the channel itself changes rapidly over short time scales and
is therefore a modern, dynamic system (Boardman and Carney, 1996).
Based on recent field observations from 2012, the tidal channel seafloor and depth is
variable during low tide (ebb) (Figure 4). It rapidly transitions from a shallow, thin seagrass area
(up—channel) to a deeper, more shell—dominated area with some patches of seagrass on the
northwest portion of the channel (Figure 4). Moving oceanward along the tidal channel, there is a
rippled (ebb—oriented), barren seafloor that rapidly transitions to a relatively shelly and algal
dominated seafloor (delta and outer margin). There are two outcrops found on the beach parallel


12	
  
to the tidal channel, located northwest and southeast of the beach house (Figure 4—5). These
two exposed outcrops are most likely from the Holocene Hannah Bay of the Rice Bay Formation
(look in Carew and Mylroie, 1995 for a review of their stratigraphy).


13	
  
PIGEON CREEK DELTA
TIDAL RANGE AND CURRENT SPEED
100
100
50
50
0
4.0
3.5
3.0
2.5
Depth(m)
Speed(cm/s)
Time (1/1991)
7 8 9 10
Figure 3: Graph of tidal ranges and current speeds throughout the tidal channel
at Pigeon Creek Delta. Modified from Mitchel, (1987).


   14	
  
Figure 4: Aerial map (from Bing) showing outcrop sites and brief field observations along the tidal channel.
200FT outer seagrass margin
patches of seagrass
Beach House
Outcrop 2
Outcrop 1
23º 57’ 42” N
74º 29’17” W
  15	


!
Figure 5: Outcrop 1 found northwest of the beach house. Hammer for scale.


16	
  
3. Methods
3.1 Sampling and Sieving
In order to ascertain the mechanism of ooid formation and to constrain their distribution
in Pigeon Creek delta, I performed field sampling and kite aerial photography to map the
distribution of ooids in Pigeon Creek delta on San Salvador, I extracted and analyzed lipid
biomarkers from ooid—bearing sand from San Salvador at MIT, and I performed experimental
erosion experiments on Cat Island ooid sand in 200 mL lab containers at MIT and at Smith to
quantify the erosion of ooids under different conditions.
To constrain possible areas of ooid formation and accumulation in Pigeon Creek Delta, I
took thirteen samples along the tidal channel at Pigeon Creek Delta starting from point S1 near
the public dock. (Locations of subtidal bulk sand and rock samples are illustrated in Figure 5.)
To record the exact position of our samples and observations of physical properties in Pigeon
Creek Delta during sampling in 2013, we used a combination of global positioning system (GPS)
and high—resolution kite photography to map the tidal channel. These photos were used to
analyze and understand the sedimentary processes at sampling points along the tidal channel.
Subtidal samples were returned to Smith College for further analysis. Sampling was done
during low tide (ebb tide) in order to have the most access to subtidal sand. A portion of the tidal
channel was mapped using a 10-foot kite, starting at a point parallel from the Beach House
landmark and moving seaward until the edge of the outer seagrass margin. Global Positioning
System line segments and points were taken concurrently using a Trimble Juno unit.
To further analyze Pigeon Creek ooids and the grains associated with them, loose sand
photographs of subtidal sand were taken. Thin sections were also made for grain analysis by
embedding each sample in epoxy. This allowed for petrographic characterization and


17	
  
identification of dominant constituents of sand using 2.35 mm by 1.76 mm grids on 12 thin
sections. Ooids abundances (in percentage) were determined by dividing number of ooids by the
total number of consituents. To analyze the organic geochemistry of Pigeon Creek ooids in a set
of subsamples, coarse skeletal fragments and other particles larger than ooids had to be removed
from the bulk samples. These subtidal samples were sieved using nine sieves ranging from
841µm to 63µm. Ooids were the most abundant grain in the sieve sizes 420—250 µm and 250—
177 µm, so these subsamples in addition to bulk samples were used for lipid biomarker analysis.
3.2 Lipid Extraction and Derivitization
Lipid biomarkers are commonly used to identify taxonomically specific organisms
within the water column and sediments. For example, 2β-methylbacteriohopaneopolyols have
been presented as biomarkers for cyanobacteria (Summons et al., 1999), a photoautrophic
microbe recently discovered and described as diverse microbial communities colonizing ooids
from the Bahamas and Australia (i.e., Summons et al., 2013; Edgecomb et al., 2013). Summons
et al. (2013) specifically analyzed branched fatty methyl esters (FAME) as molecular biomarkers
to determine which microbes may play a role in ooid formation (i.e., sulfate-reducing bacteria).
Ooid sample extraction and derivitization was conducted using methods from Summons et al.
(2013) and Gillespie (2013). A small sample of sieved (420—250 µm and 250—177 µm) ooids
and bulk sand were extracted with DCM by sonication five times and then placed under a stream
of dry nitrogen. These samples were then transferred to a clean glass vial and labeled TLE (total
lipid extraction).
Ooid samples were derivitized by methanolysis, a process used to convert complex
glycerides (fatty acids) into simple fatty methyl esters (FAME) for gas chromatography (GC)


18	
  
analysis. In brief, samples were covered in methanolic HCL (prepared as in Gillespie, 2013
methods) and heated (60—70º C) overnight. Samples were cooled at room temperature.
After derivitized samples were allowed to cool, they were separated by liquid
chromatography over ~10 cm columns of silica gel packed in a Pasteur pipette (Gillespie, 2013).
This was done to remove any remaining unwanted inorganic material within the samples. Using
a sequence of five solvents of increasing polarity, the following five fractions were generated:
aliphatic hydrocarbons (in hexane); aromatic hydrocarbons (in 4:1 hexane:DCM); ketones and
fatty methyl esters (FAME) (in DCM); alcohols (in 1:1 DCM: ethyl acetate); and diols (in ethyl
acetate).
3.3 Gas Chromatography-Mass Spectrometry (GC-MS) Analysis
Samples were analyzed using an Agilent 7890A GC equipped with a Gerstel
programmable temperature vaporizing (PTV) injector and interfaced to an Agilent 5975 Mass
Selective Detector. A J&W DB1-MS capillary column (dimensions: 30 m x 0.25 mm x 0.25 µm)
was fixed into the GC using helium as the carrier. Further information regarding the oven
settings of equipment can be found in Summons et al. (2013) and/or Gillespie (2013). Fatty acid
methyl esters (FAME) peaks were identified by comparing their mass spectra and their retention
time to those found within spectra library called Supelco Analytical.
3.4 Lab Erosion Experiments
To assess the importance of movement in the accretion and shaping of ooids, a series of
experiments were run under varying conditions at MIT and Smith. An ooid sand sample from
Cat Island was used in these experiments because I wanted to perform experiments of sand that


19	
  
was ooid—dominated. The ooid sands were placed in a large container and were sterilized via
autoclaving. They were then treated red dye solution and deionized water for 10 seconds via
moderate shaking in preparation for experiments. Approximately 12.5 g of bulk sand was placed
into 10 clean, 200 mL plastic jars with 100mL of seawater and then put into Scilogex 180 orbital
shaker and rocker. The seawater medium consisted of (in g/L of deionized water): 21.14 NaCl,
3.55 Na2SO4, 0.59 KCl, 0.17 NaHCO3, 9.59 MgCl2Ÿ6H2O, 1.34 CaCl2Ÿ2H2O, 0.03446 NaNO3,
0.00309 Na3PO4, 5 ml of trace element solution SL-10 without FeCl2, 1 mL of vitamin solution
(SL-10 and vitamin solution recipes in DSMZ medium 141, Braunschweig, Germany: Catalogue
of strains 1993).
Information regarding the conditions of each jar can be found in Table 1. For trial 1, a
total of 6 jars were placed under high wave conditions (220 rpm) for 6 days (Figure 6); 2 were
subjected to low wave conditions (110 rpm) for 2.5 days; and 2 jars were subjected to no wave
conditions (control). Half of the total jars were inoculated with about 3mL of cyanobacteria (all
odd numbered jars). A second trial was conducted for a longer time period of approximately two
months where 4 jars were placed under high wave conditions (220) and six were left untouched.
Following the experiments, samples containing cyanobacteria were briefly exposed to a
monolayer of bleach (pH 8.2) to remove any organic matter from the surface and were dried in
preparation for Scan Electron Microscopy (SEM) analysis.
In order to calculate the concentration of residue within the high energy containers, water
was suction filtrated using a 20 mL cylinder and 0.22 µm Millepore membranes (Figure 7).
Concentrations of residue in each water samples were calculated via filter weight data.
Absorption spectroscopy was also performed on trial 1 samples; concentrations were calculated
using filter weight data of H1 and H2 from trial 1. Absorbance values, calculations, and


20	
  
calibration curves at different wavelengths constructed for H1 can be found in Appendix A.
3.5 Scan Electron Microscopy (SEM)
In order to assess the degree of breakage and surficial abrasion of ooids under wave
agitated conditions, surface texture of ooids were imaged before and after abrasion experiments
at the Smith College Center for Microscopy and Imaging using a FEI Quanta 450 scanning
electron microscope. Samples were mounted on stubs using a clear adhesive and carbon coated
before analysis under a high vacuum. To obtain clear, high resolution photos, high voltage and
spot size settings were
5kv and 3, respectively.
Trial 1
Time Shaking (total) Speed RPM Cyanobacteria
H1 6 days (All time) 220 Yes
H2 6 days (All time) 220 No
H3 2 days (1d on/2d off) 220 Yes
H4 2 days (1d on/2d off) 220 No
H5 8 hours (1 or 2 hour/day) 220 Yes
H6 8 hours (1 or 2 hour/day) 220 No
L1 6 days (All time) 110 Yes
L2 6 days (All time) 110 No
N1 6 days (All time) 0 Yes
N2 6 days (All time) 0 No
Trial 2
Time Shaking (total) Speed RPM Cyanobacteria
H1 ~2 months 220 Yes
H2 ~2 months 220 No
H3 ~2 months 220 Yes
H4 ~2 months 220 No
H5 ~2 months 0 Yes
H6 ~2 months 0 No
H7 ~2 months 0 Yes
H8 ~2 months 0 No
H9 ~2 months 0 Yes
H10 ~2 months 0 No
Table 1: Description of conditions for trial 1 and trial 2. Odd
numbered samples innoculated with 3mL of cyanobacteria.


21	
  
Figure 6: Photo showing high wave conditions (at 220rpm) lab containers (H1—H4) placed
in a shaker after approximately one hour after start time of experiment.


22	
  
Figure 7: Suction filtration of residue through 0.22µm
Millepore membrane filters. Water in the cylinder is very
cloudy and residue is already settling down the filter.


23	
  
4. Results
4.1 Petrography
Thin sections of bulk sediments from Pigeon Creek tidal channel, San Salvador Island,
Bahamas were made to analyze the dominant components of sand and to note the state of
preservation of ooids. Loose sand photographs demonstrate examples of sites with a large
number of skeletal fragments (Figure 8A), and one with fewer skeletal grains (Figure 8B).
Petrographic analysis of bulk subtidal samples suggests that ooids are present throughout the
tidal channel and are variable in abundance (Figure 9—11; Table 2). Samples collected from the
southwest, deeper portion of the tidal channel (S2, S3) were composed of ~47—53% ooids.
Along the rippled, barren seafloor (S5, S8, S9, S10) and near the outer seagrass margins (S6, S7),
average ooid abundances were ~52—64.94% and ~63—67%, respectively. In the two rock
samples collected north (S13R) and south (S16R) of the beach house, ooid abundance was
slightly higher than in subtidal bulk sand samples (71—78% in S13, S16). Ooids comprised
~66—78% in beach samples collected near the rock outcrop at the Beach House (S11, S12, S14).
Some of the micritized particles that were difficult to identify in thin section were labeled as
“peloids,” which can represent skeletal fragments, micritized ooids, grapestones and algae
(specifically Halimeda sp.) This may have impacted the calculated percentages of ooid
abundance. Ooids were classified based on shape and the presence of concentric layers; borings
and micritization throughout the outer layers of ooids were common in many samples.
Petrographic photographs of all samples can be found in Appendix B.


24	
  
A	
  
B	
  
Figure 8A—B: Photographs of loose sand showing high abundances of
skeletal fragments in A) from site S1. Loose sand that displays sand that is
dominated by peloid and ooids with minor skeletal fragments in B) from site
S9 along the tidal channel. The scale bar is 500µm.


   25	
  
S6
S7
S8
S9
S15
S11
S3
62.12%
Beach House
S5S10
S13R
S2
S12
S16R
S14
S1
46.81%
53.14%
51.50%61.59%
57.68%
64.94%
67.29%
63.19%
52.23%
70.63%
79.51%
78.67%
65.67%
78.09%
200FT
23º 57’ 42” N
74º 29’17” W
23º 57’ 42” N
74º 29’17” W
Figure 9: Aerial map (from Bing) showing sample sites and their corresponding ooid abundances. Brief
field observations were also noted along the tidal channel.


Sediment Mounts Ooids (%)
S1 62.12
S2 46.81
S3 53.14
S5 51.50
S6 63.19
S7 67.29
S8 64.94
S9 57.68
S10 63.57
S11 61.59
S12 78.67
S13 (Rock) 78.09
S14 65.67
S15 52.23
S16 (Rock) 70.63
Table 2: Percentage of ooids in sediment mounts (thin section). Percent of
ooids was calculated by dividing number of ooids by total number of grains.


27	
  
Figure 10: Photographs of sediment mounts S12 (1) and S12 (2), the site where
ooids were most dominant. Scale size is 200µm.
S12 Petrography (1)
S12 Petrography (2)


28	
  Figure 11: Petrographic photographs of S2 (1) and S2 (2). This is an example of a sample
where ooids were observed to be less dominant than in other samples. Scale size is 200µm.
S2 Petrography (1)
S2 Petrography (2)


29	
  
4.2 Organic Geochemistry
Geochemical analyses of sieved and bulk sand show that fatty acid methyl esters (FAME)
were present and relatively abundant (Figure 12A—C). All samples contained saturated, normal
(or straight chained) fatty acid methyl esters with chain lengths from C12 to C30, with n-C14, n-
C16, and n-C18 as the most abundant compounds; abundances differed within each sample. In the
bulk sample, n-C14 was the most abundant followed by n-C16 and n-C18, respectively. Dominance
of fatty acid n-C16 followed by n-C14 and n-C18 is present in the 420—250µm sieve size sample
(60s); in the 250—177µm sieve size sample (80s), n-C16 dominance is followed by n-C18 and n-
C14.
A pattern of even—over—odd carbon number preference is present, in relatively low
abundances (<50%), in the normal FAMEs, and is evident in the bulk and 420—250µm sieve
size samples. In essence, the pattern contains long-chain fatty acids (from C22 to C34) and reach a
maximum at C22. In the 250—177µm sieved sample, it is difficult to distinguish this pattern,
most likely due to contamination peaks marked by asterisks (marked by asterisk in Figure 12C).
Branched FAME are present in moderate abundances (~25%—50%) in bulk and 420—
250 µm sieve samples, with the most common being C14—C17 iso- and anteiso- FAME. In the
250—177 µm sieve size sample, branched FAME C14-C16 are commonly present in relatively
low abundances (<20%). All samples contained some trace of 10-methylhexadexcanoic acid (or
10-methyl-C16:0), a 17-Carbon FAME commonly associated with sulfate bacteria.


30	
  
+
Figure 12: Total ion chromatograms from geochemical analyses of fatty acid methyl
esthers (FAME) using gas chromatography-mass spectrometry (GC-MS) in TLE of (A)
unsieved bulk; (B) 420—250µm sieve size; (C) 250—177µm sieve size. The asterisk
symbols (*) and (**) indicate unknown and plastic contamination, respectively. 	
  
A
B
C


31	
  
4.3 Lab Experiments
Erosion experiments were performed under a series of conditions. In trial 1, H1—H6
represented high wave conditions (at 220 rpm) for 6 days (H1—H2), 2 days (H3—H4), and 8
hours (H5—H6). Low wave conditions and the control were represented by L1—L2 and N1—
N2. In trial 2, H1—H4 were conducted under high wave conditions and H5—H10 represented no
wave conditions. Ooids that were subjected to high-energy conditions for 6 days and 2 months
eroded. Because the ooids were dyed prior to the erosion experiments with 10mL red dye, water
in all high—energy samples became cloudy and pink in color, progressing from dark pink (H1—
H2 in trial 1; H1—H4 in trial 2) to moderate pink (H3—H4, trial 1) to faint pink (H5—H6, trial
1) over time. Pink water indicated residue (calcium carbonate) from the erosion of outer layers of
the ooids, usually settling as a thin, fine—grained pink layer on top of the ooids after shaking.
The highest residue concentrations were found in prolonged exposure samples (high
energy) for both trials, ranging from 0.21 g/L to 0.69 g/L for samples shaken at 220 rpm for 2
months (H1—H4, Trial 2), with an averaged concentration of 0.37 g/L ± 0.02 to 0.40 g/L ± 0.10
for samples under the same conditions for 6 days (H1—H2, Trial 1), respectively (Figure 13).
Samples under low-energy conditions in trial one had average residue concentrations similar to
the control, ranging from -0.03 g/L ± 0.07 to 0.05 g/L ± 0.05. Such low concentrations, some of
which appears to have varied negatively mostly due to experimental error, indicate that minimal
to no residue was eroded throughout this experimental time period. Residue concentration data
can be found in Appendix A.


32	
  
Figure 13: Line graph of residue concentrations from filter weight data and absorption
spectrometry (Trial 1 only). Residue concentrations calculated from filter weights in trial
1 were averaged.


33	
  
Ooid surfaces before erosion, referred to here as “original,” showed a range of surficial
structures in SEM images. These surfaces varied from smooth with little to no pits visible to low
or moderate pitted surfaces (exposing endolithic boring channels) coupled with shallow pits
(borings) around the ooid (Figure 10A—D). The most common ooid surface pre—erosion
seemed to be smooth surfaces with small pits scattered and/or small borings and etchings.
Infilling was observed in some of the surface pits, most likely by calcium carbonate. Ooids that
were subjected to high wave conditions for 6 days had surfaces that were smooth with small to
moderate pitting with small to large deep pits to very pitted and/or eroded with endolithic boring
channels. Ooids that were agitated for 2 months looked similar to high wave conditions for 6
days: moderately pitted with small to large, deep pits to extremely pitted and/or eroded with
endolithic boring channels (Figure 11 A—D). None of the ooids were found broken in half or
extremely eroded.
Ooids that were exposed to high wave energy conditions and had 3mL of cyanobacteria
inoculated had surfaces ranging from: 1) smooth with very small pits or very small, localized
erosional surfaces on the sides; to 2) pitted with small to medium pits (some deep) scattered
around the ooid; and 3) very eroded and pitted surface exposing endolithic channels along with
very deep pits (Figure 12A—D). Some moderate to heavily pitted and eroded surfaces, and the
same was observed for ooids exposed to high wave energy for two months.
Ooids that were not agitated for two months looked similar to original ones. Ooids
inoculated with cyanobacteria, but not subjected to high wave conditions looked different than
those in waves. In, SEM images reveal a thin layer of residue of cyanobacteria that colonized the
surface of ooids (14A—D). These ooids often show endolithic borings that appear to be recent
(e.g., not eroded or broken), but it is difficult to determine whether they are filled with cement or


34	
  
not.
	
  
Figure 14A—D: Ooid surfaces before exposure to experiments had a variety of surfaces
including (A) a smooth surface with some small to medium sized pits; (B) smooth surface
with small pits; (C) some pitted surfaces with some small pits present (D) moderate pitting
exposing endolithic borings alongside some small to medium pits. The red arrows indicate
examples of medium sized pits; red circles indicate small sized pits; blue arrows indicate
moderate pitting, exposing endolithic borings; black arrows indicate possible areas of
infilling.	
  
D
A B
C


35	
  
Figure 15A—F: Ooid surfaces after high energy exposure for 6 days. These samples
were also inoculated with 3mL of cyanobacteria. Ooid surfaces varied ranging from:
smooth surfaces with (A) some small to medium sized pits and (B) small pits;
moderately pitted surfaces with (C) small to medium sized pits and (D) medium sized
pits that expose endolithic borings; highly pitted surfaces with (E) eroded surfaces
coupled with small pits and (F) highly eroded surfaces exposing pits and endolithic
borings. Red arrows indicate examples of deep, medium sized pits; red circles indicate
small sized pits scattered around the surface; blue arrows indicate moderate pitting or
eroded surfaces, exposing endolithic borings; black circles and arrows indicate areas
of infilling.	


D
E
C
BA
F


36	


Figure 16A—F: Ooid surfaces after high energy exposure only for 6 days. Ooid surfaces
varied ranging from: overall smooth surfaces with (A) very small pits (points or indents)
or (B) no visible pits; small to moderate pitted surfaces with (C) deep, medium sized pits
and (D) a bumpy surface with small pits and exposed endolithic borings; small pitted
surfaces with (E) highly etched and bored surfaces coupled with small pits and (F)
localized pitted and eroded surfaces exposing pits and endolithic borings. Red arrows
indicate examples of moderately deep, medium to larger sized pits; red circles indicate
small sized pits (some in the form of indents) scattered around the surface; blue arrows
indicate moderate pitting or eroded surfaces (localized), exposing endolithic borings.	
  
D
E
C
BA
F


37	
  
Figure 17A—F: Ooid surfaces after high energy exposure for two months. These samples
were also inoculated with 3mL of cyanobacteria. Ooid surfaces were similar to surfaces
agitated for 6 days. Surfaces ranged from: very smooth surfaces with (A) no pits and (B)
some indents that are hard to distinguish; moderately pitted surfaces with (C) deep,
medium sized pits and (D) exposed endolithic boring; moderate to highly eroded or pitted
surfaces with (E) eroded surfaces coupled with small to medium pits and (F) exposed pits
and endolithic borings. Red arrows indicate examples of moderately deep, medium sized
pits; red circles indicate small sized pits (some very small or in the form of indents)
scattered around the surface; blue arrows indicate heavy pitting or eroded surfaces (both
localized and throughout the surface),exposing endolithic borings; Black circles and
arrows indicate eposed sufaces that may be infilled.	
  
D
E
C
BA
F


38	
  
Figure 18A—D: Ooid surfaces after two months with cyanobacteria and no wave
activity. (A) An ooid surface covered with a thin cyanobacterial film. This film
prevents interpretation of the ooid surface. (B) Endolithic borings and pits
throughout the surface and covered by remnants of cyanobacteria; (C) surface with
some pitted surfaces and some small pits present. Surface has some remnants of
cyanobacteria (D) moderate pitting exposing endolithic borings and remnants of
cyanobacteria. Black arrows indicate cyanobacteria remnants in the form of films
or filaments; red arrows are examples of small pits on the surfaces; red circles
indicate pitted surfaces (or eroded), exposing endolithic borings. Due to bacterial
colonization, infilling is difficult to identify.	
  
DC
BA


39	
  
5. Discussion
5.1 Petrography
By sampling broadly around Pigeon Creek, we were able to determine that ooids are the
most abundant in a single onshore sample (S12) followed by S10, and the least abundant around
the deep, shelly portions of the tidal channel (S1—S3). This disparity in abundance in samples
suggests that ooids are forming in a relatively small, localized area within the tidal channel and
delta and are being transported onshore (near areas S11—S12). The discovery of ooids as
dominant sand components in some parts of Pigeon Creek (S6—S10) suggest three factors that
may be affecting the distribution of ooids here: 1) certain parts of the tidal channel are more
conducive to modern ooid formation, specifically shallow portions of the tidal channel; 2) ooids
that are actively forming along the channel are being transported to the beach via flood tides; and
3) a small portion of ooids are eroding into the tidal channel from several rock outcrops, and then
transported throughout the tidal channel and back onto the beach. While all these factors can
contribute to the presence of ooids here, continuous strong currents along the tidal channel create
favorable conditions for ooid development. These currents allow ooids to occasionally suspend
within the water column and also to roll along the rippled, barren seafloor to aid in ooid abrasion.
Pigeon Creek is an important setting to understand because ooids are a component of sand, but
never the dominant grain (<78%). This is analogous to many ancient settings where ooids are
prevalent but not the only component of ancient carbonate rocks. Examining this setting has
provided some constraints on the types of environments in which ooids form when they do not
make up the bulk of the sand in the marine environment.
Petrographic analysis of Pigeon Creek ooids revealed the presence of endolithic boring
and micritization in many subtidal samples. These may relate to the presence and type of organic


40	
  
matter in ooids that were extracted during biomarker analyses (Summons et al., 2013, this study).
These ooids are petrographically similar to other Bahamian ooids (Summons et al., 2013;
Glumac et al., 2012; Harris et al., 1979). Also, thin section analysis of Pigeon Creek sand
revealed that skeletal grains and peloids, which include micritized skeletal fragments and algae,
are most common along the tidal channel because they are most likely transported from the
shelly region (south east corner). Beach rock contains abundant ooids (70—78%) and can be an
additional, minor source of eroding ooids along the tidal channel. The age of these ooids was
difficult to determine due to the absence of ooid age dates (radiocarbon dating), and their
similarity in shape and surface.
5.2 Biomarkers
Geochemical analyses of bulk and sieved sand revealed differences in their FAME. The
n-C14 fatty acid was significantly higher in the bulk sample and 420—250 µm (60s) sieve
samples than in the 250—177 µm (80s) sieve size samples. Possible reasons for these differences
are: 1) there was a smaller size sample of 80s available in comparision to the other samples; or 2)
a pattern associated with other bacteria that may be colonizing bulk samples and 60s sieve.
Further work characterizing the abundant biomarkers in ooid—rich sand samples and sands
dominated by other grains will help further constrain the relationship between specific microbial
communities and ooids.
Results from this study are similar to Holocene ooid biomarker data from other places in
the Bahamas (e.g., Cat Island and Joulter’s Cay) and Australia (e.g., Shark Bay):
characteristically long-chain normal fatty acids (FA) and a distinguishable even-over odd carbon
number preference in concurrence with very small abundances of iso— and anteiso—FA


41	
  
(Gillespie, 2013; Summons et al., 2013). These data suggest that certain kinds of bacterial groups
may play a role in their formation. Specifically, the presence of 10-methyl-C16:0 strongly
indicates a relationship between sulfate—reducing bacteria and ooids.
Sulfate reducing bacteria have been proposed as promoters of calcium carbonate
precipitation (Decho et al., 2005; Dupraz and Visscher, 2005; Summons et al., 2013; Edgecomb
et al., 2013). Indicators of these bacteria are well established, in past and recent literature, as
being a variety of fatty acids around the C12 to C19 range area (Taylor and Parkes, 1983; Dowling
et al., 1986; Kuever et al., 2001). Specific types, such as Desulfobulbus, Desulfobacula,
Desulfotignum, and Desulfobactor spp, have been associated with ooid samples because they
possess iso—C15:0, anteiso—C15:0, and 10-methyl C16:0 fatty acids (Summons et al., 2013;
Edgecomb et al., 2013). This previous work and current geochemical analyses of fatty acid
distributions in ooids from this particular study suggest that sulfate reducing bacteria are present
on ooid surfaces as well as in the water column. Although sulfate—reducing bacteria have been
commonly associated within anaerobic environments, they have been previously found in well
mixed environments around the Bahamas, suggesting their capacity to undergo sulfate reduction
under oxic conditions (Canfield and Des Marais, 1991; Fournier et al., 2004; Diaz et al., 2013).
Their presence in the shallow waters of Pigeon Creek Delta may indicate that they are increasing
alkalinity by oxidating organic compounds (anaerobic respiration) in the local water column
where ooids are located, and thus inducing higher rates of calcium carbonate precipitation.
In addition to sulfate reducers, other bacteria that have been associated in various
environments around the Bahamas are Alphaproteobacteria, Gammaproteobacteria,
Acidobacteria, Actinobacteria/Bacteriodetes (Diaz et al., 2013; Summons et al., 2013;
Edgecomb; 2013). Some of these bacteria are associated with those found in stromatolites and


42	
  
thrombolites. Lipid biomarker analyses of bulk (unsieved) and sieved samples (with higher ooid
abundances) have generated results similar to those found by Summons et al. (2013), supporting
the notion that biological activity may have promoted localized ooid formation along the tidal
channel. Importantly, this study focuses on an environment where ooids are actively forming, but
are not the dominant constituent. Skeletal fragments, grapestones, calcareous rods, and peloids
are also common in addition to ooids along Pigeon Creek Delta. Therefore, we now have insight
into local processes fostering the formation of ooids in settings where ooids are not the dominant
carbonate grain.
Bacteriohopanepolyols (BHP) are a class of hopanoids primarily from bacterial
membrane lipid components and found in sediments (Ourisson et al., 1979; Rohmer et al., 1984).
All FAME samples analyzed contained 17β, 21β—bishomohopanoic acid (noted as an arrow in
Figure 2), and some were of similar abundances (bulk and 60s) as in Summons et al., (2013).
Although the sources of BHP are too diverse to make an interpretation of their source, this along
with the FAME results (and its presence in other Bahamian ooid samples) suggests that the
organic matter analyzed is bacterial in origin.
5.3 Experimental
Erosional experiments under high wave energy conditions, with and without the presence
of cyanobacteria, produce a range of erosional surfaces (Figure 4). Some of the faces include
smooth, pristine surfaces with minimal visible damage; moderate surficial damage with or
without deep scours and pits; and heavy surficial deterioration. These data enable further
understanding of ooid formation and suggests that during high wave conditions, ooids are more
likely to erode rather than accrete new layers. In a recent study of ooid erosion, samples that


43	
  
were agitated for one week produced 0.3—0.4% of carbonate mud (Van Ee and Wanless, 2008).
In this study, we found 0.21 g/L to 0.69 g/L of residue in samples shaken at 220 rpm for 2
months and an averaged residue concentration of 0.37 g/L ± 0.02. Results from this study further
support the idea that ooid erosion contributes to carbonate mud production when ooids are
exposed to high wave environments.
The similarity of SEM images for ooids agitated for 6 days and 2 months suggests that
ooids may be eroding quickly during short periods of agitation (i.e., during storms). As carbonate
mud production occurs, uneven ooid layers are polished into more concentric layers, so the
effects of long—term abrasion does not significantly alter ooid shapes or surfaces but rather acts
as a “rounding” agent. This is important when considering the mechanics of ooid formation and
its relationship with agitation. Endolithic borings and pits from cyanobacteria were commonly
found throughout the erosional experiments, suggesting that they are actively boring and creating
uneven surfaces during agitation periods. These uneven layers are then rounded and polished.
Further experimental research should focus on understanding whether surficial borings promote
the breakdown of ooid surfaces during agitation conditions.
6. Conclusions
This project offers a multidisciplinary approach to help explain the distribution,
occurrence and formation of ooids in modern settings like Pigeon Creek Delta by integrating
field and thin section data with organic geochemical analyses and lab experiments. Petrographic
analysis of subtidals samples taken from the tidal channel suggests ooids are likely both eroding
locally and actively forming in a relatively small, localized area and transported along the delta.
Our results suggest that S7 and S8 are the dominant regions of ooid production/accumulation in


44	
  
Pigeon Creek Delta. Samples S7 and S8 are located along the rippled, barren floor and in the
shallowest portions of the channel. This is especially evident with S8, a sample that was
collected in the middle of the shallow portion. The prevalence of ooids in beach sand is similar to
what was found on nearby Cat Island (Glumac et al., 2012), and suggests that ooids are actively
forming in the seafloor area (wave ripples and sand wave area).
Lipid biomarker results were similar to those found by Summons et al. (2013). These data
along with experimental data suggests that microbes are colonizing ooids, but it is still uncertain
whether they directly contribute to ooid formation. One factor that may be influencing ooid
formation is the presence of sulfate—reducing bacteria in the water column or on ooid surfaces.
These organisms may be increasing alkanity and promoting ooid formation locally. Further lipid
biomarker studies on ooids in different environments are needed to further understand the role(s)
that these particular microbes have on ooid formation.
Experimental work indicates that during any period of high wave agitation, the outer
layers of ooids are abrading, producing carbonate mud, and shaping ooids into rounded particles.
This is supported by the absence of severely damaged ooids (e.g., ooids broken in half). Ooids
that were exposed to cyanobacteria suggests that microbes are actively colonizing the ooids and
leaving remnants of biofilm and organic matter around the ooids. Although it is still uncertain
whether or not microbial communities are required for ooid formation, our work confirms a
relationship that needs further exploration.


45	
  
References
Bathurst, R. G. C. (1975), Carbonate sediments and their diagenesis, 2nd
Ed. Amsterda: Elsevier,
658 pp.
Boardman, M. R. and C. Carney (1996), Pigeon Creek and Tidal Delta: A field trip guide:
Bahamian Field Station, San Salvador, Bahamas, 8p. Bahamas, Field Guide.
Broecker, W. S. and T. Takahashi (1966), Calcium carbonate precipitation on the Bahama
Banks. Journal of Geophysical Research 71, 1575—1602.
Carew, J. L. and J. E. Mylroie (1987), A refined geochronology for San Salvador Island,
Bahamas, in Curran, H. A., ed., Proceedings of the Third Symposium on the Geology of
the Bahamas: Ft. Lauderdale, Florida, CCFL Bahamian Field Station, 31—44.
Carew, J. L. and J. E. Mylroie (1995), Depositional model and stratigraphy for the Quaternary
geology of the Bahama islands, In Curran, H. A., and B. White. eds., Terrestrial and
shallow marine geology of the Bahamas and Bermuda: Geological Society of America
Special Paper 300, p. 5-31.
Canfield, D.E., and D. J. Des Marais (1991), Aerobic sulfate reduction in microbial mats.
Science 251, 1471—1473.
Cloud, P. E., Jr (1962), Environment of calcium carbonate deposition west of Andros Island,
Bahamas. U.S.Geological Survey Professional Paper 350, 1—138.
Corsetti, F. A., Anderson, R. P., Bird, J. T., Meneske, M., Trower Stefurak, E. J., Petryshyn, V.
A., Tripati, A., Stamps, B. W., Stevenson, B. S., and J. S. Spear (2013), Ooid formation
in the Great Salt Lake, Utah: insights from clumped isotope paleothermometry and
molecular biology. Geological Society of America Annual Meeting Abstracts with
Programs. (Abstract).
Curran, H. A. and B. White (1995), Bahamas geology in Curran, H. A. and B. White, eds.,
Terrestrial and shallow marine geology of the Bahamas and Bermuda: Geological Society
of America, Special Paper 300, 1—3.
Davies, P. J., Bubela, B., and J. Ferguson (1978), The formation of ooids. Sedimentology 25(5),
703—729.
Diaz, M. R., Piggot, A. M., Eberli, G. P., and J. S. Klaus (2013), Bacterial community of ooilitic
carbonate sedimets of the Bahamas Archipelago. Marine Ecology Progress Series, 485,
9-24.


46	
  
Dowling, N. J. E., Widdel F., and D. C. White (1986), Phospholipid ester-linked fatty acid
biomarkers of acetate-oxidizing sulphate-reducers and other sulphide-forming bacteria.
Journal of General Microbiology 132, 1815—1825.
Duguid, S. M., Kyser, T. K., James, N. P., and E. C. Rankey (2010), Microbes and ooids.
Journal of Sedimentary Research 80, 236—251.
Edgecomb, V. P., Bernhard, J. M., Beaudoin, D., Pruss, S., Welander, P. V., Schubotz, F.,
Mehay, S., Gillespie, A. L., and R. E. Summons (2013), Molecular indicators of
microbial diversity in oolitic sands of Highborne Cay, Bahamas. Geobiology 11, 234—
251.
Fabricus, F. (1977), Origin of marine oöids and grapestones. Contributions to sedimentology 7,
1—113.
Flügel, E. (1982), Microfacies analysis of limestones. Springer-Verlag:Berlin, 633 pp.
Flügel, E. (2004), Microfacies analysis of carbonate rocks. Springer-Verlag:Berlin, 976 pp.
Folk R. L. and F. L. Lynch (2001), Organic matter, putatitve annobacteria and the formation of
ooids and hardgrounds. Sedimentology 48, 215—229.
Fournier, M., Dermounn, Z., Durand, M., and A. Dolla (2004). A new function of the
Desulfovibrio vulgaris Hildenborough [Fe] hydrogenase int eh protection against oxygen
stress. Journal of Biological Chemistry 273, 1787—1793.
Kuever, J., Könnecke, M., Galushko, A., and O. Drzyzga (2001), Reclassification of
Desculfobacterium phenolicum as Desulfobacula phenolica comb. nov. and description
of strain SaxT as Desulfotignum balticium gen. nov., sp. Nov. International Journal of
Systematic and Evolutionary Microbiology 51, 171-177.
Garber, R. A., Friedman, G. M., andA. Nissenbaum (1981), Concentric aragonitic ooids from the
Dead Sea. Journal of Sedimentary Research 51(2), 455-458.
Gillespie, A. L (2013), Organic matter preserved in modern ooids from Shark Bay and the
Bahamas. (Unpublished thesis). Department of Earth, Atmospheric, and Planetary
Sciences, Massachusetts Institute of Technology. Cambridge, Massachusetts.
Glumac, B., Curran, H. A., Motti, S. A., Wegner, M. M., and S. B. Pruss (2012), Distribution of
oolitic sediment along a beach-to-offshore transect, Pigeon Cay, Cat Island, Bahamas:
new insights into modern ooid formation, in Gamble, D. W. and P. Kindler, ed.,
Proceedings of the 15th
Symposium on the Geology of the Bahamas and Other Carbonate
Regions, Gerace Research Center, San Salvador, Bahamas, 71—81.


47	
  
Harris, P. M., Halley R. B., and K.J. Lucas (1979), Endolith microborings and their presevation
in Holocene-Pleistocene (Bahama-Florida) ooids. Geology 7, 216-220.
Mitchell, S. W. (1986), Sedimentology of Pigeon Creek, San Salvador Island, Bahamas, in
Curran, H. A., ed., Proceedings of the 3rd
Symposium on the Geology of the Bahamas,
CCFL Bahamian Field Station, San Salvador, Bahamas, 215—230.
Morse, J. W. and F. T. Mackenzie (1990), Geochemistry of sedimentary carbonates. Elsivier:
Amsterdam, 707 pp.
Mylroie, J. E., Carew, J. L., Curran, H. A., Freile, D., Sealey, N. E., and V. J. Voegeli (2006),
Geology of Cat Island, Bahamas: A Field Trip Guide. 13th Symposium on the geology of
the Bahamas and other carbonate regions, San Salvador, Bahamas. Gerace Research
Centre, 44 pp.
Ourisson, G., Rohmer, M., and K. Poralla (1987), Prokaryotic hopanoids and other
polytriterpenoid sterol surrogates. Annual Reviews of Microbiology 41, 301–333
Reitner, J., Arp, G., Thiel, V., Gautret, P., and U. Galling (1997), Organic matter in Great Salt
Lake ooids (Utah, USA): first approach to a formation via organic matrices. Facies 36,
210—219.
Richter, D. K. (1983), Calcareous ooids: a synopsis. In Coated Grains (ed. Peryt TM), Springer,
Heidelberg, pp. 71—99.
Rodgers, J. (1954), Terminology of limestone and related rocks: an interim report. Journal of
Sedimentary Petrology 24, 225—234.
Rohmer, M., Bouvier-Nave, P., and G. Ourisson (1984), Distribution of hopanoid triterpenes in
prokaryotes. Journal of General Microbiology 130, 1137-1150.
Sandberg, P. A. (1975), New interpretations of Great Salt Lake ooids and of ancient nonskeletal
carbonate mineralogy. Sedimentology 22, 497—537.
Suess, E. and D. Fütterer (1972), Aragonitic oöids: experimental precipitation from seawater in
the presence of humic acid. Sedimentology 19, 939—943.
Summons, R. E., Bird, L. R., Gillespie, A. L., Pruss, S. B., Roberts, M., and A. L. Sessions
(2013),Lipid biomarkers in ooids from different locations and ages: evidence for a
common bacterial flora. Geobiology 11, 420—436.
Taylor, J. and R. J Parkes (1983), The cellular fatty acids of the sulphate—reducing bacteria,
Desulfovibrio desulfricans. Journal of General Microbiology 129, 3303—3309.
Thalman, K. L. and J. W. Teeter (1982), A Pleistocene lagoon and its modern analogue, San
Salvador, Bahamas, in Gerace, D. T., ed., Proceedings, First Symposium on the Geology


48	
  
of the Bahamas: Miami, Florida, CCFL Bahamian Field Station, 13—21.
Trower, E. J. and J. P. Grotzinger (2010), Sedimentology, diagenesis, and stratigraphic
occurrence of giant ooids in the Ediacaran Rainstorm Member, Johnnie Formation,
Death valley Region, California. Precambrian Research 180, 113—124.
Van Ee, N. J. and H.R. Wanless (2008), Ooids and grapestone—A significant source of mud on
Caicos Platform, in SEPM Core Workshop 22: Developing Models and Analogs for
Isolated Platforms—Holocene and Pleistocene Carbonates of Caicos Platform, British
West Indies, eds. Morgan, W. A. and P. M. Harris. P. 121-125.
Weyl, P. K. (1967), The solution behaviour of carbonate materials in seawater. Studies Tropical
Oceanography University of Miami 5, 178—228.


Wavelength
400nm
H1 H2 H3 H4 H5 H6 L1 L2 N1 N2 Seawater DI Water
100% 0.399 0.577 0.098 0.092 0.118 0.11 0.063 0.054 0.06 0.098 0.044 0.043
50% 0.208 0.162 0.065 0.071 0.07 0.075 0.052 0.052 0.048 0.053 0.043 0.042
25% 0.126 0.094 0.061 0.06 0.067 0.07 0.05 0.052 0.048 0.051 0.042 0.048
12.50% 0.074 0.058 0.048 0.054 0.055 0.052 0.047 0.053 0.064 0.069 0.046 0.042
6.25% 0.059 0.05 0.047 0.046 0.048 0.046 0.052 0.049 0.051 0.045 0.053 0.048
3.13% 0.048 0.047 0.047 0.044 0.046 0.046 0.045 0.049 0.045 0.045 0.05 0.046
1.56% 0.046 0.05 0.045 0.048 0.044 0.046 0.047 0.044 0.043 0.059 0.048 0.043
0.78% 0.048 0.044 0.044 0.044 0.047 0.041 0.044 0.057 0.037 0.043 0.043 0.046
Wavelength
450nm
H1 H2 H3 H4 H5 H6 L1 L2 N1 N2 Seawater DI Water
100% 0.344 0.494 0.09 0.084 0.109 0.098 0.057 0.05 0.057 0.087 0.039 0.038
50% 0.18 0.141 0.059 0.065 0.064 0.068 0.048 0.046 0.045 0.048 0.038 0.038
25% 0.108 0.083 0.055 0.054 0.061 0.063 0.046 0.048 0.043 0.046 0.038 0.043
12.50% 0.065 0.051 0.043 0.047 0.049 0.048 0.042 0.047 0.058 0.063 0.041 0.037
6.25% 0.054 0.045 0.042 0.041 0.043 0.04 0.046 0.044 0.046 0.04 0.047 0.042
3.13% 0.043 0.042 0.042 0.04 0.04 0.041 0.039 0.044 0.041 0.04 0.045 0.042
1.56% 0.041 0.045 0.04 0.044 0.039 0.04 0.042 0.04 0.039 0.054 0.043 0.038
0.78% 0.043 0.038 0.039 0.041 0.041 0.037 0.038 0.051 0.034 0.039 0.04 0.041
Wavelength
500nm
H1 H2 H3 H4 H5 H6 L1 L2 N1 N2 Seawater DI Water
100% 0.316 0.431 0.093 0.086 0.109 0.099 0.062 0.054 0.062 0.083 0.038 0.036
50% 0.167 0.126 0.059 0.063 0.066 0.068 0.048 0.048 0.047 0.05 0.037 0.036
25% 0.101 0.078 0.055 0.052 0.06 0.062 0.045 0.048 0.043 0.044 0.036 0.041
12.50% 0.062 0.049 0.042 0.046 0.047 0.045 0.04 0.046 0.057 0.062 0.04 0.036
6.25% 0.049 0.042 0.04 0.039 0.041 0.04 0.045 0.042 0.045 0.04 0.046 0.044
3.13% 0.04 0.04 0.041 0.037 0.038 0.04 0.037 0.042 0.038 0.038 0.043 0.04
1.56% 0.039 0.042 0.038 0.04 0.037 0.039 0.039 0.039 0.036 0.052 0.041 0.037
0.78% 0.042 0.038 0.038 0.039 0.041 0.037 0.036 0.048 0.033 0.037 0.037 0.04
Appendix A— Absorption values for trial 1 samples at 400nm , 450nm, 500nm, 550nm, and 650nm.


   50	
  
Wave Length
550nm
H1 H2 H3 H4 H5 H6 L1 L2 N1 N2 Seawater DI Water
100% 0.285 0.388 0.084 0.076 0.100 0.086 0.056 0.048 0.054 0.071 0.037 0.036
50% 0.151 0.118 0.054 0.06 0.060 0.061 0.044 0.044 0.042 0.045 0.036 0.035
25% 0.092 0.072 0.052 0.048 0.057 0.058 0.042 0.045 0.041 0.041 0.036 0.042
12.50% 0.058 0.047 0.041 0.045 0.046 0.044 0.04 0.045 0.054 0.059 0.039 0.035
6.25% 0.049 0.042 0.04 0.039 0.042 0.038 0.044 0.041 0.044 0.038 0.045 0.041
3.13% 0.039 0.039 0.039 0.04 0.039 0.038 0.037 0.04 0.038 0.037 0.042 0.039
1.56% 0.037 0.042 0.037 0.039 0.038 0.037 0.039 0.037 0.035 0.053 0.04 0.036
0.78% 0.041 0.037 0.038 0.037 0.040 0.036 0.037 0.048 0.032 0.037 0.036 0.04
Wave Length
650nm
H1 H2 H3 H4 H5 H6 L1 L2 N1 N2 Seawater DI Water
100% 0.231 0.301 0.071 0.063 0.083 0.071 0.048 0.04 0.044 0.06 0.037 0.035
50% 0.126 0.096 0.049 0.052 0.051 0.052 0.041 0.041 0.038 0.04 0.036 0.034
25% 0.08 0.065 0.048 0.046 0.051 0.052 0.04 0.043 0.039 0.039 0.035 0.041
12.50% 0.054 0.043 0.038 0.04 0.042 0.041 0.037 0.042 0.053 0.058 0.038 0.035
6.25% 0.046 0.038 0.037 0.036 0.038 0.037 0.042 0.039 0.042 0.036 0.044 0.04
3.13% 0.037 0.039 0.039 0.038 0.036 0.038 0.035 0.04 0.037 0.036 0.041 0.038
1.56% 0.037 0.039 0.037 0.04 0.037 0.036 0.038 0.034 0.034 0.051 0.039 0.036
0.78% 0.04 0.035 0.038 0.036 0.038 0.035 0.037 0.047 0.031 0.037 0.038 0.039


51	
  
Known
Concentration
of H1 (g/L)
400 nm 450 nm 500 nm 550 nm 650 nm
0.3800 0.399 0.344 0.316 0.285 0.231
0.1900 0.208 0.18 0.167 0.151 0.126
0.0950 0.126 0.108 0.101 0.092 0.08
0.0475 0.074 0.065 0.062 0.058 0.054
0.0238 0.059 0.054 0.049 0.049 0.046
0.0119 0.048 0.043 0.04 0.039 0.037
0.0059 0.046 0.041 0.039 0.037 0.037
0.0030 0.048 0.043 0.042 0.041 0.04
Appendix A— Data used to construct calibration curves for H1.
	
  
Appendix A— Graph of calibration curves constructed.
	
  
53
Trial 1 Trial 2
Absorption (g/L) Filter 10mL (g/L) Filter Various (g/L) Filter 100mL (g/L)
H1 0.43 0.380 0.356 0.208
H2 0.59 0.470 0.404 0.69
H3 0.13 0.010 0.107 0.97
H4 0.12 0.050 0.140 0.36
H5 0.15 0.017 0.125
H6 0.13 -0.070 0.088
Appendix A— Table describing all residue data obtained from Trial 1 and 2.
	
  
54
APPENDIX B—All petrographic slides, labeled.
S1 Petrography (1)
S1 Petrography (2)
55
S2 Petrography (1)
S2 Petrography (2)
56
S3 Petrography (2)
S3 Petrography (1)
57
S5 Petrography (1)
S5 Petrography (2)
58
S6 Petrography (2)
S6 Petrography (1)
59
S7 Petrography (2)
S7 Petrography (1)
60
S8 Petrography (1)
S8 Petrography (1)
61
S9 Petrography (2)
S9 Petrography (1)
62
S10 Petrography (1)
S10 Petrography (2)
63
S11 Petrography (1)
S11 Petrography (2)
64
S12 Petrography (1)
S12 Petrography (2)
65
S13 Rock Petrography (1)
S13 Rock Petrography (2)
66
S14 Petrography (1)
S14 Petrography (2)
67
S15 Petrography (1)
S15 Petrography (2)


S16 Rock Petrography (1)
S16 Rock Petrography (2)

More Related Content

Viewers also liked

" ప్రొద్దుతిరుగుడు " పంటకు సంబందించి తరచుగా అడిగే ప్రశ్నలు
" ప్రొద్దుతిరుగుడు " పంటకు సంబందించి తరచుగా అడిగే ప్రశ్నలు " ప్రొద్దుతిరుగుడు " పంటకు సంబందించి తరచుగా అడిగే ప్రశ్నలు
" ప్రొద్దుతిరుగుడు " పంటకు సంబందించి తరచుగా అడిగే ప్రశ్నలు
KACHARAGADLA MEDIA CORP
 
plafo_somereta_montsant2
plafo_somereta_montsant2plafo_somereta_montsant2
plafo_somereta_montsant2Pep Nogués
 
C89 22 tcn262_2000p6
C89 22 tcn262_2000p6C89 22 tcn262_2000p6
C89 22 tcn262_2000p6
Ttx Love
 
The Ninja of Destiny james alexander
The Ninja of Destiny   james alexanderThe Ninja of Destiny   james alexander
The Ninja of Destiny james alexander
Peter Alexander
 
ipsfopportunities
ipsfopportunities ipsfopportunities
ipsfopportunities Donald Suxho
 
Knight Templar Belt
Knight Templar BeltKnight Templar Belt
Knight Templar Belt
MASONIC REGALIA INTERNATIONAL
 
Brooklyn Academy of Music: Upcoming 2015 Film
Brooklyn Academy of Music: Upcoming 2015 FilmBrooklyn Academy of Music: Upcoming 2015 Film
Brooklyn Academy of Music: Upcoming 2015 FilmPedro J Torres
 
1 a7 22tcn262_2000p4
1 a7 22tcn262_2000p41 a7 22tcn262_2000p4
1 a7 22tcn262_2000p4
Ttx Love
 
Comunicação
ComunicaçãoComunicação
Comunicação
Naysa Taboada
 
El portátil ideal
El portátil idealEl portátil ideal
El portátil ideal
Gleidis Garciia
 
Gala ads
Gala adsGala ads
Gala ads
Orlee Berlove
 
Vectores
Vectores Vectores
Frito Lay Intern Recap
Frito Lay Intern RecapFrito Lay Intern Recap
Frito Lay Intern Recap
tuellk12
 

Viewers also liked (13)

" ప్రొద్దుతిరుగుడు " పంటకు సంబందించి తరచుగా అడిగే ప్రశ్నలు
" ప్రొద్దుతిరుగుడు " పంటకు సంబందించి తరచుగా అడిగే ప్రశ్నలు " ప్రొద్దుతిరుగుడు " పంటకు సంబందించి తరచుగా అడిగే ప్రశ్నలు
" ప్రొద్దుతిరుగుడు " పంటకు సంబందించి తరచుగా అడిగే ప్రశ్నలు
 
plafo_somereta_montsant2
plafo_somereta_montsant2plafo_somereta_montsant2
plafo_somereta_montsant2
 
C89 22 tcn262_2000p6
C89 22 tcn262_2000p6C89 22 tcn262_2000p6
C89 22 tcn262_2000p6
 
The Ninja of Destiny james alexander
The Ninja of Destiny   james alexanderThe Ninja of Destiny   james alexander
The Ninja of Destiny james alexander
 
ipsfopportunities
ipsfopportunities ipsfopportunities
ipsfopportunities
 
Knight Templar Belt
Knight Templar BeltKnight Templar Belt
Knight Templar Belt
 
Brooklyn Academy of Music: Upcoming 2015 Film
Brooklyn Academy of Music: Upcoming 2015 FilmBrooklyn Academy of Music: Upcoming 2015 Film
Brooklyn Academy of Music: Upcoming 2015 Film
 
1 a7 22tcn262_2000p4
1 a7 22tcn262_2000p41 a7 22tcn262_2000p4
1 a7 22tcn262_2000p4
 
Comunicação
ComunicaçãoComunicação
Comunicação
 
El portátil ideal
El portátil idealEl portátil ideal
El portátil ideal
 
Gala ads
Gala adsGala ads
Gala ads
 
Vectores
Vectores Vectores
Vectores
 
Frito Lay Intern Recap
Frito Lay Intern RecapFrito Lay Intern Recap
Frito Lay Intern Recap
 

Similar to Gomez_Kiara_HonorsProject

Graehl (2009) Sand deposition mech
Graehl (2009) Sand deposition mechGraehl (2009) Sand deposition mech
Graehl (2009) Sand deposition mechNicholas Graehl
 
Ron Vave - Complete MSc thesis
Ron Vave - Complete MSc thesisRon Vave - Complete MSc thesis
Ron Vave - Complete MSc thesisRon Vave
 
KMRS October Newsletter 2015
KMRS October Newsletter 2015KMRS October Newsletter 2015
KMRS October Newsletter 2015Hayley Woodland
 
Examples of ideas for the training
Examples of ideas for the trainingExamples of ideas for the training
Examples of ideas for the trainingAhmed Tarek Fahmy
 
ÖNCEL AKADEMİ: SOLID EARTH GEOPHYSICS
ÖNCEL AKADEMİ: SOLID EARTH GEOPHYSICSÖNCEL AKADEMİ: SOLID EARTH GEOPHYSICS
ÖNCEL AKADEMİ: SOLID EARTH GEOPHYSICS
Ali Osman Öncel
 
Measuring Xylem Vulnerability in Three Citrus Species (on page 31)
Measuring Xylem Vulnerability in Three Citrus Species (on page 31)Measuring Xylem Vulnerability in Three Citrus Species (on page 31)
Measuring Xylem Vulnerability in Three Citrus Species (on page 31)
Emily Wieber
 
Dimensions_2012_Emily Wieber_page 31
Dimensions_2012_Emily Wieber_page 31Dimensions_2012_Emily Wieber_page 31
Dimensions_2012_Emily Wieber_page 31Emily Wieber
 
Petroleum Geology Of The Sarir Essay
Petroleum Geology Of The Sarir EssayPetroleum Geology Of The Sarir Essay
Petroleum Geology Of The Sarir Essay
April Dillard
 
IT REPORT-2012 (RYAN IVARAMI-DFMR YEAR 3)
IT REPORT-2012 (RYAN IVARAMI-DFMR YEAR 3)IT REPORT-2012 (RYAN IVARAMI-DFMR YEAR 3)
IT REPORT-2012 (RYAN IVARAMI-DFMR YEAR 3)Ryan Ivarami
 
Cave diving in argentina
Cave diving in argentinaCave diving in argentina
Cave diving in argentina
Mariscope Latinoamerica
 
101520191Geologic TimeChapter 8Contents1. .docx
101520191Geologic TimeChapter 8Contents1. .docx101520191Geologic TimeChapter 8Contents1. .docx
101520191Geologic TimeChapter 8Contents1. .docx
aulasnilda
 
Sedimentology Lecture 1. introduction to the course
Sedimentology Lecture 1. introduction to the courseSedimentology Lecture 1. introduction to the course
Sedimentology Lecture 1. introduction to the course
Sigve Hamilton Aspelund
 
Beyond water on mars
Beyond water on marsBeyond water on mars
Beyond water on mars
Awad Albalwi
 
Journeys Through Cycles of Earth Grant
Journeys Through Cycles of Earth GrantJourneys Through Cycles of Earth Grant
Journeys Through Cycles of Earth GrantDanielle Thomas
 
Earth-and-Life-Science-Q1-Week-6-22.pdf
Earth-and-Life-Science-Q1-Week-6-22.pdfEarth-and-Life-Science-Q1-Week-6-22.pdf
Earth-and-Life-Science-Q1-Week-6-22.pdf
Edchelo1
 
Lab activity 7 plate tectonics
Lab activity 7 plate tectonicsLab activity 7 plate tectonics
Lab activity 7 plate tectonicskleinkea
 
The Geology of Southern Raasay
The Geology of Southern RaasayThe Geology of Southern Raasay
The Geology of Southern Raasay
Christopher Kelly
 

Similar to Gomez_Kiara_HonorsProject (20)

Graehl (2009) Sand deposition mech
Graehl (2009) Sand deposition mechGraehl (2009) Sand deposition mech
Graehl (2009) Sand deposition mech
 
Ron Vave - Complete MSc thesis
Ron Vave - Complete MSc thesisRon Vave - Complete MSc thesis
Ron Vave - Complete MSc thesis
 
KMRS October Newsletter 2015
KMRS October Newsletter 2015KMRS October Newsletter 2015
KMRS October Newsletter 2015
 
Examples of ideas for the training
Examples of ideas for the trainingExamples of ideas for the training
Examples of ideas for the training
 
ÖNCEL AKADEMİ: SOLID EARTH GEOPHYSICS
ÖNCEL AKADEMİ: SOLID EARTH GEOPHYSICSÖNCEL AKADEMİ: SOLID EARTH GEOPHYSICS
ÖNCEL AKADEMİ: SOLID EARTH GEOPHYSICS
 
Measuring Xylem Vulnerability in Three Citrus Species (on page 31)
Measuring Xylem Vulnerability in Three Citrus Species (on page 31)Measuring Xylem Vulnerability in Three Citrus Species (on page 31)
Measuring Xylem Vulnerability in Three Citrus Species (on page 31)
 
Dimensions_2012_Emily Wieber_page 31
Dimensions_2012_Emily Wieber_page 31Dimensions_2012_Emily Wieber_page 31
Dimensions_2012_Emily Wieber_page 31
 
Petroleum Geology Of The Sarir Essay
Petroleum Geology Of The Sarir EssayPetroleum Geology Of The Sarir Essay
Petroleum Geology Of The Sarir Essay
 
THESIS
THESISTHESIS
THESIS
 
IT REPORT-2012 (RYAN IVARAMI-DFMR YEAR 3)
IT REPORT-2012 (RYAN IVARAMI-DFMR YEAR 3)IT REPORT-2012 (RYAN IVARAMI-DFMR YEAR 3)
IT REPORT-2012 (RYAN IVARAMI-DFMR YEAR 3)
 
report_s230-2
report_s230-2report_s230-2
report_s230-2
 
Cave diving in argentina
Cave diving in argentinaCave diving in argentina
Cave diving in argentina
 
101520191Geologic TimeChapter 8Contents1. .docx
101520191Geologic TimeChapter 8Contents1. .docx101520191Geologic TimeChapter 8Contents1. .docx
101520191Geologic TimeChapter 8Contents1. .docx
 
Sedimentology Lecture 1. introduction to the course
Sedimentology Lecture 1. introduction to the courseSedimentology Lecture 1. introduction to the course
Sedimentology Lecture 1. introduction to the course
 
Beyond water on mars
Beyond water on marsBeyond water on mars
Beyond water on mars
 
Journeys Through Cycles of Earth Grant
Journeys Through Cycles of Earth GrantJourneys Through Cycles of Earth Grant
Journeys Through Cycles of Earth Grant
 
Earth-and-Life-Science-Q1-Week-6-22.pdf
Earth-and-Life-Science-Q1-Week-6-22.pdfEarth-and-Life-Science-Q1-Week-6-22.pdf
Earth-and-Life-Science-Q1-Week-6-22.pdf
 
Lab activity 7 plate tectonics
Lab activity 7 plate tectonicsLab activity 7 plate tectonics
Lab activity 7 plate tectonics
 
The Geology of Southern Raasay
The Geology of Southern RaasayThe Geology of Southern Raasay
The Geology of Southern Raasay
 
research final paper
research final paperresearch final paper
research final paper
 

Gomez_Kiara_HonorsProject

  • 1. Ooid Formation at Pigeon Creek Delta, San Salvador Island, Bahamas Kiara J. Gomez Submitted to the Department of Geosciences of Smith College in partial fulfillment for the requirements for the degree of Bachelor of Arts Sara B. Pruss, Honors Project Advisor May 12, 2014
  • 2.               2   Abstract Ooids are small spherical to ellipsoidal coated grains, characterized by concentric layers of calcium carbonate. Despite the ubiquity of these grains in the geologic past, their formation, including their accretion and shaping, is still the subject of debate. In 2013, a targeted collection of sand containing ooids was performed in subtidal and beach settings along Pigeon Creek Delta on San Salvador Island, The Bahamas. Thirteen samples were taken in the tidal channel at different locations and it was determined that ooids were most abundant at localized sites along the tidal delta, suggesting that ooids are actively forming in the tidal channel and transported onto beachshores. To characterize the organic matter associated with ooids, samples were examined for lipid biomarkers at MIT. As in previous work, our results showed characteristically long-chain normal fatty acids (FA) and a distinguishable even-over-odd carbon number compounds with very small abundances of iso— and anteiso—FA. These results suggest that organic matter in Pigeon Creek ooids is dominated by bacterial communities like cyanobacteria and sulfate reducing bacteria, suggesting that microbes are present on ooid surfaces as well as in the water column. To assess the role of abrasion in ooid formation, preexisting ooid sand collections from Cat Island, Bahamas, were used in accretion and erosion experiments where ooids were rolled under high wave conditions from 6 days to 2 months both with and without cyanobacteria. Despite producing different amounts of carbonate mud during erosion experiments, ooid surfaces were not broken in half or extremely eroded. This multidisciplinary project has revealed that: 1) ooids are actively forming and accumulating in shallow portions of the tidal channel (sites S7 and S8), and are being transported to the beach through flood tides; 2) cyanobacteria are colonizing ooid surfaces, but whether they contribute to ooid formation is uncertain; and 3) high wave agitation causes the outer layers of ooids to erode (breakdown) and get rounded as carbonate mud is produced. Further work will require additional multidisciplinary approaches to understand the mechanics of ooid formation, and explore the relationship between bacterial communities and ooids.
  • 3.               3   Aknowledgements Partial funding for field work in January 2013 was provided by the Mellon Mays Fellowship, Sara Pruss and the Smith College Geosciences Department. Further financial support was provided by the Nancy Kershaw Tomlinson Memorial Fund. My sincerest gratitude is extended to Sara Pruss for giving me the opportunity to conduct this research and for her advice, support, and encouragement throughout my time at Smith College. Also, my deepest gratitude to Roger Summons, Aimee Gillespie, Tanja Bosak and Guilio Mariotti from MIT for collaborating with me on this project, and to my friends Kayla Clark and Corinne Ducey for being there for me. Thanks to Mike Vollinger for assistance with thin sections, Jennifer Leman for field assistance, Al Curran for help and guidance in the field;, and Judith Wopereis for techincal help with the SEM. I would also like to especially thank the members of the Sara Pruss lab for encouragement and helpful discussions as well as Pamela Nolan Young, Naomi Miller, and the Mellon Mays family for believing in and cheering for me. Lastly, I thank all of the faculty, staff and students of the Department of Geosciences for their utmost help and encouragement throughout my career at Smith College.
  • 4.               4   Table of Contents Abstract……....................................................................................................................................2 Acknowledgements…......................................................................................................................3 1. Introduction .................................................................................................................................6 1.1 Previous experimental work on ooids............................................................................7 1.2 Previous biomarker research on ooids...........................................................................8 2. Geologic Setting ..........................................................................................................................9 2.1 Pigeon Creek................................................................................................................11 3. Methods......................................................................................................................................16 3.1 Sampling and Sieving..................................................................................................16 3.2 Lipid Extraction and Derivitization.............................................................................17 3.3 Gas Chromatography-Mass Spectrometry (GC-MS) Analysis....................................18 3.4 Lab Erosion Experiments.............................................................................................18 3.5 Scan Electron Microscopy (SEM)...............................................................................19 4. Results........................................................................................................................................23 4.1 Petrography..................................................................................................................23 4.2 Organic Geochemistry.................................................................................................29 4.3 Lab Experiments..........................................................................................................31 5. Discussion................................................................................................................................. 39 5.1 Petrography..................................................................................................................39 5.2 Biomarkers...................................................................................................................40 5.3 Experimental................................................................................................................42 6. Conclusions............................................................................................................................... 43 References......................................................................................................................................45 Appendix A....................................................................................................................................49 Appendix B....................................................................................................................................54 List of Figures and Tables Figures 1. Locality map of the Bahamas Archipelago. 2. Locality map of San Salvador Island. 3. Pigeon Creek Delta tidal range and current speed graph. 4. Locality map of Pigeon Creek Delta, San Salvador, the Bahamas. 5. Field image of Outcrop 1 6. Image of lab methods, showing containers under high wave conditions 7. Image of lab methods, showing suction filtration of residue 8. Loose sand photographs (site S1 and S9) 9. Locality map of Pigeon Creek Delta, San Salvador, the Bahamas—with ooid abundances. 10. Petrographic photographs of S12 11. Petrographic photographs of S2 12. Total ion chromatograms of unsieved, bulk and sieved samples 13. Graph of residue concentrations
  • 5.               5   14. SEM images of ooid surfaces before exposure to lab conditions 15. SEM images of ooid surfaces (high energy exposure for 6 days and w/cyanobacteria) 16. SEM images of ooid surfaces (high energy exposure for 2 months) 17. SEM images of ooid surfaces (high energy exposure for 2 months and w/cyanobacteria) 18. SEM images of ooid surfaces (no wave activity for 2 months and w/cyanobacteria) List of Figures and Tables Figures 1. Locality map of the Bahamas Archipelago..................................................................................9 2. Locality map of San Salvador Island.........................................................................................10 3. Pigeon Creek Delta tidal range and current speed graph. .........................................................13 4. Locality map of Pigeon Creek Delta, San Salvador, the Bahamas............................................14 5. Field image of Outcrop 1...........................................................................................................15 6. Image of lab methods, showing containers under high wave conditions..................................21 7. Image of lab methods, showing suction filtration of residue.....................................................22 8. Loose sand photographs (site S1 and S9)..................................................................................24 9. Locality map of Pigeon Creek Delta, San Salvador, the Bahamas—with ooid abundances.....25 10. Petrographic photographs of S12.............................................................................................27 11. Petrographic photographs of S2...............................................................................................28 12. Total ion chromatograms of unsieved, bulk and sieved samples.............................................30 13. Graph of residue concentraitions.............................................................................................32 14. SEM images of ooid surfaces before exposure to lab conditions............................................34 15. SEM images of ooid surfaces (high energy exposure for 6 days and w/cyanobacteria).........35 16. SEM images of ooid surfaces (high energy exposure for 2 months).......................................36 17. SEM images of ooid surfaces (high energy exposure for 2 months and w/cyanobacteria).....37 18. SEM images of ooid surfaces (no wave activity for 2 months and w/cyanobacteria).............38   Tables 1. Description of conditions for trial 1 and trial 2..........................................................................20 2. Percentage of ooids and unknown particles...............................................................................26
  • 6.               6   1. Introduction Ooids—small spherical to ellipsoidal coated grains—are characterized by concentric layers of calcium carbonate and are prevalent throughout the geological record (e.g., Rodgers, 1954; Flügel, 1982; Richter, 1983). Modern ooids are thought to form within agitated, shallow carbonate environments (Boardman and Carney, 1996), like in certain areas of the Bahamas today. Ooids are commonly 2 mm in size or smaller, and “giant” ooids (pisoids) have been documented from the Proterozoic, and rarely in the Phanerozoic (see Trower and Grotzinger, 2010 for a review). Despite the ubiquity of these grains in the geologic past, ooid formation and mechanics are still major subjects of debate. In particular, there has been a long—standing discussion about biological controls (i.e. organic matter and cyanobacteria) on ooid formation (e.g., Suess and Fütterer, 1972; Fabricus, 1977; Folk and Lynch, 2001; Duguid et al., 2010; Gillespie, 2013; Summons et al., 2013). To date, most areas of modern ooid accumulation occur in a handful of locations of the Bahamas, such as Exuma, Cat Island and Joulter’s Cay, Andros Island (Mylroie et al., 2006; Glumac et al., 2012; Summons et al., 2013). Aside from the Bahamas, ooids in marine environments are also documented in Shark Bay, Australia (Summons et., 2013), and in hypersaline and freshwater environments such as the Dead Sea (Garber, 1981), Red Sea (Friedman, 1978), and Great Salt Lake (Sandberg, 1975; Reitner et al., 1997). There are three major factors that are believed to control ooid lamina formation, they are described as: 1) a chemical factor that promotes ooid precipitation during supersaturation; 2) an abiotic (or physical) factor that encompasses wave agitation and current activity, causing the ooid to tumble on the sea floor and accrete its layers; and 3) a biological factor linked with microbial activity that enables calcium carbonate precipitation (indirect and/or direct), and thus promoting ooid growth (see Fabricus, 1977 and Davies, 1978 for review).
  • 7.               7   The association between organic matter and ooids has also been long established, but still not well understood (Morse and Mackenzie, 1990; Flügel, 2004; Summons et al., 2013). Most of the recent work has focused on modern Bahamian ooids. In Summons et al. (2013) and Edgecomb et al. (2013), for example, microbial communities were found inhabiting Bahamian ooids, suggesting their presence as a potential control of ooid formation and a mechanism that promotes calcium carbonate precipitation. Other studies suggest ooid formation is a purely abiotic process that is dependent on physical and chemical factors (Duguid et al., 2010). As a middle ground, Diaz et al. (2013) found that ooid formation in active environments (high energy) can potentially be a synergistic combination of microbial activity that influences carbonate precipitation and abiotic factors. Several geological studies have been conducted at a variety of locations throughout Pigeon Creek Lagoon and the nearby open—ocean Snow Bay Lagoon on San Salvador Island, The Bahamas (Thalman, 1983; Mitchell, 1986), but there are currently no detailed studies on the sedimentary processes (i.e. ooid formation) along the tidal channel and delta. In addition, limited information exists on modern tidal creek environments, especially on Pigeon Creek Delta. This project examined subtidal bulk sand and rock samples collected from the Pigeon Creek tidal channel and adjacent areas in order to determine the locations in which ooids are forming and to ascertain the mechanisms that contribute to their formation in this area. 1.1 Previous experimental work on ooids Several experiments have been performed on ooids in lab—controlled settings to assess the relative importance of organic matter, agitation, and settling in ooid formation. Overall, there seems to be a disagreement in the role of agitation in ooid formation. Several studies on
  • 8.               8   Bahamian ooids have suggested that both agitation and supersaturation are critical factors in the formation of ooids (i.e., Cloud, 1962; Broecker and Takahashi, 1966; Bathurst, 1975). In one study, a series of agitation experiments led to a wide—accepted theory that agitation and abrasion (or erosion) are fundamental to the growth cycle of ooids (Weyl, 1967). The growth cycle proposed by Weyl (1967) included four stages: 1) a rapid ooid precipitation stage as traction processes occur along the seafloor; 2) an overgrowth stage where precipitation then begins to slow; 3) a resting stage as the ooid is buried; and 4) a growth stage proceeding erosion. A recent study that focused on the role of abrasion in ooid formation suggested that ooids under agitated conditions produced a fair amount of carbonate mud as the particles abraded themselves, suggesting a mechanism for ooid breakdown (or erosion) (Van Ee and Wanless, 2008). In this project, we performed lab experiments to ascertain the role of abrasion in shaping ooids and its relationship with ooid accretion. 1.2 Previous biomarker research on ooids Lipid biomarkers are specific organic products that can be traced to their natural source or origin. They can be used as a tool to provide information on the origin of organic matter within an environment. In recent years, studies have focused on the biomarkers preserved within ooids to assess the roles and types of microbial communities that are present during ooid formation in marine (Edgecomb et al., 2013; Gillespie, 2013; Summons et al., 2013) and lake settings (Corsetti et al., 2013). Here, we used lipid biomarkers to understand and characterize the organic matter associated with ooids along Pigeon Creek Delta, an ebb tidal delta that is not dominated by ooids.
  • 9.               9   2. Geologic Setting The Bahamas Archipelago consists of a chain of flat-topped, shallow-water carbonate banks that are separated by deep water passages. The archipelago extends about 1,400 km along the continental margin of North America, and is bordered by the Atlantic Ocean (north and east), the Old Bahama Channel (south), and the Florida Strait (west). The water depths of these banks are typically less than 10 m, but can go as deep as 4000 m within water channels (e.g., Carew and Mylorie, 1995; Curran, 1995) (Figure 1). Figure 1: Google Earth image of The Bahamas Archipelago denoting its capital, Nassau (orange dot), and area of study, San Salvador Island (yellow star). 50km
  • 10.               10   San Salvador Island is a small (approximately 11 km wide and 19 km long), isolated island located on the easternmost portion of the Bahamian Archipelago. The island's interior is dominated by dense vegetation and subaerial karst, and its coastlines are marked by their eroding eolianite headlands and beaches comprised of fine to medium sized carbonate skeletal sands (Curran, 1995) (Figure 2). Exposed outcrops on the island are of the North Point or Hanna Bay Member, transgressive—phase eolianites deposited at lower sea levels (Carew and Mylroie, 1987 and 1995). Figure 2: Google Earth image of San Salvador Island, the Bahamas with Pigeon Creek Delta marked with a white arrow. 24ºN 74º27’W 2km
  • 11.               11   2.1. Pigeon Creek Pigeon Creek consists of two arms (tidal creeks) of a lagoon located in the southeast, windward corner of San Salvador (23°57’N, 74°29’W) (Figure 2). These two portions merge at a narrow creek or inlet, where tidal currents reach up to >70 cm/s and create an ebb-tidal delta channel called Pigeon Creek Delta (Boardman and Kelley, 1996). A description of the sediment distribution throughout Pigeon Creek can be found in Mitchell (1986). The study suggests that peloids dominate throughout Pigeon Creek, and that ooids were once the dominant grain type during the Pleistoocene. The tidal velocities and ranges vary throughout the channel. Some of the maximum- recorded velocities (~11-17 meters/minute) throughout Pigeon Creek were measured near the tidal channel (Figure 3). These tidal currents have also been observed as one of the main mechanism of erosion and sediment transport up Pigeon Creek Delta during high tide (or flood tide), and seaward during low tide (ebb tide) (Boardman and Carney, 1996; Mitchell, 1986). The strongest erosional force for coarse sediment has been observed during the ebb current (Boardman and Carney, 1996). Other work that focused on the morphology of Pigeon Creek concluded that the tidal channel and the channel itself changes rapidly over short time scales and is therefore a modern, dynamic system (Boardman and Carney, 1996). Based on recent field observations from 2012, the tidal channel seafloor and depth is variable during low tide (ebb) (Figure 4). It rapidly transitions from a shallow, thin seagrass area (up—channel) to a deeper, more shell—dominated area with some patches of seagrass on the northwest portion of the channel (Figure 4). Moving oceanward along the tidal channel, there is a rippled (ebb—oriented), barren seafloor that rapidly transitions to a relatively shelly and algal dominated seafloor (delta and outer margin). There are two outcrops found on the beach parallel
  • 12.               12   to the tidal channel, located northwest and southeast of the beach house (Figure 4—5). These two exposed outcrops are most likely from the Holocene Hannah Bay of the Rice Bay Formation (look in Carew and Mylroie, 1995 for a review of their stratigraphy).
  • 13.               13   PIGEON CREEK DELTA TIDAL RANGE AND CURRENT SPEED 100 100 50 50 0 4.0 3.5 3.0 2.5 Depth(m) Speed(cm/s) Time (1/1991) 7 8 9 10 Figure 3: Graph of tidal ranges and current speeds throughout the tidal channel at Pigeon Creek Delta. Modified from Mitchel, (1987).  
  • 14.               14   Figure 4: Aerial map (from Bing) showing outcrop sites and brief field observations along the tidal channel. 200FT outer seagrass margin patches of seagrass Beach House Outcrop 2 Outcrop 1 23º 57’ 42” N 74º 29’17” W
  • 15.   15     ! Figure 5: Outcrop 1 found northwest of the beach house. Hammer for scale.
  • 16.               16   3. Methods 3.1 Sampling and Sieving In order to ascertain the mechanism of ooid formation and to constrain their distribution in Pigeon Creek delta, I performed field sampling and kite aerial photography to map the distribution of ooids in Pigeon Creek delta on San Salvador, I extracted and analyzed lipid biomarkers from ooid—bearing sand from San Salvador at MIT, and I performed experimental erosion experiments on Cat Island ooid sand in 200 mL lab containers at MIT and at Smith to quantify the erosion of ooids under different conditions. To constrain possible areas of ooid formation and accumulation in Pigeon Creek Delta, I took thirteen samples along the tidal channel at Pigeon Creek Delta starting from point S1 near the public dock. (Locations of subtidal bulk sand and rock samples are illustrated in Figure 5.) To record the exact position of our samples and observations of physical properties in Pigeon Creek Delta during sampling in 2013, we used a combination of global positioning system (GPS) and high—resolution kite photography to map the tidal channel. These photos were used to analyze and understand the sedimentary processes at sampling points along the tidal channel. Subtidal samples were returned to Smith College for further analysis. Sampling was done during low tide (ebb tide) in order to have the most access to subtidal sand. A portion of the tidal channel was mapped using a 10-foot kite, starting at a point parallel from the Beach House landmark and moving seaward until the edge of the outer seagrass margin. Global Positioning System line segments and points were taken concurrently using a Trimble Juno unit. To further analyze Pigeon Creek ooids and the grains associated with them, loose sand photographs of subtidal sand were taken. Thin sections were also made for grain analysis by embedding each sample in epoxy. This allowed for petrographic characterization and
  • 17.               17   identification of dominant constituents of sand using 2.35 mm by 1.76 mm grids on 12 thin sections. Ooids abundances (in percentage) were determined by dividing number of ooids by the total number of consituents. To analyze the organic geochemistry of Pigeon Creek ooids in a set of subsamples, coarse skeletal fragments and other particles larger than ooids had to be removed from the bulk samples. These subtidal samples were sieved using nine sieves ranging from 841µm to 63µm. Ooids were the most abundant grain in the sieve sizes 420—250 µm and 250— 177 µm, so these subsamples in addition to bulk samples were used for lipid biomarker analysis. 3.2 Lipid Extraction and Derivitization Lipid biomarkers are commonly used to identify taxonomically specific organisms within the water column and sediments. For example, 2β-methylbacteriohopaneopolyols have been presented as biomarkers for cyanobacteria (Summons et al., 1999), a photoautrophic microbe recently discovered and described as diverse microbial communities colonizing ooids from the Bahamas and Australia (i.e., Summons et al., 2013; Edgecomb et al., 2013). Summons et al. (2013) specifically analyzed branched fatty methyl esters (FAME) as molecular biomarkers to determine which microbes may play a role in ooid formation (i.e., sulfate-reducing bacteria). Ooid sample extraction and derivitization was conducted using methods from Summons et al. (2013) and Gillespie (2013). A small sample of sieved (420—250 µm and 250—177 µm) ooids and bulk sand were extracted with DCM by sonication five times and then placed under a stream of dry nitrogen. These samples were then transferred to a clean glass vial and labeled TLE (total lipid extraction). Ooid samples were derivitized by methanolysis, a process used to convert complex glycerides (fatty acids) into simple fatty methyl esters (FAME) for gas chromatography (GC)
  • 18.               18   analysis. In brief, samples were covered in methanolic HCL (prepared as in Gillespie, 2013 methods) and heated (60—70º C) overnight. Samples were cooled at room temperature. After derivitized samples were allowed to cool, they were separated by liquid chromatography over ~10 cm columns of silica gel packed in a Pasteur pipette (Gillespie, 2013). This was done to remove any remaining unwanted inorganic material within the samples. Using a sequence of five solvents of increasing polarity, the following five fractions were generated: aliphatic hydrocarbons (in hexane); aromatic hydrocarbons (in 4:1 hexane:DCM); ketones and fatty methyl esters (FAME) (in DCM); alcohols (in 1:1 DCM: ethyl acetate); and diols (in ethyl acetate). 3.3 Gas Chromatography-Mass Spectrometry (GC-MS) Analysis Samples were analyzed using an Agilent 7890A GC equipped with a Gerstel programmable temperature vaporizing (PTV) injector and interfaced to an Agilent 5975 Mass Selective Detector. A J&W DB1-MS capillary column (dimensions: 30 m x 0.25 mm x 0.25 µm) was fixed into the GC using helium as the carrier. Further information regarding the oven settings of equipment can be found in Summons et al. (2013) and/or Gillespie (2013). Fatty acid methyl esters (FAME) peaks were identified by comparing their mass spectra and their retention time to those found within spectra library called Supelco Analytical. 3.4 Lab Erosion Experiments To assess the importance of movement in the accretion and shaping of ooids, a series of experiments were run under varying conditions at MIT and Smith. An ooid sand sample from Cat Island was used in these experiments because I wanted to perform experiments of sand that
  • 19.               19   was ooid—dominated. The ooid sands were placed in a large container and were sterilized via autoclaving. They were then treated red dye solution and deionized water for 10 seconds via moderate shaking in preparation for experiments. Approximately 12.5 g of bulk sand was placed into 10 clean, 200 mL plastic jars with 100mL of seawater and then put into Scilogex 180 orbital shaker and rocker. The seawater medium consisted of (in g/L of deionized water): 21.14 NaCl, 3.55 Na2SO4, 0.59 KCl, 0.17 NaHCO3, 9.59 MgCl2Ÿ6H2O, 1.34 CaCl2Ÿ2H2O, 0.03446 NaNO3, 0.00309 Na3PO4, 5 ml of trace element solution SL-10 without FeCl2, 1 mL of vitamin solution (SL-10 and vitamin solution recipes in DSMZ medium 141, Braunschweig, Germany: Catalogue of strains 1993). Information regarding the conditions of each jar can be found in Table 1. For trial 1, a total of 6 jars were placed under high wave conditions (220 rpm) for 6 days (Figure 6); 2 were subjected to low wave conditions (110 rpm) for 2.5 days; and 2 jars were subjected to no wave conditions (control). Half of the total jars were inoculated with about 3mL of cyanobacteria (all odd numbered jars). A second trial was conducted for a longer time period of approximately two months where 4 jars were placed under high wave conditions (220) and six were left untouched. Following the experiments, samples containing cyanobacteria were briefly exposed to a monolayer of bleach (pH 8.2) to remove any organic matter from the surface and were dried in preparation for Scan Electron Microscopy (SEM) analysis. In order to calculate the concentration of residue within the high energy containers, water was suction filtrated using a 20 mL cylinder and 0.22 µm Millepore membranes (Figure 7). Concentrations of residue in each water samples were calculated via filter weight data. Absorption spectroscopy was also performed on trial 1 samples; concentrations were calculated using filter weight data of H1 and H2 from trial 1. Absorbance values, calculations, and
  • 20.               20   calibration curves at different wavelengths constructed for H1 can be found in Appendix A. 3.5 Scan Electron Microscopy (SEM) In order to assess the degree of breakage and surficial abrasion of ooids under wave agitated conditions, surface texture of ooids were imaged before and after abrasion experiments at the Smith College Center for Microscopy and Imaging using a FEI Quanta 450 scanning electron microscope. Samples were mounted on stubs using a clear adhesive and carbon coated before analysis under a high vacuum. To obtain clear, high resolution photos, high voltage and spot size settings were 5kv and 3, respectively. Trial 1 Time Shaking (total) Speed RPM Cyanobacteria H1 6 days (All time) 220 Yes H2 6 days (All time) 220 No H3 2 days (1d on/2d off) 220 Yes H4 2 days (1d on/2d off) 220 No H5 8 hours (1 or 2 hour/day) 220 Yes H6 8 hours (1 or 2 hour/day) 220 No L1 6 days (All time) 110 Yes L2 6 days (All time) 110 No N1 6 days (All time) 0 Yes N2 6 days (All time) 0 No Trial 2 Time Shaking (total) Speed RPM Cyanobacteria H1 ~2 months 220 Yes H2 ~2 months 220 No H3 ~2 months 220 Yes H4 ~2 months 220 No H5 ~2 months 0 Yes H6 ~2 months 0 No H7 ~2 months 0 Yes H8 ~2 months 0 No H9 ~2 months 0 Yes H10 ~2 months 0 No Table 1: Description of conditions for trial 1 and trial 2. Odd numbered samples innoculated with 3mL of cyanobacteria.
  • 21.               21   Figure 6: Photo showing high wave conditions (at 220rpm) lab containers (H1—H4) placed in a shaker after approximately one hour after start time of experiment.
  • 22.               22   Figure 7: Suction filtration of residue through 0.22µm Millepore membrane filters. Water in the cylinder is very cloudy and residue is already settling down the filter.
  • 23.               23   4. Results 4.1 Petrography Thin sections of bulk sediments from Pigeon Creek tidal channel, San Salvador Island, Bahamas were made to analyze the dominant components of sand and to note the state of preservation of ooids. Loose sand photographs demonstrate examples of sites with a large number of skeletal fragments (Figure 8A), and one with fewer skeletal grains (Figure 8B). Petrographic analysis of bulk subtidal samples suggests that ooids are present throughout the tidal channel and are variable in abundance (Figure 9—11; Table 2). Samples collected from the southwest, deeper portion of the tidal channel (S2, S3) were composed of ~47—53% ooids. Along the rippled, barren seafloor (S5, S8, S9, S10) and near the outer seagrass margins (S6, S7), average ooid abundances were ~52—64.94% and ~63—67%, respectively. In the two rock samples collected north (S13R) and south (S16R) of the beach house, ooid abundance was slightly higher than in subtidal bulk sand samples (71—78% in S13, S16). Ooids comprised ~66—78% in beach samples collected near the rock outcrop at the Beach House (S11, S12, S14). Some of the micritized particles that were difficult to identify in thin section were labeled as “peloids,” which can represent skeletal fragments, micritized ooids, grapestones and algae (specifically Halimeda sp.) This may have impacted the calculated percentages of ooid abundance. Ooids were classified based on shape and the presence of concentric layers; borings and micritization throughout the outer layers of ooids were common in many samples. Petrographic photographs of all samples can be found in Appendix B.
  • 24.               24   A   B   Figure 8A—B: Photographs of loose sand showing high abundances of skeletal fragments in A) from site S1. Loose sand that displays sand that is dominated by peloid and ooids with minor skeletal fragments in B) from site S9 along the tidal channel. The scale bar is 500µm.
  • 25.               25   S6 S7 S8 S9 S15 S11 S3 62.12% Beach House S5S10 S13R S2 S12 S16R S14 S1 46.81% 53.14% 51.50%61.59% 57.68% 64.94% 67.29% 63.19% 52.23% 70.63% 79.51% 78.67% 65.67% 78.09% 200FT 23º 57’ 42” N 74º 29’17” W 23º 57’ 42” N 74º 29’17” W Figure 9: Aerial map (from Bing) showing sample sites and their corresponding ooid abundances. Brief field observations were also noted along the tidal channel.
  • 26.               Sediment Mounts Ooids (%) S1 62.12 S2 46.81 S3 53.14 S5 51.50 S6 63.19 S7 67.29 S8 64.94 S9 57.68 S10 63.57 S11 61.59 S12 78.67 S13 (Rock) 78.09 S14 65.67 S15 52.23 S16 (Rock) 70.63 Table 2: Percentage of ooids in sediment mounts (thin section). Percent of ooids was calculated by dividing number of ooids by total number of grains.
  • 27.               27   Figure 10: Photographs of sediment mounts S12 (1) and S12 (2), the site where ooids were most dominant. Scale size is 200µm. S12 Petrography (1) S12 Petrography (2)
  • 28.               28  Figure 11: Petrographic photographs of S2 (1) and S2 (2). This is an example of a sample where ooids were observed to be less dominant than in other samples. Scale size is 200µm. S2 Petrography (1) S2 Petrography (2)
  • 29.               29   4.2 Organic Geochemistry Geochemical analyses of sieved and bulk sand show that fatty acid methyl esters (FAME) were present and relatively abundant (Figure 12A—C). All samples contained saturated, normal (or straight chained) fatty acid methyl esters with chain lengths from C12 to C30, with n-C14, n- C16, and n-C18 as the most abundant compounds; abundances differed within each sample. In the bulk sample, n-C14 was the most abundant followed by n-C16 and n-C18, respectively. Dominance of fatty acid n-C16 followed by n-C14 and n-C18 is present in the 420—250µm sieve size sample (60s); in the 250—177µm sieve size sample (80s), n-C16 dominance is followed by n-C18 and n- C14. A pattern of even—over—odd carbon number preference is present, in relatively low abundances (<50%), in the normal FAMEs, and is evident in the bulk and 420—250µm sieve size samples. In essence, the pattern contains long-chain fatty acids (from C22 to C34) and reach a maximum at C22. In the 250—177µm sieved sample, it is difficult to distinguish this pattern, most likely due to contamination peaks marked by asterisks (marked by asterisk in Figure 12C). Branched FAME are present in moderate abundances (~25%—50%) in bulk and 420— 250 µm sieve samples, with the most common being C14—C17 iso- and anteiso- FAME. In the 250—177 µm sieve size sample, branched FAME C14-C16 are commonly present in relatively low abundances (<20%). All samples contained some trace of 10-methylhexadexcanoic acid (or 10-methyl-C16:0), a 17-Carbon FAME commonly associated with sulfate bacteria.
  • 30.               30   + Figure 12: Total ion chromatograms from geochemical analyses of fatty acid methyl esthers (FAME) using gas chromatography-mass spectrometry (GC-MS) in TLE of (A) unsieved bulk; (B) 420—250µm sieve size; (C) 250—177µm sieve size. The asterisk symbols (*) and (**) indicate unknown and plastic contamination, respectively.   A B C
  • 31.               31   4.3 Lab Experiments Erosion experiments were performed under a series of conditions. In trial 1, H1—H6 represented high wave conditions (at 220 rpm) for 6 days (H1—H2), 2 days (H3—H4), and 8 hours (H5—H6). Low wave conditions and the control were represented by L1—L2 and N1— N2. In trial 2, H1—H4 were conducted under high wave conditions and H5—H10 represented no wave conditions. Ooids that were subjected to high-energy conditions for 6 days and 2 months eroded. Because the ooids were dyed prior to the erosion experiments with 10mL red dye, water in all high—energy samples became cloudy and pink in color, progressing from dark pink (H1— H2 in trial 1; H1—H4 in trial 2) to moderate pink (H3—H4, trial 1) to faint pink (H5—H6, trial 1) over time. Pink water indicated residue (calcium carbonate) from the erosion of outer layers of the ooids, usually settling as a thin, fine—grained pink layer on top of the ooids after shaking. The highest residue concentrations were found in prolonged exposure samples (high energy) for both trials, ranging from 0.21 g/L to 0.69 g/L for samples shaken at 220 rpm for 2 months (H1—H4, Trial 2), with an averaged concentration of 0.37 g/L ± 0.02 to 0.40 g/L ± 0.10 for samples under the same conditions for 6 days (H1—H2, Trial 1), respectively (Figure 13). Samples under low-energy conditions in trial one had average residue concentrations similar to the control, ranging from -0.03 g/L ± 0.07 to 0.05 g/L ± 0.05. Such low concentrations, some of which appears to have varied negatively mostly due to experimental error, indicate that minimal to no residue was eroded throughout this experimental time period. Residue concentration data can be found in Appendix A.
  • 32.               32   Figure 13: Line graph of residue concentrations from filter weight data and absorption spectrometry (Trial 1 only). Residue concentrations calculated from filter weights in trial 1 were averaged.
  • 33.               33   Ooid surfaces before erosion, referred to here as “original,” showed a range of surficial structures in SEM images. These surfaces varied from smooth with little to no pits visible to low or moderate pitted surfaces (exposing endolithic boring channels) coupled with shallow pits (borings) around the ooid (Figure 10A—D). The most common ooid surface pre—erosion seemed to be smooth surfaces with small pits scattered and/or small borings and etchings. Infilling was observed in some of the surface pits, most likely by calcium carbonate. Ooids that were subjected to high wave conditions for 6 days had surfaces that were smooth with small to moderate pitting with small to large deep pits to very pitted and/or eroded with endolithic boring channels. Ooids that were agitated for 2 months looked similar to high wave conditions for 6 days: moderately pitted with small to large, deep pits to extremely pitted and/or eroded with endolithic boring channels (Figure 11 A—D). None of the ooids were found broken in half or extremely eroded. Ooids that were exposed to high wave energy conditions and had 3mL of cyanobacteria inoculated had surfaces ranging from: 1) smooth with very small pits or very small, localized erosional surfaces on the sides; to 2) pitted with small to medium pits (some deep) scattered around the ooid; and 3) very eroded and pitted surface exposing endolithic channels along with very deep pits (Figure 12A—D). Some moderate to heavily pitted and eroded surfaces, and the same was observed for ooids exposed to high wave energy for two months. Ooids that were not agitated for two months looked similar to original ones. Ooids inoculated with cyanobacteria, but not subjected to high wave conditions looked different than those in waves. In, SEM images reveal a thin layer of residue of cyanobacteria that colonized the surface of ooids (14A—D). These ooids often show endolithic borings that appear to be recent (e.g., not eroded or broken), but it is difficult to determine whether they are filled with cement or
  • 34.               34   not.   Figure 14A—D: Ooid surfaces before exposure to experiments had a variety of surfaces including (A) a smooth surface with some small to medium sized pits; (B) smooth surface with small pits; (C) some pitted surfaces with some small pits present (D) moderate pitting exposing endolithic borings alongside some small to medium pits. The red arrows indicate examples of medium sized pits; red circles indicate small sized pits; blue arrows indicate moderate pitting, exposing endolithic borings; black arrows indicate possible areas of infilling.   D A B C
  • 35.               35   Figure 15A—F: Ooid surfaces after high energy exposure for 6 days. These samples were also inoculated with 3mL of cyanobacteria. Ooid surfaces varied ranging from: smooth surfaces with (A) some small to medium sized pits and (B) small pits; moderately pitted surfaces with (C) small to medium sized pits and (D) medium sized pits that expose endolithic borings; highly pitted surfaces with (E) eroded surfaces coupled with small pits and (F) highly eroded surfaces exposing pits and endolithic borings. Red arrows indicate examples of deep, medium sized pits; red circles indicate small sized pits scattered around the surface; blue arrows indicate moderate pitting or eroded surfaces, exposing endolithic borings; black circles and arrows indicate areas of infilling.     D E C BA F
  • 36.               36     Figure 16A—F: Ooid surfaces after high energy exposure only for 6 days. Ooid surfaces varied ranging from: overall smooth surfaces with (A) very small pits (points or indents) or (B) no visible pits; small to moderate pitted surfaces with (C) deep, medium sized pits and (D) a bumpy surface with small pits and exposed endolithic borings; small pitted surfaces with (E) highly etched and bored surfaces coupled with small pits and (F) localized pitted and eroded surfaces exposing pits and endolithic borings. Red arrows indicate examples of moderately deep, medium to larger sized pits; red circles indicate small sized pits (some in the form of indents) scattered around the surface; blue arrows indicate moderate pitting or eroded surfaces (localized), exposing endolithic borings.   D E C BA F
  • 37.               37   Figure 17A—F: Ooid surfaces after high energy exposure for two months. These samples were also inoculated with 3mL of cyanobacteria. Ooid surfaces were similar to surfaces agitated for 6 days. Surfaces ranged from: very smooth surfaces with (A) no pits and (B) some indents that are hard to distinguish; moderately pitted surfaces with (C) deep, medium sized pits and (D) exposed endolithic boring; moderate to highly eroded or pitted surfaces with (E) eroded surfaces coupled with small to medium pits and (F) exposed pits and endolithic borings. Red arrows indicate examples of moderately deep, medium sized pits; red circles indicate small sized pits (some very small or in the form of indents) scattered around the surface; blue arrows indicate heavy pitting or eroded surfaces (both localized and throughout the surface),exposing endolithic borings; Black circles and arrows indicate eposed sufaces that may be infilled.   D E C BA F
  • 38.               38   Figure 18A—D: Ooid surfaces after two months with cyanobacteria and no wave activity. (A) An ooid surface covered with a thin cyanobacterial film. This film prevents interpretation of the ooid surface. (B) Endolithic borings and pits throughout the surface and covered by remnants of cyanobacteria; (C) surface with some pitted surfaces and some small pits present. Surface has some remnants of cyanobacteria (D) moderate pitting exposing endolithic borings and remnants of cyanobacteria. Black arrows indicate cyanobacteria remnants in the form of films or filaments; red arrows are examples of small pits on the surfaces; red circles indicate pitted surfaces (or eroded), exposing endolithic borings. Due to bacterial colonization, infilling is difficult to identify.   DC BA
  • 39.               39   5. Discussion 5.1 Petrography By sampling broadly around Pigeon Creek, we were able to determine that ooids are the most abundant in a single onshore sample (S12) followed by S10, and the least abundant around the deep, shelly portions of the tidal channel (S1—S3). This disparity in abundance in samples suggests that ooids are forming in a relatively small, localized area within the tidal channel and delta and are being transported onshore (near areas S11—S12). The discovery of ooids as dominant sand components in some parts of Pigeon Creek (S6—S10) suggest three factors that may be affecting the distribution of ooids here: 1) certain parts of the tidal channel are more conducive to modern ooid formation, specifically shallow portions of the tidal channel; 2) ooids that are actively forming along the channel are being transported to the beach via flood tides; and 3) a small portion of ooids are eroding into the tidal channel from several rock outcrops, and then transported throughout the tidal channel and back onto the beach. While all these factors can contribute to the presence of ooids here, continuous strong currents along the tidal channel create favorable conditions for ooid development. These currents allow ooids to occasionally suspend within the water column and also to roll along the rippled, barren seafloor to aid in ooid abrasion. Pigeon Creek is an important setting to understand because ooids are a component of sand, but never the dominant grain (<78%). This is analogous to many ancient settings where ooids are prevalent but not the only component of ancient carbonate rocks. Examining this setting has provided some constraints on the types of environments in which ooids form when they do not make up the bulk of the sand in the marine environment. Petrographic analysis of Pigeon Creek ooids revealed the presence of endolithic boring and micritization in many subtidal samples. These may relate to the presence and type of organic
  • 40.               40   matter in ooids that were extracted during biomarker analyses (Summons et al., 2013, this study). These ooids are petrographically similar to other Bahamian ooids (Summons et al., 2013; Glumac et al., 2012; Harris et al., 1979). Also, thin section analysis of Pigeon Creek sand revealed that skeletal grains and peloids, which include micritized skeletal fragments and algae, are most common along the tidal channel because they are most likely transported from the shelly region (south east corner). Beach rock contains abundant ooids (70—78%) and can be an additional, minor source of eroding ooids along the tidal channel. The age of these ooids was difficult to determine due to the absence of ooid age dates (radiocarbon dating), and their similarity in shape and surface. 5.2 Biomarkers Geochemical analyses of bulk and sieved sand revealed differences in their FAME. The n-C14 fatty acid was significantly higher in the bulk sample and 420—250 µm (60s) sieve samples than in the 250—177 µm (80s) sieve size samples. Possible reasons for these differences are: 1) there was a smaller size sample of 80s available in comparision to the other samples; or 2) a pattern associated with other bacteria that may be colonizing bulk samples and 60s sieve. Further work characterizing the abundant biomarkers in ooid—rich sand samples and sands dominated by other grains will help further constrain the relationship between specific microbial communities and ooids. Results from this study are similar to Holocene ooid biomarker data from other places in the Bahamas (e.g., Cat Island and Joulter’s Cay) and Australia (e.g., Shark Bay): characteristically long-chain normal fatty acids (FA) and a distinguishable even-over odd carbon number preference in concurrence with very small abundances of iso— and anteiso—FA
  • 41.               41   (Gillespie, 2013; Summons et al., 2013). These data suggest that certain kinds of bacterial groups may play a role in their formation. Specifically, the presence of 10-methyl-C16:0 strongly indicates a relationship between sulfate—reducing bacteria and ooids. Sulfate reducing bacteria have been proposed as promoters of calcium carbonate precipitation (Decho et al., 2005; Dupraz and Visscher, 2005; Summons et al., 2013; Edgecomb et al., 2013). Indicators of these bacteria are well established, in past and recent literature, as being a variety of fatty acids around the C12 to C19 range area (Taylor and Parkes, 1983; Dowling et al., 1986; Kuever et al., 2001). Specific types, such as Desulfobulbus, Desulfobacula, Desulfotignum, and Desulfobactor spp, have been associated with ooid samples because they possess iso—C15:0, anteiso—C15:0, and 10-methyl C16:0 fatty acids (Summons et al., 2013; Edgecomb et al., 2013). This previous work and current geochemical analyses of fatty acid distributions in ooids from this particular study suggest that sulfate reducing bacteria are present on ooid surfaces as well as in the water column. Although sulfate—reducing bacteria have been commonly associated within anaerobic environments, they have been previously found in well mixed environments around the Bahamas, suggesting their capacity to undergo sulfate reduction under oxic conditions (Canfield and Des Marais, 1991; Fournier et al., 2004; Diaz et al., 2013). Their presence in the shallow waters of Pigeon Creek Delta may indicate that they are increasing alkalinity by oxidating organic compounds (anaerobic respiration) in the local water column where ooids are located, and thus inducing higher rates of calcium carbonate precipitation. In addition to sulfate reducers, other bacteria that have been associated in various environments around the Bahamas are Alphaproteobacteria, Gammaproteobacteria, Acidobacteria, Actinobacteria/Bacteriodetes (Diaz et al., 2013; Summons et al., 2013; Edgecomb; 2013). Some of these bacteria are associated with those found in stromatolites and
  • 42.               42   thrombolites. Lipid biomarker analyses of bulk (unsieved) and sieved samples (with higher ooid abundances) have generated results similar to those found by Summons et al. (2013), supporting the notion that biological activity may have promoted localized ooid formation along the tidal channel. Importantly, this study focuses on an environment where ooids are actively forming, but are not the dominant constituent. Skeletal fragments, grapestones, calcareous rods, and peloids are also common in addition to ooids along Pigeon Creek Delta. Therefore, we now have insight into local processes fostering the formation of ooids in settings where ooids are not the dominant carbonate grain. Bacteriohopanepolyols (BHP) are a class of hopanoids primarily from bacterial membrane lipid components and found in sediments (Ourisson et al., 1979; Rohmer et al., 1984). All FAME samples analyzed contained 17β, 21β—bishomohopanoic acid (noted as an arrow in Figure 2), and some were of similar abundances (bulk and 60s) as in Summons et al., (2013). Although the sources of BHP are too diverse to make an interpretation of their source, this along with the FAME results (and its presence in other Bahamian ooid samples) suggests that the organic matter analyzed is bacterial in origin. 5.3 Experimental Erosional experiments under high wave energy conditions, with and without the presence of cyanobacteria, produce a range of erosional surfaces (Figure 4). Some of the faces include smooth, pristine surfaces with minimal visible damage; moderate surficial damage with or without deep scours and pits; and heavy surficial deterioration. These data enable further understanding of ooid formation and suggests that during high wave conditions, ooids are more likely to erode rather than accrete new layers. In a recent study of ooid erosion, samples that
  • 43.               43   were agitated for one week produced 0.3—0.4% of carbonate mud (Van Ee and Wanless, 2008). In this study, we found 0.21 g/L to 0.69 g/L of residue in samples shaken at 220 rpm for 2 months and an averaged residue concentration of 0.37 g/L ± 0.02. Results from this study further support the idea that ooid erosion contributes to carbonate mud production when ooids are exposed to high wave environments. The similarity of SEM images for ooids agitated for 6 days and 2 months suggests that ooids may be eroding quickly during short periods of agitation (i.e., during storms). As carbonate mud production occurs, uneven ooid layers are polished into more concentric layers, so the effects of long—term abrasion does not significantly alter ooid shapes or surfaces but rather acts as a “rounding” agent. This is important when considering the mechanics of ooid formation and its relationship with agitation. Endolithic borings and pits from cyanobacteria were commonly found throughout the erosional experiments, suggesting that they are actively boring and creating uneven surfaces during agitation periods. These uneven layers are then rounded and polished. Further experimental research should focus on understanding whether surficial borings promote the breakdown of ooid surfaces during agitation conditions. 6. Conclusions This project offers a multidisciplinary approach to help explain the distribution, occurrence and formation of ooids in modern settings like Pigeon Creek Delta by integrating field and thin section data with organic geochemical analyses and lab experiments. Petrographic analysis of subtidals samples taken from the tidal channel suggests ooids are likely both eroding locally and actively forming in a relatively small, localized area and transported along the delta. Our results suggest that S7 and S8 are the dominant regions of ooid production/accumulation in
  • 44.               44   Pigeon Creek Delta. Samples S7 and S8 are located along the rippled, barren floor and in the shallowest portions of the channel. This is especially evident with S8, a sample that was collected in the middle of the shallow portion. The prevalence of ooids in beach sand is similar to what was found on nearby Cat Island (Glumac et al., 2012), and suggests that ooids are actively forming in the seafloor area (wave ripples and sand wave area). Lipid biomarker results were similar to those found by Summons et al. (2013). These data along with experimental data suggests that microbes are colonizing ooids, but it is still uncertain whether they directly contribute to ooid formation. One factor that may be influencing ooid formation is the presence of sulfate—reducing bacteria in the water column or on ooid surfaces. These organisms may be increasing alkanity and promoting ooid formation locally. Further lipid biomarker studies on ooids in different environments are needed to further understand the role(s) that these particular microbes have on ooid formation. Experimental work indicates that during any period of high wave agitation, the outer layers of ooids are abrading, producing carbonate mud, and shaping ooids into rounded particles. This is supported by the absence of severely damaged ooids (e.g., ooids broken in half). Ooids that were exposed to cyanobacteria suggests that microbes are actively colonizing the ooids and leaving remnants of biofilm and organic matter around the ooids. Although it is still uncertain whether or not microbial communities are required for ooid formation, our work confirms a relationship that needs further exploration.
  • 45.               45   References Bathurst, R. G. C. (1975), Carbonate sediments and their diagenesis, 2nd Ed. Amsterda: Elsevier, 658 pp. Boardman, M. R. and C. Carney (1996), Pigeon Creek and Tidal Delta: A field trip guide: Bahamian Field Station, San Salvador, Bahamas, 8p. Bahamas, Field Guide. Broecker, W. S. and T. Takahashi (1966), Calcium carbonate precipitation on the Bahama Banks. Journal of Geophysical Research 71, 1575—1602. Carew, J. L. and J. E. Mylroie (1987), A refined geochronology for San Salvador Island, Bahamas, in Curran, H. A., ed., Proceedings of the Third Symposium on the Geology of the Bahamas: Ft. Lauderdale, Florida, CCFL Bahamian Field Station, 31—44. Carew, J. L. and J. E. Mylroie (1995), Depositional model and stratigraphy for the Quaternary geology of the Bahama islands, In Curran, H. A., and B. White. eds., Terrestrial and shallow marine geology of the Bahamas and Bermuda: Geological Society of America Special Paper 300, p. 5-31. Canfield, D.E., and D. J. Des Marais (1991), Aerobic sulfate reduction in microbial mats. Science 251, 1471—1473. Cloud, P. E., Jr (1962), Environment of calcium carbonate deposition west of Andros Island, Bahamas. U.S.Geological Survey Professional Paper 350, 1—138. Corsetti, F. A., Anderson, R. P., Bird, J. T., Meneske, M., Trower Stefurak, E. J., Petryshyn, V. A., Tripati, A., Stamps, B. W., Stevenson, B. S., and J. S. Spear (2013), Ooid formation in the Great Salt Lake, Utah: insights from clumped isotope paleothermometry and molecular biology. Geological Society of America Annual Meeting Abstracts with Programs. (Abstract). Curran, H. A. and B. White (1995), Bahamas geology in Curran, H. A. and B. White, eds., Terrestrial and shallow marine geology of the Bahamas and Bermuda: Geological Society of America, Special Paper 300, 1—3. Davies, P. J., Bubela, B., and J. Ferguson (1978), The formation of ooids. Sedimentology 25(5), 703—729. Diaz, M. R., Piggot, A. M., Eberli, G. P., and J. S. Klaus (2013), Bacterial community of ooilitic carbonate sedimets of the Bahamas Archipelago. Marine Ecology Progress Series, 485, 9-24.
  • 46.               46   Dowling, N. J. E., Widdel F., and D. C. White (1986), Phospholipid ester-linked fatty acid biomarkers of acetate-oxidizing sulphate-reducers and other sulphide-forming bacteria. Journal of General Microbiology 132, 1815—1825. Duguid, S. M., Kyser, T. K., James, N. P., and E. C. Rankey (2010), Microbes and ooids. Journal of Sedimentary Research 80, 236—251. Edgecomb, V. P., Bernhard, J. M., Beaudoin, D., Pruss, S., Welander, P. V., Schubotz, F., Mehay, S., Gillespie, A. L., and R. E. Summons (2013), Molecular indicators of microbial diversity in oolitic sands of Highborne Cay, Bahamas. Geobiology 11, 234— 251. Fabricus, F. (1977), Origin of marine oöids and grapestones. Contributions to sedimentology 7, 1—113. Flügel, E. (1982), Microfacies analysis of limestones. Springer-Verlag:Berlin, 633 pp. Flügel, E. (2004), Microfacies analysis of carbonate rocks. Springer-Verlag:Berlin, 976 pp. Folk R. L. and F. L. Lynch (2001), Organic matter, putatitve annobacteria and the formation of ooids and hardgrounds. Sedimentology 48, 215—229. Fournier, M., Dermounn, Z., Durand, M., and A. Dolla (2004). A new function of the Desulfovibrio vulgaris Hildenborough [Fe] hydrogenase int eh protection against oxygen stress. Journal of Biological Chemistry 273, 1787—1793. Kuever, J., Könnecke, M., Galushko, A., and O. Drzyzga (2001), Reclassification of Desculfobacterium phenolicum as Desulfobacula phenolica comb. nov. and description of strain SaxT as Desulfotignum balticium gen. nov., sp. Nov. International Journal of Systematic and Evolutionary Microbiology 51, 171-177. Garber, R. A., Friedman, G. M., andA. Nissenbaum (1981), Concentric aragonitic ooids from the Dead Sea. Journal of Sedimentary Research 51(2), 455-458. Gillespie, A. L (2013), Organic matter preserved in modern ooids from Shark Bay and the Bahamas. (Unpublished thesis). Department of Earth, Atmospheric, and Planetary Sciences, Massachusetts Institute of Technology. Cambridge, Massachusetts. Glumac, B., Curran, H. A., Motti, S. A., Wegner, M. M., and S. B. Pruss (2012), Distribution of oolitic sediment along a beach-to-offshore transect, Pigeon Cay, Cat Island, Bahamas: new insights into modern ooid formation, in Gamble, D. W. and P. Kindler, ed., Proceedings of the 15th Symposium on the Geology of the Bahamas and Other Carbonate Regions, Gerace Research Center, San Salvador, Bahamas, 71—81.
  • 47.               47   Harris, P. M., Halley R. B., and K.J. Lucas (1979), Endolith microborings and their presevation in Holocene-Pleistocene (Bahama-Florida) ooids. Geology 7, 216-220. Mitchell, S. W. (1986), Sedimentology of Pigeon Creek, San Salvador Island, Bahamas, in Curran, H. A., ed., Proceedings of the 3rd Symposium on the Geology of the Bahamas, CCFL Bahamian Field Station, San Salvador, Bahamas, 215—230. Morse, J. W. and F. T. Mackenzie (1990), Geochemistry of sedimentary carbonates. Elsivier: Amsterdam, 707 pp. Mylroie, J. E., Carew, J. L., Curran, H. A., Freile, D., Sealey, N. E., and V. J. Voegeli (2006), Geology of Cat Island, Bahamas: A Field Trip Guide. 13th Symposium on the geology of the Bahamas and other carbonate regions, San Salvador, Bahamas. Gerace Research Centre, 44 pp. Ourisson, G., Rohmer, M., and K. Poralla (1987), Prokaryotic hopanoids and other polytriterpenoid sterol surrogates. Annual Reviews of Microbiology 41, 301–333 Reitner, J., Arp, G., Thiel, V., Gautret, P., and U. Galling (1997), Organic matter in Great Salt Lake ooids (Utah, USA): first approach to a formation via organic matrices. Facies 36, 210—219. Richter, D. K. (1983), Calcareous ooids: a synopsis. In Coated Grains (ed. Peryt TM), Springer, Heidelberg, pp. 71—99. Rodgers, J. (1954), Terminology of limestone and related rocks: an interim report. Journal of Sedimentary Petrology 24, 225—234. Rohmer, M., Bouvier-Nave, P., and G. Ourisson (1984), Distribution of hopanoid triterpenes in prokaryotes. Journal of General Microbiology 130, 1137-1150. Sandberg, P. A. (1975), New interpretations of Great Salt Lake ooids and of ancient nonskeletal carbonate mineralogy. Sedimentology 22, 497—537. Suess, E. and D. Fütterer (1972), Aragonitic oöids: experimental precipitation from seawater in the presence of humic acid. Sedimentology 19, 939—943. Summons, R. E., Bird, L. R., Gillespie, A. L., Pruss, S. B., Roberts, M., and A. L. Sessions (2013),Lipid biomarkers in ooids from different locations and ages: evidence for a common bacterial flora. Geobiology 11, 420—436. Taylor, J. and R. J Parkes (1983), The cellular fatty acids of the sulphate—reducing bacteria, Desulfovibrio desulfricans. Journal of General Microbiology 129, 3303—3309. Thalman, K. L. and J. W. Teeter (1982), A Pleistocene lagoon and its modern analogue, San Salvador, Bahamas, in Gerace, D. T., ed., Proceedings, First Symposium on the Geology
  • 48.               48   of the Bahamas: Miami, Florida, CCFL Bahamian Field Station, 13—21. Trower, E. J. and J. P. Grotzinger (2010), Sedimentology, diagenesis, and stratigraphic occurrence of giant ooids in the Ediacaran Rainstorm Member, Johnnie Formation, Death valley Region, California. Precambrian Research 180, 113—124. Van Ee, N. J. and H.R. Wanless (2008), Ooids and grapestone—A significant source of mud on Caicos Platform, in SEPM Core Workshop 22: Developing Models and Analogs for Isolated Platforms—Holocene and Pleistocene Carbonates of Caicos Platform, British West Indies, eds. Morgan, W. A. and P. M. Harris. P. 121-125. Weyl, P. K. (1967), The solution behaviour of carbonate materials in seawater. Studies Tropical Oceanography University of Miami 5, 178—228.        
  • 49. Wavelength 400nm H1 H2 H3 H4 H5 H6 L1 L2 N1 N2 Seawater DI Water 100% 0.399 0.577 0.098 0.092 0.118 0.11 0.063 0.054 0.06 0.098 0.044 0.043 50% 0.208 0.162 0.065 0.071 0.07 0.075 0.052 0.052 0.048 0.053 0.043 0.042 25% 0.126 0.094 0.061 0.06 0.067 0.07 0.05 0.052 0.048 0.051 0.042 0.048 12.50% 0.074 0.058 0.048 0.054 0.055 0.052 0.047 0.053 0.064 0.069 0.046 0.042 6.25% 0.059 0.05 0.047 0.046 0.048 0.046 0.052 0.049 0.051 0.045 0.053 0.048 3.13% 0.048 0.047 0.047 0.044 0.046 0.046 0.045 0.049 0.045 0.045 0.05 0.046 1.56% 0.046 0.05 0.045 0.048 0.044 0.046 0.047 0.044 0.043 0.059 0.048 0.043 0.78% 0.048 0.044 0.044 0.044 0.047 0.041 0.044 0.057 0.037 0.043 0.043 0.046 Wavelength 450nm H1 H2 H3 H4 H5 H6 L1 L2 N1 N2 Seawater DI Water 100% 0.344 0.494 0.09 0.084 0.109 0.098 0.057 0.05 0.057 0.087 0.039 0.038 50% 0.18 0.141 0.059 0.065 0.064 0.068 0.048 0.046 0.045 0.048 0.038 0.038 25% 0.108 0.083 0.055 0.054 0.061 0.063 0.046 0.048 0.043 0.046 0.038 0.043 12.50% 0.065 0.051 0.043 0.047 0.049 0.048 0.042 0.047 0.058 0.063 0.041 0.037 6.25% 0.054 0.045 0.042 0.041 0.043 0.04 0.046 0.044 0.046 0.04 0.047 0.042 3.13% 0.043 0.042 0.042 0.04 0.04 0.041 0.039 0.044 0.041 0.04 0.045 0.042 1.56% 0.041 0.045 0.04 0.044 0.039 0.04 0.042 0.04 0.039 0.054 0.043 0.038 0.78% 0.043 0.038 0.039 0.041 0.041 0.037 0.038 0.051 0.034 0.039 0.04 0.041 Wavelength 500nm H1 H2 H3 H4 H5 H6 L1 L2 N1 N2 Seawater DI Water 100% 0.316 0.431 0.093 0.086 0.109 0.099 0.062 0.054 0.062 0.083 0.038 0.036 50% 0.167 0.126 0.059 0.063 0.066 0.068 0.048 0.048 0.047 0.05 0.037 0.036 25% 0.101 0.078 0.055 0.052 0.06 0.062 0.045 0.048 0.043 0.044 0.036 0.041 12.50% 0.062 0.049 0.042 0.046 0.047 0.045 0.04 0.046 0.057 0.062 0.04 0.036 6.25% 0.049 0.042 0.04 0.039 0.041 0.04 0.045 0.042 0.045 0.04 0.046 0.044 3.13% 0.04 0.04 0.041 0.037 0.038 0.04 0.037 0.042 0.038 0.038 0.043 0.04 1.56% 0.039 0.042 0.038 0.04 0.037 0.039 0.039 0.039 0.036 0.052 0.041 0.037 0.78% 0.042 0.038 0.038 0.039 0.041 0.037 0.036 0.048 0.033 0.037 0.037 0.04 Appendix A— Absorption values for trial 1 samples at 400nm , 450nm, 500nm, 550nm, and 650nm.  
  • 50.               50   Wave Length 550nm H1 H2 H3 H4 H5 H6 L1 L2 N1 N2 Seawater DI Water 100% 0.285 0.388 0.084 0.076 0.100 0.086 0.056 0.048 0.054 0.071 0.037 0.036 50% 0.151 0.118 0.054 0.06 0.060 0.061 0.044 0.044 0.042 0.045 0.036 0.035 25% 0.092 0.072 0.052 0.048 0.057 0.058 0.042 0.045 0.041 0.041 0.036 0.042 12.50% 0.058 0.047 0.041 0.045 0.046 0.044 0.04 0.045 0.054 0.059 0.039 0.035 6.25% 0.049 0.042 0.04 0.039 0.042 0.038 0.044 0.041 0.044 0.038 0.045 0.041 3.13% 0.039 0.039 0.039 0.04 0.039 0.038 0.037 0.04 0.038 0.037 0.042 0.039 1.56% 0.037 0.042 0.037 0.039 0.038 0.037 0.039 0.037 0.035 0.053 0.04 0.036 0.78% 0.041 0.037 0.038 0.037 0.040 0.036 0.037 0.048 0.032 0.037 0.036 0.04 Wave Length 650nm H1 H2 H3 H4 H5 H6 L1 L2 N1 N2 Seawater DI Water 100% 0.231 0.301 0.071 0.063 0.083 0.071 0.048 0.04 0.044 0.06 0.037 0.035 50% 0.126 0.096 0.049 0.052 0.051 0.052 0.041 0.041 0.038 0.04 0.036 0.034 25% 0.08 0.065 0.048 0.046 0.051 0.052 0.04 0.043 0.039 0.039 0.035 0.041 12.50% 0.054 0.043 0.038 0.04 0.042 0.041 0.037 0.042 0.053 0.058 0.038 0.035 6.25% 0.046 0.038 0.037 0.036 0.038 0.037 0.042 0.039 0.042 0.036 0.044 0.04 3.13% 0.037 0.039 0.039 0.038 0.036 0.038 0.035 0.04 0.037 0.036 0.041 0.038 1.56% 0.037 0.039 0.037 0.04 0.037 0.036 0.038 0.034 0.034 0.051 0.039 0.036 0.78% 0.04 0.035 0.038 0.036 0.038 0.035 0.037 0.047 0.031 0.037 0.038 0.039
  • 51.               51   Known Concentration of H1 (g/L) 400 nm 450 nm 500 nm 550 nm 650 nm 0.3800 0.399 0.344 0.316 0.285 0.231 0.1900 0.208 0.18 0.167 0.151 0.126 0.0950 0.126 0.108 0.101 0.092 0.08 0.0475 0.074 0.065 0.062 0.058 0.054 0.0238 0.059 0.054 0.049 0.049 0.046 0.0119 0.048 0.043 0.04 0.039 0.037 0.0059 0.046 0.041 0.039 0.037 0.037 0.0030 0.048 0.043 0.042 0.041 0.04 Appendix A— Data used to construct calibration curves for H1.  
  • 52. Appendix A— Graph of calibration curves constructed.  
  • 53. 53 Trial 1 Trial 2 Absorption (g/L) Filter 10mL (g/L) Filter Various (g/L) Filter 100mL (g/L) H1 0.43 0.380 0.356 0.208 H2 0.59 0.470 0.404 0.69 H3 0.13 0.010 0.107 0.97 H4 0.12 0.050 0.140 0.36 H5 0.15 0.017 0.125 H6 0.13 -0.070 0.088 Appendix A— Table describing all residue data obtained from Trial 1 and 2.  
  • 54. 54 APPENDIX B—All petrographic slides, labeled. S1 Petrography (1) S1 Petrography (2)
  • 55. 55 S2 Petrography (1) S2 Petrography (2)
  • 56. 56 S3 Petrography (2) S3 Petrography (1)
  • 57. 57 S5 Petrography (1) S5 Petrography (2)
  • 58. 58 S6 Petrography (2) S6 Petrography (1)
  • 59. 59 S7 Petrography (2) S7 Petrography (1)
  • 60. 60 S8 Petrography (1) S8 Petrography (1)
  • 61. 61 S9 Petrography (2) S9 Petrography (1)
  • 62. 62 S10 Petrography (1) S10 Petrography (2)
  • 63. 63 S11 Petrography (1) S11 Petrography (2)
  • 64. 64 S12 Petrography (1) S12 Petrography (2)
  • 65. 65 S13 Rock Petrography (1) S13 Rock Petrography (2)
  • 66. 66 S14 Petrography (1) S14 Petrography (2)
  • 67. 67 S15 Petrography (1) S15 Petrography (2)
  • 68.         S16 Rock Petrography (1) S16 Rock Petrography (2)