1. 66 Electrical Power Transmission System Engineering
2.9.4 Overhead Ground Wires
OHGWs are also called the shield wires. They are the wires that are installed above the phase con-
ductors (or wires). They are used to protect the line from lightning and to even out the ground poten-
tial and are sometimes even used for low-voltage (LV) communication. The OHGWs do not conduct
the load current, but they very rapidly conduct the very heavy current of a lightning strike to the
ground, through their many grounded connections. Every transmission structure is all grounded
and the OHGW is grounded at every structure (whether it is a pole or tower).
High-strength or extra-strength galvanized steel wires are used. The allowable sizes for the high-
strength wires are 3/8 and 7/16 in., while the allowable sizes for the extra-strength wires are 5/26,
3/8, and 7/16 in. The sags of the OHGWs must be the same as the sags of the phase conductors.
2.9.5 Conductor Tension
The conductor tension of a transmission line may vary between 10% and 60% or even more of its
rated conductor strength. This is due to change in line loading and temperature. Normal tensions
may be more important for determination of the life of the conductor of a line than higher tensions
that do not occur frequently. The proper conductor tensions are given in the NESC based on ice and
wind loadings in the loading districts of heavy, medium, and light loading.
2.10 Insulators
2.10.1 Types of Insulators
An insulator is a material that prevents the flow of an electric current and can be used to sup-
port electrical conductors. The function of an insulator is to provide for the necessary clearances
between the line conductors, between conductors and ground, and between conductors and the pole
or tower. Insulators are made of porcelain, glass, and fiberglass treated with epoxy resins. However,
porcelain is still the most common material used for insulators.
The basic types of insulators include pin-type insulators, suspension insulators, and strain
insulators. The pin insulator gets its name from the fact that it is supported on a pin. The pin
holds the insulator, and the insulator has the conductor tied to it. They may be made in one piece
for voltages below 23 kV, in two pieces for voltages from 23 to 46 kV, in three pieces for voltages
from 46 to 69 kV, and in four pieces for voltages from 69 to 88 kV. Pin insulators are seldom
used on transmission lines having voltages above 44 kV, although some 88 kV lines using pin
insulators are in operation. The glass pin insulator is mainly used on LV circuits. The porcelain
pin insulator is used on secondary mains and services, as well as on primary mains, feeders, and
transmission lines.
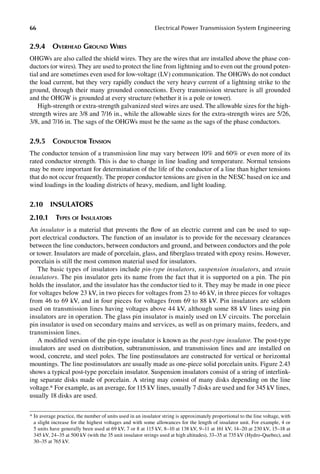
A modified version of the pin-type insulator is known as the post-type insulator. The post-type
insulators are used on distribution, subtransmission, and transmission lines and are installed on
wood, concrete, and steel poles. The line postinsulators are constructed for vertical or horizontal
mountings. The line postinsulators are usually made as one-piece solid porcelain units. Figure 2.43
shows a typical post-type porcelain insulator. Suspension insulators consist of a string of interlink-
ing separate disks made of porcelain. A string may consist of many disks depending on the line
voltage.* For example, as an average, for 115 kV lines, usually 7 disks are used and for 345 kV lines,
usually 18 disks are used.
* In average practice, the number of units used in an insulator string is approximately proportional to the line voltage, with
a slight increase for the highest voltages and with some allowances for the length of insulator unit. For example, 4 or
5 units have generally been used at 69 kV, 7 or 8 at 115 kV, 8–10 at 138 kV, 9–11 at 161 kV, 14–20 at 230 kV, 15–18 at
345 kV, 24–35 at 500 kV (with the 35 unit insulator strings used at high altitudes), 33–35 at 735 kV (Hydro-Quebec), and
30–35 at 765 kV.
2. 67
Transmission Line Structures and Equipment
The suspension insulator, as its name implies, is suspended from the crossarm (or pole or tower)
and has the line conductor fastened to lower end. When there is a dead end of the line, or there is
corner or a sharp curve, or the line crosses a river, etc., then the line will withstand great strain. The
assembly of suspension units arranged to dead-end the conductor of a structure is called a dead-end,
or strain, insulator.
In such an arrangement, suspension insulators are used as strain insulators. The dead-end string
is usually protected against damage from arcs by using one to three additional units and installing
arcing horns or rings, as shown in Figure 2.44. Such devices are designed to ensure that an arc
(e.g., due to lightning impulses) will hold free of insulator string.
The arcing horns protect the insulator string by providing a shorter path for the arc, as shown
in Figure 2.44a. Contrarily, the effectiveness of the arcing ring (or grading shield), shown in
Figure 2.44b, is due to its tendency to equalize the voltage gradient over the insulator, causing a
more uniform field.
Thus, the protection of the insulator is not dependent on simply providing a shorter arcing path,
as is the case with horns. Figure 2.44c shows a control ring developed by The Ohio Brass Company
that can be used to control the voltage stress at the line end of the insulator strings.
It has been shown that their use can also reduce the corona formation on the line hardware. Control
rings are used on single-conductor HV transmission lines operating above 250 kV. Transmission
lines with bundled conductors do not require the use of arcing horns and rings nor control rings,
provided that the bundle is not made of two conductors one above the other.
2.10.2 Testing of Insulators
The operating performance of a transmission line depends largely on the insulation. Experience
has shown that for a satisfactory operation, the dry flashover operating voltage of the assembled
(a)
12 in.
5°
14 in.
25 in.
27 5
8
in.
5°
12 in.
(b)
14 in.
27 5
8
in.
22 3
8
in.
Figure 2.43 Typical (side) post-type insulators used in (a) 69 kV and (b) 138 kV.
(a) (b) (c)
Figure 2.44 Devices used to protect insulator strings: (a) suspension string with arcing horns, (b) suspen-
sion string with grading shields (or arcing rings), and (c) suspension string with control ring. (Courtesy of The
Ohio Brass Company.)
3. 68 Electrical Power Transmission System Engineering
insulator must be equal to three to five times the nominal operating voltage and its leakage path
must be about twice the shortest air gap distance. Insulators used on OH lines are subject to
tests that can generally be classified as (1) design tests, (2) performance tests, and (3) routine
tests. The design tests include dry flashover test, pollution flashover test, wet flashover test, and
impulse test.
The flashover voltage is defined as the voltage at which the insulator surface breaks down
(by ionization of the air surrounding the insulator), allowing current to flow on the outside of
the insulator between the conductor and the crossarm. Whether or not an insulator breaks down
depends not only on the magnitude of the applied voltage but also on the rate at which the volt-
age increases.
Since insulations have to withstand steep-fronted lightning and switching surges when they are
in use, their design must provide the flashover voltage* on a steep-fronted impulse waveform that is
greater than that on a normal system waveform. The ratio of these voltages is defined as the impulse
ratio. Hence,
Impulse ratio
impulse flashover voltage
power frequency flas
=
h
hover voltage
(2.3)
Table 2.4 gives flashover characteristics of suspension insulator strings and air gaps [10]. The
performance tests include puncture tests, mechanical test, temperature test, porosity test, and elec-
tromechanical test (for suspension insulators only). The event that takes place, when the dielectric
of the insulator breaks down and allows current to flow inside the insulator between the conductor
and the crossarm, is called the puncture.
Therefore, the design must facilitate the occurrence of flashover at a voltage that is lower than the
voltage for puncture. An insulator may survive flashover without damage but must be replaced when
punctured. The test of the glaze on porcelain insulators is called the porosity test. The routine tests
include proof test, corrosion test, and HV test (for pin insulators only).†
2.10.3 Voltage Distribution over a String of Suspension Insulators
Figure 2.45 shows the voltage distribution along the surface of a single clean insulator disk (known
as the cap-and-pin insulator unit) used in suspension insulators. Note that the highest voltage gra-
dient takes place close to the cap and pin (which are made of metal), whereas much lower voltage
gradients take place along most of the remaining surfaces. The underside (i.e., the inner skirt) of the
insulator has been given the shape, as shown in Figure 2.45, to minimize the effects of moisture and
contamination and to provide the longest path possible for the leakage currents that might flow on
the surface of the insulator.
In the figure, the voltage drop between the cap and the pin has been taken as 100% of the total
voltage. Approximately, 24% of this voltage is distributed along the surface of the insulator from the
cap to point 1 and only 6% from point 1 to point 9. The remaining 70% of this voltage is distributed
between point 9 and the pin.
The main problem with suspension insulators having a string of identical insulator disks is the
nonuniform distribution voltage over the string. Each insulator disk with its hardware (i.e., cap and pin)
constitutes a capacitor, the hardware acting as the plates or electrodes, and the porcelain as the
* This phenomenon is studied in the laboratory by subjecting insulators to voltage impulses by means of a lightning
generator.
† For further information, see the ANSI standard C29.1–C29.9.
4. 69
Transmission Line Structures and Equipment
dielectric. Figure 2.46 shows the typical voltage distribution on the surfaces of three clean cap-and-
pin insulator units connected in series [10]. The figure clearly illustrates that when several units are
connected in series, (1) the voltage on each insulator over the string is not the same, (2) the location
of the unit within the insulator string dictates the voltage distribution, and (3) the maximum voltage
gradient takes place at the (pin of the) insulator unit nearest to the line conductor.
As shown in Figure 2.47, when several insulator units are placed in series, two sets of capaci-
tances take place: the series capacitances Ci (i.e., the capacitance of each insulator unit) and the
shunt capacitances to ground, C2. Note that all the charging current I for the series and shunt
capacitances flows through the first (with respect to the conductor) of the series capacitances C1.
The I1 portion of this current flows through the first shunt capacitance C2, leaving the remaining I1
TABLE 2.4
Flashover Characteristics of Suspension Insulator Strings and Air Gaps
Impulse Air Gap
Impulse Flashover
(Positive Critical), kV
Number of
Insulator Unitsa
Wet 60 Hz
Flashover, kV
Wet 60 Hz Air Gap
in. mm mm in.
8 203 150 1 50 254 10
14 356 255 2 90 305 12
21 533 355 3 130 406 16
26 660 440 4 170 508 20
32 813 525 5 215 660 26
38 965 610 6 255 762 30
43 1092 695 7 295 889 35
49 1245 780 8 335 991 39
55 1397 860 9 375 111 44
60 1524 945 10 415 1245 49
66 1676 1025 11 455 1346 53
71 1803 1105 12 490 1473 58
77 1956 1185 13 525 1575 62
82 2083 1265 14 565 1676 66
88 2235 1345 15 600 1778 70
93 2362 1425 16 630 1880 74
99 2515 1505 17 660 1981 78
104 2642 1585 18 690 2083 82
110 2794 1665 19 720 2183 86
115 2921 1745 20 750 2286 90
121 3073 1825 21 780 2388 94
126 3200 1905 22 810 2464 97
132 3353 1985 23 840 2565 101
137 3480 2065 24 870 2692 106
143 3632 2145 25 900 2794 110
148 3759 2225 26 930 2921 115
154 3912 2305 27 960 3023 119
159 4039 2385 28 990 3124 123
165 4191 2465 29 1020 3251 128
171 4343 2550 30 1050 3353 132
Source: Edison Electric Institute, EHV Transmission Line Reference Book, EEI, New York, 1968.
a Insulator units are 146 × 254 mm (5¾ × 10 in.) or 146 × 267 mm (5¾ ×10½ in.).
5. 70 Electrical Power Transmission System Engineering
portion of the current to flow through the second series capacitance, and so on. The diminishing
current flow through the series capacitances C1 results in a diminishing voltage (drop) distribution
through them from conductor end to ground end (i.e., crossarm), as illustrated in Figure 2.47. Thus,
V5 > V4 > V3 > V2 > V1
In summary, the voltage distribution over a string of identical suspension insulator units is not
uniform due to the capacitances formed in the air between each cap/pin junction and the grounded
(metal) tower.
However, other air capacitances exist between metal parts at different potentials. For example,
there are air capacitances between the cap/pin junction of each unit and the line conductor.
100
80
60
40
20
0
0 2 4 6 8 10 12
10
9
8
7
6
5
4
3
2
1
10
9
8
7
6
5
4
3 2 1
Tensión a tierra (porcentaje del total)
Tensión
a
tierra
(porcentaje
del
total)
Figure 2.45 Voltage distribution along the surface of single clean cap-and-pin suspension insulator.
10
9
8
Second
unit
First unit
Third
unit
1 2 3 4 5 6 7 8 9
10
10
9
8
7
6
5
4
3
2
1
10
9
8
7
6
5
4
3
2
1
0
0
20
40
60
80
100
Tensión
a
tierra
(porcentaje
del
total)
4 8 12 16 20 24 28 32 36
Medido desde la tapa conectada a tierra (pulg.)
7
6
5
4
3 2 1
Figure 2
.46 A typical voltage distribution on surfaces of three clean cap-and-pin suspension insulator
units in series.
6. 71
Transmission Line Structures and Equipment
Figure 2.48 shows the resulting equivalent circuit for the voltage distribution along a clean eight-
unit insulator string. The voltage distribution on such a string can be expressed as
V
V
n
C
C
k
C
C
k n
C
C
n
k
n
= + ( )+
β β
β β − β
2
2
1
3
1
3
1
sinh
sinh sinh sinh (2.4)
where
Vk is the voltage across k units from ground end
Vn is the voltage across n units (i.e., applied line-to-ground voltage in volts)
β = =
+
aconstant
C C
2 3
1 2
2
/
(2.5)
C1 is the capacitance between cap and pin of each unit
C2 is the capacitance of one unit to ground
C3 is the capacitance of one unit to line conductor
The capacitance C3 is usually very small, and therefore, its effect to the voltage distribution can be
neglected. Hence, Equation 2.4 can be expressed as
V V
k
n
k n
=
sinh
sinh
α
α
(2.6)
where
α = =
a constant
C
C
2
1
1 2
/
(2.7)
cruceta
4I1
I–4I1
I–3I1
I–2I1
I–I1
I
C1
C1
I1
C2
I1 C1
C2
I1 C1
C2
I1
C1
Conductor
C2
V1
V2
V3
V4
V5
V
1
2
3
4
5
V5 V4 V3 V2 V1
Tower
V
Figure 2.47 Voltage distribution among suspension insulator units.
7. 72 Electrical Power Transmission System Engineering
Figure 2.49 shows how the voltage changes along the eight-unit string of insulators when the ratio
C2/C1 is about 1/12 and the ratio C3/C1 is about zero (i.e., C3 = 0). However, a calculation based on
Equation 2.33 gives almost the same result. The ratio C2/C1 is usually somewhere between 0.1 and 0.2.
Furthermore, there is also the air capacitance that exists between the conductor and the tower.
But it has no effect on the voltage distribution over the insulator string, and therefore, it can be
neglected. This method of calculating the voltage distribution across the string is based on the
assumption that the insulator units involved are clean and dry, and thus, they act as a purely capaci-
tive voltage divider. In reality, however, the insulator units may not be clean or dry.
C1
C3
C1
C3
C3
C1
C2
C2
C1
C3
C1
C1
C3
C2
C3
C2
C1
C1
C3
C2
C2
C2
1
2
3
k
n
Conductor
cruceta
Torre
Vn = V
Vk
Figure 2
.48 An equivalent circuit for voltage distribution along clean eight-unit insulator string. (Adopted
from Edison Electric Institute, EHV Transmission Line Reference Book, EEI, New York, 1968.)
8. 73
Transmission Line Structures and Equipment
Thus, in the equivalent circuit of the insulator string, each capacitance C1 should be shunted
by a resistance R representing the leakage resistance. Such resistance depends on the presence of
contamination (i.e., pollution) on the insulator surfaces and is considerably modified by rain and
fog. If, however, the units are badly contaminated, the surface leakage (resistance) currents could be
greater than the capacitance currents, and the extent of the contamination could vary from unit to
unit, causing an unpredictable voltage distribution.
It is also interesting to note that if the insulator unit nearest to the line conductor is electrically
stressed to its safe operating value, then all the other units are electrically understressed, and con-
sequently, the insulation string as a whole is being inefficiently used. The string efficiency (in per
units) for an insulator string made of n series units can be defined as
String efficiency
voltage across string
voltage across unit
=
n adjacent to line conductor
( )
(
2.8)
If the unit adjacent to the line conductor is about to flashover, then the whole string is about to flash-
over. Here, the string efficiency can be reexpressed as
String efficiency
flashover voltage of string
flashover vol
=
n t
tage across of one unit
( )
(2.9)
Note that the string efficiency decreases as the number of units increases.
The methods to improve the string efficiency (grading) include the following:
1. By grading the insulators so that the top unit has the minimum series capacitances C1
whereas the bottom unit has the maximum capacitance. This may be done by using differ-
ent sizes of disks and hardware or by putting metal caps on the disks or by a combination
of both methods.* But this is a rarely used method since it would involve stocking spares of
different types of units, which is contrary to the present practice of the utilities to standard-
ize on as few types as possible.
* Proposed by Peek [11,12].
(C2/C1) = 0.083
100
80
60
40
20
0
0 1 2 3
Distribución ideal
Distribución real
4
Número de unidades
Voltaje
(porcentaje
del
total)
5 6 7 8
(C3/C1) = 0
~
~
Figure 2.49 Voltage distribution along a clean eight-unit cap-and-pin insulator string.
9. 74 Electrical Power Transmission System Engineering
2. By installing a large circular or oval grading shield ring (i.e., an arcing ring) at the line end of
the insulator string [10]. This method introduces a capacitance C3, as shown in Figure 2.48,
from the ring to the insulator hardware to neutralize the capacitance C2 from the hardware to
the tower. This method substantially improves the string efficiency. However, it is not usually
possible in practice to achieve completely uniform voltage distribution by using the gradient
shield, especially if the string has a large number of units.
3. By reducing the air (shunt) capacitances C3, between each unit and the tower (i.e., the
ground), and by increasing the length of the crossarms. However, this method is restricted
in practice due to the reduction on crossarm rigidity and the increase in tower cost.
4. By using a semiconducting (or stabilizing) high-resistance glaze on the insulator units to
achieve a resistor voltage divider effect. This method is based on the fact that the string
efficiency increases due to the increase in surface leakage resistance when the units are
wet. Thus, the leakage resistance current becomes the same for all the units, and the volt-
age distribution improves since it does not depend on the capacitance currents only. This
method is restricted by the risk of thermal instability.
2.10.4 Insulator Flashover due to Contamination
An insulator must be capable of enduring extreme sudden temperature changes such as ice, sleet,
and rain as well as environmental contaminants such as smoke, dust, salt, fogs, saltwater sprays, and
chemical fumes without deterioration from chemical action, breakage from mechanical stresses, or
electric failure. Further, the insulating material must be thick enough to resist puncture by the com-
bined working voltage of the line, and any probable transient whose time lag to spark over is great.
If this thickness is greater than the desirable amount, then two or more pieces are used to achieve
the proper thickness.
The thickness of a porcelain part must be so related to the distance around it that it will flashover
before it will puncture. The ratio of puncture strength to flashover voltage is called the safety factor
of the part or of the insulator against puncture. This ratio should be high enough to provide suf-
ficient protection for the insulator from puncture by the transients.
The insulating materials mainly used for the line insulators are (1) wet-process porcelain, (2) dry-
process porcelain, and (3) glass. The wet-process porcelain is used much more than dry porcelain.
One of the reasons for this is that wet porcelain has greater resistance to impact and is practically
incapable of being penetrated by moisture without glazing, whereas dry porcelain is not.
However, in general, dry-process porcelain has somewhat higher crushing strength. Dry-process
porcelain is only used for the lowest voltage lines. As a result of recent development in the tech-
nology of glass manufacturing, the glass insulators that can be very tough and have a low internal
resistance can be produced. Because of this, the usage of glass insulators is increasing.
In order to select insulators properly for a given OH line design, not only the aforementioned fac-
tors but also the geographic location of the line needs to be considered. For example, the OH lines
that will be built along the seashore, especially in California, will be subjected to winds blowing
in from the ocean, which carry a fine salt vapor that deposits salt crystals on the windward side of
the insulator.
On the other hand, if the line is built in areas where rain is seasonal, the insulator surface leak-
age resistance may become so low during the dry seasons that insulators flashover without warning.
Another example is that if the OH line is going to be built near gravel pits, cement mills, and refiner-
ies, its insulators may become so contaminated that extra insulation is required.
Contamination flashover on transmission systems is initiated by airborne particles deposited
on the insulators. These particles may be of natural origin or they may be generated by pollution
that is mostly a result of industrial, agricultural, or construction activities. When line insulators
are contaminated, many insulator flashovers occur during light fogs unless arcing rings protect the
insulators or special fog-type insulators are used.
10. 75
Transmission Line Structures and Equipment
Table 2.5 lists the types of contaminants causing contamination flashover [1]. The mixed con-
tamination condition is the most common caused by the combination of industrial pollution and
sea salt or by the combination of several industrial pollutions. Table 2.5 also presents the prevailing
weather conditions at the time of flashover. Fog, dew, drizzle, and mist are common weather condi-
tions, accounting for 72% of the total. In general, a combination of dew and fog is considered as the
most severe wetting condition, even though fog is not necessary for the wetting process.
The surface leakage resistance of an insulator is unaffected by the dry deposits of dirt. However,
when these contamination deposits become moist or wet, they constitute continuous conducting
layers. Leakage current starts to flow in these layers along the surface of the insulators. This leakage
TABLE 2.5
Numbers of Flashovers Caused by Various Contaminant, Weather, and Atmospheric
Conditions
Type of
Contaminant
Weather and Atmospheric Conditions
Fog Dew Drizzle, Mist Ice Rain No Wind High Wind Wet Snow Fair
Sea salt 14 11 22 1 12 3 12 3 —
Cement 12 10 16 2 11 3 1 4 —
Fertilizer 7 5 8 — 1 1 — 4 —
Fly ash 11 6 19 1 6 3 1 3 1
Road salt 8 2 6 — 4 2 — 6 —
Potash 3 3 — — — — — —
Cooling tower 2 2 2 — 2 — — — —
Chemicals 9 5 7 1 1 — — 1 1
Gypsum 2 1 2 — 2 — — 2 —
Mixed
contamination
32 19 37 — 13 1 — 1 —
Limestone 2 1 2 — 4 — 2 2 —
Phosphate and
sulfate
4 1 4 — 3 — — — —
Paint 1 1 — — 1 — — —
Paper mill 2 2 4 — 2 — — 1 —
Acid exhaust 2 3 — — — — 1 —
Bird droppings 2 2 3 — 1 2 — — 2
Zinc industry 2 1 2 — 1 — — 1 —
Carbon 5 4 5 — — 4 3 3 —
Soap 2 2 1 — — 1 — — —
Steel works 6 5 3 2 2 — — 1 —
Carbide residue 2 1 1 1 — — — 1 —
Sulfur 3 2 2 — — 1 — 1 —
Copper and
nickel salt
2 2 2 — — 2 — 1 —
Wood fiber 1 1 1 — 1 — — 1 —
Bulldozing dust 2 1 1 — — — — — —
Aluminum plant 2 2 1 — 1 — — — —
Sodium plant 1 1 — — — — — —
Active pump 1 1 1 — — — — — —
Rock crusher 3 3 5 — 1 — — — —
Total flashover 146 93 166 8 68 26 19 38 4
Percent weather 25.75 16.4 29.3 1.4 12 4.58 3.36 6.52 0.71
11. 76 Electrical Power Transmission System Engineering
current heats the wet contamination, and the water starts to evaporate from those areas where the
product of current density and surface resistivity is greater, causing the surface resistivity further
to increase.
This, in turn, produces more heat, which evaporates the moisture in the surrounding regions,
causing the formation of circular patterns known as dry bands until the leakage currents
decreased to a value insufficient to sustain further evaporation and the voltage builds up across
the dry bands.
Further wetting results in further reduction of the resistance, and small flashovers taking place
on the insulator are in the same condition; the arcs extend rapidly over the whole surface, forcing all
the dry bands to discharge in a rapid cascade known as the flashover of the insulator. Figure 2.50
illustrates the phenomenon of insulator flashover due to contamination.
Severe contamination may reduce the 60 Hz flashover voltage from approximately 50 kV root-
mean-square (rms) per unit to as low as 6–9 kV rms per unit. The condition of such flashover may
be developed during the melting of contaminated ice on the insulator by leakage currents.
An insulator flashover due to contamination is easily distinguished from other types of flashover due
to the fact that the arc always begins close to the surface of the insulator unit, as shown in Figure 2.50a.
As shown in Figure 2.50c, only in the final stage does the flashover resemble an air strike. Furthermore,
since the insulator unit at the conductor end has the greatest voltage, the flashover phenomenon usually
starts at that insulator unit.
To prevent insulator flashovers, the insulators of an OH transmission line may be cleaned simply
by washing them, a process that can be done basically either by the conventional techniques or by
the new technique. In the conventional techniques, the line is deenergized, and its conductors are
grounded at each pole or tower where the members of an insulator cleaning crew wash and wipe the
insulators by hand.
In the new technique, the line is kept energized, while the insulators may be cleaned by high-
pressure water jets produced by a truck-mounted high-pressure pump that forces water through a
nozzle at 500–850 psi, developing a round solid stream. The water jets strike the insulator with a
high velocity, literally tearing the dirt and other contaminants from the insulator surface. The cost
of insulator cleaning per unit is very low by this technique. Certain lines may need insulator clean-
ing as often as three times a year.
To overcome the problem of surface contamination, some insulators may be covered with a thin
film of silicone grease that absorbs the dirt and makes the surface water form into droplets rather
than a thin film. This technique is especially effective for spot contamination where maintenance is
(a) (b) (c)
Figure 2.50 Changes in channel position of contaminated flashover.
12. 77
Transmission Line Structures and Equipment
possible, and it is also used against sea salt contamination. Finally, specially built semiconducting
glazed insulators having arc-resistive coating are used. The heat produced by the resistive coating
keeps the surface dry and provides for relatively linear potential distribution.
2.10.5 Insulator Flashover on Overhead HVDC Lines
Even though mechanical considerations are similar for both ac and dc lines, electrical characteris-
tics of insulators on dc lines are significantly different from those on dc lines, and flashover takes
place much more frequently than on an ac line of equivalent voltage. This is caused partly by the
electrostatic forces of the steady dc field, which increases the deposit of pollution on the insulator
surface. Further, arcs tend to develop into flashovers more readily in the absence of voltage zero.
To improve the operating performance and reduce the construction cost of OH HVDC lines by
using new insulating materials and new insulator configurations particularly suited to dc voltages’
stress, more compact line design can be produced, therefore, saving money on towers and ROWs.
For example, to improve the operating performance and reduce the construction cost of OH
HVDC lines, EPRI has sponsored the development of a new insulator. One of the more popular
designs, the composite insulator, uses a fiberglass rod for mechanical and electrical strength and
flexibility skirts made of organic materials for improved flashover performance. The composite
insulator appears to be especially attractive for use on HVDC lines because it is better able to with-
stand flashover in all types of contaminated environments, particularly in areas of light and medium
contamination.
Furthermore, there are various measures that may be taken into account to prevent contamina-
tion flashovers, for example, overinsulation, installment of v-string insulators, and installment of
horizontal string insulators. Overinsulation may be applicable in the areas of heavy contamination.
Up to 345 kV, the overinsulation is often achieved by increasing the number of insulators. However,
several contaminations may dictate the use of very large leakage distances that may be as large
as double the minimal requirements. Thus, electrical, mechanical, and economic restrictions may
limit the use of this design measure. The use of the v-string insulators can prevent the insulation
contamination substantially. They self-clean more effectively in rain than vertical insulators since
both sides of each insulator disk are somewhat exposed to rain. They can be used in heavy contami-
nation areas very effectively. The installment of horizontal insulator strings is the most effective
design measure that can be used to prevent contamination flashovers in the very heavy contamina-
tion areas. The contaminants are most effectively washed away on such strings. However, they may
require a strain tower support depending on the tower type.
Other techniques used include the installation of specially designed and built insulators. For
example, the use of fog-type insulators has shown that the contamination flashover can be effec-
tively reduced since most of the flashovers occur in conditions where there is mist, dew, and fog.
2.11 Substation Grounding
2.11.1 Electrical Shock and Its Effects on Humans
To properly design a grounding (called equipment grounding) for the HV lines and/or substations, it
is important to understand the electrical characteristics of the most important part of the circuit, the
human body. In general, shock currents are classified based on the degree of severity of the shock they
cause. For example, currents that produce direct physiological harm are called primary shock currents.
Whereas currents that cannot produce direct physiological harm but may cause involuntary
muscular reactions are called secondary shock currents. These shock currents can be either
steady state or transient in nature. In ac power systems, steady-state currents are sustained cur-
rents of 60 Hz or its harmonics. The transient currents, on the other hand, are capacitive discharge
currents whose magnitudes diminish rapidly with time.
13. 78 Electrical Power Transmission System Engineering
Table 2.6 gives the possible effects of electrical shock currents on humans. Note that the threshold
value for a normally healthy person to be able to feel a current is about 1 mA. (Experiments have long
ago established the well-known fact that electrical shock effects are due to current, not voltage [11].)
This is the value of current at which a person is just able to detect a slight tingling sensation on the
hands or fingers due to current flow. Currents of approximately 10–30 mA can cause lack of muscular
control. In most humans, a current of 100 mA will cause ventricular fibrillation. Currents of higher
magnitudes can stop the heart completely or cause severe electrical burns. The ventricular fibrilla-
tion is a condition where the heart beats in an abnormal and ineffective manner, with fatal results.
Therefore, its threshold is the main concern in grounding design.
Currents of 1 mA or more but less than 6 mA are often defined as the secondary shock currents
(let-go currents). The let-go current is the maximum current level at which a human holding an ener-
gized conductor can control his muscles enough to release it. The 60 Hz minimum required body
current leading to possible fatality through ventricular fibrillation can be expressed as
I
t
=
0 116
.
A (2.10)
Equipment protection is only part of the reason that substations are so well grounded. Personnel
protection is a major consideration. A continuous current of 0.15 A flowing through the trunk part
of the body is almost always fatal. To properly design a grounding (called equipment grounding)
for the HV lines and/or substations, it is important to understand the electrical characteristics of the
most important part of the circuit, the human body.
In general, shock currents are classified based on the degree of severity of the shock they cause.
For example, currents that produce direct physiological harm are called primary shock currents.
However, currents that cannot produce direct physiological harm but may cause involuntary muscu-
lar reactions are called secondary shock currents. These shock currents can be either steady state or
transient in nature. In ac power systems, steady-state currents are sustained currents of 60 Hz or its
harmonics. The transient currents, on the other hand, are capacitive currents of whose magnitudes
diminish rapidly with time.
Table 2.6
Effect of Electric Current (in mA) on Men and Women
Effects
DC AC (60 Hz)
Men Women Men Women
1. No sensation on hand 1 0.6 0.4 0.3
2. Slight tingling; per caption threshold 5.2 3.5 1.1 0.7
3. Shock not painful and muscular control not lost 9 6 1.8 1.2
4. Painful shock painful but muscular control not lost 62 41 9 6
5. Painful shock—let-go thresholda 76 51 16 10.5
6. Painful and severe shock, muscular contractions, breathing difficult 90 60 23 15
7. Possible ventricular fibrillation from short shocks:
(a) Shock duration 0.03 s 1300 1300 1000 1000
(b) Shock duration 3.0 s 500 500 100 100
(c) Almost certain ventricular fibrillation (if shock duration over
one heartbeat interval)
1375 1375 275 275
a Threshold for 50% of the males and female tested.
14. 79
Transmission Line Structures and Equipment
The threshold value for a normally healthy person to be able to feel a current is about 1 mA.
(Experiments have long ago established the well-known fact that electrical shock effects are due
to current, not voltage.) This is the value of current at which a person is just able to detect a slight
tingling sensation on the hands or fingers due to current flow.
Currents of 1 mA or more but less than 6 mA are often defined as the secondary shock currents
(let-go currents). The let-go current is the maximum current level at which a human holding an ener-
gized conductor can control his muscles enough to release it. Currents of approximately 10–30 mA
can cause lack of muscular control. In most humans, a current of 100 mA will cause ventricular fibril-
lation. Currents of higher magnitudes can stop the heart completely or cause severe electrical burns.
The ventricular fibrillation is a condition where the heart beats in an abnormal and inefficient
manner, with fatal results. Therefore, its threshold is the main concern in grounding design. IEEE
Std. 80-2000 gives the following equation to find that the nonfibrillating current of magnitude IB at
durations ranging from 0.03 to 3.0 s is related to the energy absorbed by the body as
S I t
B B s
= ( ) ×
2
(2.11)
where
IB is the rms magnitude of the current through the body in amperes
ts is the duration of the current exposure in seconds
SB is the empirical constant related to the electrical shock energy tolerated by a certain percent
of a given population
The effects of an electric current passing through the vital parts of a human body depend on
the duration, magnitude, and frequency of this current. The body resistance considered is usually
between two extremities, either from one hand to both feet or from one foot to the other one.
Experiments have shown that the body can tolerate much more current flowing from one leg to
the other than it can when current flows from one hand to the legs. Treating the foot as a circular
plate electrode gives an approximate resistance of 3ρs, where ρs is the soil resistivity. The resistance
used for the body itself is usually about 2300 Ω hand to hand or 1100 Ω hand to foot [12]. However,
IEEE Std. 80-2000 [14] recommends the use of 1000 Ω as a reasonable approximation for body
resistance. Figure 2.51a shows a touch contact with current flowing from hand to feet. On the other
hand, Figure 2.51b shows a step contact where current flows from one foot to the other. Note that in
each case, the body current Ib is driven by the potential difference points A and B.
Currents of 1 mA or more but less than 6 mA are often defined as the secondary shock currents
(let-go currents). The let-go current is the maximum current level at which a human holding an
energized conductor can control his muscles enough to release it. For 99.5% of population, the
60 Hz minimum required body current, IB, leading to possible fatality through ventricular fibrilla-
tion can be expressed as
I
t
B
s
=
0 116
50
.
A for kg body weight (2.12a)
or
I
t
B
s
=
0 157
70
.
A for kg body weight (2.12b)
where t is in seconds in the range from approximately 8.3 ms to 5 s.
15. 80 Electrical Power Transmission System Engineering
The effects of an electric current passing through the vital parts of a human body depend on the
duration, magnitude, and frequency of this current. The body resistance considered is usually between
two extremities, either from one hand to both feet or from one foot to the other one. Figure 2.52 shows
five basic situations involving a person and grounded facilities during fault.
On the other hand, the touch voltage represents the potential difference between the ground
potential rise (GPR) and the surface potential at the point where a person is standing while at the
same time having a hand in contact with a grounded structure. The transferred voltage is a special
case of the touch voltage where a voltage is transferred into or out of the substation from or to a
remote point external to the substation site [14].
Finally, GPR is the maximum electrical potential that a substation grounding grid may have
relative to a distant grounding point assumed to be at the potential of remote earth. This voltage,
GPR, is equal to the maximum grid current times the grid resistance. Under normal conditions,
the grounded electrical equipment operates at near-zero ground potential. That is, the potential
of a grounded neutral conductor is nearly identical to the potential of remote earth. During a
I
Rb Ib
I
Rb
Rf Rf
Rg1
A B
Rg2 Rg3
Ib Ib
Rf
B
A
2
Rg1 Rg2
Zth
I
Ib Rb
Rf
B
Rg1
Rg2
Rg3
Rf
A
Vth
+
–
Ib
Rb
Rf
I
Vth
Zth
A
B
Rg2
Rg1
2
+
–
(a) (b)
(c) (d)
Figure 2.51 Typical electrical shock hazard situations: (a) touch potential, (b) its equivalent circuit, (c) step
potential, and (d) its equivalent circuit.
16. 81
Transmission Line Structures and Equipment
ground fault, the portion of fault current that is conducted by substation grounding grid into the
earth causes the rise of the grid potential with respect to remote earth.
Exposure to touch potential normally poses a greater danger than exposure to step potential. The
step potentials are usually smaller in magnitude (due to the greater corresponding body resistance),
and the allowable body current is higher than the touch contacts. In either case, the value of the body
resistance is difficult to establish.
As said before, experiments have shown that the body can tolerate much more current flowing
from one leg to the other than it can when current flows from one hand to the legs. Treating the foot
as a circular plate electrode gives an approximate resistance of 3ρs, where ρs is the soil resistivity.
The resistance of the body itself is usually used as about 2300 Ω hand to hand or 1100 Ω hand to foot.
However, IEEE Std. 80-2000 [14] recommends the use of 1000 Ω as a reasonable approxima-
tion for body resistance. Therefore, the total branch resistance, for hand-to-foot currents, can be
expressed as
RB s
= +
1000 1 5
. ρ Ω for touch voltage (2.13a)
and, for foot-to-foot currents,
RB s
= +
1000 6ρ Ω for step voltage (2.13b)
where ρs is the soil resistivity in ohmmeters. If the surface of the soil is covered with a
layer of crushed rock or some other high-resistivity material, its resistivity should be used in
Equations 2.13a and b.
The touch voltage limit can also be determined from
V R
R
I
B
f
B
touch = +
2
Metal con metal
voltaje de contacto
voltaje de paso
Tocar
voltaje
Mesh
voltaje transferido
voltaje
Etransferred = GPR
Surface
potential
profile
Remote
earth
Remote earth
Em
Es
Et
Emm
Im
Figure 2
.52 Possible basic shock situations. (From Keil, R.P., Substation grounding, in Electric Power
Substation Engineering, Chapter 11, Figure 11.6, CRC Press, Boca Raton, FL, 2003, pp. 11-7. With permission.)
17. 82 Electrical Power Transmission System Engineering
and the step voltage limit can also be determined from
V R R I
B f B
step = +
( )
2
where
R C
f s s
= 3 ρ
where
RB is the resistance of human body, typically 1000 Ω for 50 and 60 Hz
RB is the ground resistance of one foot
IB is the rms magnitude of the current going through the body in A, per Equations 2.12a and b
Cs is the surface layer derating factor based on the thickness of the protective surface layer spread
above the earth grade at the substation (per IEEE Std. 80-2000, if no protective layer is used,
then Cs = 1)
RB s
= +
1000 1 5
. ρ Ω for touch voltage
and, for foot-to-foot currents,
RB s
= +
1000 6ρ Ω for step voltage
where ρs is the soil resistivity in ohmmeters. If the surface of the soil is covered with a layer of
crushed rock or some other high-resistivity material, its resistivity should be used in Equations 2.13
and 2.17.
Since it is much easier to calculate and measure potential than current, the fibrillation thresholds,
given by Equations 2.12a and b, are usually given in terms of voltage.
If no protective surface layer is used, the maximum allowable (or tolerable) touch voltages, for
a person with a body weight of 50 or 70 kg, respectively, can be expressed as
V
t
s
s
touch V for kg body weight
50
0 116 1000 1 5
50
=
+
( )
. . ρ
(2.14a)
and
V
t
s
s
touch V for kg body weight
70
0 157 1000 1 5
70
=
+
( )
. . ρ
(2.14b)
If no protective surface layer is used, the maximum allowable (or tolerable) step voltages, for a
person with a body weight of 50 or 70 kg, respectively, can be expressed as
V
t
s
s
step V for kg body weight
50
0 116 1000 6
50
=
+
( )
. ρ
(2.15a)
and
V
t
s
s
step V for kg body weight
70
0 157 1000 6
70
=
+
( )
. ρ
(2.15b)
18. 83
Transmission Line Structures and Equipment
If no protective surface layer is used, for the metal-to-metal touch in V, since ρs = 0, the afore-
mentioned equations become
V
ts
mm touch V for kg body weight
50
116
50
= (2.16a)
and
V
ts
mm touch V for kg body weight
70
157
70
= (2.16b)
If a protective layer does exist, then the maximum allowable (or tolerable) step voltages, for a
person with a body weight of 50 or 70 kg, are given, respectively, as
V
C
t
s s
s
step V for kg body weight
50
116 1000 6
50
=
+
( )
ρ
(2.17a)
and
V
C
t
s s
s
step V for kg body weight
70
0 157 1000 6
70
=
+
( )
. ρ
(2.17b)
If a protective layer does exist, then the maximum allowable (or tolerable) touch voltages, for a
person with a body weight of 50 or 70 kg, are given, respectively, as
V
C
t
s s
s
step V for kg body weight
50
116 1000 6
50
=
+
( )
ρ
(2.18a)
V
C
t
s s
s
step V for kg body weight
70
0 157 1000 6
70
=
+
( )
. ρ
(2.18b)
Again, these equations are applicable only in the event that a protection surface layer is used. For
metal-to-metal contacts, use ρs = 0 and Cs = 1. For more detailed applications, see IEEE Std. 2000
[12]. Also, it is important to note that in using these equations, it is assumed that they are applicable
to 99.5% of the population. There are always exceptions.
Furthermore, the touch voltage limit can also be expressed as
V R
R
I
B
f
B
touch = +
2
(2.19)
19. 84 Electrical Power Transmission System Engineering
Similarly, the step voltage limit can also be expressed as
V R R I
B f B
step = +
( )
2 (2.20)
where
R C
f s s
= 3 ρ (2.21)
where
RB is the resistance of human body, typically 1000 Ω for 50 and 60 Hz
Rf is the ground resistance of one foot
IB is the rms magnitude of the current going through the body in A, per Equations 2.12 and 2.13
Cs is the surface layer derating factor based on the thickness of the protective surface layer spread
above the earth grade at the substation. (per IEEE Std. 80-2000, if no protective layer is used,
then Cs = 1.0.)
Since it is much easier to calculate and measure potential than current, the fibrillation thresholds,
given by Equations 2.12 and 2.13, are usually given in terms of voltage.
2.11.2 Reduction of Factor Cs
Note that according to IEEE Std. 80-2000, a thin layer of highly resistive protective surface
material
such as gravel spread across the earth at a substation greatly reduced the possibly shock current at
a substation. IEEE Std. 80-2000 gives the required equations to determine the ground resistance of
one foot on a thin layer of surface material as
C
b
K R
s
s n
n
m nhs
= +
=
( )
∑
1
1 6
1
2
.
ρ
∞
(2.22)
and
C
h
s
s
s
= −
−( )
( )
+
1
0 09 1
2 0 09
.
.
ρ ρ
/
(2.23)
where
K s
s
=
−
+
ρ ρ
ρ ρ
(2.24)
where
Cs is the surface layer derating factor (it can be considered as a corrective factor to compute the
effective foot resistance in the presence of a finite thickness of surface material) (see Figure 2.53)
ρs is the surface material resistivity in ohmmeters
K is the reflection factor between different material resistivities
ρ is the resistivity of earth beneath the substation in ohmmeters
hs is the thickness of the surface material in meters
b is the radius of circular metallic disk representing the foot in meters
Rm nhs
2
( ) is the mutual ground resistance between two similar, parallel, coaxial plates that are
separated by a distance of (2nhs) in ohmmeters
20. 85
Transmission Line Structures and Equipment
Again, note that Figure 2.53 gives the exact value of Cs instead of using the empirical equation
(2.22) for it. The empirical equation gives approximate values that are within 5% of the values that
can be found in the equation.
Example 2.1
Assume that a human body is part of a 60 Hz electric power circuit for about 0.25 s and that the
soil type is average earth. Based on the IEEE Std. 80-2000, determine the following:
(a) Tolerable touch potential for 50 kg body weight
(b) Tolerable step potential for 50 kg body weight
Solution
(a) Using Equation 2.18a, for 50 kg body weight,
V
t
touch V
=
+
( ) =
+ ×
( ) ≅
0 116 1000 1 5 0 116 1000 1 5 100
0 25
267
. . . .
.
ρs
(
b) U
sing Equation 2.19b, for 50 kg body weight,
V
t
step V
=
+
( ) =
+ ×
( ) ≅
0 116 1000 6 0 116 1000 6 100
0 25
371
. .
.
ρs
1
0.9
0.8
0.6
k=–0.95
k=
–0.1
–0.2
–0.3
–0.4
–0.5
–0.6
–0.7
–0.8
–0.9
–0.95
k=–0.1
0.5
C
s
0.4
0.3
0.2
0.1
0
0 0.02 0.04 0.06 0.08
Espesor del material superficial, hs (m)
0.1 0.12 0.14 0.16 0.18 0.2 0.22 0.24 0.26 0.28 0.3
0.7
Figure 2
.53 Surface layer derating factor Cs versus thickness of surface material in meters. (From From
Keil, R.P., Substation grounding, in Electric Power Substation Engineering, Chapter 11, CRC Press, Boca
Raton, FL, 2003. With permission.)
21. 86 Electrical Power Transmission System Engineering
Example 2.2
Assume that a human body is part of a 60 Hz electric power circuit for about 0.49 s and that the
soil type is average earth. Based on the IEEE Std. 80-2000, determine the following:
(a) Tolerable touch potential for 50 kg body weight
(b) Tolerable step potential for 50 kg body weight
(c) Tolerable touch voltage limit for metal-to-metal contact if the person is 50 kg
(d) Tolerable touch voltage limit for metal-to-metal contact if the person is 70 kg
Solution
(a) Using Equation 2.18a, for 50 kg body weight,
V
t
s
s
touch 50
0 116 1000 1 5
0 116 1000 1 5 100
0 49
191
=
+
( )
=
+ ×
( )
≅
. .
. .
.
ρ
V
(b) Using Equation 2.18c,
V
ts
touch
V
50
0 116 1000 6
0 116 1000 6 100
0 49
265
=
+
( )
=
+ ×
( )
≅
.
.
.
ρs
(c) Since ρs = 0,
V
ts
mm-touch V for 50 kg body weight
50
116 116
0 49
165 7
= = =
.
.
(d) Since ρs = 0,
V
ts
mm-touch V for 70 kg body weight
70
157 157
0 49
224 3
= = =
.
.
Table 2.7 gives typical values for various ground types. However, the resistivity of ground also
changes as a function of temperature, moisture, and chemical content. Therefore, in practical
applications, the only way to determine the resistivity of soil is by measuring it.
Table 2.7
Resistivity of Different Soils
Ground Type Resistivity, ρs
Seawater 0.01–1.0
Wet organic soil 10
Moist soil (average earth) 100
Dry soil 1000
Bedrock 104
Pure slate 107
Sandstone 109
Crushed rock 1.5 × 10⁸
22. 87
Transmission Line Structures and Equipment
2.11.3 Ground Resistance
Ground is defined as a conducting connection, either intentional or accidental, by which an electric
circuit or equipment becomes grounded. Therefore, grounded means that a given electric system,
circuit, or device is connected to the earth serving in the place of the former with the purpose of
establishing and maintaining the potential of conductors connected to it approximately at the poten-
tial of the earth and allowing for conducting electric currents from and to the earth of its equivalent.
A safe grounding design should provide the following:
1. A means to carry and dissipate electric currents into ground under normal and fault condi-
tions without exceeding any operating and equipment limits or adversely affecting conti-
nuity of service
2. Assurance for such a degree of human safety so that a person working or walking in the
vicinity of grounded facilities is not subjected to the danger of critic electrical shock
However, a low ground resistance is not, in itself, a guarantee of safety. For example, about three or
four decades ago, a great many people assumed that any object grounded, however crudely, could be
safely touched. This misconception probably contributed to many tragic accidents in the past. Since there
is no simple relation between the resistance of the ground system as a whole and the maximum shock
current to which a person might be exposed, a system or system component (e.g., substation or tower)
of relatively low ground resistance may be dangerous under some conditions, whereas another system
component with very high ground resistance may still be safe or can be made safe by careful design.
GPR is a function of fault current magnitude, system voltage, and ground (system) resistance.
The current through the ground system multiplied by its resistance measured from a point remote
from the substation determines the GPR with respect to remote ground.
The ground resistance can be reduced by using electrodes buried in the ground. For example,
metal rods or counterpoise (i.e., buried conductors) is used for the lines of the grid system made of
copper-stranded copper cable, and rods are used for the substations.
The grounding resistance of a buried electrode is a function of (1) the resistance of the elec-
trode itself and connections to it, (2) contact resistance between the electrode and the surrounding
soil, and (3) resistance of the surrounding soil, from the electrode surface outward. The first two
resistances are very small with respect to soil resistance and therefore may be neglected in some
applications. However, the third one is usually very large depending on the type of soil, chemical
ingredients, moisture level, and temperature of the soil surrounding the electrode.
Table 2.8 presents data indicating the effect of moisture contents on the soil resistivity. The resis-
tance of the soil can be measured by using the three-electrode method or by using self-contained
instruments such as the Biddle Megger ground resistance tester.
TABLA 2.8
Efecto del contenido de humedad
sobre la resistividad del suelo
Contenido de humedad
(% en peso)
Resistivity (Ω-cm)
Topsoil Sandy Loam
0 109 109
2.5 250,000 150,000
5 165,000 43,000
10 53,000 18,500
15 19,000 10,500
20 12,000 6,300
30 6,400 4,200
23. 88 Electrical Power Transmission System Engineering
If the surface of the soil is covered with a layer of crushed rock or some other high-resistivity
material, its resistivity should be used in the previous equations. Table 2.6 gives typical values for
various ground types. However, the resistivity of ground also changes as a function of temperature,
moisture, and chemical content. Thus, in practical applications, the only way to determine the resis-
tivity of soil is by measuring it.
In general, soil resistivity investigations are required to determine the soil structure. Table 2.7
gives only very rough estimates. The soil resistivity can vary substantially with changes in tempera-
ture, moisture, and chemical content. To determine the soil resistivity of a specific site, soil resistivity
measurements are required to be taken. Since soil resistivity can change both horizontally and verti-
cally, it is necessary to take more than one set of measurements. IEEE Std. 81-1983 [19] describes
various measuring techniques in detail. There are commercially available computer programs that
use the soil data and calculate the soil resistivity and provide a confidence level based on the test.
There is also a graphical method that was developed by Sunde [20] to interpret the test results.
Figure 2.54 shows a ground rod driven into the soil and conducting current in all directions.
Resistance of the soil has been illustrated in terms of successive shells of the soil of equal thickness.
With increased distance from the electrode, the soil shells have greater area and therefore lower
resistance. Thus, the shell nearest the rod has the smallest cross section of the soil and therefore
the highest resistance. Measurements have shown that 90% of the total resistance surrounding an
electrode is usually with a radius of 6–10 ft.
The assumptions that have been made in deriving these formulas are that the soil is perfectly
homogeneous and the resistivity is of the same known value throughout the soil surrounding the elec-
trode. Of course, these assumptions are seldom true. The only way one can be sure of the resistivity
of the soil is by actually measuring it at the actual location of the electrode and at the actual depth.
Figure 2.55 shows the variation of soil resistivity with depth for a soil having uniform moisture
content at all depths [25a]. In reality, however, deeper soils have greater moisture content, and the
advantage of depth is more visible. Some nonhomogeneous soils can also be modeled by using the
two-layer method [26–29].
The resistance of the soil can be measured by using the three-electrode method or by using self-
contained instruments such as the Biddle Megger ground resistance tester. Figure 2.56 shows the
approximate ground resistivity distribution in the United States.
If the surface of the soil is covered with a layer of crushed rock or some other high-resistivity
material, its resistivity should be used in the previous equations. Table 2.9 gives typical values for
various ground types. However, the resistivity of ground also changes as a function of temperature,
Figure 2.54 Resistance of earth surrounding an electrode.
24. 89
Transmission Line Structures and Equipment
moisture, and chemical content. Thus, in practical applications, the only way to determine the resis-
tivity of soil is by measuring it.
In general, soil resistivity investigations are required to determine the soil structure. Table 2.9
gives only very rough estimates. The soil resistivity can vary substantially with changes in tempera-
ture, moisture, and chemical content. To determine the soil resistivity of a specific site, soil resistivity
170
160
150
140
130
120
110
100
90
80
70
60
50
40
30
20
10
0
0 1 2 3 4 5 6
Depth (ft)
7 8 9 10 11
Resistance
(Ω)
Figure 2.55 Variation of soil resistivity with depth for soil having uniform moisture content at all depths.
(From National Bureau of Standards Technical Report 108.)
500
125
125
67
125
1000 250
125
125
125
33
33
250
67
67500
125
125
500
67 67
125
125
125
125
67
67
67
125
250
250
125
67
67
67
33
33
125
67
67
33
67
125
67
250125
250
500
250
250
67
125
125
67
67
125
67
67
125
67
67
67
67
67
125
125
500
250
500
250
600
2000
1000
500
1000
500
2000
250
500
250 125
500
1000
125
500
250
125
250
500
125
125
250
500
500
1000
250
125
125 67
500
250
125
67
33
67 33
125
250
125
125
33
33
33
33
33
125
250
125
500
250
Figure 2.56 Approximate ground resistivity distribution in the United States. Notes: All figures
on this map indicate ground resistivity (Rho) in ohm-meters. These data are taken from FCC figure M3,
February 1954. The FCC data indicate ground conductivity in milliohms per meter. Resistivities of spe-
cial note from Transmission Line Reference Book by EPRI in ohmmeters: Swampy ground (10–100), pure
slate (10,000,000), and sandstone (100,000,000). (From Keil, R.P., Substation grounding, in Electric Power
Substation Engineering, Chapter 11, CRC Press, Boca Raton, FL, 2003.)
25. 90 Electrical Power Transmission System Engineering
measurements are required to be taken. Since soil resistivity can change both horizontally and verti-
cally, it is necessary to take more than one set of measurements. IEEE Std. 80-2000 [12] describes
various measuring techniques in detail. There are commercially available computer programs that
use the soil data and calculate the soil resistivity and provide a confidence level based on the test.
There is also a graphical method that was developed by Sunde [20] to interpret the test results.
2.11.4 Soil Resistivity Measurements
Table 2.9 gives estimates on soil classification that are only an approximation of the actual resistiv-
ity of a given site. Actual resistivity tests therefore are crucial. They should be made at a number of
places within the site. In general, substation sites where the soil has uniform resistivity throughout
the entire area and to a considerable depth are seldom found.
2.11.4.1 Wenner Four-Pin Method
More often than not, there are several layers, each having a different resistivity. Furthermore, lateral
changes also take place, however with respect to the vertical changes; these changes usually are more
gradual. Hence, soil resistivity tests should be made to find out if there are any substantial changes in
resistivity with depth. If the resistivity varies considerably with depth, it is often desirable to use an
increased range of probe spacing in order to get an estimate of the resistivity of deeper layers.
IEEE Std. 81-1983 describes a number of measuring techniques. The Wenner four-pin method is
the most commonly used technique. Figure 2.57 illustrates this method. In this method, four probes
TABLA 2.9
Constantes de material del material de puesta a tierra típico utilizado
Descripcion Kf
Tm
(oC)
αr Factor
at 20°C
(1/°C)
ρr 2
0° C
(μΩ·cm)
K0 at 0°C
(0°C)
Fusing
Temperature
Tm (0°C)
Material
Conducting
(%)
TCAP
Thermal
Capacity
[J/cm3·°C]
Cobre recocido, blando
Dibujada
7 1083 0.0393 1.72 234 1083 100 3.42
Cobre recocido, duro
dibujado
1084 1084 0.00381 1.78 242 1084 97 3.42
Alambre de acero
revestido de cobre
1084 12.06 0.00378 5.86 245 1084 30 3.85
Stainless steel 304
1510 14.72 0.00130 15.86 749 1400 2.4 3.28
Barra de acero
recubierta de zinc
28.96 28.96 0.0030 72 293 419 8.6 4.03
A
V
b
a
a
a
Figure 2.57 Wenner four-pin method.
26. 91
Transmission Line Structures and Equipment
(or pins) are driven into the earth along a straight line, at equal distances apart, driven to a depth b.
The voltage between the two inner (i.e., potential) electrodes is then measured and divided by the
current between the two outer (i.e., current) electrodes to give a value of resistance R. The apparent
resistivity of soil is determined from
ρ
π
a
aR
a a b
a
a b
=
+ +
( )
−
+
4
1 2 4 4
2 2 2 2
/
(2.25)
where
ρa is the apparent resistivity of the soil in ohmmeters
R is the measured resistivity in ohms
a is the distance between adjacent electrodes in meters
b is the depth of the electrodes in meters
In the event that b is small in comparison to a, then
ρ π
a aR
= 2 (2.26)
The current tends to flow near the surface for the small probe spacing, whereas more of the cur-
rent penetrates deeper soils for large spacing. Because of this fact, the previous two equations can
be used to determine the apparent resistivity ρa at a depth a.
The Wenner four-pin method obtains the soil resistivity data for deeper layers without driving the
test pins to those layers. No heavy equipment is needed to do the four-pin test. The results are not
greatly affected by the resistance of the test pins or the holes created in driving the test pins into the
soil. Because of these advantages, the Wenner method is the most popular method.
2.11.4.2 Three-Pin or Driven-Ground Rod Method
IEEE Std. 81-1983 describes a second method of measuring soil resistivity. It is illustrated in
Figure 2.58. In this method, the depth (Lr) of the driven rod located in the soil to be tested is varied.
D
V
A
Lr
Figure 2.58 Circuit diagram for three-pin or driven-ground rod method.
27. 92 Electrical Power Transmission System Engineering
The other two rods are known as reference rods. They are driven to a shallow depth in a straight line.
The location of the voltage rod is varied between the test rod and the current rod. Alternatively, the
voltage rod can be placed on the other side of the driven rod. The apparent resistivity is found from
ρ
π
a
r
r
L R
L d
=
( )−
2
8 1
ln /
(2.27)
where
Lr is the length of the driven rod in meters
d is the diameter of the rod in meters
R is the measured resistivity in ohms
A plot of the measured resistivity value ρa versus the rod length (Lr) provides a visual aid for find-
ing out earth resistivity variations with depth. An advantage of the driven-rod method, even though
not related necessarily to the measurements, is the ability to determine to what depth the ground
rods can be driven. This knowledge can save the need to redesign the ground grid. Because of hard
layers in the soil such as rock and hard clay, it becomes practically impossible to drive the test rod
any further resulting in insufficient data.
A disadvantage of the driven-rod method is that when the test rod is driven deep in the ground, it
usually losses contact with the soil due to the vibration and the larger diameter couplers resulting in
higher measured resistance values. A ground grid designed with these higher soil resistivity values
may be unnecessarily conservative. Thus, this method presents an uncertainty in the resistance value.
2.12 Substation Grounding
Grounding at substation has paramount importance. Again, the purpose of such a grounding system
includes the following:
1. To provide the ground connection for the grounded neutral for transformers, reactors, and
capacitors
2. To provide the discharge path for lightning rods, arresters, gaps, and similar devices
3. To ensure safety to operating personnel by limiting potential differences that can exist in a
substation
4. To provide a means of discharging and deenergizing equipment in order to proceed with
the maintenance of the equipment
5. To provide a sufficiently low-resistance path to ground to minimize rise in ground poten-
tial with respect to remote ground
A multigrounded, common neutral conductor used for a primary distribution line is always con-
nected to the substation grounding system where the circuit originates and to all grounds along the
length of the circuit. If separate primary and secondary neutral conductors are used, the conductors
have to be connected together provided the primary neutral conductor is effectively grounded.
The substation grounding system is connected to every individual equipment, structure, and instal-
lation so that it can provide the means by which grounding currents are connected to remote areas. It is
extremely important that the substation ground has a low ground resistance, adequate current-carrying
capacity, and safety features for personnel. It is crucial to have the substation ground resistance very low so
that the total rise of the ground system potential will not reach values that are unsafe for human contact.*
The substation grounding system normally is made of buried horizontal conductors and
driven-ground rods interconnected (by clamping, welding, or brazing) to form a continuous grid
* Mesh voltage is the worst possible value of a touch voltage to be found within a mesh of a ground grid if standing at or
near the center of the mesh.
28. 93
Transmission Line Structures and Equipment
(also called mat) network. A continuous cable (usually it is 4/0 bare copper cable buried 12–18 in.
below the surface) surrounds the grid perimeter to enclose as much ground as possible and to pre-
vent current concentration and thus high gradients at the ground cable terminals. Inside the grid,
cables are buried in parallel lines and with uniform spacing (e.g., about 10 × 20 ft).
All substation equipment and structures are connected to the ground grid with large conductors to
minimize the grounding resistance and limit the potential between equipment and the ground surface
to a safe value under all conditions. All substation fences are built inside the ground grid and attached
to the grid in short intervals to protect the public and personnel. The surface of the substation is usu-
ally covered with crushed rock or concrete to reduce the potential gradient when large currents are
discharged to ground and to increase the contact resistance to the feet of personnel in the substation.
IEEE Std. 80-1976 [13] provides a formula for a quick simple calculation of the grid resistance to
ground after a minimum design has been completed. It is expressed as
R
r L
s s
T
grid = +
ρ ρ
4
(2.28)
where
ρs is the soil resistivity in ohmmeters
LT is the total length of grid conductors in m
R is the radius of circle with an area equal to that of grid in m
IEEE Std. 80-2000 [19] provides the following equation to determine the grid resistance after a
minimum design has been completed:
R
r A
s
grid =
ρ π
4
(2.29)
Also, IEEE Std. 80-2000 provides the following equation to determine the upper limit for grid
resistance to ground after a minimum design has been completed:
R
r A L
s s
T
grid = +
ρ π ρ
4
(2.30)
where
Rgrid is the grid resistance in ohms
ρ is the soil resistance in ohmmeters
A is the area of the ground in square meters
LT is the total buried length of conductors in meters
But Equation 2.30 requires a uniform soil resistivity. Hence, a substantial engineering judgment
is necessary for reviewing the soil resistivity measurements to decide the value of soil resistivity.
However, it does provide a guideline for the uniform soil resistivity to be used in the ground grid
design. Alternatively, Sverak [19] provides the following formula for the grid resistance:
R
L A h A
s
T
grid = + +
+
ρ
1 1
20
1
1
1 20/
(2.31)
where
Rgrid is the substation ground resistance in ohms
ρs is the soil resistivity in ohmmeters
A is the area occupied by the ground grid in square meters
H is the depth of the grid in meters
LT is the total buried length of conductors in meters
29. 94 Electrical Power Transmission System Engineering
IEEE Std. 80-1976 also provides formulas to determine the effects of the grid geometry on the
step and mesh voltage (which is the worst possible value of the touch voltage) in volts. Mesh voltage
is the worst possible value of a touch voltage to be found within a mesh of a ground grid if standing
at or near the center of the mesh. They can be expressed as
E
K K I
L
s s i G
s
step =
× × ×
ρ
(2.32)
and
E
K K I
L
s m i G
m
mesh =
× × ×
ρ
(2.33)
where
ρs is the average soil resistivity in ohmmeters
Ks is the step coefficient
Km is the mesh coefficient
Ki is the irregularity coefficient
IG is the maximum rms current flowing between ground grid and earth in amperes
Ls is the total length of buried conductors, including cross connections and (optionally) the total
effective length of ground rods in meters
Lm is the total length of buried conductors, including cross connections and (optionally) the com-
bined length of ground rods in meters
Many utilities have computer programs for performing grounding grid studies. The number of
tedious calculations that must be performed to develop an accurate and sophisticated model of a
system is no longer a problem.
In general, in the event of a fault, OHGWs, neutral conductors, and directly buried metal pipes
and cables conduct a portion of the ground fault current away from the substation ground grid and
have to be taken into account when calculating the maximum value of the grid current. Based on
the associated equivalent circuit and resultant current division, one can determine what portion of
the total current flows into the earth and through other ground paths. It can be used to determine the
approximate amount of current that did not use the ground as flow path. The fault current division
factor (also known as the split factor) can be expressed as
S
I
Iao
split
grid
=
3
(2.34)
where
Ssplit is the fault current division factor
Igrid is the rms symmetrical grid current in amperes
Iao is the zero-sequence fault current in amperes
The split factor is used to determine the approximate amount of current that did not use the
ground flow path. Computer programs can determine the split factor easily, but it is also possible
to determine the split factor through graphs. With the Y ordinate representing the split factor and
the X axis representing the grid resistance, it is obvious that the grid resistance has to be known to
determine the split factor.
30. 95
Transmission Line Structures and Equipment
As previously said, the split factor determines the approximate amount of current that does use
the earth as return path. The amount of current that does enter the earth is found from the following
equation. Hence, the design value of the maximum grid current can be found from
I D I
G f
= × grid (2.35)
where
IG is the maximum grid current in amperes
Df is the decrement factor for the entire fault duration of tf, given in seconds
Igrid is the rms symmetrical grid current in amperes
Here, Figure 2.59 illustrates the relationship between asymmetrical fault current, dc decaying
component, and symmetrical fault current and the relationship between variables IF, If, and Df for
the fault duration tf.
The decrement factor is an adjustment factor that is used in conjunction with the symmetrical
ground fault current parameter in safety-oriented grounding calculations. It determines the rms
Symmetrical rms current
Decaying dc component
Asymmetrical current
Maximum instantaneous
a symmetrical fault current
at 1/2 cycle exact value
depends onX/R ratio of
circuit
Symmetrical current
Symmetrical peak current
Symmetrical rms current
0
Asymmetrical rms current
tf
I
f
I
F
=D
f
·
I
f
t
I
I
I
0
0
t
t
Figure 2.59 The relationship between asymmetrical fault current, dc decaying component, and symmetri-
cal fault current.
31. 96 Electrical Power Transmission System Engineering
equivalent of the asymmetrical current wave for a given fault duration, accounting for the effect of
initial dc offset and its attenuation during the fault. The decrement factor can be calculated from
D
T
I
e
f
a
f
t T
f a
= + ( )
1 1
2
− /
(2.36)
where tf is the time duration of fault in seconds.
T
X
R
a = =
ω
dc offset time constant in seconds
Here, tf should be chosen as the fastest clearing time. The fastest clearing time includes breaker
and relay time for transmission substations. It is assumed here that the ac components do not decay
with time.
The symmetrical grid current is defined as that portion of the symmetrical ground fault current
that flows between the grounding grid and surrounding earth. It can be expressed as
I S I
f f
grid = × (2.37)
where
If is the rms value of symmetrical ground fault current in amperes
Sf is the fault current division factor
IEEE Std. 80-2000 provides a series of current based on computer simulations for various values
of ground grid resistance and system conditions to determine the grid current. Based on those split-
current curves, one can determine the maximum grid current.
2.13 Ground Conductor Sizing Factors
The flow of excessive currents will be very dangerous if the right equipment is not used to help
dissipate the excessive currents. Ground conductors are means of providing a path for excessive
currents from the substation to ground grid. Hence, the ground grid then can spread the current into
the ground, creating a zero potential between the substation and the ground. Table 2.9 gives the list
of possible conductors that can be used for such conductors.
In the United States, there are only two types of conductors that are used, namely, copper and/
or copper-clad steel conductors that are used for this purpose. The copper one is mainly used due to
its high conductivity and the high resistance to corrosion. The next step is to determine the size of
ground conductor that needs to be buried underground.
Thus, based on the symmetrical conductor current, the required conductor size can be found from
I A
t
K T
K T
f
c r r
=
×
× ×
+
+
mm
amb
TCAP
2
10 4
0
0
−
α ρ
ln max
1 2
/
(2.38)
If the conductor size needs to be found in mm2, the conductor size can be found from
A
I
t
K T
K T
f
c r r
mm
amb
TCAP
2
10 4
0
0
=
×
× ×
+
+
−
α ρ
ln max
1 2
/
(2.39)
32. 97
Transmission Line Structures and Equipment
Alternatively, in the event that the conductor size needs to be found in kcmil, since
A A
kcmil mm
= ×
1 974 2
. (2.40)
then, Equation 2.31 can be expressed as
I A
t
K T
K T
f
c r r
= ×
×
× ×
+
+
5 07 10
10
3
4
0
0
. ln max
−
−
α ρ
kcmil
amb
TCAP
1 2
/
(2.41)
Note that both αr and ρr can be found at the same reference temperature of Tr °C. Also, note that
Equations 2.38 and 2.39 can also be used to determine the short-time temperature rise in a ground
conductor. Thus, taking other required conversions into account, the conductor size in kcmil can
be found from
A
I
t
K T
K T
f
c r r
kcmil
amb
TCAP
=
×
×
× ×
+
+
197 4
10 4
0
0
.
ln max
−
α ρ
1 2
/
(2.42)
where
If is the rms current (without dc offset) in kiloamperes
Amm2 is the conductor cross section in square millimeters
Akcmil is the conductor cross section in kilocircular mils
TCAP is the thermal capacity per unit volume, J/(cm3 · °C) (it is found from Table 2.9, per IEEE
Std. 80-2000)
tc is the duration of current in seconds
αr is the thermal coefficient of resistivity at reference temperature Tr, 1/°C (it is found from
Table 2.9, per IEEE Std. 80-2000 for 20°C)
ρr is the resistivity of the ground conductor at reference temperature Tr, microohm centimeters
(it is found from Table 2.9, per IEEE Std. 80-2000 for 20°C)
K0 = 1/α0 or (1/αr) –Tr in degree Celsius
Tmax is the maximum allowable temperature in degree Celsius
Tamb is the ambient temperature in degree Celsius
If is the rms current (without dc offset) in kiloamperes
For a given conductor material, the TCAP is found from Table 2.9 or calculated from
TCAP
J
cm C
J
cal
SH
cal
g C
SW
3 4 184
⋅°
( )
=
×
⋅°
( )
×
.
g
g
cm3
(2.43)
where SH is the specific heat, in cal/(g · °C), and is related to the thermal capacity per unit volume in
J
cm C
3
⋅°
( )
33. 98 Electrical Power Transmission System Engineering
SW is the specific weight, in g/cm3, and is related to the thermal capacity per unit volume in
J
cm C
3
⋅°
( )
Thus, TCAP is defined by
TCAP
J
cm C
J
cal
SH
cal
g C
SW
3 4 184
⋅°
( )
=
×
⋅°
( )
×
.
g
g
cm3
(2.44)
Asymmetrical fault currents consist of subtransient, transient, and steady-state ac components
and the dc offset current component. To find the asymmetrical fault current (i.e., if the effect of
the dc offset is needed to be included in the fault current), the equivalent value of the asymmetrical
current IF is found from
I D I
F f f
= × (2.45)
where IF is representing the rms value of an asymmetrical current integrated over the entire fault
duration, tc, which can be found as a function of X/R by using Df, before using Equations 2.36 or
2.39 and where Df is the decrement factor and is found from
D
T
t
e
f
a
f
t T
f a
= + ( )
1 1
2
1 2
− − /
/
(2.46)
where
tf is the time duration of fault in seconds
Ta is the dc offset time constant in seconds
Note that
T
X
R
a =
ω
(2.47)
and for 60 Hz,
T
X
R
a =
120π
(2.48)
The resulting IF is always greater than If. However, if the X/R ratio is less than 5 and the fault dura-
tion is greater than 1 s, the effects of the dc offset are negligible.
34. 99
Transmission Line Structures and Equipment
2.14 Mesh Voltage Design Calculations
If the GPR value exceeds the tolerable touch and step voltages, it is necessary to perform the mesh volt-
age design calculations to determine whether the design of a substation is safe. If the design is again
unsafe, conductors in the form of ground rods are added to the design until the design is
considered
safe. The mesh voltage is the maximum touch voltage and it is found from
E
K K I
L
m i G
M
mesh =
× × ×
ρ
(2.49)
where
ρ is the soil resistivity in ohmmeters
Km is the mesh coefficient
Ki is the correction factor for grid geometry
IG is the maximum grid current that flows between ground grid and surrounding earth in amperes
Lm is the length of Lc + LR for mesh voltage in meters
Lc is the total length of grid conductor in meters
LR is the total length of ground rods in meters
The mesh coefficient Km is determined from
K
D
h d
D h
D d
h
D
K
K
m
ii
h
=
× ×
+
+ ×
( )
× × ×
+
×
1
2 16
2
8 4
8
2 14
2 2
π
−
π −
ln ln
1
1
( )
(2.50)
where
d is the diameter of grid conductors in meters
D is the spacing between parallel conductors in meters
Kii is the irregularity factor (corrective weighting factor that adjusts for the effects of inner con-
ductors on the corner mesh)
Kh is the corrective weighting factor that highlights for the effects of grid depth
n is the geometric factor
h is the depth of ground grid conductors in meters
As it can be observed from Equation 2.50, the geometric factor Km has the following variables: Ds,
the spacing between the conductors; ns, the number of conductors; d, the diameter of the conductors
used; and h, the depth of the grid. The effect of each variable on the Km is different. Figure 2.60
shows the effect of the spacing (D) between conductors on Km. Figure 2.61 shows the effect of the
number of conductors (n) on the Km. Figure 2.62 show the relationship between the diameter of the
conductor (d) and the Km. Figure 2.63 shows the relationship between the depth of the conductor (h)
and Km [17].
Note that the value of Kii depends on the following circumstances:
1. For the grids with ground rods existing in grid corners as well as perimeter,
Kii = 1 (2.51)
2. For the grids with no or few ground rods with none existing in corners or perimeter,
K
n
ii n
=
( )
1
2
2/
(2.52)
35. 100 Electrical Power Transmission System Engineering
0.4
0.5
0.6
0.7
0.8
0.9
1
1.1
1.2
2 4 6 8 10 12 14 16 18 20 22 24 26 28 30 32 34 36 38 40 42 44 46 48 50
n—número de conductores
K
m
Km
Figure 2
.61 The effect of the number of conductors (n) on the Km. (From Keil, R.P., Substation grounding,
in Electric Power Substation Engineering, Chapter 11, CRC Press, Boca Raton, FL, 2003. With permission.)
1.4
1.3
1.2
1.1
1
0.9
0.8
0.7
0.6
0.5
0.4
2 4 6 8 10 12 14 16 18 20 22 24 26 28
D–distancia entre conductores (m)
30 32 34 36 38 40 42 44 46 48 50
Km
K
m
Figure 2
.60 The effect of the spacing (D) between conductors on Km. (From Keil, R.P., Substation
grounding, in Electric Power Substation Engineering, Chapter 11, CRC Press, Boca Raton, FL, 2003. With
permission.)
36. 101
Transmission Line Structures and Equipment
0.45
0.55
0.65
0.75
0.85
0.95
0.01
0.02
0.03
0.04
0.05
0.06
0.07
0.08
0.09
0.1
d—diámetro del cable (m)
K
m
Km
Figure 2
.62 The relationship between the diameter of the conductor (d) and the Km. (From Keil, R.P.,
Substation grounding, in Electric Power Substation Engineering, Chapter 11, CRC Press, Boca Raton, FL,
2003. With permission.)
0.5
0.55
0.6
0.65
0.7
0.75
0.8
0.85
0.9
0.95
1
0.25 0.5 0.75 1 2 3 4 5 6 7
h—profundidad de los conductores de la red (m)
K
m
Km
Figure 2
.63 The relationship between the depth of the conductor (h) and Km. (From Keil, R.P., Substation
grounding, in Electric Power Substation Engineering, Chapter 11, CRC Press, Boca Raton, FL, 2003. With
permission.)
37. 102 Electrical Power Transmission System Engineering
and
K
h
h
h = +
1
0
(2.53)
where h0 is the grid reference depth = 1 m.
The effective number of parallel conductors (n) given in a given grid is found from
n n n n n
a b c d
= × × × (2.54)
where
n L L
a c p
= 2 /
nb = 1, for square grids
nc = 1, for square and rectangular grids
nd = 1, for square, rectangular, and L-shaped grids
Otherwise, the following equations are used to determine the nb, nc, and nd so that
n
L
A
b
p
=
4
(2.55)
n
L L
A
c
X Y
A L L
X Y
=
×
×
0 7
. /
(2.56)
n
D
L L
d
m
X Y
=
+
2 2
(2.57)
where
Lp is the peripheral length of the grid in meters
LC is the total length of the conductor in the horizontal grid in meters
A is the area of the grid in square meters
LX is the maximum length of the grid in the x direction in meters
LY is the maximum length of the grid in the y direction in meters
d is the diameter of grid conductors in meters
D is the spacing between parallel conductors in meters
Dm is the maximum distance between any two points on the grid in meters
h is the depth of ground grid conductors in meters
Note that the irregularity factor is determined from
K n
ii = +
0 644 0 148
. . (2.58)
The effective buried length (LM) for grids:
1. With little or no ground rods but not located in the corners or along the perimeter of the grid,
LM = LC + LR (2.59)
where
LR is the total length of all ground rods in meters
LC is the total length of the conductor in the horizontal grid in meters
38. 103
Transmission Line Structures and Equipment
2. With ground rods in corners and along the perimeter and throughout the grid,
L L
L
L L
L
M C
g
X Y
R
= + +
+
1 55 1 22
2 2
. . (2.60)
where LR is the length of each ground rod in meters.
2.15 Step Voltage Design Calculations
According to IEEE Std. 80-2000, in order for the ground system to be safe, step voltage has to be
less than the tolerable step voltage. Furthermore, step voltages within the grid system designed for
safe mesh voltages will be well within the tolerable limits; the reason for this is both feet and legs
are in series rather than in parallel and the current takes the path from one leg to the other rather
than through vital organs. The step voltage is determined from
E
K K I
L
s i G
S
step =
× × ×
ρ
(2.61)
where
Ks is the step coefficient
LS is the buried conductor length in meters
Again, for grids with or without ground rods,
L L L
S C R
= +
0 75 0 85
. . (2.62)
so that the step coefficient can be found from
K
h D h D
S
n
= +
+
+ ( )
1 1
2
2 1
1 0 5 2
π
− −
. (2.63)
where h is the depth of ground grid conductors in meters, usually between 0.25 m h 2.5 m.
As in Equation 2.63, the geometric factor Ks is a function of D, n, d, π, and h. Figure 2.64 shows
the relationship between the distance (D) between the conductors and the geometric factor Ks.
0.3000
0.3500
0.4000
0.4500
0.5000
0.5500
0.6000
0.6500
2 4 6 8 10 12 14 16 18 20 22 24 26 28 30
D—distance (m)
K
s
Ks
Figure 2.64 The relationship between the distance (D) between the conductors and the geometric
factor Ks. (From Keil, R.P., Substation grounding, in Electric Power Substation Engineering, Chapter 11,
CRC Press, Boca Raton, FL, 2003. With permission.)