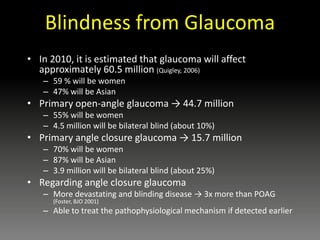
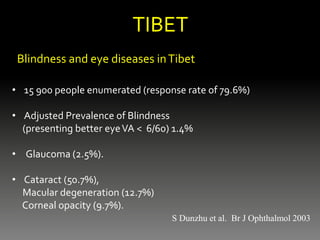
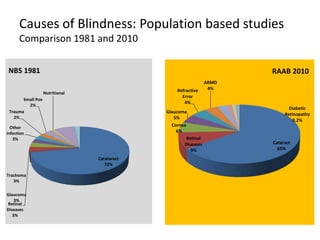
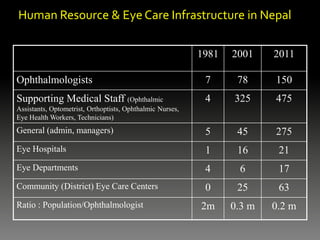
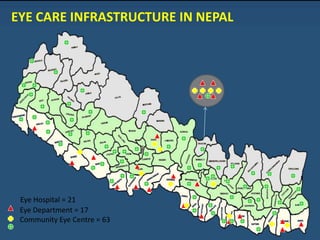
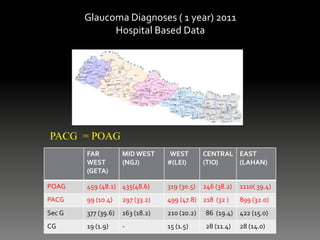
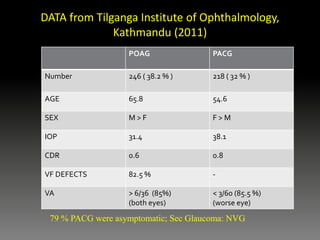
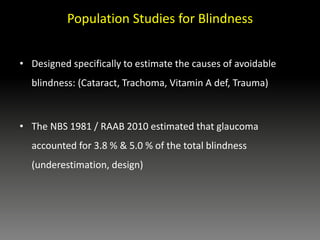
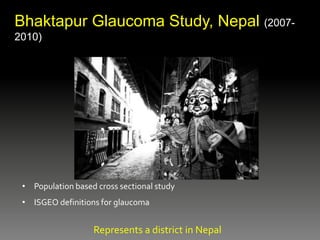
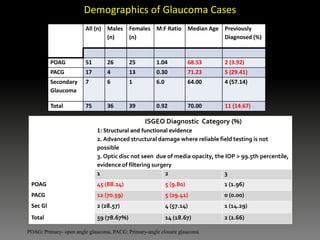
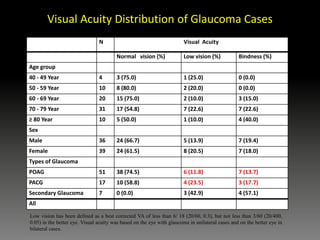
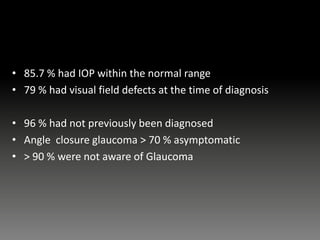
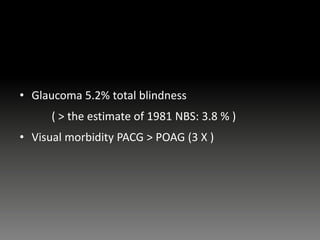
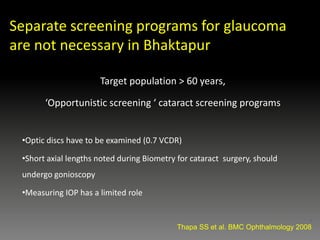
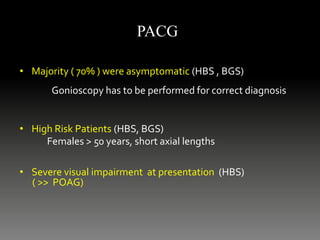
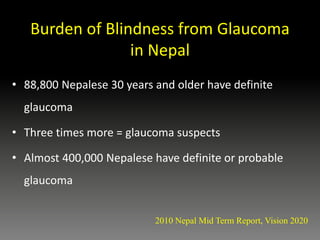
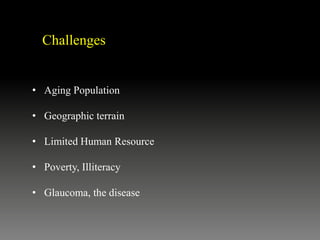
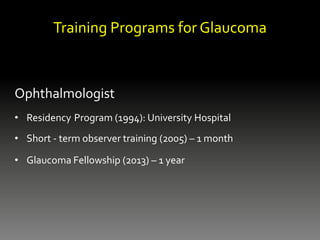
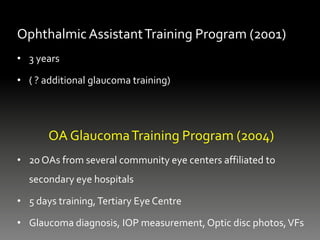
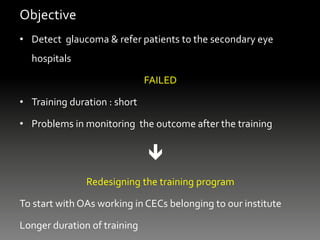
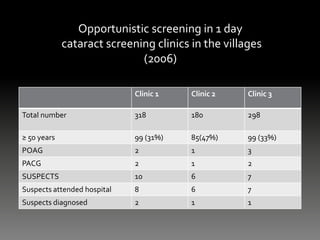
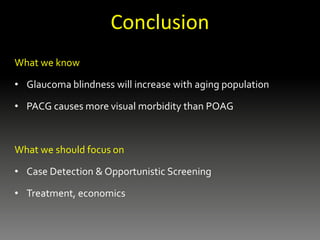
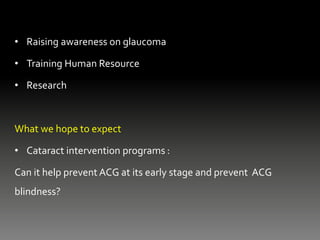
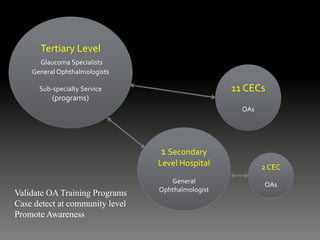
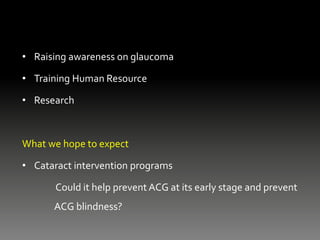
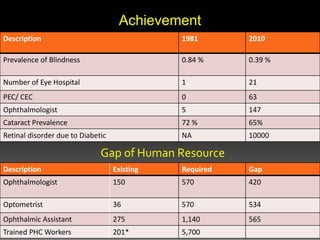
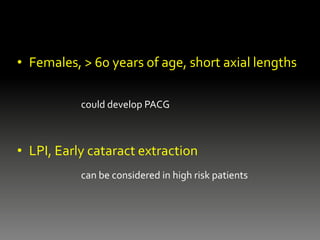
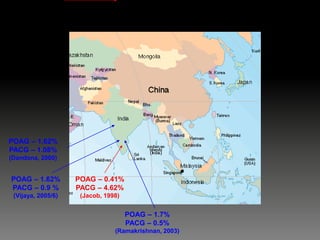
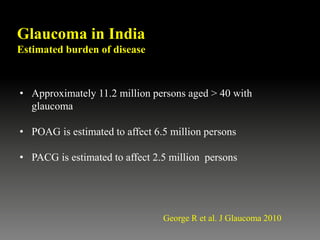
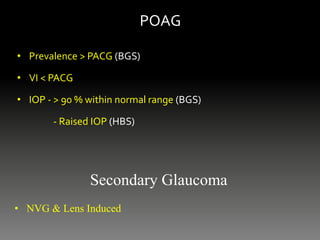
Challenges of Glaucoma Care in the Himalayas
(Tibet and Nepal)
Suman Thapa MD, PhD
Kathmandu, Nepal
Worldwide problem
Glaucoma
Second leading cause of blindness after cataract
(Resnikoff, WHO 2002)
Leading cause of irreversible blindness
Blindness from Glaucoma
• In 2010, it is estimated that glaucoma will affect
approximately 60.5 million (Quigley, 2006)
– 59 % will be women
– 47% will be Asian
• Primary open-angle glaucoma → 44.7 million
– 55% will be women
– 4.5 million will be bilateral blind (about 10%)
• Primary angle closure glaucoma → 15.7 million
– 70% will be women
– 87% will be Asian
– 3.9 million will be bilateral blind (about 25%)
• Regarding angle closure glaucoma
– More devastating and blinding disease → 3x more than POAG
(Foster, BJO 2001)
– Able to treat the pathophysiological mechanism if detected earlier
TIBET
Blindness and eye diseases inTibet
• 15 900 people enumerated (response rate of 79.6%)
• Adjusted Prevalence of Blindness
(presenting better eyeVA < 6/60) 1.4%
• Glaucoma (2.5%).
• Cataract (50.7%),
Macular degeneration (12.7%)
Corneal opacity (9.7%).
S Dunzhu et al. Br J Ophthalmol 2003
NEPAL
• Between China and India
• Population : 26.6 Million (2011)
• Area: 147,181 sq. km
• Health Budget: Aprox. 7 % of the total budget
• GDP $450
Causes of Blindness: Population based studies
Comparison 1981 and 2010
Catataract
72%
Retinal
Diseases
3%
Glaucoma
3%
Trachoma
3%
Other
infection
3%
Trauma
2%
Small Pox
2%
Nutritional
NBS 1981
Cataract
65%
Retinal
Diseases
9%
Cornea
6%
Glaucoma
5%
Refractive
Error
4%
ARMD
4%
Diabetic
Retinopathy
0.2%
RAAB 2010
Human Resource & Eye Care Infrastructure in Nepal
1981 2001 2011
Ophthalmologists 7 78 150
Supporting Medical Staff (Ophthalmic
Assistants, Optometrist, Orthoptists, Ophthalmic Nurses,
Eye Health Workers, Technicians)
4 325 475
General (admin, managers) 5 45 275
Eye Hospitals 1 16 21
Eye Departments 4 6 17
Community (District) Eye Care Centers 0 25 63
Ratio : Population/Ophthalmologist 2m 0.3 m 0.2 m
Krishna Gopal Shrestha
Eye Hospital = 21
Eye Department = 17
Community Eye Centre = 63
EYE CARE INFRASTRUCTURE IN NEPAL
Understanding the burden of Glaucoma
Hospital Based Data (2011)
Results from a Population Based Study (2010)
• Clinical Information from these data and the Implications
• Challenges & Strategies adopted
Glaucoma Diagnoses ( 1 year) 2011
Hospital Based Data
FAR
WEST
(GETA)
MIDWEST
(NGJ)
WEST
#(LEI)
CENTRAL
(TIO)
EAST
(LAHAN)
POAG 459 (48.1) 435(48.6) 319 (30.5) 246 (38.2) 1110( 39.4)
PACG 99 (10.4) 297 (33.2) 499 (47.8) 218 (32 ) 899 (32.0)
Sec G 377 (39.6) 163 (18.2) 210 (20.2) 86 (19.4) 422 (15.0)
CG 19 (1.9) - 15 (1.5) 28 (11.4) 28 (14.0)
PACG = POAG
POAG PACG
Number 246 ( 38.2 % ) 218 ( 32 % )
AGE 65.8 54.6
SEX M > F F > M
IOP 31.4 38.1
CDR 0.6 0.8
VF DEFECTS 82.5 % -
VA > 6/36 (85%)
(both eyes)
< 3/60 (85.5 %)
(worse eye)
DATA from Tilganga Institute of Ophthalmology,
Kathmandu (2011)
79 % PACG were asymptomatic; Sec Glaucoma: NVG
Population Studies for Blindness
• Designed specifically to estimate the causes of avoidable
blindness: (Cataract, Trachoma, Vitamin A def, Trauma)
• The NBS 1981 / RAAB 2010 estimated that glaucoma
accounted for 3.8 % & 5.0 % of the total blindness
(underestimation, design)
• Population based cross sectional study
• ISGEO definitions for glaucoma
Represents a district in Nepal
Bhaktapur Glaucoma Study, Nepal (2007-
2010)
Results
• Prevalence 1.8 % (95% CI = 1.68 – 1.92)
• POAG (1.2 %) > PACG (0.4 %)
• Age was a RF (2.4 % : 60-69 years; 10.3% : > 80 years)
• No difference in gender
• Myopia , HTN, DM were not RFs for POAG
Thapa SS et al. Ophthalmology 2012
Prevalence of Glaucoma in South Asia
Prevalence %
Study Population Age All POAG PACG Ratio of POAG
to PACG
Bangladesh, Dhaka 40 + 3.1 2.5 0.4 6.3
West Bengal, East India 50 + 3.3 3.1 0.2 10.00
ACES, South India 40 + 2.6 1.2 0.5 2.4
APEDS, South India 40 + - 2.6 1.1 2.4
CGS, South India 40 + - 1.6 0.9 1.4
Sri Lanka 40 + 1.0 2.3 0.5 4.6
Burma 40 + - 2.0 2.5 0.8
BGS, Nepal 40 + 1.8 1.2 0.4 3.0
ACES: Aravind Comprehensive Eye Survey
APEDS: Andhra Pradesh Eye Disease Study
CGS: Chennai Glaucoma Study
BGS: Bhaktapur Glaucoma Study
Comparison
Age, Sex, IOP, CCT and vCDR
Characteristics Normal POAG P value PACG P value
Age 54.60 ( ± 0.20) 68.53 ( ± 1.63) < 0.001 71.24 ( ± 1.67) < 0.001
Sex, M / F 1695 / 1994 26/25 0.483 4/13 0.086
IOP 13.30 ( ± 0.04) 13.57 ( ± 0.34) 0.400 16.00 ( ± 1.11) < 0.001
CCT 537.88 ( ± 0.60) 527.73 ( ± 4.58) 0.053 552.12 ( ± 45.65) 0.11
VCDR 0.26 ( ± 0.002) 0.62 ( ± 0.02) < 0.001 0.55 ( ± 0.05) < 0.001
M: Male, F: Female, IOP: Intraocular pressure, CCT: Central Corneal Thickness,
VCDR: Vertical Cup Disc Ratio
Ocular Biometric Measures
Different population based studies
Nepalese
(n = 685)
South Indian
(n = 419)
Chinese
(n = 531)
White
Americans
(n = 170)
African-
Americans
(n = 188)
Sex (M : F) 315 : 370 210: 209 236 : 295 82 : 88 55 : 133
Axial length (mm),
mean (SD)
22.62
(0.90)
22.76(0.78) 23.32(1.38) 23.35(1.38) 23.14(0.87)
95% CI
difference in
means
- 0.24 to -
0.03
- 0.83 to -
0.57
- 0.90 to -
0.56
- 0.66 to -
0.37
p- value 0.008 < 0.001 < 0.001 < 0.001
.
Thapa SS et al. Optometry and Visual Science 2011
Demographics of Glaucoma Cases
All (n) Males
(n)
Females
(n)
M:F Ratio Median Age Previously
Diagnosed (%)
POAG 51 26 25 1.04 68.53 2 (3.92)
PACG 17 4 13 0.30 71.23 5 (29.41)
Secondary
Glaucoma
7 6 1 6.0 64.00 4 (57.14)
Total 75 36 39 0.92 70.00 11 (14.67)
POAG: Primary- open angle glaucoma, PACG: Primary-angle closure glaucoma
ISGEO Diagnostic Category (%)
1: Structural and functional evidence
2. Advanced structural damage where reliable field testing is not
possible
3. Optic disc not seen due of media opacity, the IOP > 99.5th percentile,
evidence of filtering surgery
1 2 3
POAG 45 (88.24) 5 (9.80) 1 (1.96)
PACG 12 (70.59) 5 (29.41) 0 (0.00)
Sec Gl 2 (28.57) 4 (57.14) 1 (14.29)
Total 59 (78.67%) 14 (18.67) 2 (2.66)
Visual Acuity Distribution of Glaucoma Cases
N Visual Acuity
Normal vision (%) Low vision (%) Bindness (%)
Age group
40 - 49 Year 4 3 (75.0) 1 (25.0) 0 (0.0)
50 - 59 Year 10 8 (80.0) 2 (20.0) 0 (0.0)
60 - 69 Year 20 15 (75.0) 2 (10.0) 3 (15.0)
70 - 79 Year 31 17 (54.8) 7 (22.6) 7 (22.6)
≥ 80 Year 10 5 (50.0) 1 (10.0) 4 (40.0)
Sex
Male 36 24 (66.7) 5 (13.9) 7 (19.4)
Female 39 24 (61.5) 8 (20.5) 7 (18.0)
Types of Glaucoma
POAG 51 38 (74.5) 6 (11.8) 7 (13.7)
PACG 17 10 (58.8) 4 (23.5) 3 (17.7)
Secondary Glaucoma 7 0 (0.0) 3 (42.9) 4 (57.1)
All 75 48 (64.0) 13 (17.3) 14 (18.7)
Low vision has been defined as a best corrected VA of less than 6/ 18 (20/60, 0.3), but not less than 3/60 (20/400,
0.05) in the better eye. Visual acuity was based on the eye with glaucoma in unilateral cases and on the better eye in
bilateral cases.
Clinical Information
&
Implications
•Normal IOP ≈ 13 mmHg
18 mmHg should be considered on the higher side
•Normal v CDR 0.2
0.7 should be viewed with suspicion
•CCT influences the measurement of IOP
• 85.7 % had IOP within the normal range
• 79 % had visual field defects at the time of diagnosis
• 96 % had not previously been diagnosed
• Angle closure glaucoma > 70 % asymptomatic
• > 90 % were not aware of Glaucoma
• Glaucoma 5.2% total blindness
( > the estimate of 1981 NBS: 3.8 % )
• Visual morbidity PACG > POAG (3 X )
Prevalence of Glaucoma in Bhaktapur district
Represents primarily a ‘ Newari ’ ethnic race
Although the ‘ Newari ’ race constitute a large proportion of the
countries population, the results from the BGS does not represent
the epidemiology of glaucoma in Nepal
Target population > 60 years,
‘Opportunistic screening ‘ cataract screening programs
•Optic discs have to be examined (0.7 VCDR)
•Short axial lengths noted during Biometry for cataract surgery, should
undergo gonioscopy
•Measuring IOP has a limited role
.
Thapa SS et al. BMC Ophthalmology 2008
Separate screening programs for glaucoma
are not necessary in Bhaktapur
• Majority ( 70% ) were asymptomatic (HBS , BGS)
Gonioscopy has to be performed for correct diagnosis
• High Risk Patients (HBS, BGS)
Females > 50 years, short axial lengths
• Severe visual impairment at presentation (HBS)
( >> POAG)
PACG
• Role of the lens / formation of cataract in the
pathogenesis of PACG has to be considered (BGS)
• Early cataract removal may prevent progression to /
of PACG in high risk patients
Challenges
and
Strategies Adopted
Burden of Blindness from Glaucoma
in Nepal
• 88,800 Nepalese 30 years and older have definite
glaucoma
• Three times more = glaucoma suspects
• Almost 400,000 Nepalese have definite or probable
glaucoma
2010 Nepal Mid Term Report, Vision 2020
• Aging Population
• Geographic terrain
• Limited Human Resource
• Poverty, Illiteracy
• Glaucoma, the disease
Challenges
Training Programs for Glaucoma
Ophthalmologist
• Residency Program (1994): University Hospital
• Short - term observer training (2005) – 1 month
• Glaucoma Fellowship (2013) – 1 year
OphthalmicAssistantTraining Program (2001)
• 3 years
• ( ? additional glaucoma training)
OA GlaucomaTraining Program (2004)
• 20 OAs from several community eye centers affiliated to
secondary eye hospitals
• 5 days training,Tertiary Eye Centre
• Glaucoma diagnosis, IOP measurement, Optic disc photos,VFs
Objective
• Detect glaucoma & refer patients to the secondary eye
hospitals
FAILED
• Training duration : short
• Problems in monitoring the outcome after the training

Redesigning the training program
To start with OAs working in CECs belonging to our institute
Longer duration of training
Screening
Large Population Screening
• Costs , Infrastructure
• Tools for screening
Case Detection / Opportunistic Screening
Opportunistic screening in 1 day
cataract screening clinics in the villages
(2006)
Clinic 1 Clinic 2 Clinic 3
Total number 318 180 298
≥ 50 years 99 (31%) 85(47%) 99 (33%)
POAG 2 1 3
PACG 2 1 2
SUSPECTS 10 6 7
Suspects attended hospital 8 6 7
Suspects diagnosed 2 1 1
Treatment
• Beta blockers: 1st line of treatment
• Additional drugs: Issues regarding costs
• Primary Surgery
Ask patients about affordability
Glaucoma Education & Awareness Programs
(2003)
• Glaucoma Support Group Activities
- 6 education classes / year
• Annual Glaucoma Awareness Week
- Free investigations and treatment
- Information Booklets
Impact of GSG and Awareness Programs
(2004- 2011)
0
100
200
300
400
500
600
700
800
2004 2005 2006 2007 2008 2009 2010 2011
Patients registered
Patients Examined
(New)
New Diagnosis
Old Patients
Total Pts. Examined
Total number of patients examined during
Glaucoma Awareness Week
Financial support extended by patients attending support group
classes towards the treatment of patients
Number of participants during patient
education programs
• 3 year Prospective, Surgical Trial
• To evaluate the outcomes of Cataract removal vs.
Trabeculectomy or Combined surgery in the treatment of ACG
Bhaktapur Retinal Study
(BRS, 2013- 2017)
• Diabetic Rp, AMD, Venous occlusions
• 5 year Follow Up of BGS patients (Longitudinal / Prospective
Cohort)
Nepal Angle Closure Glaucoma Study
(NACGS, 2012 -2015)
Research
Conclusion
What we know
• Glaucoma blindness will increase with aging population
• PACG causes more visual morbidity than POAG
What we should focus on
• Case Detection & Opportunistic Screening
• Treatment, economics
• Raising awareness on glaucoma
• Training Human Resource
• Research
What we hope to expect
• Cataract intervention programs :
Can it help prevent ACG at its early stage and prevent ACG
blindness?
Tertiary Level
Glaucoma Specialists
General Ophthalmologists
Sub-specialty Service
(programs)
11 CECs
OAs
1 Secondary
Level Hospital
General
Ophthalmologist
2 CEC
OAs
Validate OA Training Programs
Case detect at community level
Promote Awareness
Bauddhanath, Kathmandu, Nepal
2003
One of the first with a Fellowship in Glaucoma in Nepal
• Glaucoma Fellowship at RVEEH, Melbourne
• Prof Hugh Taylor
• Trained under 6 glaucoma specialists in one
institution
• Raising awareness on glaucoma
• Training Human Resource
• Research
What we hope to expect
• Cataract intervention programs
Could it help prevent ACG at its early stage and prevent
ACG blindness?
Achievement
Description 1981 2010
Prevalence of Blindness 0.84 % 0.39 %
Number of Eye Hospital 1 21
PEC/ CEC 0 63
Ophthalmologist 5 147
Cataract Prevalence 72 % 65%
Retinal disorder due to Diabetic NA 10000
Description Existing Required Gap
Ophthalmologist 150 570 420
Optometrist 36 570 534
Ophthalmic Assistant 275 1,140 565
Trained PHC Workers 201* 5,700
Gap of Human Resource
POAG – 2.5%
PACG – 0.4%
(Foster, 1996)
?
?
?
POAG – 2.0%
PACG – 2.5%
(Casson, 2007)
POAG – 2.3%
PACG – 0.5 %
(Casson, 2009)
South Asia
? Glaucoma
Blindness
7.1 %
(2007)
POAG –1.2 %
PACG – 0.4 %
(Thapa, 2010)
• Females, > 60 years of age, short axial lengths
could develop PACG
• LPI, Early cataract extraction
can be considered in high risk patients
POAG – 0.41%
PACG – 4.62%
(Jacob, 1998)
POAG – 1.62%
PACG – 0.9 %
(Vijaya, 2005/6)
POAG – 1.62%
PACG – 1.08%
(Dandona, 2000)
POAG – 1.7%
PACG – 0.5%
(Ramakrishnan, 2003)
India
Glaucoma in India
Estimated burden of disease
• Approximately 11.2 million persons aged > 40 with
glaucoma
• POAG is estimated to affect 6.5 million persons
• PACG is estimated to affect 2.5 million persons
George R et al. J Glaucoma 2010
Demographic Profile
•Total Sample Size : 4800; ≥ 40 years
•Male: Female = 51 : 48 %
•Ethnic Race : Newar, 70 %
Methods
• Applanation tonometry, gonioscopy
• FDP, Dilated pupil examination
• Axial length measurements
• HFA
Thapa SS et al. Clinic Exp Ophthal 2010
POAG
• Prevalence > PACG (BGS)
• VI < PACG
• IOP - > 90 % within normal range (BGS)
- Raised IOP (HBS)
Secondary Glaucoma
• NVG & Lens Induced

Glaucoma.pptx

  • 1.
    Challenges of GlaucomaCare in the Himalayas (Tibet and Nepal) Suman Thapa MD, PhD Kathmandu, Nepal
  • 2.
    Worldwide problem Glaucoma Second leadingcause of blindness after cataract (Resnikoff, WHO 2002) Leading cause of irreversible blindness
  • 3.
    Blindness from Glaucoma •In 2010, it is estimated that glaucoma will affect approximately 60.5 million (Quigley, 2006) – 59 % will be women – 47% will be Asian • Primary open-angle glaucoma → 44.7 million – 55% will be women – 4.5 million will be bilateral blind (about 10%) • Primary angle closure glaucoma → 15.7 million – 70% will be women – 87% will be Asian – 3.9 million will be bilateral blind (about 25%) • Regarding angle closure glaucoma – More devastating and blinding disease → 3x more than POAG (Foster, BJO 2001) – Able to treat the pathophysiological mechanism if detected earlier
  • 4.
    TIBET Blindness and eyediseases inTibet • 15 900 people enumerated (response rate of 79.6%) • Adjusted Prevalence of Blindness (presenting better eyeVA < 6/60) 1.4% • Glaucoma (2.5%). • Cataract (50.7%), Macular degeneration (12.7%) Corneal opacity (9.7%). S Dunzhu et al. Br J Ophthalmol 2003
  • 5.
    NEPAL • Between Chinaand India • Population : 26.6 Million (2011) • Area: 147,181 sq. km • Health Budget: Aprox. 7 % of the total budget • GDP $450
  • 6.
    Causes of Blindness:Population based studies Comparison 1981 and 2010 Catataract 72% Retinal Diseases 3% Glaucoma 3% Trachoma 3% Other infection 3% Trauma 2% Small Pox 2% Nutritional NBS 1981 Cataract 65% Retinal Diseases 9% Cornea 6% Glaucoma 5% Refractive Error 4% ARMD 4% Diabetic Retinopathy 0.2% RAAB 2010
  • 7.
    Human Resource &Eye Care Infrastructure in Nepal 1981 2001 2011 Ophthalmologists 7 78 150 Supporting Medical Staff (Ophthalmic Assistants, Optometrist, Orthoptists, Ophthalmic Nurses, Eye Health Workers, Technicians) 4 325 475 General (admin, managers) 5 45 275 Eye Hospitals 1 16 21 Eye Departments 4 6 17 Community (District) Eye Care Centers 0 25 63 Ratio : Population/Ophthalmologist 2m 0.3 m 0.2 m
  • 8.
    Krishna Gopal Shrestha EyeHospital = 21 Eye Department = 17 Community Eye Centre = 63 EYE CARE INFRASTRUCTURE IN NEPAL
  • 9.
    Understanding the burdenof Glaucoma Hospital Based Data (2011) Results from a Population Based Study (2010) • Clinical Information from these data and the Implications • Challenges & Strategies adopted
  • 10.
    Glaucoma Diagnoses (1 year) 2011 Hospital Based Data FAR WEST (GETA) MIDWEST (NGJ) WEST #(LEI) CENTRAL (TIO) EAST (LAHAN) POAG 459 (48.1) 435(48.6) 319 (30.5) 246 (38.2) 1110( 39.4) PACG 99 (10.4) 297 (33.2) 499 (47.8) 218 (32 ) 899 (32.0) Sec G 377 (39.6) 163 (18.2) 210 (20.2) 86 (19.4) 422 (15.0) CG 19 (1.9) - 15 (1.5) 28 (11.4) 28 (14.0) PACG = POAG
  • 11.
    POAG PACG Number 246( 38.2 % ) 218 ( 32 % ) AGE 65.8 54.6 SEX M > F F > M IOP 31.4 38.1 CDR 0.6 0.8 VF DEFECTS 82.5 % - VA > 6/36 (85%) (both eyes) < 3/60 (85.5 %) (worse eye) DATA from Tilganga Institute of Ophthalmology, Kathmandu (2011) 79 % PACG were asymptomatic; Sec Glaucoma: NVG
  • 12.
    Population Studies forBlindness • Designed specifically to estimate the causes of avoidable blindness: (Cataract, Trachoma, Vitamin A def, Trauma) • The NBS 1981 / RAAB 2010 estimated that glaucoma accounted for 3.8 % & 5.0 % of the total blindness (underestimation, design)
  • 13.
    • Population basedcross sectional study • ISGEO definitions for glaucoma Represents a district in Nepal Bhaktapur Glaucoma Study, Nepal (2007- 2010)
  • 14.
    Results • Prevalence 1.8% (95% CI = 1.68 – 1.92) • POAG (1.2 %) > PACG (0.4 %) • Age was a RF (2.4 % : 60-69 years; 10.3% : > 80 years) • No difference in gender • Myopia , HTN, DM were not RFs for POAG Thapa SS et al. Ophthalmology 2012
  • 15.
    Prevalence of Glaucomain South Asia Prevalence % Study Population Age All POAG PACG Ratio of POAG to PACG Bangladesh, Dhaka 40 + 3.1 2.5 0.4 6.3 West Bengal, East India 50 + 3.3 3.1 0.2 10.00 ACES, South India 40 + 2.6 1.2 0.5 2.4 APEDS, South India 40 + - 2.6 1.1 2.4 CGS, South India 40 + - 1.6 0.9 1.4 Sri Lanka 40 + 1.0 2.3 0.5 4.6 Burma 40 + - 2.0 2.5 0.8 BGS, Nepal 40 + 1.8 1.2 0.4 3.0 ACES: Aravind Comprehensive Eye Survey APEDS: Andhra Pradesh Eye Disease Study CGS: Chennai Glaucoma Study BGS: Bhaktapur Glaucoma Study
  • 16.
    Comparison Age, Sex, IOP,CCT and vCDR Characteristics Normal POAG P value PACG P value Age 54.60 ( ± 0.20) 68.53 ( ± 1.63) < 0.001 71.24 ( ± 1.67) < 0.001 Sex, M / F 1695 / 1994 26/25 0.483 4/13 0.086 IOP 13.30 ( ± 0.04) 13.57 ( ± 0.34) 0.400 16.00 ( ± 1.11) < 0.001 CCT 537.88 ( ± 0.60) 527.73 ( ± 4.58) 0.053 552.12 ( ± 45.65) 0.11 VCDR 0.26 ( ± 0.002) 0.62 ( ± 0.02) < 0.001 0.55 ( ± 0.05) < 0.001 M: Male, F: Female, IOP: Intraocular pressure, CCT: Central Corneal Thickness, VCDR: Vertical Cup Disc Ratio
  • 17.
    Ocular Biometric Measures Differentpopulation based studies Nepalese (n = 685) South Indian (n = 419) Chinese (n = 531) White Americans (n = 170) African- Americans (n = 188) Sex (M : F) 315 : 370 210: 209 236 : 295 82 : 88 55 : 133 Axial length (mm), mean (SD) 22.62 (0.90) 22.76(0.78) 23.32(1.38) 23.35(1.38) 23.14(0.87) 95% CI difference in means - 0.24 to - 0.03 - 0.83 to - 0.57 - 0.90 to - 0.56 - 0.66 to - 0.37 p- value 0.008 < 0.001 < 0.001 < 0.001 . Thapa SS et al. Optometry and Visual Science 2011
  • 18.
    Demographics of GlaucomaCases All (n) Males (n) Females (n) M:F Ratio Median Age Previously Diagnosed (%) POAG 51 26 25 1.04 68.53 2 (3.92) PACG 17 4 13 0.30 71.23 5 (29.41) Secondary Glaucoma 7 6 1 6.0 64.00 4 (57.14) Total 75 36 39 0.92 70.00 11 (14.67) POAG: Primary- open angle glaucoma, PACG: Primary-angle closure glaucoma ISGEO Diagnostic Category (%) 1: Structural and functional evidence 2. Advanced structural damage where reliable field testing is not possible 3. Optic disc not seen due of media opacity, the IOP > 99.5th percentile, evidence of filtering surgery 1 2 3 POAG 45 (88.24) 5 (9.80) 1 (1.96) PACG 12 (70.59) 5 (29.41) 0 (0.00) Sec Gl 2 (28.57) 4 (57.14) 1 (14.29) Total 59 (78.67%) 14 (18.67) 2 (2.66)
  • 19.
    Visual Acuity Distributionof Glaucoma Cases N Visual Acuity Normal vision (%) Low vision (%) Bindness (%) Age group 40 - 49 Year 4 3 (75.0) 1 (25.0) 0 (0.0) 50 - 59 Year 10 8 (80.0) 2 (20.0) 0 (0.0) 60 - 69 Year 20 15 (75.0) 2 (10.0) 3 (15.0) 70 - 79 Year 31 17 (54.8) 7 (22.6) 7 (22.6) ≥ 80 Year 10 5 (50.0) 1 (10.0) 4 (40.0) Sex Male 36 24 (66.7) 5 (13.9) 7 (19.4) Female 39 24 (61.5) 8 (20.5) 7 (18.0) Types of Glaucoma POAG 51 38 (74.5) 6 (11.8) 7 (13.7) PACG 17 10 (58.8) 4 (23.5) 3 (17.7) Secondary Glaucoma 7 0 (0.0) 3 (42.9) 4 (57.1) All 75 48 (64.0) 13 (17.3) 14 (18.7) Low vision has been defined as a best corrected VA of less than 6/ 18 (20/60, 0.3), but not less than 3/60 (20/400, 0.05) in the better eye. Visual acuity was based on the eye with glaucoma in unilateral cases and on the better eye in bilateral cases.
  • 20.
  • 21.
    •Normal IOP ≈13 mmHg 18 mmHg should be considered on the higher side •Normal v CDR 0.2 0.7 should be viewed with suspicion •CCT influences the measurement of IOP
  • 22.
    • 85.7 %had IOP within the normal range • 79 % had visual field defects at the time of diagnosis • 96 % had not previously been diagnosed • Angle closure glaucoma > 70 % asymptomatic • > 90 % were not aware of Glaucoma
  • 23.
    • Glaucoma 5.2%total blindness ( > the estimate of 1981 NBS: 3.8 % ) • Visual morbidity PACG > POAG (3 X )
  • 24.
    Prevalence of Glaucomain Bhaktapur district Represents primarily a ‘ Newari ’ ethnic race Although the ‘ Newari ’ race constitute a large proportion of the countries population, the results from the BGS does not represent the epidemiology of glaucoma in Nepal
  • 25.
    Target population >60 years, ‘Opportunistic screening ‘ cataract screening programs •Optic discs have to be examined (0.7 VCDR) •Short axial lengths noted during Biometry for cataract surgery, should undergo gonioscopy •Measuring IOP has a limited role . Thapa SS et al. BMC Ophthalmology 2008 Separate screening programs for glaucoma are not necessary in Bhaktapur
  • 26.
    • Majority (70% ) were asymptomatic (HBS , BGS) Gonioscopy has to be performed for correct diagnosis • High Risk Patients (HBS, BGS) Females > 50 years, short axial lengths • Severe visual impairment at presentation (HBS) ( >> POAG) PACG
  • 27.
    • Role ofthe lens / formation of cataract in the pathogenesis of PACG has to be considered (BGS) • Early cataract removal may prevent progression to / of PACG in high risk patients
  • 28.
  • 29.
    Burden of Blindnessfrom Glaucoma in Nepal • 88,800 Nepalese 30 years and older have definite glaucoma • Three times more = glaucoma suspects • Almost 400,000 Nepalese have definite or probable glaucoma 2010 Nepal Mid Term Report, Vision 2020
  • 30.
    • Aging Population •Geographic terrain • Limited Human Resource • Poverty, Illiteracy • Glaucoma, the disease Challenges
  • 31.
    Training Programs forGlaucoma Ophthalmologist • Residency Program (1994): University Hospital • Short - term observer training (2005) – 1 month • Glaucoma Fellowship (2013) – 1 year
  • 32.
    OphthalmicAssistantTraining Program (2001) •3 years • ( ? additional glaucoma training) OA GlaucomaTraining Program (2004) • 20 OAs from several community eye centers affiliated to secondary eye hospitals • 5 days training,Tertiary Eye Centre • Glaucoma diagnosis, IOP measurement, Optic disc photos,VFs
  • 33.
    Objective • Detect glaucoma& refer patients to the secondary eye hospitals FAILED • Training duration : short • Problems in monitoring the outcome after the training  Redesigning the training program To start with OAs working in CECs belonging to our institute Longer duration of training
  • 34.
    Screening Large Population Screening •Costs , Infrastructure • Tools for screening Case Detection / Opportunistic Screening
  • 35.
    Opportunistic screening in1 day cataract screening clinics in the villages (2006) Clinic 1 Clinic 2 Clinic 3 Total number 318 180 298 ≥ 50 years 99 (31%) 85(47%) 99 (33%) POAG 2 1 3 PACG 2 1 2 SUSPECTS 10 6 7 Suspects attended hospital 8 6 7 Suspects diagnosed 2 1 1
  • 37.
    Treatment • Beta blockers:1st line of treatment • Additional drugs: Issues regarding costs • Primary Surgery Ask patients about affordability
  • 38.
    Glaucoma Education &Awareness Programs (2003) • Glaucoma Support Group Activities - 6 education classes / year • Annual Glaucoma Awareness Week - Free investigations and treatment - Information Booklets
  • 39.
    Impact of GSGand Awareness Programs (2004- 2011) 0 100 200 300 400 500 600 700 800 2004 2005 2006 2007 2008 2009 2010 2011 Patients registered Patients Examined (New) New Diagnosis Old Patients Total Pts. Examined Total number of patients examined during Glaucoma Awareness Week Financial support extended by patients attending support group classes towards the treatment of patients Number of participants during patient education programs
  • 40.
    • 3 yearProspective, Surgical Trial • To evaluate the outcomes of Cataract removal vs. Trabeculectomy or Combined surgery in the treatment of ACG Bhaktapur Retinal Study (BRS, 2013- 2017) • Diabetic Rp, AMD, Venous occlusions • 5 year Follow Up of BGS patients (Longitudinal / Prospective Cohort) Nepal Angle Closure Glaucoma Study (NACGS, 2012 -2015) Research
  • 41.
    Conclusion What we know •Glaucoma blindness will increase with aging population • PACG causes more visual morbidity than POAG What we should focus on • Case Detection & Opportunistic Screening • Treatment, economics
  • 42.
    • Raising awarenesson glaucoma • Training Human Resource • Research What we hope to expect • Cataract intervention programs : Can it help prevent ACG at its early stage and prevent ACG blindness?
  • 43.
    Tertiary Level Glaucoma Specialists GeneralOphthalmologists Sub-specialty Service (programs) 11 CECs OAs 1 Secondary Level Hospital General Ophthalmologist 2 CEC OAs Validate OA Training Programs Case detect at community level Promote Awareness
  • 44.
  • 45.
    2003 One of thefirst with a Fellowship in Glaucoma in Nepal • Glaucoma Fellowship at RVEEH, Melbourne • Prof Hugh Taylor • Trained under 6 glaucoma specialists in one institution
  • 46.
    • Raising awarenesson glaucoma • Training Human Resource • Research What we hope to expect • Cataract intervention programs Could it help prevent ACG at its early stage and prevent ACG blindness?
  • 47.
    Achievement Description 1981 2010 Prevalenceof Blindness 0.84 % 0.39 % Number of Eye Hospital 1 21 PEC/ CEC 0 63 Ophthalmologist 5 147 Cataract Prevalence 72 % 65% Retinal disorder due to Diabetic NA 10000 Description Existing Required Gap Ophthalmologist 150 570 420 Optometrist 36 570 534 Ophthalmic Assistant 275 1,140 565 Trained PHC Workers 201* 5,700 Gap of Human Resource
  • 48.
    POAG – 2.5% PACG– 0.4% (Foster, 1996) ? ? ? POAG – 2.0% PACG – 2.5% (Casson, 2007) POAG – 2.3% PACG – 0.5 % (Casson, 2009) South Asia ? Glaucoma Blindness 7.1 % (2007) POAG –1.2 % PACG – 0.4 % (Thapa, 2010)
  • 49.
    • Females, >60 years of age, short axial lengths could develop PACG • LPI, Early cataract extraction can be considered in high risk patients
  • 50.
    POAG – 0.41% PACG– 4.62% (Jacob, 1998) POAG – 1.62% PACG – 0.9 % (Vijaya, 2005/6) POAG – 1.62% PACG – 1.08% (Dandona, 2000) POAG – 1.7% PACG – 0.5% (Ramakrishnan, 2003) India
  • 51.
    Glaucoma in India Estimatedburden of disease • Approximately 11.2 million persons aged > 40 with glaucoma • POAG is estimated to affect 6.5 million persons • PACG is estimated to affect 2.5 million persons George R et al. J Glaucoma 2010
  • 52.
    Demographic Profile •Total SampleSize : 4800; ≥ 40 years •Male: Female = 51 : 48 % •Ethnic Race : Newar, 70 %
  • 53.
    Methods • Applanation tonometry,gonioscopy • FDP, Dilated pupil examination • Axial length measurements • HFA Thapa SS et al. Clinic Exp Ophthal 2010
  • 54.
    POAG • Prevalence >PACG (BGS) • VI < PACG • IOP - > 90 % within normal range (BGS) - Raised IOP (HBS) Secondary Glaucoma • NVG & Lens Induced