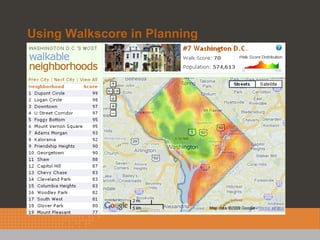
Getting to Walkability- Using Walk Score as
Planning Metric and Goal

February 4, 2010
Harriet Tregoning
District of Columbia Office of Planning
Attributes of a Globally Competitive City/Region


                                                   2
Attributes of a Globally Competitive City/Region


                                                   3
DC, an emerging transportation and
livability leader- “Alternative” transportation
no longer
   •Walk/bike/transit/carpool commuting share > 50%
   •SmartBikes bike sharing going from 100 -1000 bikes
    this year
   •2nd in rail ridership – 1 million daily riders
   •1st in number of walkable places per capita (12% of
    residents walk to work)
Percent
                                 3G
Census                                      4A         4B

Households                3E     3F
                                                      4D

with No Cars                                     4C
                                                                    5A
                                 3C        1D 1A
(By Census          3D
                           3B              1C     1B
                                                            5C

Block Group)                          2D                               5B
                                2E         2B        2C
                                                2F                                  7D
                                                           6C                                 7C
                                                                  6A
                                      2A
                                                                 6B              7A
                                                                                           7E
                                                      6D
                                                                               7B
                                                                    8A
                                                                         8B
                                                       8C
                                                                  8E
               Legend
                  ANCs
           Pct No Car - Census
           Pct No Car - Census
                  0-20
                                                  8D
                  20-30
                  30-40
                  40-60                           Source data from DMV Destiny system, extract as of June 30, 2005.
                                                    Only active registration records and driver licenses included.
                  60-85                                          Commercial vehicles excluded.
Promoting Healthy Built Environments
in DC: Walkable Urbanity
Walkable Urbanity
Many parts of the District are designed to
encourage walking and active lifestyles:

    •Compact development

    •Interesting streetscape & public realm

    •Notable historic character

    •Great destinations including shopping
    districts, parks and recreation centers

    •Safe pathways
How could we walk more?
• Half the trips we make are less than three
  miles;
• 40 percent are less than two miles;
• 28 percent are less than one mile ; and
• 13.7% are less than a half mile.
• Yet 75 percent of trips of less than one
  mile are made by car.


                   Sources: National Household Travel Survey, 1995. 2001-2002, US FHA; National Walking and
                   Bicycling Study, Environmental Building News, Aug 2007, Driving to Green Buildings: The

                   Transportation Energy Intensity of Buildings                                       8
Using Walkscore in Planning
Walkscore & Affordability


Monthly transportation costs in $ terms can be
as much as 300% greater between a location
efficient neighborhood and an auto dependent
neighborhood

Walk Score out of 100:
2000 14th St NW, Washington, DC = 94
3400 Mt Burnside, Dale City, VA = 45

                                                 Source: http://htaindex.cnt.org/
Walkscore & Retail Attraction
  • Capturing the revenue potential of
    “walkers” by changing the metric
    larger regional and national retailers
    use evaluate potential sites
  • In Washington, DC almost 20% of
    daily trips are taken by transit, and
    nearly 30% of trips are on foot, bike,
    or school bus
  • Relying on automobile traffic
    volumes to evaluate a potential site
    in an urban area may underestimate
    demand and potential revenue.


                                             11
Walkscore & Regional Planning

Regional Activity
Centers
  •Urban Core
  •Mixed Use Centers
  •Employment
  Centers
  •Suburban
  Employment
  Centers
  •Emerging
  Employment
  Centers


                                  12
Walkscore & Regional Planning:
Tyson’s Corner (Walkscore = 80)


   Current                  Proposed


                                       13
Walkscore & Neighborhood Planning –
    Bellevue Revitalization Plan
• 0% of residents live within a 15 min walk of a
  Metro station
• 0% of residents live within a 15 min walk of a full
  service grocery store
• 0% of residents live within a 15 min walk of a
  Smart Bike station
• 88% of residents live within a 15 min walk of a
  Car Sharing location
• 3.7% of residents walk to work
• 99% of residents within 15 min walk of a park


                                                        14
15
Towards a “Walkers Paradise” –
    Bellevue Plan Recommendations
• Develop three underutilized nodes with a mix
  of uses
• Increase density to support neighborhood
  serving retail
• Attract grocery tenant
• Recruit stores to participate as members of
  the Healthy Corner Store Program
• Encourage local businesses to participate in a
  cooperative buying agreement with the Ward
  8 Farmers market for distribution of fresh,
  healthy food options
• Improve walking paths and recreation
  offerings
Other Uses of Walkscore
 •Underwriting criteria
 •Tracking plan implementation progress
 •Shorthand for regional progress
 •Employer recruiting tool


                                          17
For more information

  Harriet Tregoning
  Director
  District of Columbia Office of Planning
  2000 14th Street NW
  Suite 4000
  Washington DC 20009
  202-442-7600
  harriet.tregoning@dc.gov

Getting To Walkability

  • 1.
    Getting to Walkability-Using Walk Score as Planning Metric and Goal February 4, 2010 Harriet Tregoning District of Columbia Office of Planning
  • 2.
    Attributes of aGlobally Competitive City/Region 2
  • 3.
    Attributes of aGlobally Competitive City/Region 3
  • 4.
    DC, an emergingtransportation and livability leader- “Alternative” transportation no longer •Walk/bike/transit/carpool commuting share > 50% •SmartBikes bike sharing going from 100 -1000 bikes this year •2nd in rail ridership – 1 million daily riders •1st in number of walkable places per capita (12% of residents walk to work)
  • 5.
    Percent 3G Census 4A 4B Households 3E 3F 4D with No Cars 4C 5A 3C 1D 1A (By Census 3D 3B 1C 1B 5C Block Group) 2D 5B 2E 2B 2C 2F 7D 6C 7C 6A 2A 6B 7A 7E 6D 7B 8A 8B 8C 8E Legend ANCs Pct No Car - Census Pct No Car - Census 0-20 8D 20-30 30-40 40-60 Source data from DMV Destiny system, extract as of June 30, 2005. Only active registration records and driver licenses included. 60-85 Commercial vehicles excluded.
  • 6.
    Promoting Healthy BuiltEnvironments in DC: Walkable Urbanity
  • 7.
    Walkable Urbanity Many partsof the District are designed to encourage walking and active lifestyles: •Compact development •Interesting streetscape & public realm •Notable historic character •Great destinations including shopping districts, parks and recreation centers •Safe pathways
  • 8.
    How could wewalk more? • Half the trips we make are less than three miles; • 40 percent are less than two miles; • 28 percent are less than one mile ; and • 13.7% are less than a half mile. • Yet 75 percent of trips of less than one mile are made by car. Sources: National Household Travel Survey, 1995. 2001-2002, US FHA; National Walking and Bicycling Study, Environmental Building News, Aug 2007, Driving to Green Buildings: The Transportation Energy Intensity of Buildings 8
  • 9.
  • 10.
    Walkscore & Affordability Monthlytransportation costs in $ terms can be as much as 300% greater between a location efficient neighborhood and an auto dependent neighborhood Walk Score out of 100: 2000 14th St NW, Washington, DC = 94 3400 Mt Burnside, Dale City, VA = 45 Source: http://htaindex.cnt.org/
  • 11.
    Walkscore & RetailAttraction • Capturing the revenue potential of “walkers” by changing the metric larger regional and national retailers use evaluate potential sites • In Washington, DC almost 20% of daily trips are taken by transit, and nearly 30% of trips are on foot, bike, or school bus • Relying on automobile traffic volumes to evaluate a potential site in an urban area may underestimate demand and potential revenue. 11
  • 12.
    Walkscore & RegionalPlanning Regional Activity Centers •Urban Core •Mixed Use Centers •Employment Centers •Suburban Employment Centers •Emerging Employment Centers 12
  • 13.
    Walkscore & RegionalPlanning: Tyson’s Corner (Walkscore = 80) Current Proposed 13
  • 14.
    Walkscore & NeighborhoodPlanning – Bellevue Revitalization Plan • 0% of residents live within a 15 min walk of a Metro station • 0% of residents live within a 15 min walk of a full service grocery store • 0% of residents live within a 15 min walk of a Smart Bike station • 88% of residents live within a 15 min walk of a Car Sharing location • 3.7% of residents walk to work • 99% of residents within 15 min walk of a park 14
  • 15.
  • 16.
    Towards a “WalkersParadise” – Bellevue Plan Recommendations • Develop three underutilized nodes with a mix of uses • Increase density to support neighborhood serving retail • Attract grocery tenant • Recruit stores to participate as members of the Healthy Corner Store Program • Encourage local businesses to participate in a cooperative buying agreement with the Ward 8 Farmers market for distribution of fresh, healthy food options • Improve walking paths and recreation offerings
  • 17.
    Other Uses ofWalkscore •Underwriting criteria •Tracking plan implementation progress •Shorthand for regional progress •Employer recruiting tool 17
  • 18.
    For more information Harriet Tregoning Director District of Columbia Office of Planning 2000 14th Street NW Suite 4000 Washington DC 20009 202-442-7600 harriet.tregoning@dc.gov