
Download to read offline
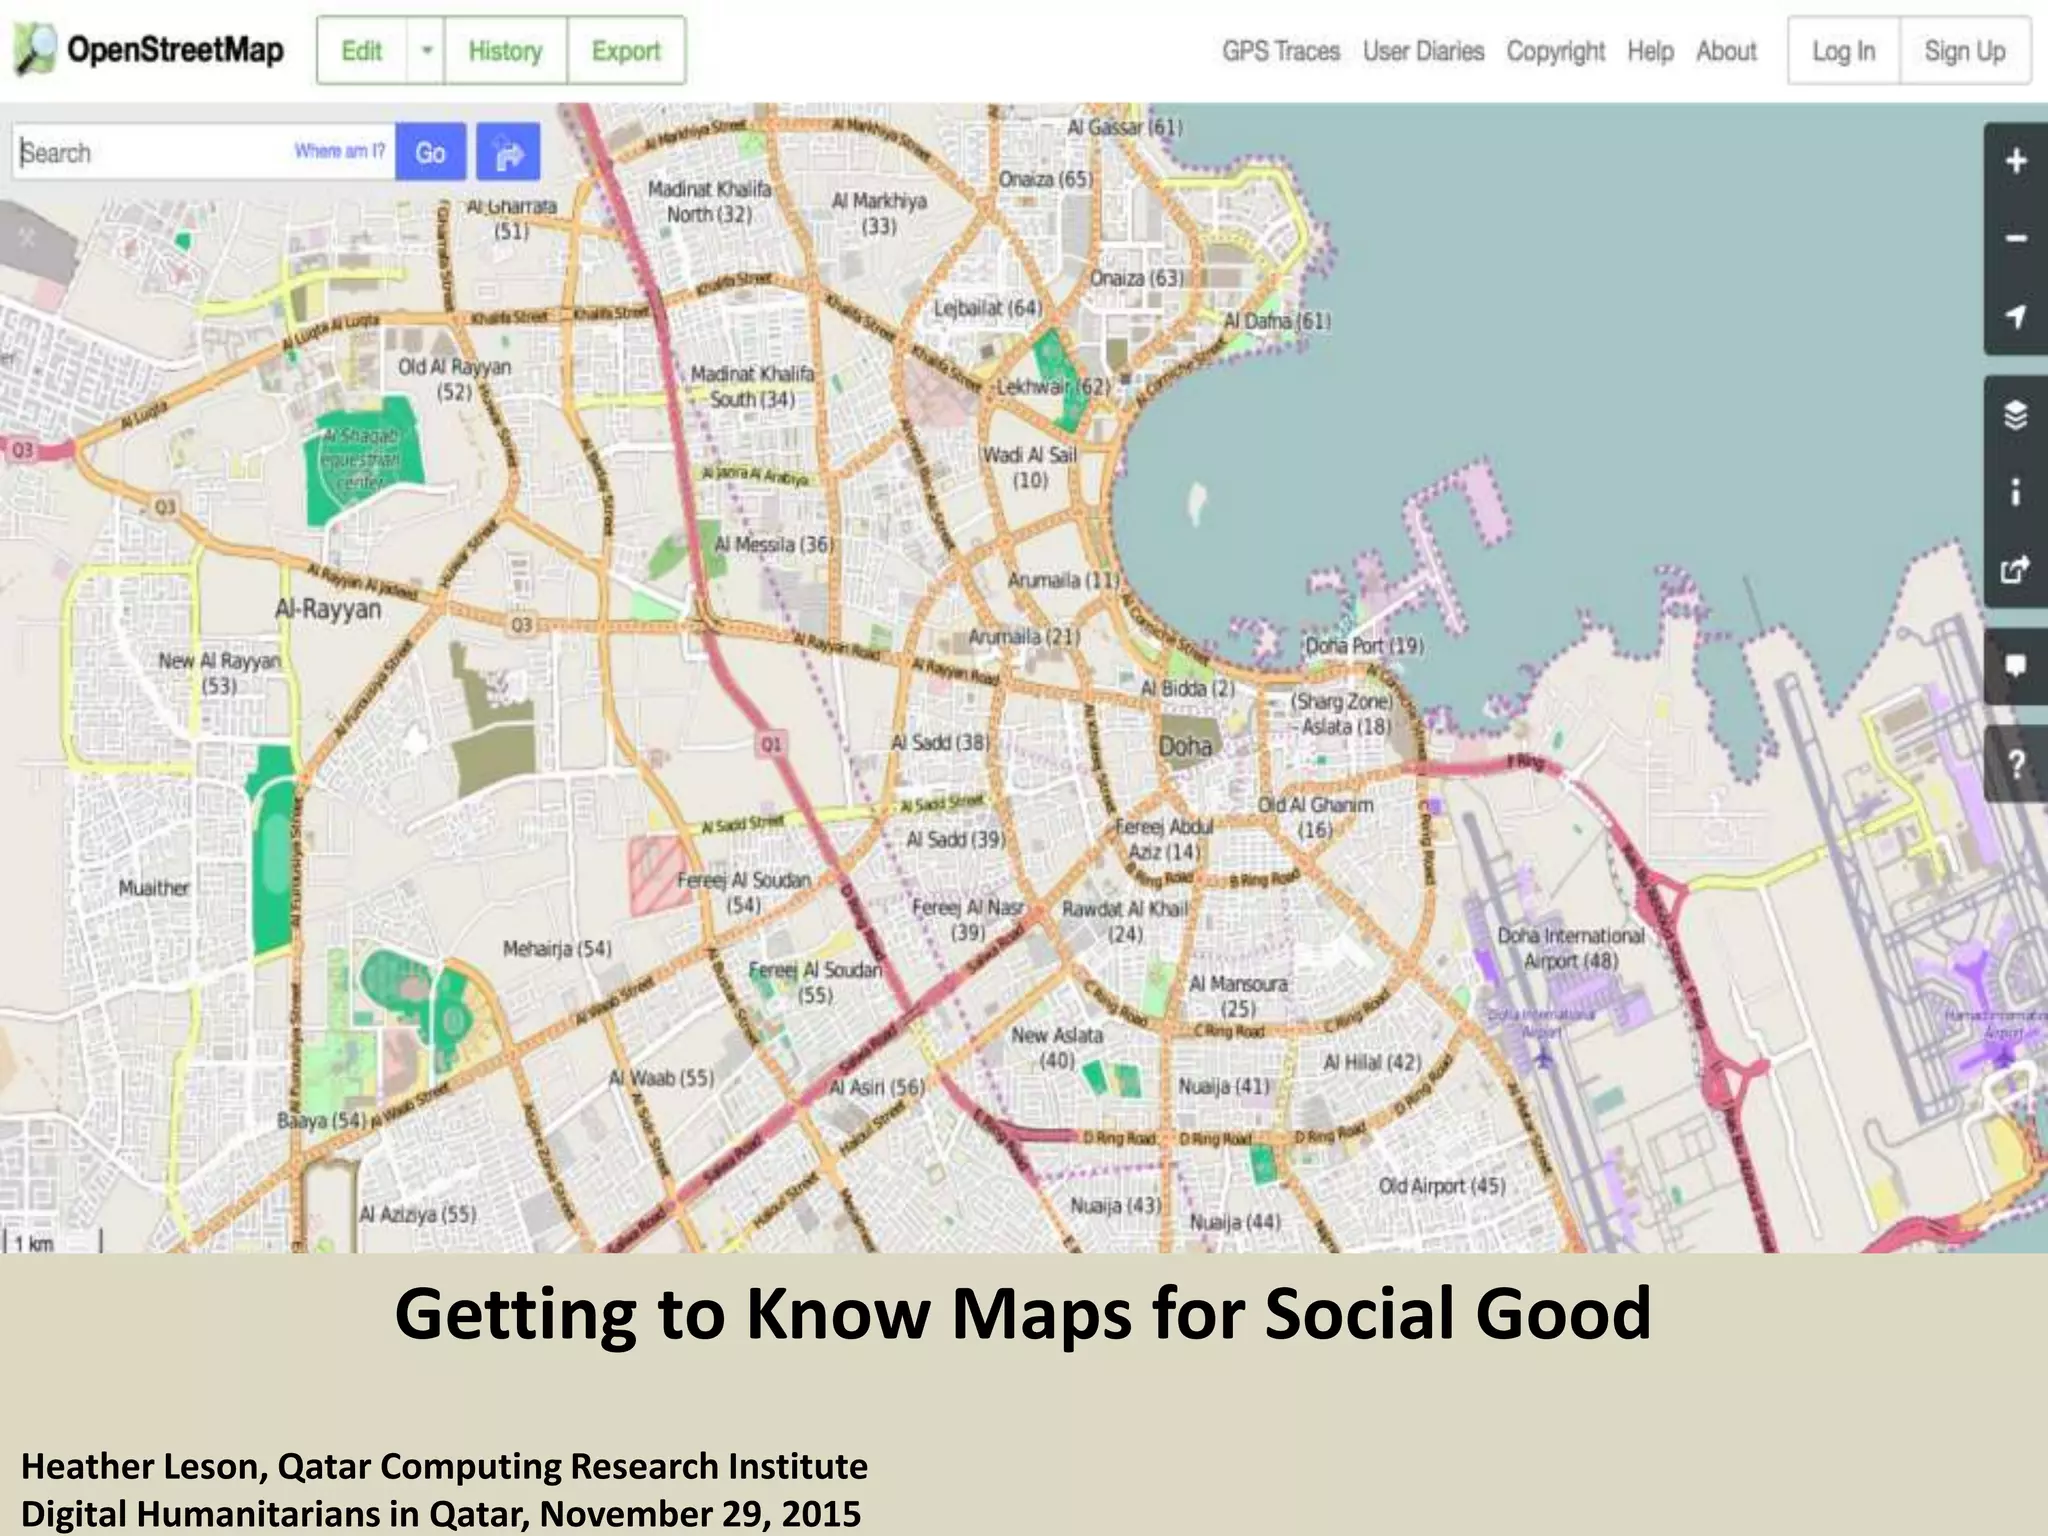
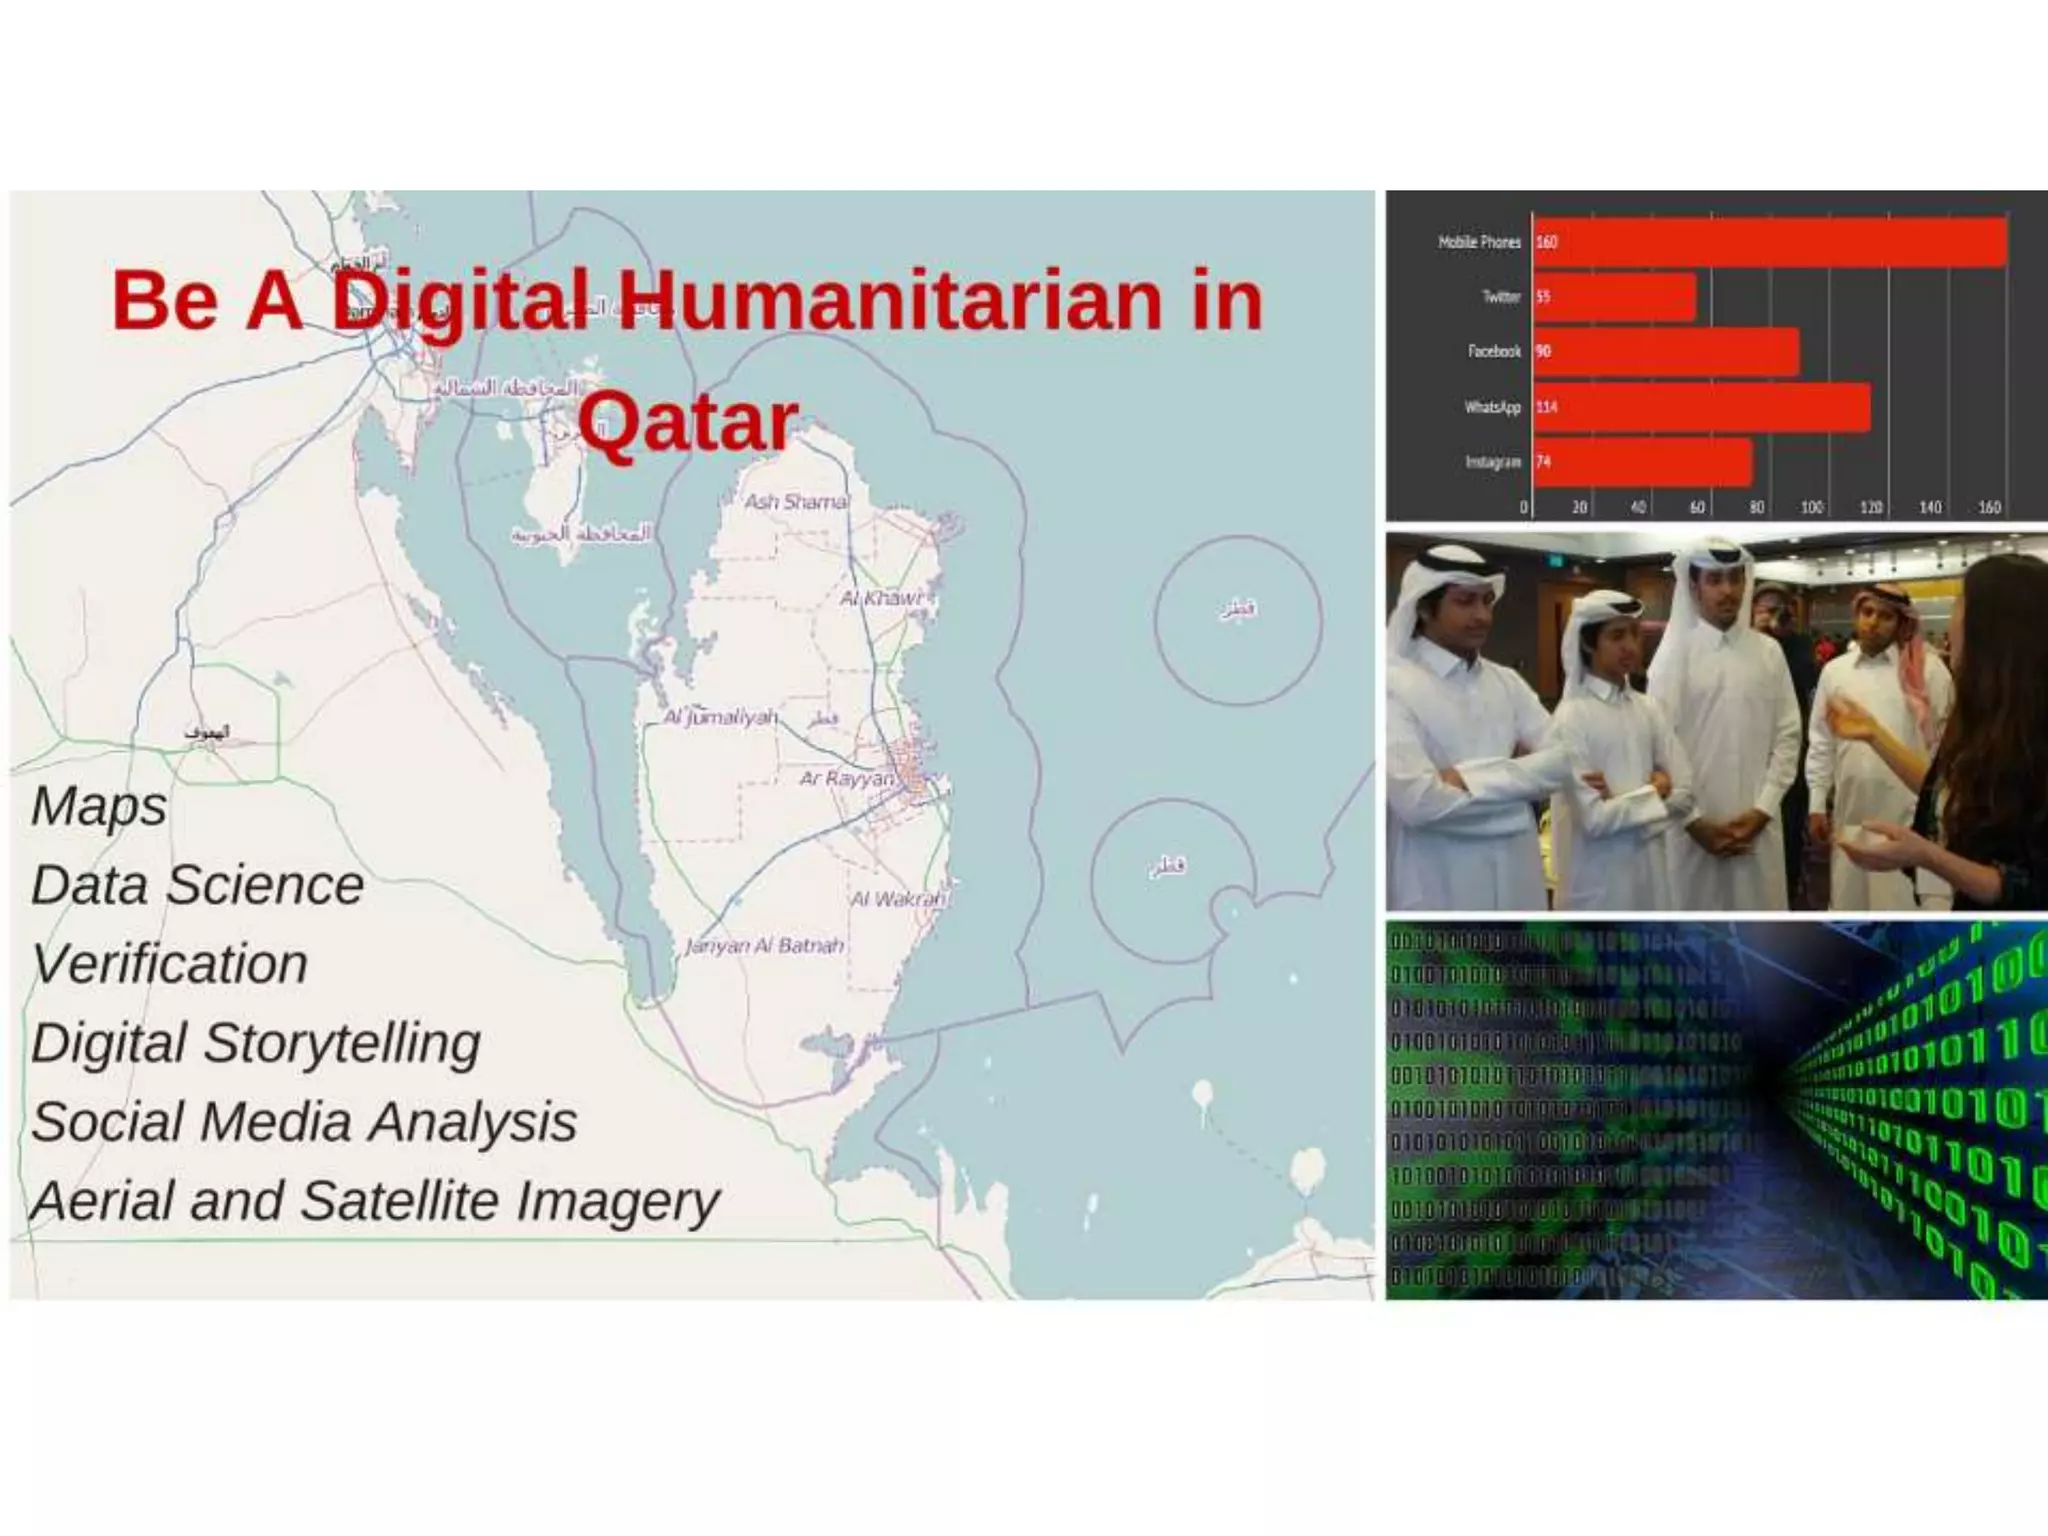
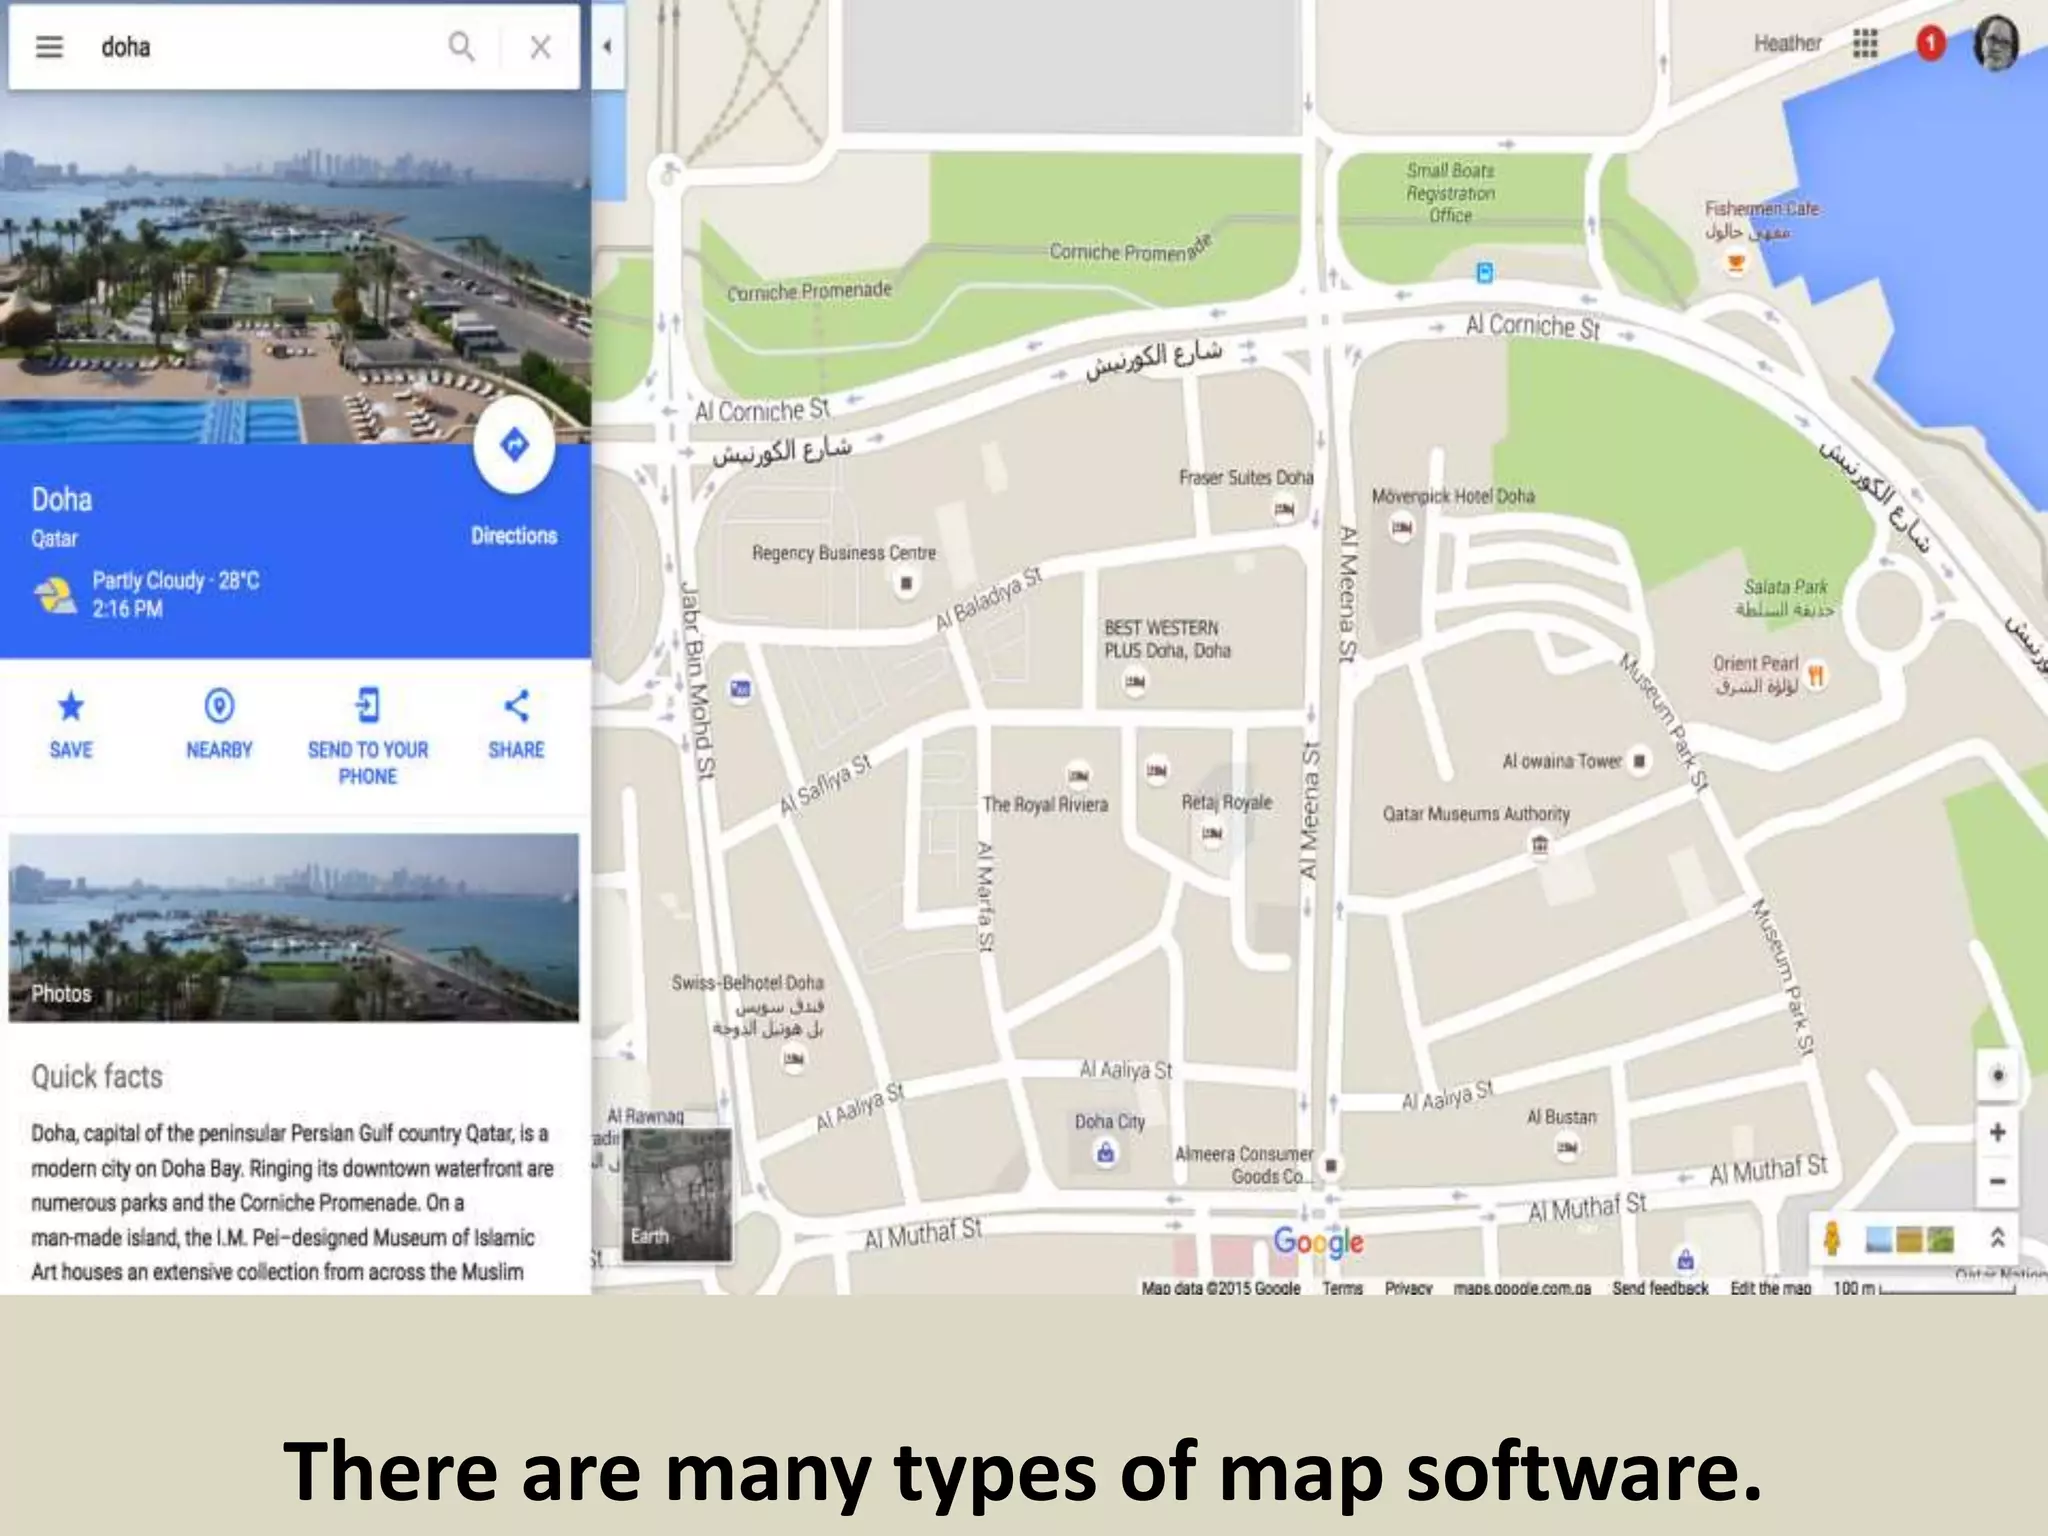
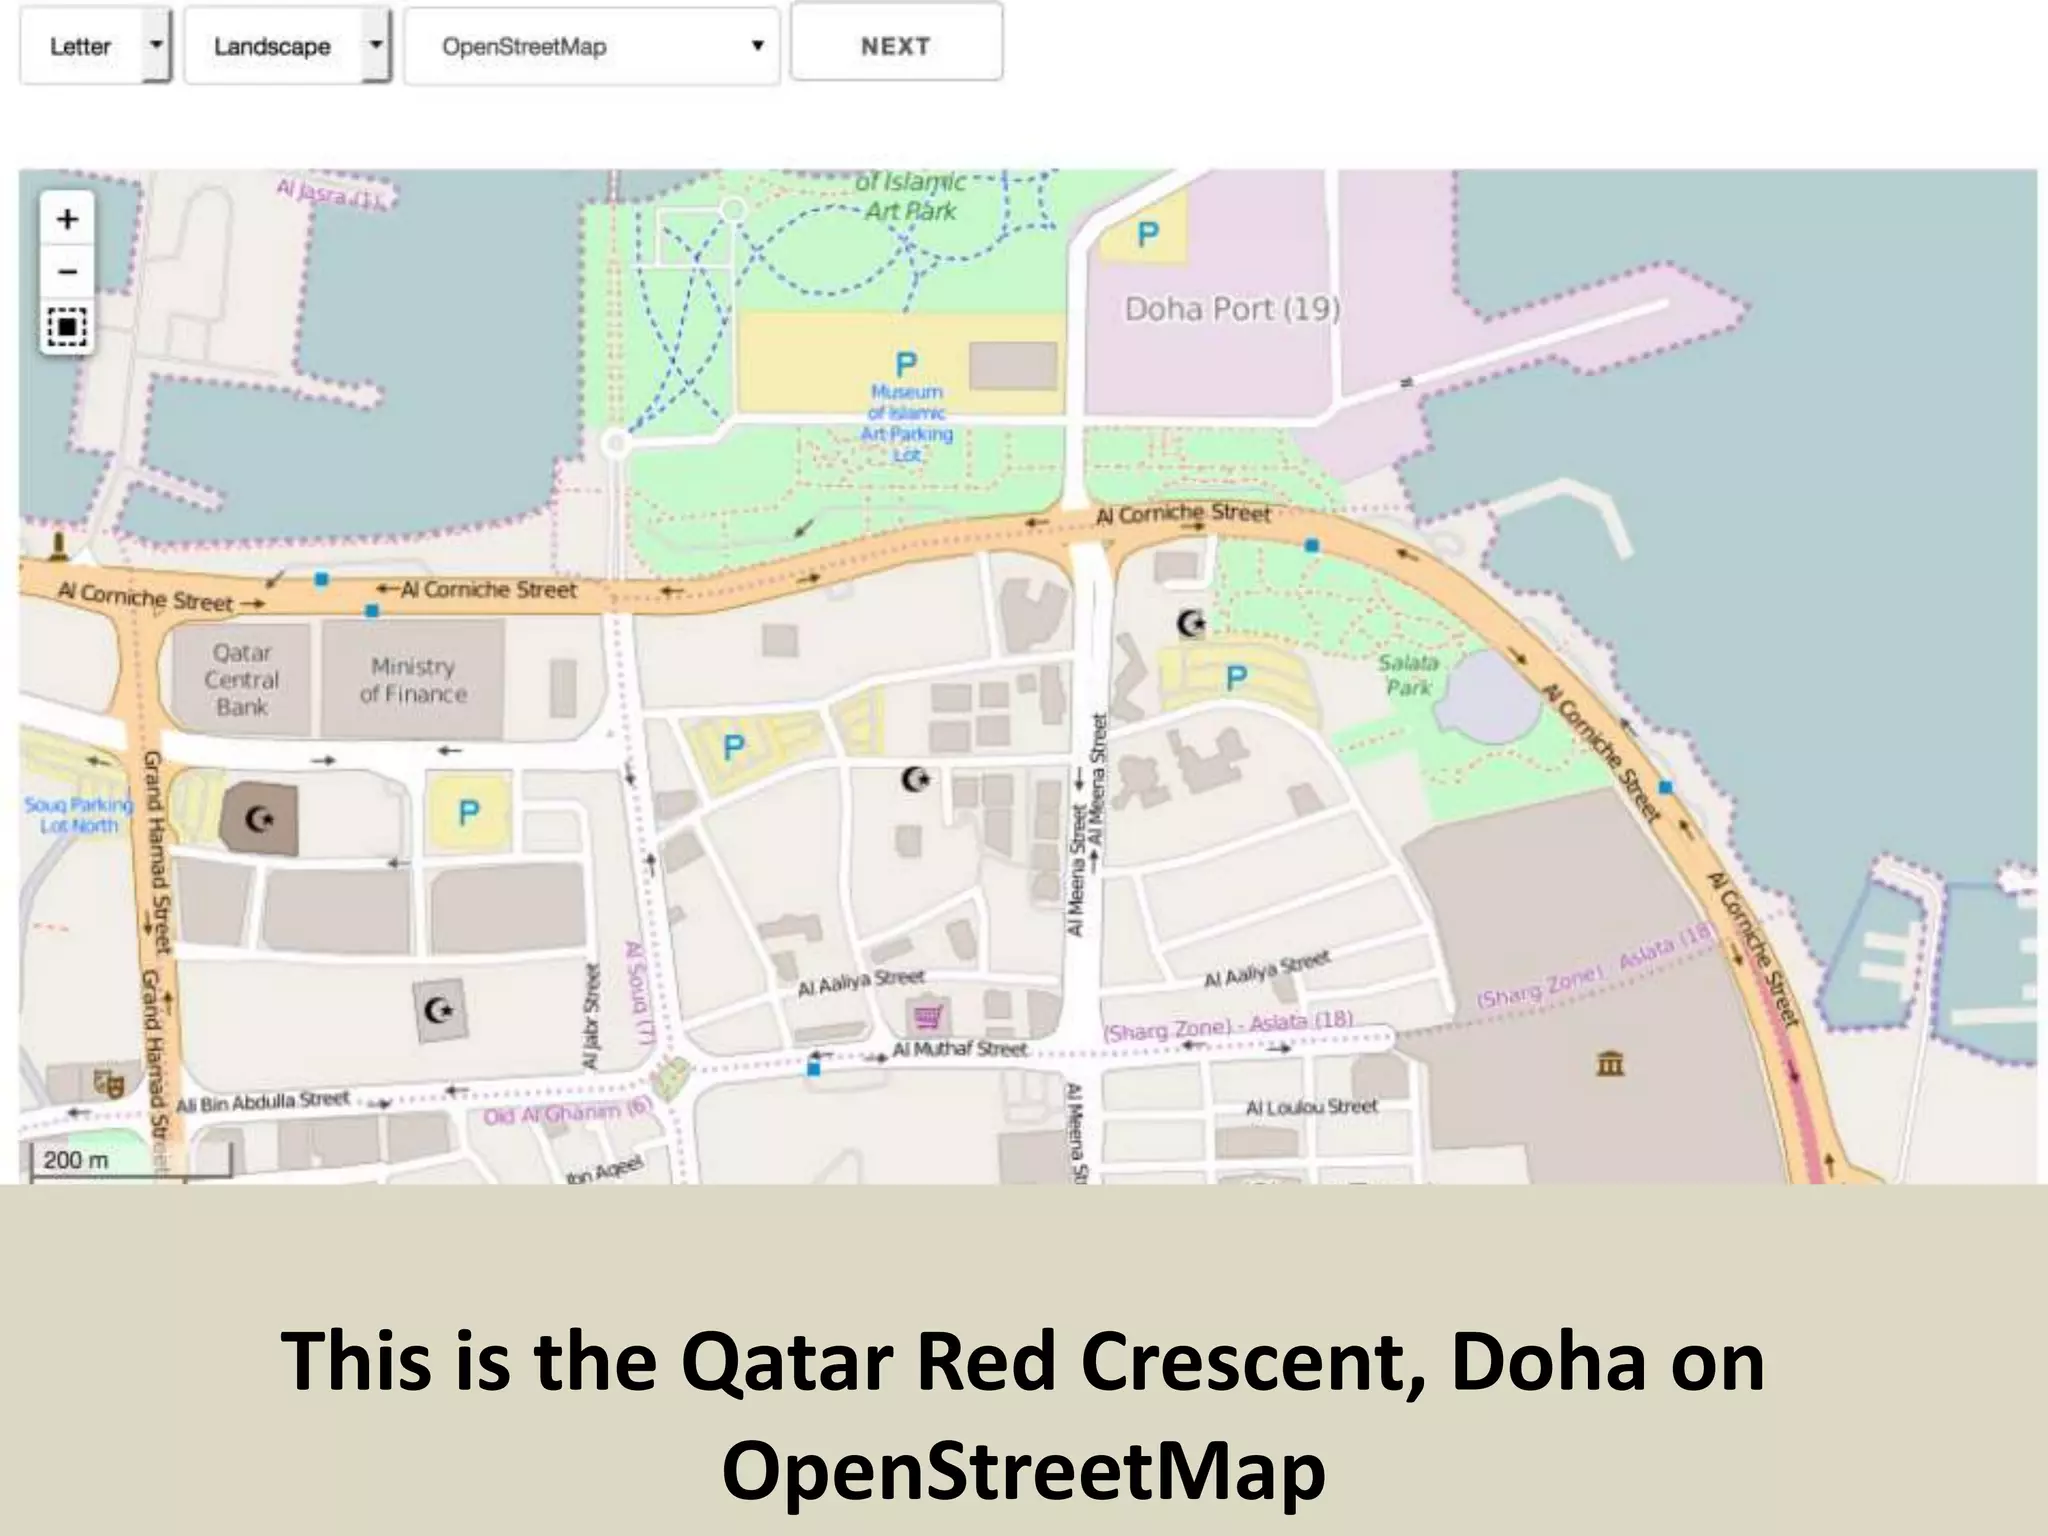
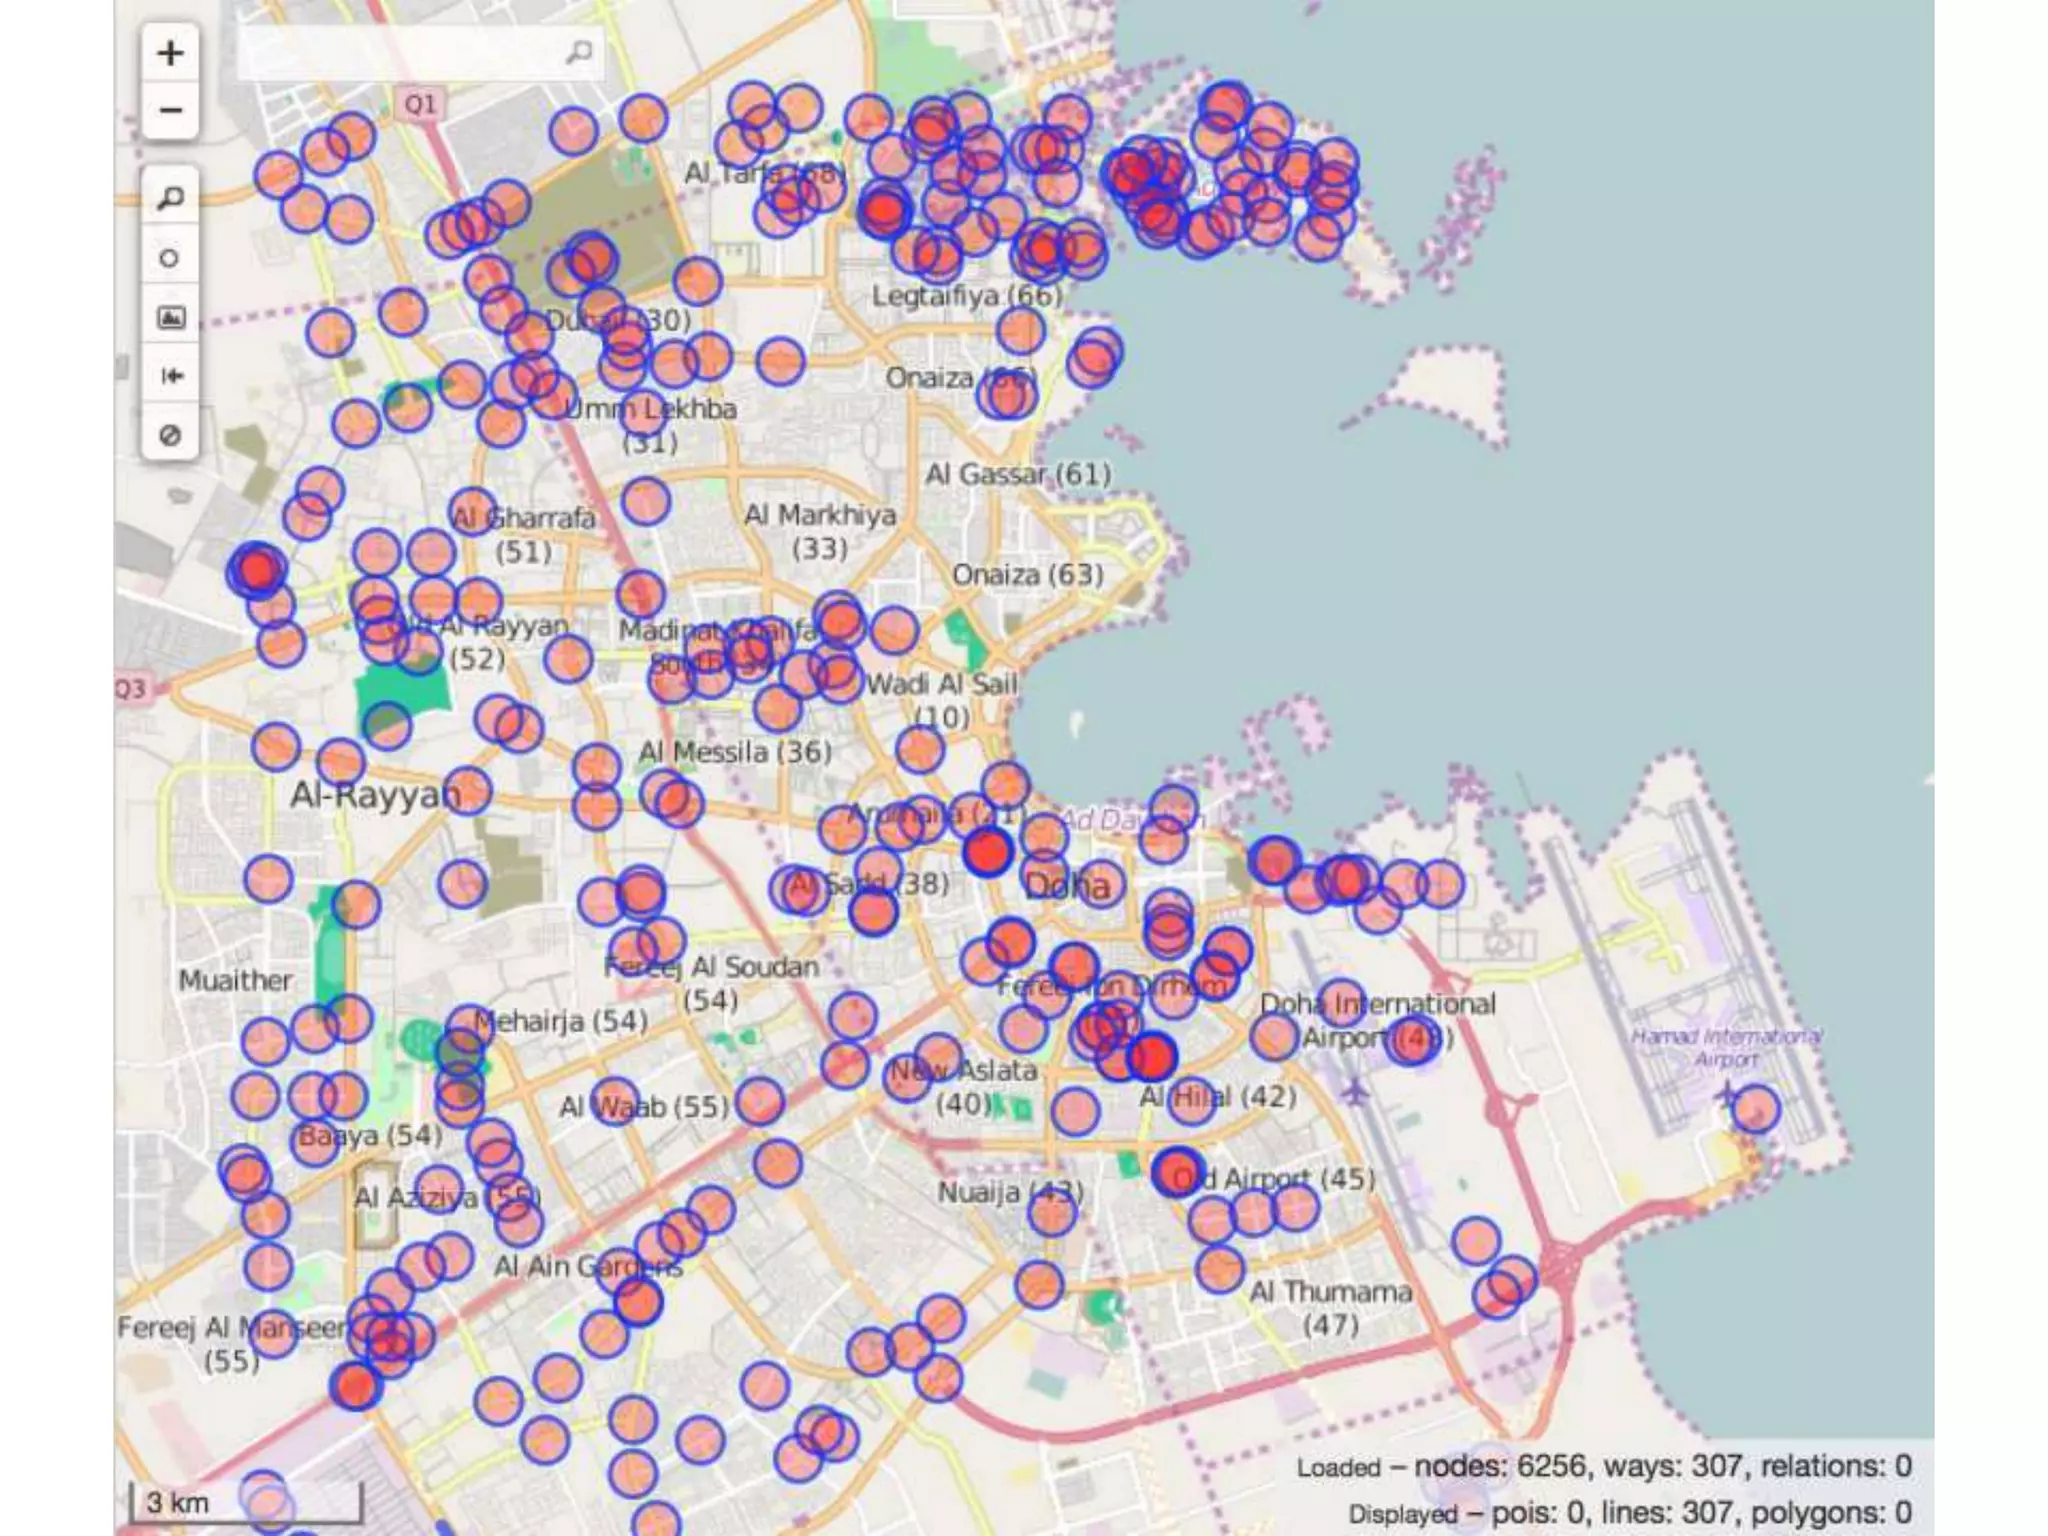
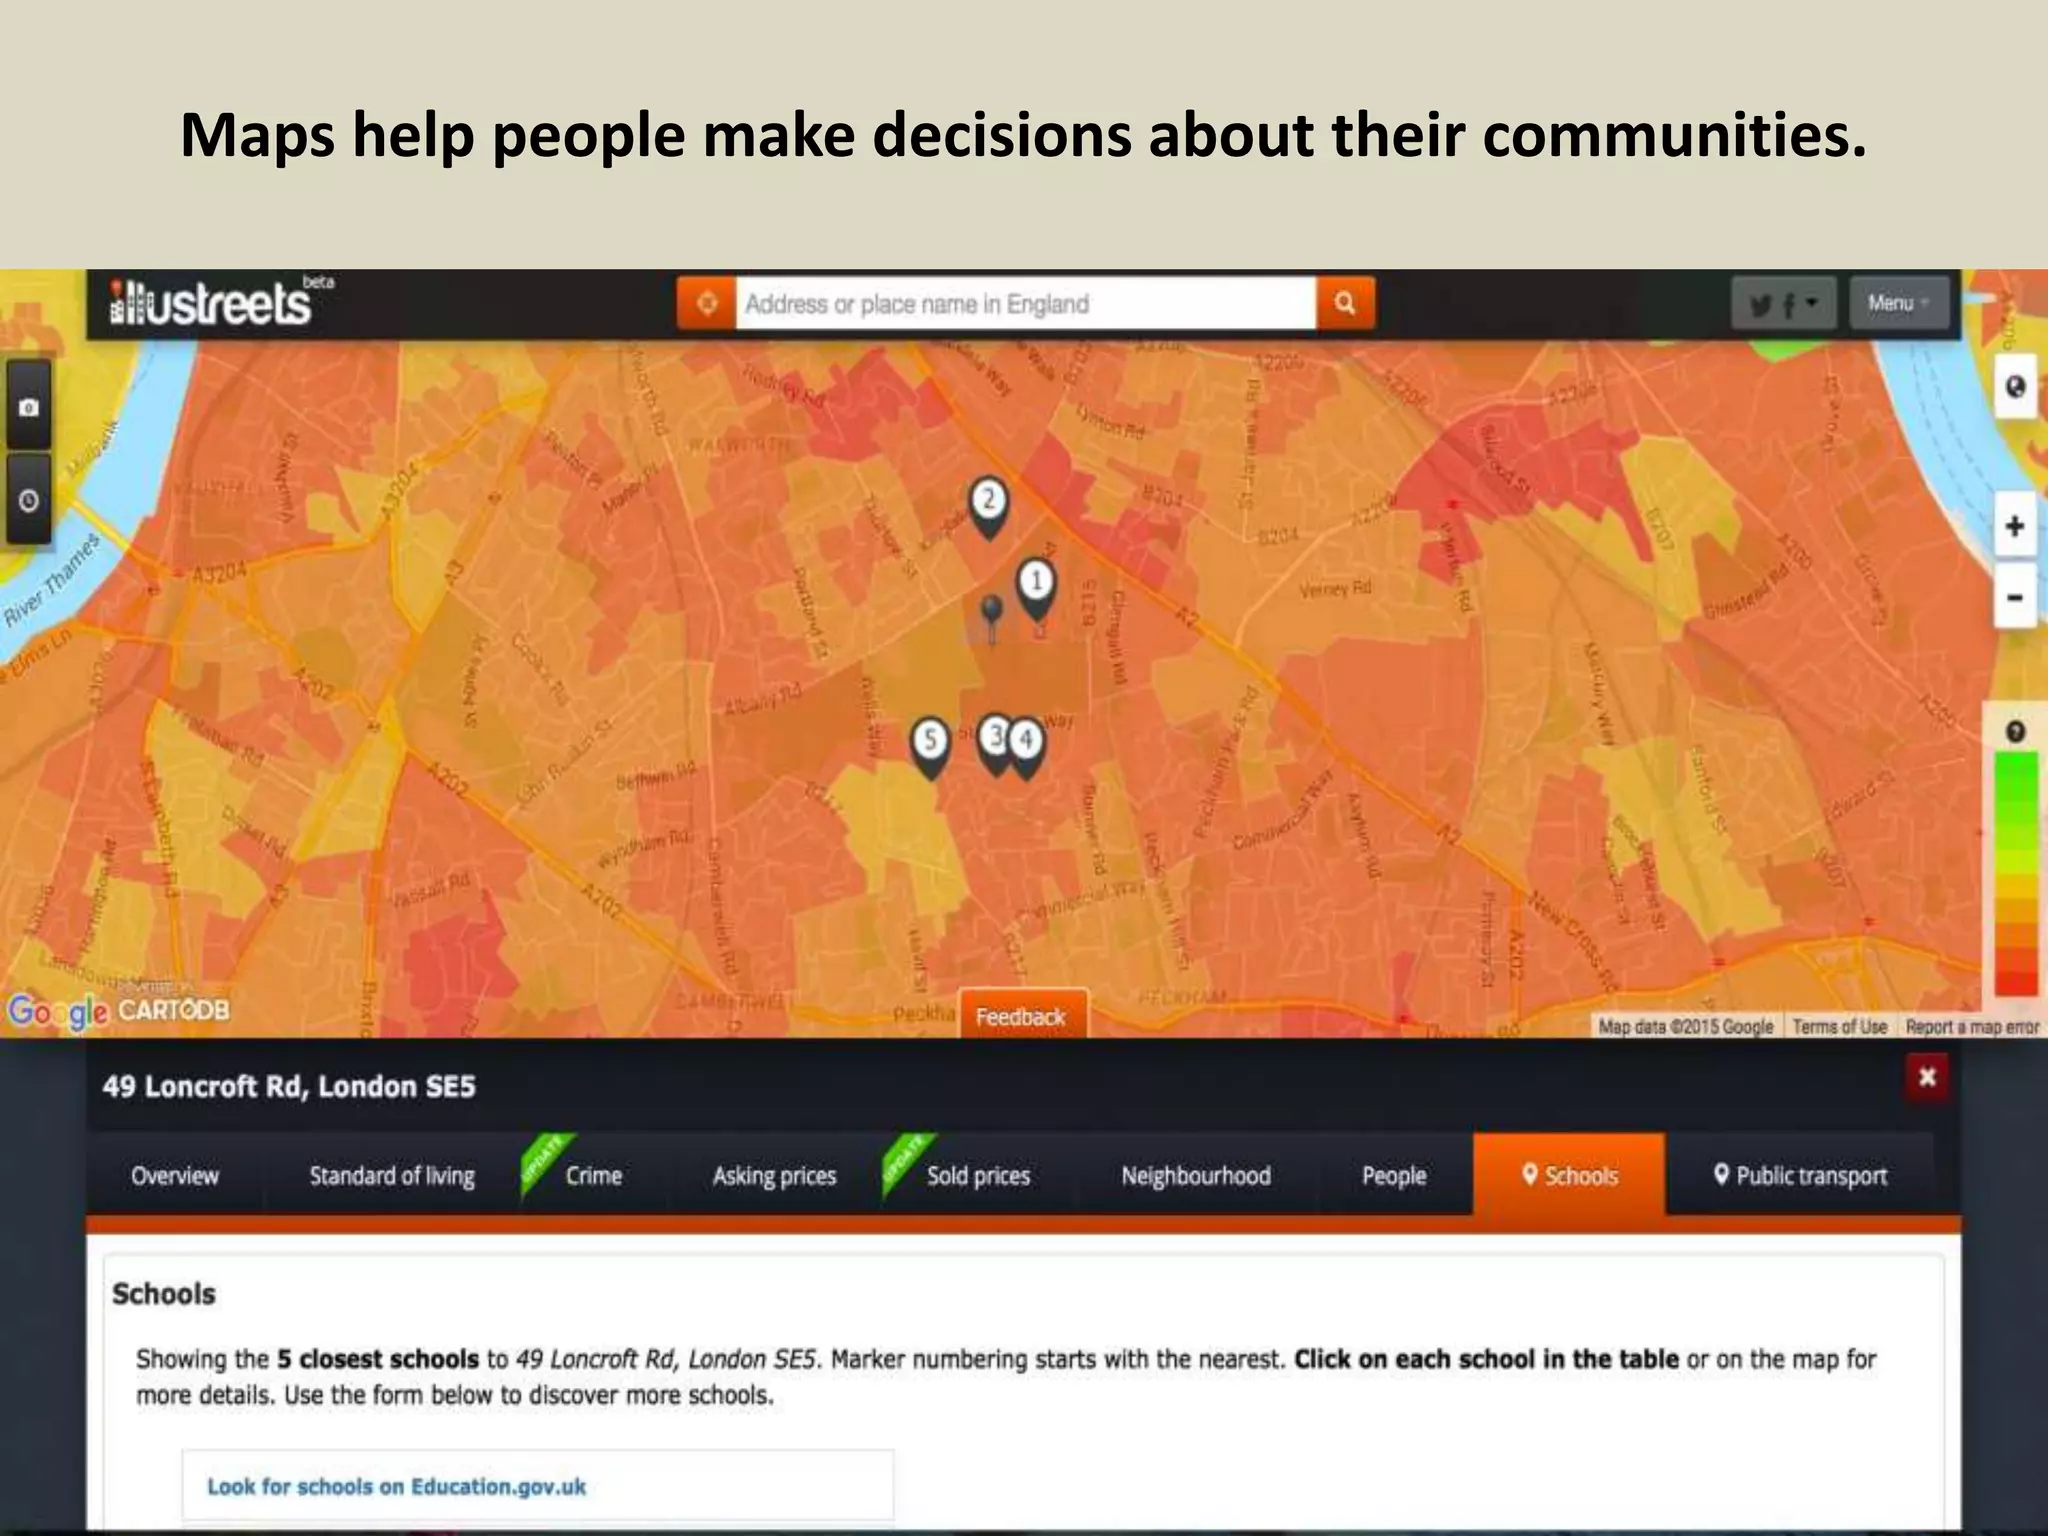
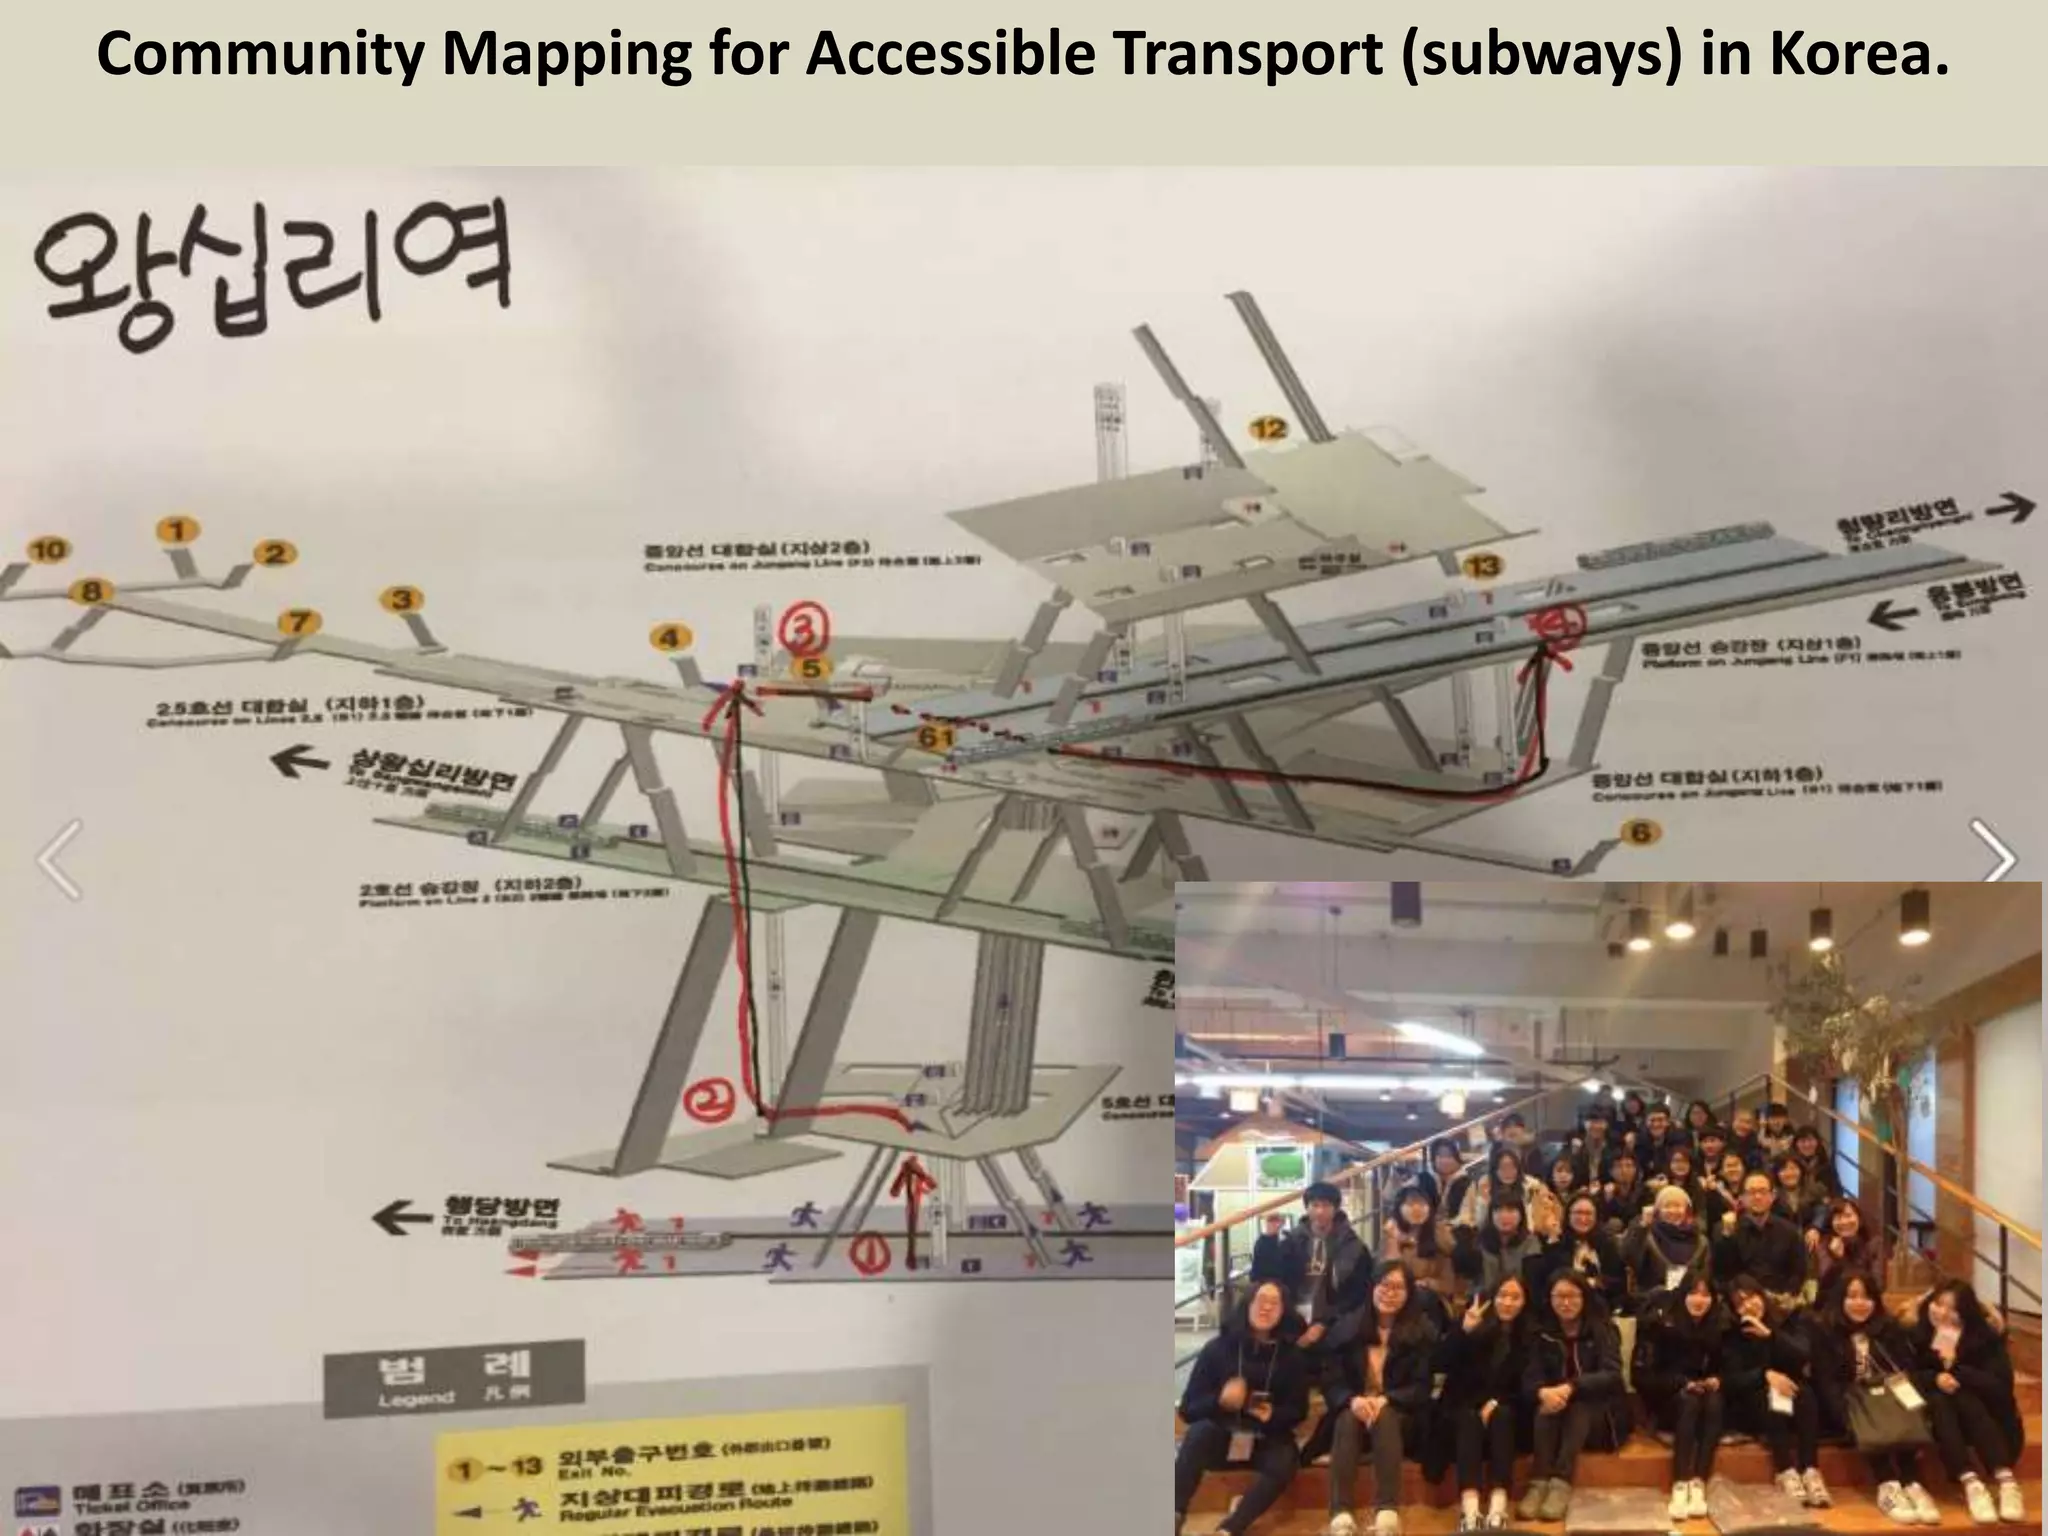
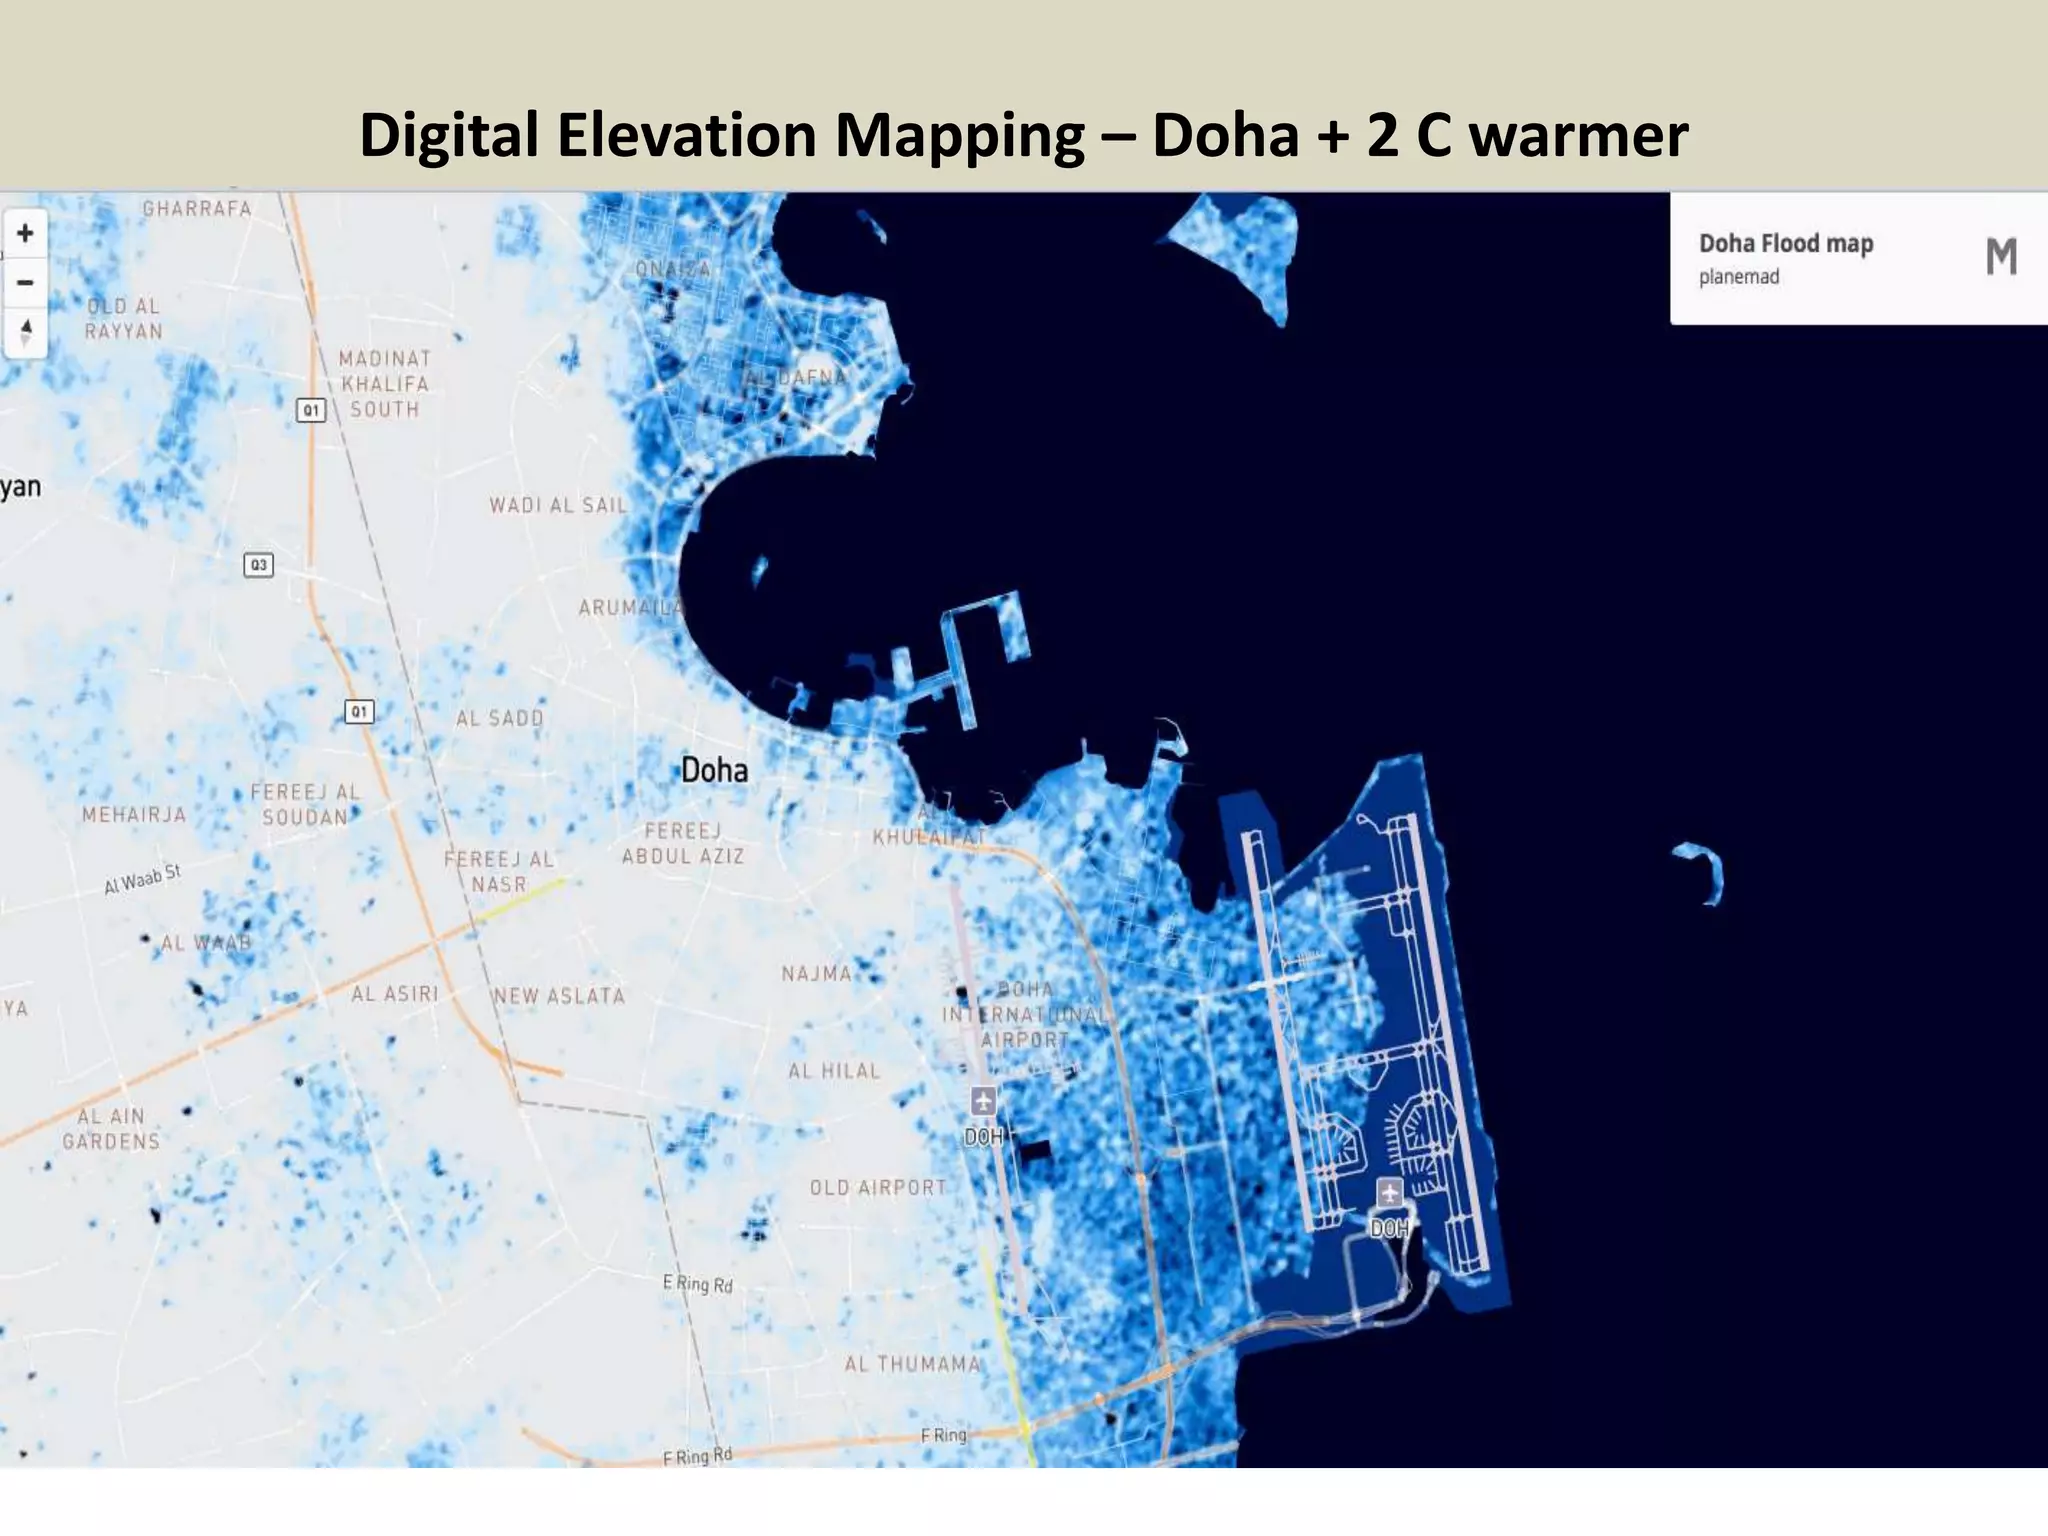
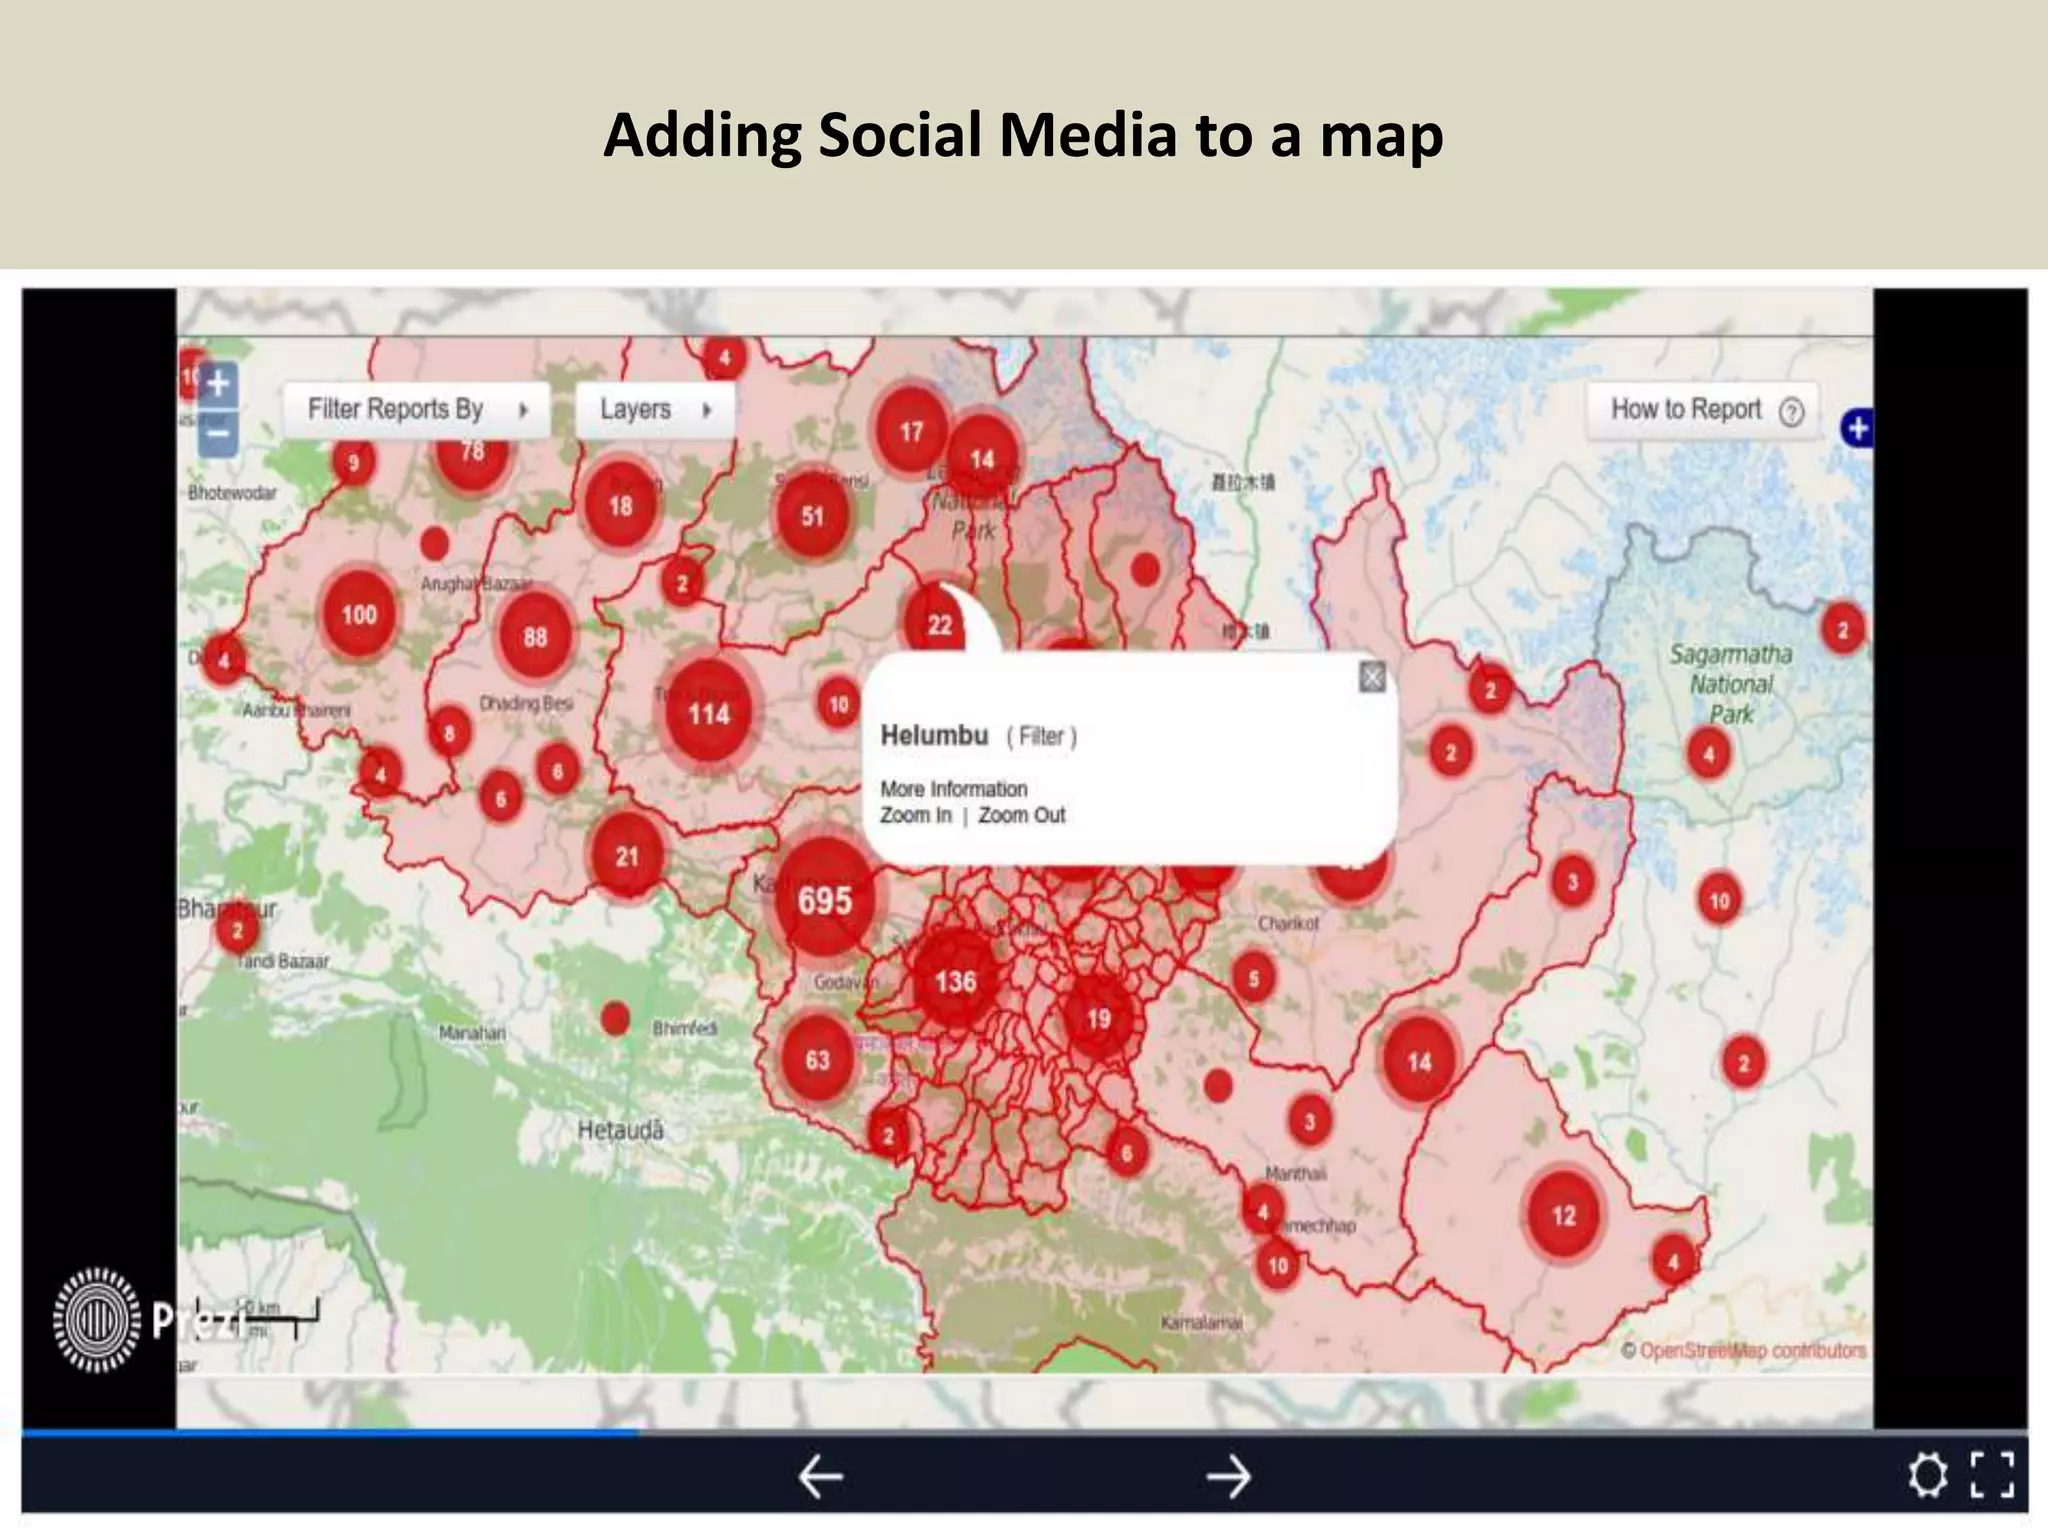
The document discusses various types of mapping software and their applications for social good, particularly focusing on community mapping and digital elevation mapping. It highlights the role of maps in helping communities make informed decisions, exemplified by projects in Qatar and Korea. The author, Heather Leson, emphasizes the integration of social media with mapping initiatives.


