Get a clearer picture of potential cloud performance by looking beyond SPECrate 2017 Integer scores
•
0 likes•10 views

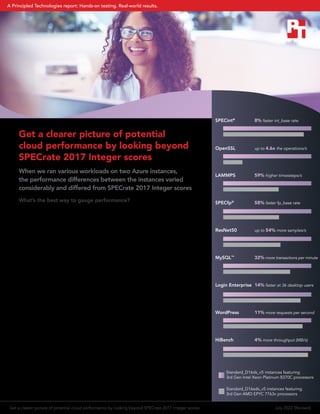
When we ran various workloads on two Azure instances, the performance differences between the instances varied considerably and differed from SPECrate 2017 Integer scores

Recommended
Recommended
More Related Content
Similar to Get a clearer picture of potential cloud performance by looking beyond SPECrate 2017 Integer scores
Similar to Get a clearer picture of potential cloud performance by looking beyond SPECrate 2017 Integer scores (20)
More from Principled Technologies
More from Principled Technologies (20)
Recently uploaded
Recently uploaded (20)
Get a clearer picture of potential cloud performance by looking beyond SPECrate 2017 Integer scores
- 1. SPECint® 8% faster int_base rate OpenSSL up to 4.6x the operations/s LAMMPS 59% higher timessteps/s SPECfp® 58% faster fp_base rate ResNet50 up to 54% more samples/s MySQL™ 32% more transactions per minute Login Enterprise 14% faster at 36 desktop users WordPress 11% more requests per second HiBench 4% more throughput (MB/s) Standard_D16ds_v5 instances featuring 3rd Gen Intel Xeon Platinum 8370C processors Standard_D16ads_v5 instances featuring 3rd Gen AMD EPYC 7763v processors Get a clearer picture of potential cloud performance by looking beyond SPECrate 2017 Integer scores When we ran various workloads on two Azure instances, the performance differences between the instances varied considerably and differed from SPECrate 2017 Integer scores What’s the best way to gauge performance? When you’re trying to choose cloud instances to run your workloads, how do you assess which option can best meet your needs? Some purchasers may simply compare platform-reported specifications and jump in. More savvy IT decision makers (ITDMs) want to see industry-standard benchmark results before committing. SPEC® CPU 2017 is one of those common, industry‑standard benchmark suites that measures and scores general compute-intensive performance. Part of the package is the SPECrate Integer suite—frequently called SPECint—and many ITDMs use it as a standard measure for comparing system performance. However, not all workloads put the same demands on a system, and no one workload can address all of an organization’s performance needs. Some workloads and applications depend more on storage or network performance, memory and cache geometries, or specialized instruction sets or CPU-specific features, so using this one standard benchmark may not provide the best measure for assessing how your workloads will perform. (Note that Principled Technologies is a member of SPEC. We consider SPEC benchmarks to be valuable tools and use them regularly, but believe that they are not the only tools folks should use to investigate performance.) By using workloads that more directly represent the applications you run, you can get a more nuanced understanding of the performance you are likely to see. As our results show, when leveraging tools other than SPECint, performance differences between systems were more varied than what any single industry-standard benchmark would suggest. Get a clearer picture of potential cloud performance by looking beyond SPECrate 2017 Integer scores July 2022 (Revised) A Principled Technologies report: Hands-on testing. Real-world results.
- 2. Our test approach To show how various workloads can offer different perspectives in assessing cloud performance, Principled Technologies compared two Microsoft Azure instances: Standard_D16ds_v5 instances featuring 3rd Gen Intel® Xeon® 8370C processors and Standard_D16ads_v5 instances featuring 3rd Gen AMD EPYC™ 7763v processors. We ran nine different performance tests that include general performance benchmarks (SPECrate 2017 Integer and SPECrate 2017 Floating Point) and various applications measuring everything from database performance to high performance computing workloads. Modern organizations use many, often differing workload types depending on the business challenges they are trying to address. Across the two VMs, there were nine testing areas: • Industry-standard compute- intensive benchmark suite (SPECrate 2017 Integer) • Communications security (OpenSSL) • High performance computing (LAMMPS) • Industry-standard compute- intensive benchmark suite (SPECrate 2017 Floating Point) • Deep learning (ResNet50 inference) • Relational database (MySQL) • Virtual desktop infrastructure (Login Enterprise) • Content management system for websites (WordPress) • Big data analysis (HiBench k-means) We configured both VMs as closely as possible and ran the same workloads on them. We ran each test three times and report the median result of the three test runs. For step-by-step details about our testing, visit the science behind the report. Here are the key configuration specs of the VMs we tested: Azure Ddsv5-series virtual machines1 • 3rd Gen Intel Xeon Platinum 8370C processors • 3.5GHz all-core turbo clock speed • 16 vCPUs • 64 GB of memory • Standard SSDs and Premium SSDs (depending on the test) Azure Dadsv5-series virtual machines2 • 3rd Gen AMD EPYC 7763v processors • 3.5 GHz Multi-threaded • 16 vCPUs • 64 GB of memory • Standard SSDs and Premium SSDs (depending on the test) Get a clearer picture of potential cloud performance by looking beyond SPECrate 2017 Integer scores July 2022 (Revised) | 2
- 3. Outcome We found that the performance differences between the two instances varied significantly across these tests. Using SPECrate 2017 Integer, Standard_D16ds_v5 instances featuring Intel Xeon processors achieved an 8 percent faster int_base rate than the instances with AMD EPYC processors. On other workloads, Standard_ D16ds_v5 instances varied from 4 percent better (on HiBench k-means) to 4.6 times (or 360 percent) better (on OpenSSL), which shows that using more specific performance benchmarks could give you very different results, ones that more realistically reflect the performance you would experience on each of your workloads. Note that server solution performance can vary depending on whether you are running applications directly on bare metal or on virtual machines in a cloud instance. For example, our testing showed an 8 percent performance advantage for the 3rd Gen Intel Xeon processor-based Azure Standard_D16ds_v5 instance over the 3rd Gen AMD EPYC processor-based Standard_D16ads_v5 instance, both with 16 vCPUs. However, in other cases, a 3rd Gen AMD EPYC processor-based server has achieved greater SPECint server performance than a 3rd Gen Intel Xeon processor-based server in an equal-core-count bare-metal comparison. Take, for example, the 32-core Intel Xeon Platinum 8362 processor. Three 32-core 3rd Gen AMD EPYC offerings (75F3, 7543, and 7513) have delivered greater SPECrate 2017 Integer base scores than this Intel processor has, with advantages ranging from 2 percent to 13 percent .3,4,5,6 About 3rd Gen Intel Xeon Scalable processors According to Intel, 3rd Gen Intel Xeon Scalable processors are “[o]ptimized for cloud, enterprise, HPC, network, security, and IoT workloads with 8 to 40 powerful cores and a wide range of frequency, feature, and power levels.”7 Intel continues to offer many models from the Platinum, Gold, Silver, and Bronze processor lines that they “designed through decades of innovation for the most common workload requirements.”8 For more information, visit http://intel.com/xeonscalable. Get a clearer picture of potential cloud performance by looking beyond SPECrate 2017 Integer scores July 2022 (Revised) | 3
- 4. Measuring general compute performance with SPECrate 2017 Integer First, we assessed performance of the Azure Ddsv5- series and Dadsv5-series VMs using the standardized SPECrate 2017 Integer benchmark from the SPEC CPU 2017 suite. As Figure 1 shows, the Ddsv5- series VM featuring Intel Xeon Scalable processors offered an 8 percent higher score on this benchmark, indicating that it delivered more throughput than the Dadsv5-series VM with AMD EPYC processors. SPECrate 2017 Integer performance Higher is better D16ds_v5 with Intel Xeon Scalable processors D16ads_v5 with AMD EPYC processors int_base rate 71.9 66 0 10 20 30 40 50 60 70 80 Figure 1: SPECrate 2017 Integer performance comparison, in int_ base rate, for Azure Standard_D16ds_v5 vs. Standard_D16ads_v5 VMs. Higher numbers are better. Source: Principled Technologies. About SPECrate 2017 Integer Part of SPEC CPU 2017, SPECrate 2017 Integer assesses compute-intensive performance. We used SPECrate 2017 for this test, which reports scores in SPECrate2017_int_base, a throughput measure where higher results are better. Workloads included in SPECrate 2017 Integer include artificial intelligence, general data compression, video compression, discrete event simulation, route planning, and more. This benchmark suite stresses the processor, memory, and compilers to give a general view of compute- intensive performance. To learn more about this benchmark, visit https://www. spec.org/cpu2017/Docs/overview.html#benchmarks. Who can benefit from using SPECrate 2017 Integer to benchmark performance? Because SPECrate 2017 Integer uses a broad range of applications that target the processor, memory, and compilers, it provides a good reference point for assessing compute-intensive workload performance. If your organization wants to test the waters for general cloud performance, SPECrate 2017 Integer can do that—but if you know the specific workload you want to run, choosing a workload that mimics yours allows you to better predict the performance of your workload. faster int_base rate 8% Get a clearer picture of potential cloud performance by looking beyond SPECrate 2017 Integer scores July 2022 (Revised) | 4
- 5. Measuring cryptographic performance using OpenSSL Many organizations encrypt transactions as they travel from servers to clients to keep information secure. If you plan to add SSL/TLS to your cloud VMs, using OpenSSL to measure performance of different functions can provide insight into which VM type to select. Figure 2 shows our comparison of OpenSSL performance, in normalized operations per second, that the VM types achieved. For five of the seven OpenSSL cryptographic functions we tested, the Ddsv5-series VM with Intel Xeon Scalable processors outperformed the Dadsv5 VM—delivering as much as 4.6 times the performance for the rsa2048_sign function. On two functions, the Dadsv5-series VM performed better, delivering 1.64 times and 1.11 times the operations per second of the Ddsv5-series VM. (Note: Because the operations per second counts were different for each function, we present results here normalized to the lower result in each comparison for ease of reading. To see the complete numbers, see the science behind the report.) These OpenSSL results are a good indication that looking beyond a single benchmark can tell a different performance story. While the performance difference for SPECrate 2017 Integer was only 8 percent between the two VM types, the gaps in performance for OpenSSL were wider and more varied. OpenSSL performance (normalized) Higher is better sha256 aes-256-gcm_enc rsa2048_sign rsa2048_verify ecdsa256_sign ecdsa256_verify ecdh256_op 1.00 1.64 3.14 1.00 4.60 1.00 2.10 1.00 1.58 1.00 1.00 1.11 2.47 1.00 0 1 2 3 4 5 D16ds_v5 with Intel Xeon Scalable processors D16ads_v5 with AMD EPYC processors Normalized operations per second Figure 2: OpenSSL performance comparison, in operations per second (normalized to the lower result), for Azure Standard_D16ds_v5 vs. Standard_D16ads_v5 VMs. Higher numbers are better. Source: Principled Technologies. About OpenSSL OpenSSL is an open-source, general-purpose cryptography library that offers implementation of SSL/ TLS to secure communications between clients and servers. When benchmarking OpenSSL, you can assess the performance of specific cryptographic ciphers and related functions. In our tests, we looked at the following cryptographic functions: sha256, aes-256- gcm_enc, rsa2048_sign, rsa2048_verify, ecdsa256_sign, ecdsa256_verify, and ecdh256_op. To learn more about OpenSSL, visit https://www.openssl.org/. Who can benefit from using OpenSSL to benchmark performance? Anyone planning to encrypt transactions can benefit from using OpenSSL for benchmarking. SSL stands for secure sockets layer, and the more modern version TLS stands for transport layer security. SSL/TLS transactions establish authenticated and encrypted links between clients and servers. SSL/TLS transactions require additional computational power compared to those that don’t need encryption. If your organization plans to run SSL/TLS, testing cloud VMs with OpenSSL can indicate the performance impact this security will have. up to the OPS 4.6x Get a clearer picture of potential cloud performance by looking beyond SPECrate 2017 Integer scores July 2022 (Revised) | 5
- 6. Comparing high performance computing (HPC) performance with LAMMPS High performance computing workloads, such molecular dynamics, physics simulations, and finite element analysis, require large amounts of processing power to solve complex tasks. We compared a Ddsv5- series VM with Intel Xeon Scalable processors to a Dadsv5-series VM with AMD EPYC processors using a benchmark from the LAMMPS tool—a molecular dynamics simulation—as an example HPC workload. As Figure 3 shows, the Azure Ddsv5-series VM achieved 59 percent more timesteps per second than the Dadsv5-series VM. This performance difference indicates that Ddsv5-series VMs could be better equipped for this kind of HPC workload compared to Dadsv5-series VMs—something that you could not learn from the slighter difference in SPECrate 2017 Integer scores, which shows the value of assessing performance using more specific workloads. LAMMPS performance Higher is better D16ds_v5 with Intel Xeon Scalable processors D16ads_v5 with AMD EPYC processors Timesteps/second 52 32.6 0 10 20 30 40 50 60 Figure 3: LAMMPS performance comparison, in timesteps per second, for Azure Standard_D16ds_v5 vs. Standard_D16ads_v5 VMs. Higher numbers are better. Source: Principled Technologies. About LAMMPS LAMMPS, which is an acronym for Large-Scale Atomic/ Molecular Massively Parallel Simulator, is an open- source molecular dynamics tool. While the tool includes several benchmark tests, we used the Lennard Jones model, which simulates atomic fluid with Lennard-Jones Potential. This specific simulation stresses the processor, while other benchmarks in the kit can also target GPUs. The LAMMPS benchmark we used reports performance in timesteps per second. To learn more about LAMMPS, visit https://www.lammps.org/. Who can benefit from using LAMMPS to benchmark performance? Organizations that do HPC modeling, simulations, and visualization could get a better idea what performance to expect from looking at real-world LAMMPS benchmark results versus looking at a general-purpose, standardized benchmark score. higher timessteps/s 59% Get a clearer picture of potential cloud performance by looking beyond SPECrate 2017 Integer scores July 2022 (Revised) | 6
- 7. Comparing general compute-intensive performance with SPECrate 2017 Floating Point Another part of the compute-intensive standard benchmark SPEC CPU 2017 is SPECrate 2017 Floating Point, which looks at floating point rather than integer performance. As Figure 4 shows, the Ddsv5-series VM featuring Intel Xeon Scalable processors offered a 58 percent higher score on this benchmark, indicating that it delivered more throughput than the Dadsv5- series VMs with AMD EPYC processors. By relying on SPECrate 2017 Integer alone, which showed an 8 percent performance difference, organizations could miss the potential for bigger differences in other types of performance, such as the SPECrate Floating Point scores that the Ddsv5-series VM achieved in our tests. SPECrate 2017 Floating Point performance Higher is better D16ds_v5 with Intel Xeon Scalable processors D16ads_v5 with AMD EPYC processors fp_base rate 100 63.3 0 20 40 60 80 100 120 Figure 4: SPECrate 2017 Floating Point performance comparison, in fp_base rate, for Azure Standard_D16ds_v5 vs. Standard_D16ads_v5 VMs. Higher numbers are better. Source: Principled Technologies. About SPECrate 2017 Floating Point Part of SPEC CPU 2017—which focuses on compute- intensive performance and stresses processor, memory, and compilers—is the SPECrate 2017 Floating Point suite. This benchmark suite includes 13 floating point workloads that include among them explosion modeling, fluid dynamics, molecular dynamics, weather forecasting, computational electromagnetics, and regional ocean modeling. The main metric it reports aggregates the results of these workloads. To learn more about this benchmark, visit https://www. spec.org/cpu2017/Docs/overview.html#benchmarks. Who can benefit from using SPECrate 2017 Floating Point to benchmark performance? Workloads that rely on floating point calculations (as opposed to integer calculations) include engineering workloads, technical calculations, and financial transactions. By testing this more specific type of performance, organizations whose workloads rely on floating point transactions could have better luck choosing a cloud VM that optimizes the kind of performance they need. faster fp_base rate 58% Get a clearer picture of potential cloud performance by looking beyond SPECrate 2017 Integer scores July 2022 (Revised) | 7
- 8. Comparing image classification performance using ResNet50 Deep learning workloads that rely on image classification to analyze data have different resource needs that a general-purpose benchmark may not account for. We tested the two Azure VM types using ResNet50 inference workloads in two batch sizes. As Figure 5 shows, the Ddsv5-series VMs with Intel Xeon Scalable processors processed 13 percent more samples per second using a small batch size, and 54 percent more samples per second for a larger batch size compared to Dadsv5-series VMs. If your organization cares about deep learning inference performance, running this workload to benchmark VM types gives a better indication of possible performance than the general-purpose SPECrate 2017 Integer benchmark (which showed an 8 percent difference). If you were relying on a standardized benchmark alone, you might miss out on the knowledge that Ddsv5-series VMs could offer significantly faster image classification rates—and make a VM choice that ultimately slows down your work. ResNet50 image classification performance Batch size 1 (INT8) Batch size 128 (INT8) D16ds_v5 with Intel Xeon Scalable processors D16ads_v5 with AMD EPYC processors Samples per second 154.4 136.5 265.9 172.5 0 50 100 150 200 250 300 Higher is better Figure 5: ResNet50 inference performance comparison, in samples per second, for Azure Standard_D16ds_v5 vs. Standard_D16ads_v5 VMs. Higher numbers are better. Source: Principled Technologies. About ResNet50 image classification ResNet50 is a convolutional neural network designed to classify images by the dominant object in the scene in a computationally efficient manner. Implementations are available in many frameworks. For our testing, we used implementations in the tensorflow framework optimized for both AMD and Intel architectures. The benchmark reports the rate of samples per second that the solutions were able to classify, with higher scores indicating better performance for this type of deep learning. We tested with two batch sizes using INT8 precision: batch size 128, which better reflects real-world workloads, and a small batch size of one. Who can benefit from assessing image classification performance with ResNet50? Organizations that run deep learning workloads to make sense of data may be interested in image classification workloads like ResNet50 to gauge VM performance. Organizations use ResNet50 and similar image classification models to diagnose medical conditions, compare topographies to assess damages from natural disasters, teach self-driving cars to recognize surroundings, and speed city planning. up to more samples/s 54% Get a clearer picture of potential cloud performance by looking beyond SPECrate 2017 Integer scores July 2022 (Revised) | 8
- 9. Comparing online transaction processing (OLTP) performance using a MySQL database Transactional databases are common, critical applications that organizations use for retail workloads and more. Figure 6 shows the MySQL database performance, in transactions per minute (TPM), that the two VM types achieved using the HammerDB benchmark. The Azure Ddsv5-series VM featuring Intel Xeon Scalable processors delivered 32 percent more TPM than did the Dadsv5-series VM with AMD EPYC processors. Again, the performance differential using this real-world database workload shows a wider gap in performance than you might expect if you chose VM types based on SPECrate 2017 Integer performance alone—which showed just an 8 percent performance increase for the Ddsv5-series VMs. MySQL database performance Transactions per minute Higher is better D16ds_v5 with Intel Xeon Scalable processors D16ads_v5 with AMD EPYC processors 800K 700K 600K 500K 400K 300K 200K 100K 0 900K 766,170 580,800 Figure 6: MySQL database performance comparison, in transactions per minute, for Azure Standard_D16ds_v5 vs. Standard_D16ads_v5 VMs. Higher numbers are better. Source: Principled Technologies. About the HammerDB benchmark tool HammerDB is an open-source tool that tests the database performance of many leading databases, including Oracle® Database, Microsoft SQL Server, PostgreSQL® , and MySQL™ . The benchmark includes two built-in workloads derived from industry standards: a transactional (TPC-C-like) workload and an analytics (TPC-H-like) workload. For this study, we used the transactional workload. Our test results do not represent official TPC results and are not comparable in any manner to the official TPC-audited results. For more information about HammerDB, visit www.hammerdb.com. Who can benefit from assessing MySQL OLTP performance with HammerDB? Online transaction processing databases are a common workload that organizations run to power ecommerce sites, keep hotel or airline reservations, and facilitate financial transactions, among many other things. By assessing which cloud VM type can support the most database transactions, organizations can feel confident in handling database users at peak times and ultimately reduce the number of VMs they must support and manage. more transactions per minute 32% Get a clearer picture of potential cloud performance by looking beyond SPECrate 2017 Integer scores July 2022 (Revised) | 9
- 10. Comparing virtual desktop infrastructure performance using Login Enterprise Virtual desktops have specialized resource needs that a general-purpose benchmark may not account for—so we tested using a real-world virtual desktop workload to show how the VM types compared. As Figure 7 shows, for the same number of desktop users, the Azure Ddsv5-series VM with Intel Xeon Scalable processors offered 14 percent faster relative desktop application performance for end users than the Azure Dadsv5-series VM. Again, this more specialized benchmark shows a distinct difference form the performance differential of 8 percent that the general standardized benchmark reported, showing that assessing VM performance for specific workloads could help you make a more informed decision. Login Enterprise desktop application performance, relative speed at 36 users Higher is better D16ds_v5 with Intel Xeon Scalable processors D16ads_v5 with AMD EPYC processors 1 0 2 1.14 1 Figure 7: Virtual desktop infrastructure application performance comparison, in relative speed at 36 users, for Azure Standard_ D16ds_v5 vs. Standard_D16ads_v5 VMs. Higher numbers are better. Source: Principled Technologies. About Login Enterprise Login Enterprise is an industry-standard benchmark for virtual desktop infrastructure, offering compatibility with popular virtual desktop software including Citrix, Microsoft Azure, and VMware Horizon. Login Enterprise offers different test profiles to simulate different kinds of workers to help organizations best size their virtual desktop deployment. We used a custom Knowledge worker workload to assess the performance of various productivity apps. Login Enterprise can report a VDI max of users a system can support as well as desktop responsiveness for a set number of users. To learn more abut Login Enterprise, visit https://www.loginvsi.com/. Who can benefit from comparing VDI application performance on Login Enterprise? Companies of all stripes have been seeking ways to navigate a shift toward remote work. One research study found that global VDI market share is expected to have a compound annual growth rate of 19.4 percent over the next six years.9 Because VDI has complex resource demands, any business seeking to host remote desktops in the cloud should consider using a real-world virtual desktop assessment tool such as Login Enterprise to make sure their VMs can support enough virtual desktop users while also giving them fast enough performance to complete their day-to-day tasks. faster at 36 desktop users 14% Get a clearer picture of potential cloud performance by looking beyond SPECrate 2017 Integer scores July 2022 (Revised) | 10
- 11. Comparing web performance using WordPress If your organization creates or hosts websites, exploring WordPress performance could help you make a more informed decision when selecting Azure VMs. On a WordPress workload, a Ddsv5-series VM with Intel Xeon Scalable processors outperformed a Dadsv5-series VM with AMD EPYC processors, handling 11 percent more requests per second (see Figure 8). This shows a slightly larger performance differential than the 8 percent difference on the SPECrate 2017 Integer benchmark. WordPress performance Requests/second Higher is better D16ds_v5 with Intel Xeon Scalable processors D16ads_v5 with AMD EPYC processors 800 700 600 500 400 300 200 100 0 900 805.6 725.3 Figure 8: WordPress performance comparison, in requests per second, for Azure Standard_D16ds_v5 vs. Standard_D16ads_v5 VMs. Higher numbers are better. Source: Principled Technologies. About WordPress WordPress, a free content management system used to create websites, powers nearly half the web.10 Because the tool is open-source and a basic version is available for free, many small businesses use WordPress to build a digital presence. To test its performance on Azure VMs, we used an open-source website transaction benchmark suite called oss-performance. The benchmark suite includes a workload specifically for WordPress, simulating a large number of users and reports the number of requests per second the systems could handle. Who can benefit from assessing web performance with WordPress? Organizations hosting websites should consider looking at WordPress performance when selecting cloud VMs. Whether your website serves as a storefront for ecommerce or shares vital information about your service, it’s important to give visitors a responsive experience that keeps them coming back. By using a real-world workload to gauge which cloud VM can best support web traffic at peak times, you can better encourage visitors to browse, make purchases, or otherwise interact with your site. more requests per second 11% Get a clearer picture of potential cloud performance by looking beyond SPECrate 2017 Integer scores July 2022 (Revised) | 11
- 12. Comparing big data performance with HiBench k-means As organizations amass more data, they must sort and analyze that data to make it useful. HiBench evaluates Hadoop or Spark big data frameworks for analytics workloads that make that happen. As Figure 9 shows, the throughput difference between Ddsv5- series VMs and Dadsv4 VMs on HiBench k-means was four percent, with the Intel Xeon Scalable processor- enabled VMs edging out the AMD EPYC processor- based VMs. This was the only workload we tested that showed a smaller performance difference than the 8 percent difference the SPECrate 2017 Integer benchmark reported. This change in differential is still instructive for noting that other benchmarks than the SPECrate 2017 standard offer a different view into performance capabilities for cloud VMs. HiBench throughput MB/s Higher is better D16ds_v5 with Intel Xeon Scalable processors D16ads_v5 with AMD EPYC processors 200 150 100 50 0 250 207.3 198.5 Figure 9: HiBench throughput comparison, in MB/s, for Azure Standard_D16ds_v5 vs. Standard_D16ads_v5 VMs. Higher numbers are better. Source: Principled Technologies. About HiBench The HiBench benchmark is a tool to evaluate big data frameworks. It reports throughput (in MB/s) and details resource utilization. According to the HiBench -repository at Github, “It contains a set of Hadoop, Spark and streaming workloads, including Sort, WordCount, TeraSort, Repartition, Sleep, SQL, PageRank, Nutch indexing, Bayes, Kmeans, NWeight and enhanced DFSIO, etc. It also contains several streaming workloads for Spark Streaming, Flink, Storm and Gearpump.”11 We used the k-means workload in our tests. Who can benefit from comparing big data performance with HiBench? Anyone using the cloud to analyze big data can benefit from using HiBench to gauge VM performance for these types of workloads. And these days, large enterprises down to small businesses are using data analysis workloads to gain insight from the massive amounts of data they collect in order to fuel business growth. One 2020 estimate found that 67 percent of small businesses spend over $10K per year on analytics.12 more throughput (MB/s) 4% Get a clearer picture of potential cloud performance by looking beyond SPECrate 2017 Integer scores July 2022 (Revised) | 12
- 13. Conclusion: Get the bigger picture when you branch out to specific workloads Assessing the performance of the cloud VMs you choose to run your applications is a smart business decision that could lead to better service for your users and a streamlined environment for IT. As this study shows, using the industry-standard SPECrate 2017 Integer benchmark suite to gauge system performance delivers good data for informing this choice—but depending on your workload, it may not paint a complete picture of what you can expect from your Azure cloud VMs. Companies running a diversity of workloads should consider a diversity of benchmarks. Using the SPECrate 2017 Integer benchmark, an Azure Ddsv5-series VM featuring 3rd Gen Intel Xeon Scalable 8370C processors outperformed an Azure Dadsv5-series VM with 3rd Gen AMD EPYC 7763v processors by 8 percent. But when we used several other workloads to compare the two series, performance deltas ranged from 4 percent all the way to 360 percent (4.6 times) more performance, with many results falling around a 50 percent increase for Ddsv5 VMs. These results show the wisdom of assessing cloud performance with more specific workloads that can give insight into the performance of the applications your organization intends to run. 1. Microsoft, “Ddv5 and Ddsv5-series,” accessed May 13, 2022, https://docs.microsoft.com/en-us/azure/virtual- machines/ddv5-ddsv5-series. 2. Microsoft, “Dasv5 and Dadsv5-series,” accessed May 13, 2022, https://docs.microsoft.com/en-us/azure/virtual- machines/dasv5-dadsv5-series. 3. Intel Platinum 8362 – 526, accessed June 9, 2022, https://www.spec.org/cpu2017/results/ res2021q3/cpu2017-20210802-28469.pdf. 4. AMD EPYC 75F3 – 596, accessed June 9, 2022, https://spec.org/cpu2017/results/res2021q2/ cpu2017-20210409-25541.pdf. 5. AMD EPYC 7543 – 560, accessed June 9, 2022, https://spec.org/cpu2017/results/res2021q2/ cpu2017-20210426-25663.pdf. 6. AMD EPYC 7513 – 538, accessed June 9, 2022, https://spec.org/cpu2017/results/res2021q3/ cpu2017-20210621-27511.pdf. 7. Intel, “Intel® Xeon® Scalable Processors,” accessed May 13, 2022, http://intel.com/xeonscalable. 8. Intel,“ Intel® Xeon® Scalable Processors,” accessed May 13, 2022, http://intel.com/xeonscalable. 9. GlobeNewswire, “Global Virtual Desktop Infrastructure (VDI) Market Share Will Surpass USD 33.42 Billion by 2028 at 19.4% CAGR Growth: Says Facts & Factors,” accessed May 18, 2022, https://www.globenewswire.com/ news-release/2022/01/17/2367880/0/en/ Global-Virtual-Desktop-Infrastructure-VDI- Market-Share-Will-Surpass-USD-33-42-Billion- by-2028-at-19-4-CAGR-Growth-Says-Facts- Factors.html. 10. WordPress, “Welcome to the world’s most popular website builder,” accessed May 17, 2022, https://wordpress.com/. 11. Github, “Intel-bigdata/ HiBench,” accessed May 18, 2022, https://github.com/Intel-bigdata/ HiBench. 12. Michael Guta, “67% of Small Businesses Spend More Than $10K a Year on Analytics,” accessed May 17, 2022, https://smallbiztrends. com/2020/03/data-analytics-trends.html. Principled Technologies is a registered trademark of Principled Technologies, Inc. All other product names are the trademarks of their respective owners. For additional information, review the science behind this report. Principled Technologies® Facts matter.® Principled Technologies® Facts matter.® This project was commissioned by Intel. Read the science behind this report at https://facts.pt/L3igWqP Get a clearer picture of potential cloud performance by looking beyond SPECrate 2017 Integer scores July 2022 (Revised) | 13