Download to read offline

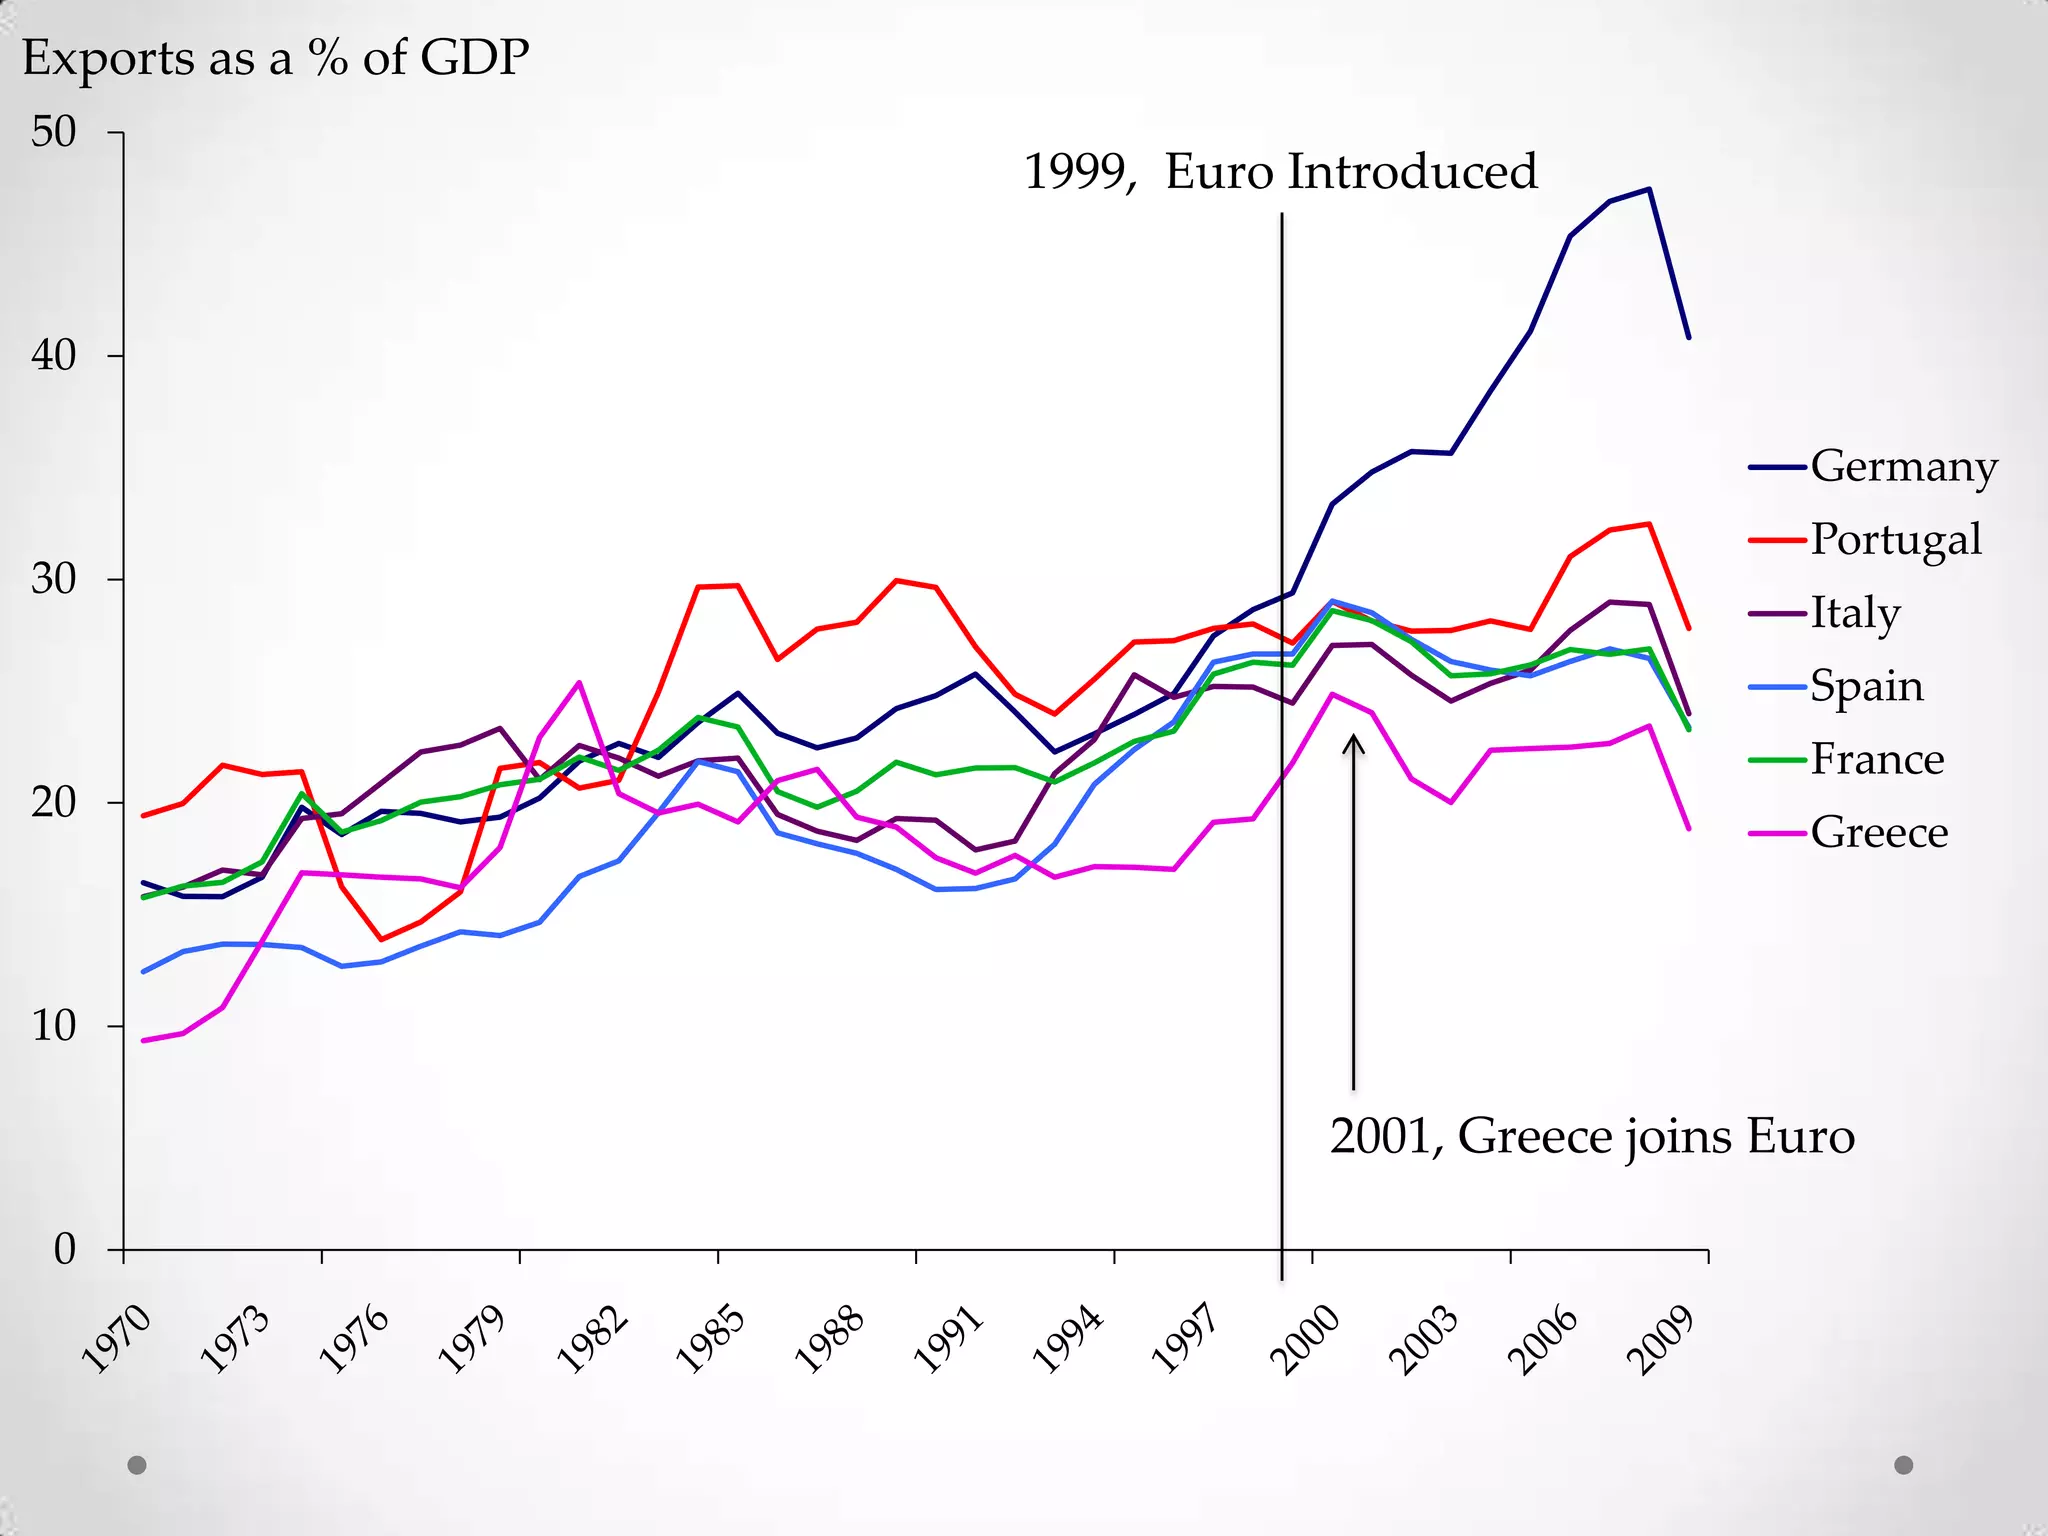

The document shows a line graph comparing exports as a percentage of GDP for several European countries from 1999 to an unspecified later date. It notes that 1999 was when the Euro was introduced and 2001 was when Greece joined the Euro. The graph shows Germany with the highest exports as a percentage of GDP, while Greece had the lowest percentage until joining the Euro in 2001 when its percentage increased.


