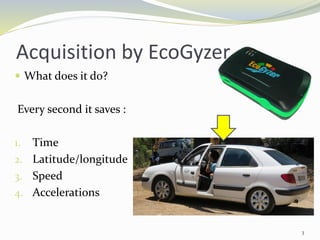
This document summarizes a project to create models for fuel consumption and CO2 emissions from vehicle data. The project involved collecting position, speed, and acceleration data from a device called EcoGyzer, along with noting road events. This data was then used to calculate slope, fuel consumption based on speed and slope, and CO2 emissions. The data was stored in shapefiles and could detect dangerous driving behaviors like heavy braking or strong turns. The goals were met by creating consumption models and enriching a geographic database with this vehicle performance and environmental impact data.


![Consumption
𝑎 ∗ 𝑣2
+ 𝑏 ∗ 𝑣 + 𝑐 ∗ (1 + sin(𝛼))
(ℝ+,[0,360])
Speed v (km/h), 𝛼(°)
ℝ+
K(L/100km)
{
• With some observations we performed of :
- The speed v
- The road slope 𝛼
- The consumption K
• We identify (a,b,c) by least square method
13](https://image.slidesharecdn.com/4ad8c5cf-0a5b-4dc4-8356-89176b86b0a8-161126005452/85/Geographic_databases_and_ecomobility-13-320.jpg)


