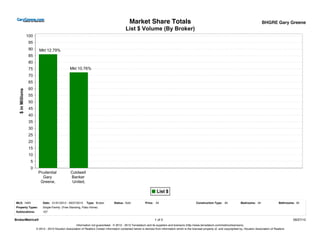
The document appears to be a market share report for BHGRE Gary Greene that includes data from January 1, 2012 to September 27, 2012. It shows that Prudential Gary Greene had a 12.79% market share based on list price volume and Coldwell Banker United had a 10.76% market share. Overall, the 355 properties listed under BHGRE Gary Greene represented a 19.45% market share based on number of units listed.
Duke Energy Field Services provides quarterly reports on gas volume and margins by contract type. The report shows gas and natural gas liquids (NGL) volumes and margins for percentage of proceeds (POP) contracts, keepwhole contracts, and fee-based transportation and fractionation contracts for 2005 quarters 1-3 and 2004 quarters 3-4. Total margins were $528 million for quarter 3 2005 and $417 million for quarter 3 2004.
This document summarizes Duke Energy Field Services' gas volume and margins by contract type for various quarters in 2005 and 2006. It shows that the majority of gas volume came from percentage of proceeds (POP) contracts, while the largest source of margin was the "other" category, which includes condensate sales, marketing activities, and other items. Margins increased in the third quarter of 2006 compared to the previous quarter. Footnotes provide additional details on pricing and categorizations.
Murphy Oil Corporation secured strategic worldwide positions for oil and gas exploration and production as well as downstream operations. In 2002, Murphy averaged 125,800 barrels of oil equivalent per day in production, a 10% increase over 2001. Significant production growth is expected to continue in 2003 and 2004 from new fields coming online in the Gulf of Mexico and Malaysia, as well as peaking production in Canada. Murphy also has over 500 retail fueling stations located at Walmart stores across the US.
2010 Toyota Land Cruiser color brochure provided by West Herr Toyota Williamsville located near Buffalo, NY. Find the 2010 Toyota Land Cruiser for sale in New York; call about our current sales and incentives at (716) 250-5500.
The West-Herr Automotive group has been awarded the highest honors from our manufacturers and from you, our customers. We are rated A1 by the Better Business Bureau. We are proud of the number of returning customers and the number of Western New Yorkers that recommended West Herr to their friends. We have extended service hours (including Saturday), award winning
This document provides an investor update from GMAC's CFO in June 2006. It discusses GMAC's business lines and financial performance. It also summarizes GM's plan to sell a 51% controlling stake in GMAC to a consortium led by Cerberus Capital Management. The sale aims to strengthen GMAC's capital base, improve its credit ratings and liquidity, while preserving its relationship with GM. It is expected to benefit both GMAC and GM over the long term.
General Mills reported financial results for fiscal year 2006 that marked the beginning of a new phase of growth for the company. Net sales increased 4% to over $11.6 billion worldwide, and segment operating profit grew 5% despite significant input cost inflation. Earnings per share were $2.90. The company aims to deliver low single-digit sales growth, mid single-digit operating profit growth, and high single-digit earnings per share growth over the next 3-5 years. International expansion and growth in new retail channels will be important drivers of the company's future financial performance.
This document provides a summary of General Mills' 2007 annual report. It discusses growth across General Mills' divisions, with every major operating division posting sales increases. Net sales grew 6% to $12.4 billion and segment operating profits grew 7% to $2.3 billion. The summary also mentions that General Mills sees five key drivers of ongoing growth: product innovation, channel expansion, international expansion, margin expansion, and brand-building investment. General Mills believes these drivers will allow it to meet its long-term growth model targets.
Real Estate Market Reports: The Woodlands, TXTatianaLavoie
This real estate report summarizes home sales data for The Woodlands, Texas from April 2013. It includes charts showing listing inventory, homes placed under contract, average and median sold prices, and average price per square foot from 2009 to 2013. The data helps analyze market trends in inventory levels, sales prices, time on market, and demand.
home sales reports the woodlands tx may 2012Mike Tabbert
The document contains real estate data and statistics for The Woodlands, Texas from 2008 to 2012, including properties under contract and unsold inventory on a monthly basis, as well as market share and sales price data for different real estate companies in the area. It also provides charts showing the average and median sales prices and average price per square foot for homes sold over a two year period from April 2010 to April 2012. The data is from the Houston Association of Realtors Multiple Listing Service for single-family homes in The Woodlands area.
The document discusses the benefits of exercise for mental health. Regular physical activity can help reduce anxiety and depression and improve mood and cognitive function. Exercise causes chemical changes in the brain that may help protect against mental illness and improve symptoms.
Real estate home sales reports all the woodlands december 2012Mike Tabbert
The document is a real estate sales report for The Woodlands, Texas in December 2012. It includes data on listing inventory, home sales, average and median sold prices, average price per square foot, average days on market, and months of inventory from 2008 to 2012. The key metrics provided are that in November 2012 there were 166 homes sold with an average sold price of $333,222 and median of $265,000. The average price per square foot was $2,868 and average days on market was 52 days.
The document is a real estate report for The Woodlands, Texas that provides monthly data from January 2008 to December 2012. It includes information on listing inventory, properties placed under contract, average and median sold prices, average price per square foot, average days on market, and months of inventory. The data shows trends over time for these key market indicators.
This document provides a decoder to help understand common abbreviations found in real estate listings. It includes sections decoding abbreviations for a home's exterior features, interior rooms, appliances and utilities, interior features, and phone numbers related to moving. The goal is to translate unfamiliar terms so browsing listings is less confusing.
The woodlands home sales reports feb 2013Mike Tabbert
The document is a real estate report for The Woodlands, Texas that provides monthly data from 2009 to 2013 on home listing inventory, properties under contract, average and median sold prices, days on market, and supply of inventory. Key metrics showed that in February 2013 the average sold price was $387,072, the median was $296,075, and the average days on market was 66 days.
The woodlands home sales reports feb 2013Mike Tabbert
The document provides real estate data for The Woodlands, Texas for the period of 2009-2013. It includes statistics such as listing inventory, homes sold, average and median sold prices, average days on market, and months of inventory. The data is broken down by month to show trends over time. Overall, the document analyzes the real estate market conditions in The Woodlands through detailed housing metrics.
This document summarizes real estate data for Magnolia, TX (zip code 77354) for the period of January 2011 through January 2013. It includes statistics on average and median home sale prices, average price per square foot, average number of days homes spent on the market, and monthly supply of homes for sale. These statistics are broken down and reported on a monthly basis to show trends over time.
The document provides real estate data for Spring, TX (zip code 77386) including average and median sold home prices from January 2011 to January 2013. It shows the prices fluctuated monthly with average prices generally higher than medians. Additional data included average days on the market and average price per square foot each month over the two year period.
This document summarizes real estate data for Magnolia, TX (zip code 77354) for the period of January 2011 through January 2013. It includes statistics on average and median home sale prices, average price per square foot, average number of days homes spent on the market, and monthly supply of homes for sale. These statistics are broken down and reported on a monthly basis to show trends over time.
The document lists the top individual performers and teams for the month of October 2012 in categories such as new listings taken, sales dollar volume, units sold, and more. Rebekah Snipp topped categories like new listings taken and new listing dollar volume. The Cheryle's Sanderson Team led in categories like new sales dollar volume and listings taken. Other top performers included Melanie Aubrey, Brad Carlson, Kimberly Soderberg, and the Michele Flory & Co and Zimmerman teams.
What is deforestation? Details on historical background, areas of concern,effects on the environment and ecological community, ongoing conservation efforts, possible solutions, and much more, with pictures.
The document provides an overview of Dream Wedding Planner, a Jaipur-based wedding planning company. Their vision is to be a tech-savvy, customer-centric event management firm focused on elegance and excellence. Their objectives include ensuring the best use of clients' wedding budgets and reflecting their unique style. The company offers various wedding planning packages and themes. Services include venue selection, decor, photography, and day-of coordination. Target markets are upper middle class families and the company aims to differentiate through promotions.
Prudential Fox & Roach had the largest market share of residential real estate sales in Bucks County for the period of October 2008 to September 2009, with $444.9 million in total sales volume (14.14% market share). They sold 572 properties for $207.4 million and listed 639 properties with a total list price of $237.4 million. Prudential Fox & Roach had 1,196 total agents working across their 26 offices.
Prudential Fox & Roach had the largest market share of residential real estate sales in Bucks County from February 2009 to January 2010, with $485.7 million in total sales volume and a 13.94% market share. Coldwell Banker Hearthside had the second highest market share with $382.9 million in total sales and 10.99% of the market. The top 10 brokers accounted for over 56% of the market, with the remaining market share split among over 500 other brokers.
Prudential Fox & Roach had the largest market share of residential real estate sales in Bucks County from October 2008 to September 2009, with $455.9 million in total sales volume (14.16% market share). Coldwell Banker Hearthside had the second highest market share (10.58%), followed by Keller Williams Real Estate (6.71%). The top 10 brokers accounted for over half (56.2%) of the $3.2 billion in total residential real estate sales in Bucks County during that period.
Prudential Fox & Roach had the largest market share of home sales in Bucks County between 2008-2009, with 13.35% of the total dollar volume. They listed 1,183 properties worth $431.8 million and sold 557 homes for $202.1 million. Prudential Fox & Roach had 1,328 agents across 28 offices.
Prudential Fox & Roach had the largest market share of residential real estate sales in the Philadelphia area from November 2008 to October 2009, with 22.74% of the total sales volume and over 1,800 agents. They sold over 1,300 properties worth $440 million. Overall, the top 10 brokerages accounted for 47.89% of the local market's nearly $4 billion in residential real estate transactions during that period.
To help you select from the wide range of Bucks County Homes or if your needs take you to Delaware County, Montgomery County, Chester County or Philadelphia County, one of our Greater Philadelphia real estate agents will be glad to help you find your dream home.
Prudential Fox & Roach had the largest market share of residential real estate sales in Bucks County for the period of April 1, 2009 to March 31, 2010, with a 13.94% share. They sold 654 properties worth $239.5 million, and in total handled $498 million in 1,344 transactions. Coldwell Banker Hearthside had the second largest market share at 11.11%, and Keller Williams was third with 6.81% market share.
Prudential Fox & Roach had the largest market share of residential real estate sales in Montgomery County for the period of February 1, 2009 to January 31, 2010, with 22.83% of the total dollar volume. They sold 1,265 properties for a total of $508,187,433. Prudential Fox & Roach had 1,680 total agents working across their 34 offices.
Prudential Fox & Roach had the largest market share of residential real estate sales in Montgomery County for the period of April 1, 2009 to March 31, 2010, with 22.49% of the total dollar volume. They sold 1,293 homes for a total of $516 million. Prudential Fox & Roach had 1,678 agents working across 33 offices.
To help you select from the wide range of Montgomery County Homes or if your needs take you to Delaware County, Bucks County, Chester County or Philadelphia County, one of our Greater Philadelphia real estate agents will be glad to help you find your dream home.
Prudential Fox & Roach had the largest market share of residential real estate sales in Montgomery County for the period of April 1, 2009 to March 31, 2010, with 22.49% of the total dollar volume. They sold 1,293 homes for a total of $516 million. Prudential Fox & Roach had 1,678 agents working across 33 offices.
Prudential Fox & Roach had the largest market share of residential real estate sales in Bucks County for the period of March 1, 2009 to February 28, 2010, with a 13.75% share. They listed 1,305 properties worth a total of $483.5 million and sold 632 properties for $229.7 million. Coldwell Banker Hearthside had the second largest market share at 11.17%, listing 1,006 properties worth $392.8 million.
Prudential Fox & Roach had the largest market share in Bucks County in 2009, with $471 million in total sales volume and a 13.65% market share. They sold 604 homes for $218 million and listed 680 homes for $253 million. Prudential Fox & Roach had 1,131 agents across 24 offices.
Prudential Fox & Roach had the largest market share of residential real estate sales in Montgomery County for the period of August 1, 2008 to July 31, 2009, with a 24.63% share. They sold 1,172 homes worth $516 million, totaling $1.06 billion in sales. Long & Foster was the second largest broker, with a 5.35% market share over the same period.
Prudential Fox & Roach had the largest market share of residential real estate sales in Bucks County from May 2009 to April 2010, with $514.5 million in total sales volume (14.03% market share). Coldwell Banker Hearthside had the second highest market share with $405.4 million in total sales (11.06% market share). The document provides statistics on total listings, sales, agents, and market share for the top 10 residential real estate brokers in Bucks County for that time period.
Prudential Fox & Roach had the largest market share of residential real estate sales in Montgomery County for the period of February 1, 2009 to January 31, 2010, with 22.8% of the total dollar volume. They sold 1,268 properties for a total of $508.9 million. Prudential Fox & Roach had 1,683 agents working across their 34 offices.
Prudential Fox & Roach had the largest market share of residential real estate sales in Bucks County from July 2009 to June 2010, with a 14.15% share. They sold 708 properties worth $267.1 million, with a total of $548.4 million in sales. Coldwell Banker Hearthside had the second largest market share at 10.89%, and Keller Williams Real Estate had the third largest market share at 6.78%.
Prudential Fox & Roach had the largest market share of residential real estate sales in Montgomery County for the period of October 1, 2008 to September 30, 2009, with 23.65% of the total dollar volume. They sold 1,159 homes for a total of $483,590,168. Prudential Fox & Roach had 1,643 agents working across their 34 offices.
2015 under contract month to month the woodlands copyMike Tabbert
The document is a real estate report for The Woodlands, Texas that shows the number of properties placed under contract month-to-month from 2013 to 2015. In 2015, the numbers ranged from 170 contracts in January to 278 contracts in March. Overall, contract numbers were generally higher in 2014 and 2015 than in 2013 according to the data from the Houston Association of Realtors.
2015 listing inventory month to month the woodlands copyMike Tabbert
The document is a real estate report on listing inventory in The Woodlands, Texas from January to December 2014 and January to April 2015. In 2014, listing inventory ranged from 355 homes in January to 682 homes in August, generally increasing throughout the year. In 2015, listing inventory was 591 homes in January, 630 in February, 658 in March, and 731 in April.
Solution Manual For Financial Accounting, 8th Canadian Edition 2024, by Libby...Donc Test
Solution Manual For Financial Accounting, 8th Canadian Edition 2024, by Libby, Hodge, Verified Chapters 1 - 13, Complete Newest Version Solution Manual For Financial Accounting, 8th Canadian Edition by Libby, Hodge, Verified Chapters 1 - 13, Complete Newest Version Solution Manual For Financial Accounting 8th Canadian Edition Pdf Chapters Download Stuvia Solution Manual For Financial Accounting 8th Canadian Edition Ebook Download Stuvia Solution Manual For Financial Accounting 8th Canadian Edition Pdf Solution Manual For Financial Accounting 8th Canadian Edition Pdf Download Stuvia Financial Accounting 8th Canadian Edition Pdf Chapters Download Stuvia Financial Accounting 8th Canadian Edition Ebook Download Stuvia Financial Accounting 8th Canadian Edition Pdf Financial Accounting 8th Canadian Edition Pdf Download Stuvia
STREETONOMICS: Exploring the Uncharted Territories of Informal Markets throug...sameer shah
Delve into the world of STREETONOMICS, where a team of 7 enthusiasts embarks on a journey to understand unorganized markets. By engaging with a coffee street vendor and crafting questionnaires, this project uncovers valuable insights into consumer behavior and market dynamics in informal settings."
Economic Risk Factor Update: June 2024 [SlideShare]Commonwealth
May’s reports showed signs of continued economic growth, said Sam Millette, director, fixed income, in his latest Economic Risk Factor Update.
For more market updates, subscribe to The Independent Market Observer at https://blog.commonwealth.com/independent-market-observer.
Abhay Bhutada, the Managing Director of Poonawalla Fincorp Limited, is an accomplished leader with over 15 years of experience in commercial and retail lending. A Qualified Chartered Accountant, he has been pivotal in leveraging technology to enhance financial services. Starting his career at Bank of India, he later founded TAB Capital Limited and co-founded Poonawalla Finance Private Limited, emphasizing digital lending. Under his leadership, Poonawalla Fincorp achieved a 'AAA' credit rating, integrating acquisitions and emphasizing corporate governance. Actively involved in industry forums and CSR initiatives, Abhay has been recognized with awards like "Young Entrepreneur of India 2017" and "40 under 40 Most Influential Leader for 2020-21." Personally, he values mindfulness, enjoys gardening, yoga, and sees every day as an opportunity for growth and improvement.
Independent Study - College of Wooster Research (2023-2024) FDI, Culture, Glo...AntoniaOwensDetwiler
"Does Foreign Direct Investment Negatively Affect Preservation of Culture in the Global South? Case Studies in Thailand and Cambodia."
Do elements of globalization, such as Foreign Direct Investment (FDI), negatively affect the ability of countries in the Global South to preserve their culture? This research aims to answer this question by employing a cross-sectional comparative case study analysis utilizing methods of difference. Thailand and Cambodia are compared as they are in the same region and have a similar culture. The metric of difference between Thailand and Cambodia is their ability to preserve their culture. This ability is operationalized by their respective attitudes towards FDI; Thailand imposes stringent regulations and limitations on FDI while Cambodia does not hesitate to accept most FDI and imposes fewer limitations. The evidence from this study suggests that FDI from globally influential countries with high gross domestic products (GDPs) (e.g. China, U.S.) challenges the ability of countries with lower GDPs (e.g. Cambodia) to protect their culture. Furthermore, the ability, or lack thereof, of the receiving countries to protect their culture is amplified by the existence and implementation of restrictive FDI policies imposed by their governments.
My study abroad in Bali, Indonesia, inspired this research topic as I noticed how globalization is changing the culture of its people. I learned their language and way of life which helped me understand the beauty and importance of cultural preservation. I believe we could all benefit from learning new perspectives as they could help us ideate solutions to contemporary issues and empathize with others.
Falcon stands out as a top-tier P2P Invoice Discounting platform in India, bridging esteemed blue-chip companies and eager investors. Our goal is to transform the investment landscape in India by establishing a comprehensive destination for borrowers and investors with diverse profiles and needs, all while minimizing risk. What sets Falcon apart is the elimination of intermediaries such as commercial banks and depository institutions, allowing investors to enjoy higher yields.
How Does CRISIL Evaluate Lenders in India for Credit RatingsShaheen Kumar
CRISIL evaluates lenders in India by analyzing financial performance, loan portfolio quality, risk management practices, capital adequacy, market position, and adherence to regulatory requirements. This comprehensive assessment ensures a thorough evaluation of creditworthiness and financial strength. Each criterion is meticulously examined to provide credible and reliable ratings.
Falcon stands out as a top-tier P2P Invoice Discounting platform in India, bridging esteemed blue-chip companies and eager investors. Our goal is to transform the investment landscape in India by establishing a comprehensive destination for borrowers and investors with diverse profiles and needs, all while minimizing risk. What sets Falcon apart is the elimination of intermediaries such as commercial banks and depository institutions, allowing investors to enjoy higher yields.