Download to read offline
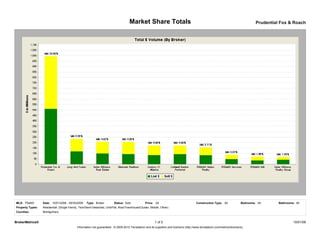
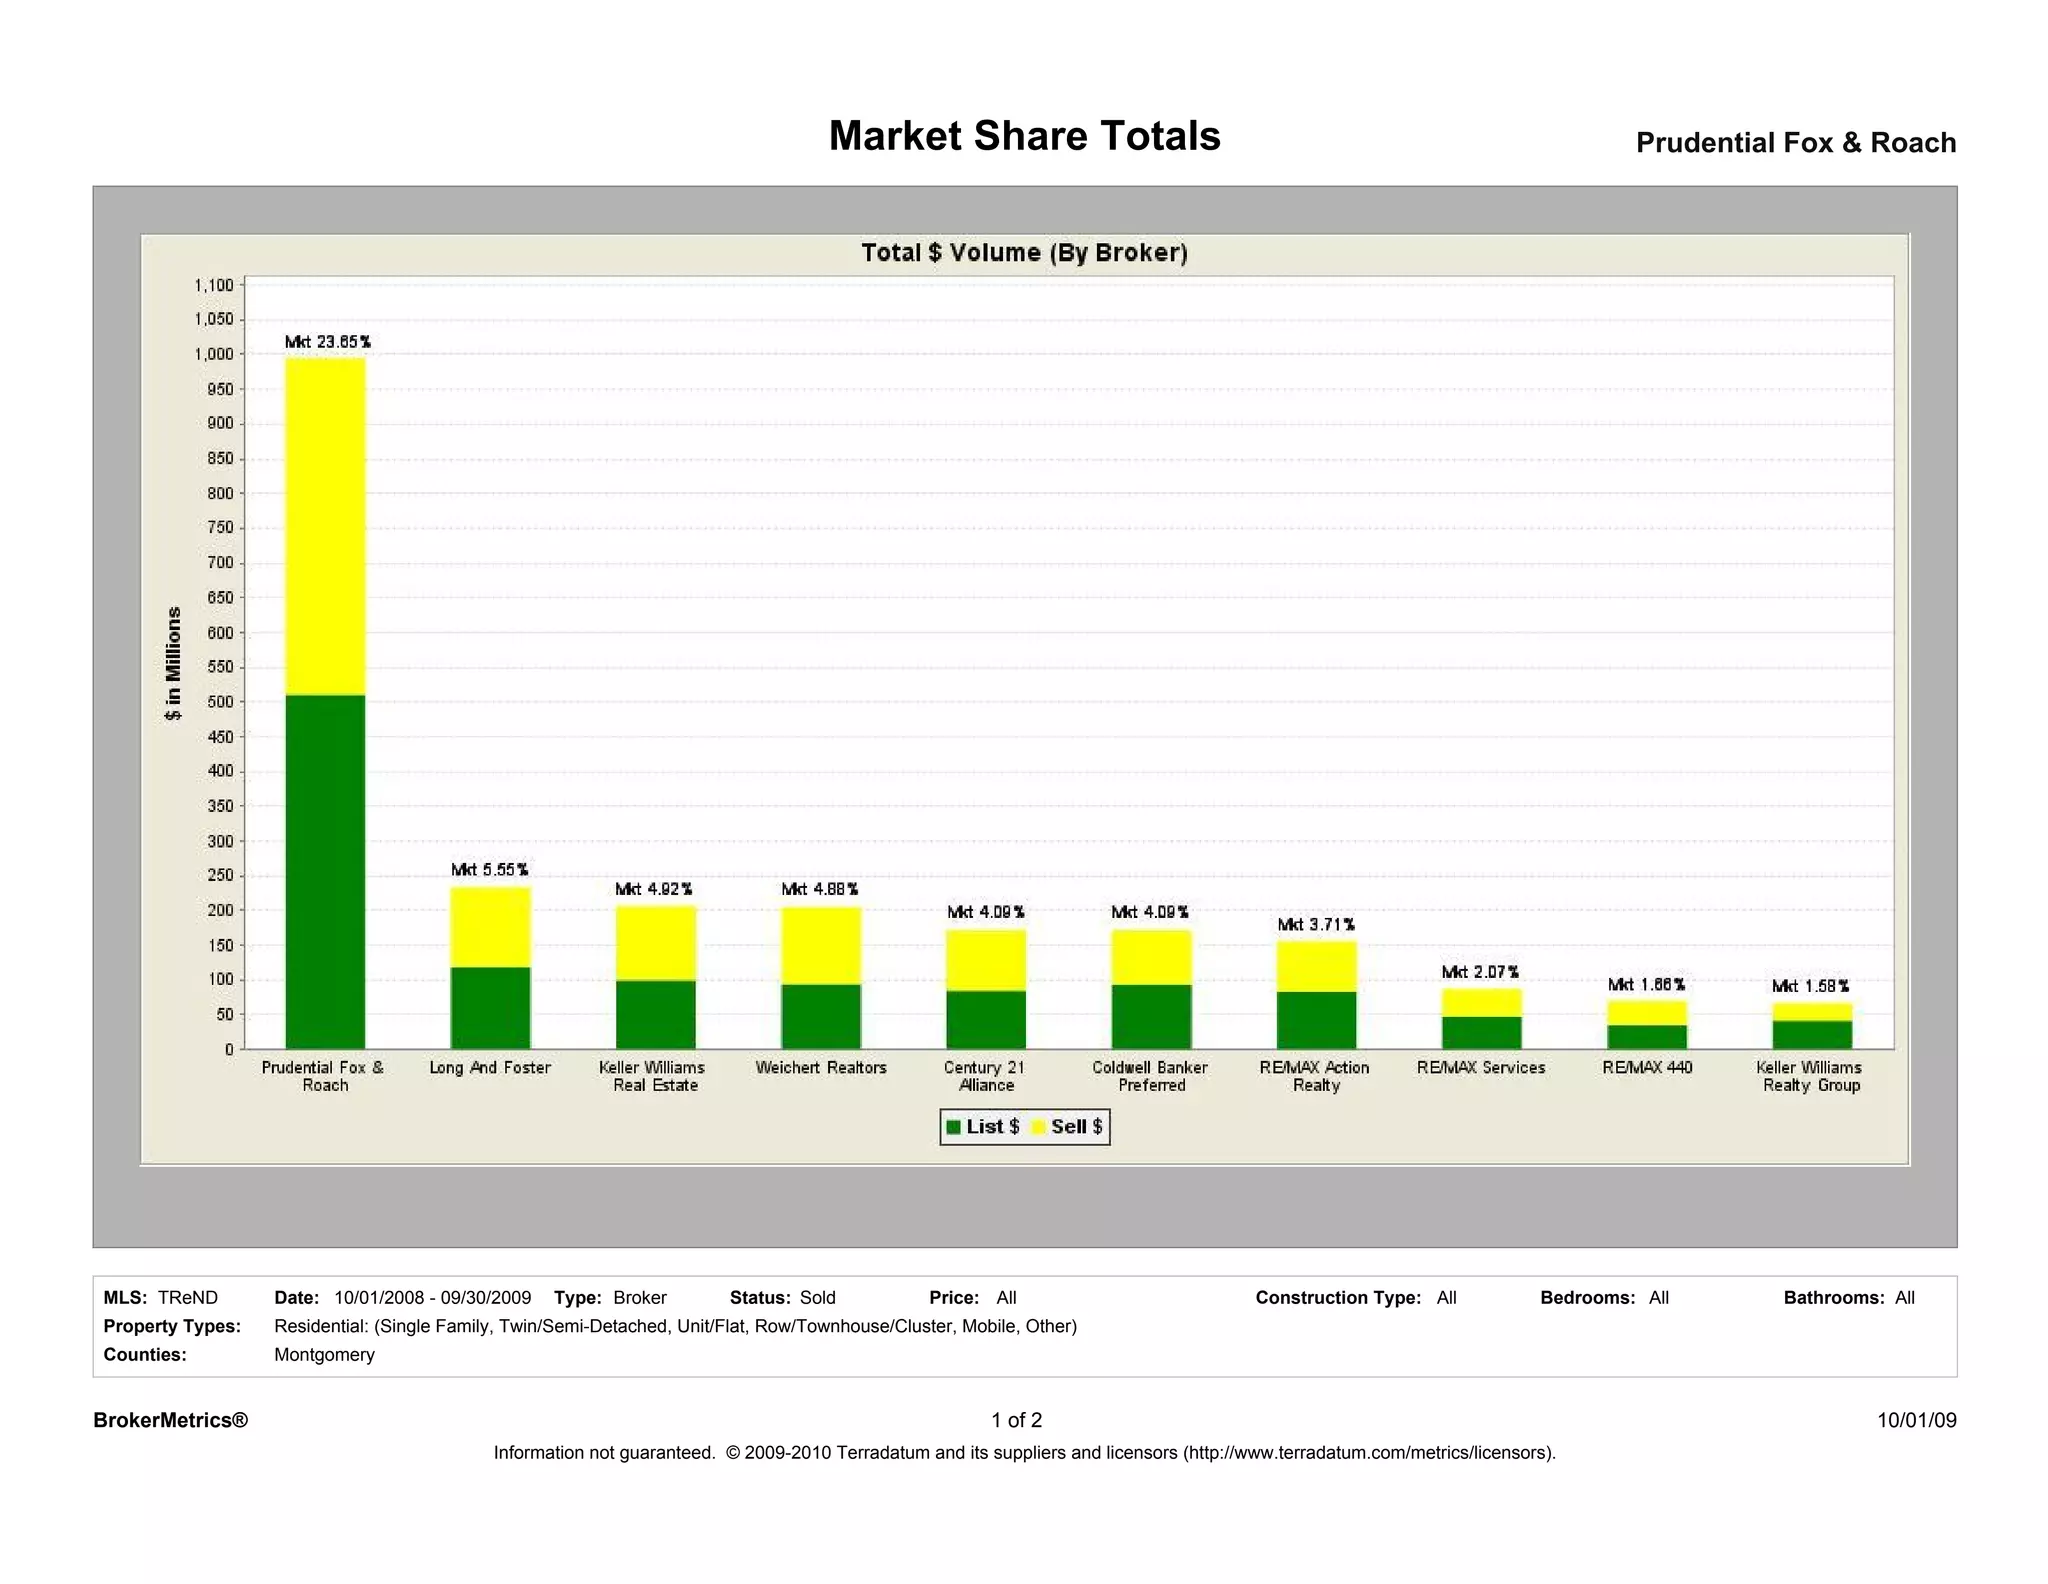
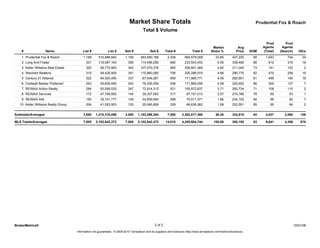

Prudential Fox & Roach had the largest market share of residential real estate sales in Montgomery County for the period of October 1, 2008 to September 30, 2009, with 23.65% of the total dollar volume. They sold 1,159 homes for a total of $483,590,168. Prudential Fox & Roach had 1,643 agents working across their 34 offices.


