Gantt chart
•Download as DOCX, PDF•
0 likes•283 views
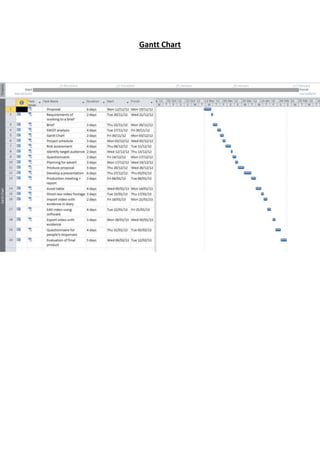
A Gantt chart is a type of bar chart that displays a project schedule. It illustrates the start and finish dates for the individual steps in a project. Gantt charts are useful for planning and scheduling projects as they allow project managers to track project progress and identify delays.
Report
Share
Report
Share
Recommended
Gantt chart
A Gantt chart is a type of bar chart that illustrates a project schedule. It displays the tasks or activities along one axis and time along the other, allowing the visualization of tasks, milestones, and dependencies in a simple bar chart format. A Gantt chart provides a graphical illustration of a project schedule that helps to plan, coordinate, and track specific tasks and milestones in a project.
Gant graph.
Gant Graph is a project management tool used to plan and coordinate tasks and activities. It uses a bar chart format to show the dependencies and relationships between different project tasks and milestones. The Gant Graph helps visualize the sequence of tasks and events and determine the critical path for completing a project on time.
Target audience
This promotional video targets 16-20 year old males and females looking to attend college who live nearby in Cheadle. Competitors include other local colleges such as Xaverian, Loreto, Aquinas, Stockport College and Parrs Wood Sixth Form.
Risk assessment
This risk assessment document identifies potential hazards such as fire, tripping, spills, accidents near roads, and data loss. It notes that everybody is at risk from these hazards and assigns probabilities of them occurring as low, high, or medium. The document recommends evacuation if a fire occurs, checking for injuries from tripping, ensuring electrical equipment is not affected by spills, taking care near roads, and backing up files to prevent data loss.
Questionnaire
This questionnaire asks respondents about creative media, what they enjoy about it, what makes a successful promotional video, if they have any specific requests for a promotional video, how long the video should be, and other elements that should be included. It contains 7 open-ended questions to gather feedback and input from respondents on creating a promotional video for creative media.
Project schedule
The document outlines the key steps and deliverables for a video production project, including creating a proposal, conducting research like a target audience analysis and SWOT, developing a schedule and risk assessment, storyboarding and planning the content, shooting raw footage, editing the video, exporting the final product, gathering feedback via a questionnaire, and evaluating the final video. It provides a high-level overview of the entire project lifecycle and deliverables.
Pitch of my promotional video
The document outlines a plan to create a promotional video for a college creative media course. It will include interviews with students and teachers about what the course offers and their opinions of it, as well as footage of the facilities and students working. The video will have background music and be edited together with footage of the college, interviews, and student work. Considerations around copyright, confidentiality, and avoiding offensive content will be made. The target audience is 16-18 year olds interested in creative media or college. A cameraman, sound person, and editor will be needed, and the college will provide equipment and resources.
Client proposal
The client has asked me to produce a promotional video for a college department that can be used on the college website, as a DVD for prospective students, and uploaded to the college's YouTube and Facebook pages. I will need to negotiate the brief with the client and document our communications. The target audience is teenagers who have just finished high school and others interested in joining college. Resources required include willing students, teachers, a video camera, and college photographs. The production will need a sound person, cameraman, editor, and creative media specialists. As the college is providing all resources, no budget is needed. The process will include planning, creating a proposal, developing a presentation, production meetings, recording raw footage, editing the video
Brainstorm
The document outlines the contents and production process for a promotional video for a creative media course. It will include information about the course, department, and campus from student and teacher interviews. The filming will be done with a video camera and edited on college computers using various programs.
Assets table
This document provides an assets table that lists various audio/video files that will be used in a video project. The table includes columns for the asset name and file type, a description of the asset's content and source, how much of the asset will be used, where it will be placed in the video, its purpose, and whether permission is needed. The assets include background music, title screens, tours of the college and facilities, interviews, and footage of students and resources to give viewers an overview of the college and course.
Storyboard
The video provides interviews about a course from a teacher and student's perspective. It starts with an establishing shot of the campus before cutting to an interview with the teacher about their course. It then shows an interview with a student discussing their experience in the course.
Unit 3b swot analysis
This SWOT analysis document outlines the strengths, weaknesses, opportunities, and threats for a project. The strengths include expertise in the subject area and available multimedia resources. Weaknesses are a low budget and incomplete knowledge of the subject. Opportunities involve collaborating with new people and trying new approaches. Major threats are data loss, weather issues, absences disrupting work, and a tight timeline.
Task 1 proposal
The document outlines a proposal for a promotional video for an extended creative media diploma program at a college. As part of the assignment, the student will need to negotiate details of the video like length, style, and content with the client. Effective advertising methods are discussed, including creating a YouTube video featuring student testimonials, using social media platforms like Facebook to promote the program, and giving presentations at local high schools.
Task 3 brief
This document outlines the budget, deadlines, and content for a promotional video about a Creative Media course. The budget will include a video camera and editing software. Filming will take place in January/February with an April deadline. The video will provide information about the course through interviews and footage of the Creative Media area to demonstrate what students do and learn.
Task 3 investigate animation techniques
Persistence of vision is the theory that an afterimage persists for approximately one twenty-fifth of a second on the retina after an image has been seen. There are two perceptual illusions that can explain motion perception: Phi Phenomenon and Beta Movement. Beta Movement uses static images that seem to move rapidly, similar to animations, while Claymation uses clay or plasticine models and stop motion animation techniques to create animated films.
Task 4 investigate digital animation
Vector animation uses geometrical primitives like points, lines and curves to create images made of paths and nodes that can be scaled without loss of quality. Raster animation uses a grid of pixels so images become pixelated when stretched. Lossy compression reduces file sizes by losing some data quality, especially for images, while lossless compression allows exact reconstruction but with smaller compression ratios. Different file types like .swf, .gif and .mng are used for digital animation and graphics with varying capabilities like support for animation, color depth and compression.
Crew members
The document outlines the roles, skills, and pay for various positions in film and television production. It provides descriptions for the roles of editor, producer, runner, presenter, researcher, camera person, sound person, and director. For each role, it lists the essential skills and experience required but notes that no specific qualifications are needed in most cases. It provides the average weekly pay for a 48 hour work week for each position, ranging from £397 for a runner to £1345 for an editor or director.
More Related Content
More from Alex_Gormley
Client proposal
The client has asked me to produce a promotional video for a college department that can be used on the college website, as a DVD for prospective students, and uploaded to the college's YouTube and Facebook pages. I will need to negotiate the brief with the client and document our communications. The target audience is teenagers who have just finished high school and others interested in joining college. Resources required include willing students, teachers, a video camera, and college photographs. The production will need a sound person, cameraman, editor, and creative media specialists. As the college is providing all resources, no budget is needed. The process will include planning, creating a proposal, developing a presentation, production meetings, recording raw footage, editing the video
Brainstorm
The document outlines the contents and production process for a promotional video for a creative media course. It will include information about the course, department, and campus from student and teacher interviews. The filming will be done with a video camera and edited on college computers using various programs.
Assets table
This document provides an assets table that lists various audio/video files that will be used in a video project. The table includes columns for the asset name and file type, a description of the asset's content and source, how much of the asset will be used, where it will be placed in the video, its purpose, and whether permission is needed. The assets include background music, title screens, tours of the college and facilities, interviews, and footage of students and resources to give viewers an overview of the college and course.
Storyboard
The video provides interviews about a course from a teacher and student's perspective. It starts with an establishing shot of the campus before cutting to an interview with the teacher about their course. It then shows an interview with a student discussing their experience in the course.
Unit 3b swot analysis
This SWOT analysis document outlines the strengths, weaknesses, opportunities, and threats for a project. The strengths include expertise in the subject area and available multimedia resources. Weaknesses are a low budget and incomplete knowledge of the subject. Opportunities involve collaborating with new people and trying new approaches. Major threats are data loss, weather issues, absences disrupting work, and a tight timeline.
Task 1 proposal
The document outlines a proposal for a promotional video for an extended creative media diploma program at a college. As part of the assignment, the student will need to negotiate details of the video like length, style, and content with the client. Effective advertising methods are discussed, including creating a YouTube video featuring student testimonials, using social media platforms like Facebook to promote the program, and giving presentations at local high schools.
Task 3 brief
This document outlines the budget, deadlines, and content for a promotional video about a Creative Media course. The budget will include a video camera and editing software. Filming will take place in January/February with an April deadline. The video will provide information about the course through interviews and footage of the Creative Media area to demonstrate what students do and learn.
Task 3 investigate animation techniques
Persistence of vision is the theory that an afterimage persists for approximately one twenty-fifth of a second on the retina after an image has been seen. There are two perceptual illusions that can explain motion perception: Phi Phenomenon and Beta Movement. Beta Movement uses static images that seem to move rapidly, similar to animations, while Claymation uses clay or plasticine models and stop motion animation techniques to create animated films.
Task 4 investigate digital animation
Vector animation uses geometrical primitives like points, lines and curves to create images made of paths and nodes that can be scaled without loss of quality. Raster animation uses a grid of pixels so images become pixelated when stretched. Lossy compression reduces file sizes by losing some data quality, especially for images, while lossless compression allows exact reconstruction but with smaller compression ratios. Different file types like .swf, .gif and .mng are used for digital animation and graphics with varying capabilities like support for animation, color depth and compression.
Crew members
The document outlines the roles, skills, and pay for various positions in film and television production. It provides descriptions for the roles of editor, producer, runner, presenter, researcher, camera person, sound person, and director. For each role, it lists the essential skills and experience required but notes that no specific qualifications are needed in most cases. It provides the average weekly pay for a 48 hour work week for each position, ranging from £397 for a runner to £1345 for an editor or director.
More from Alex_Gormley (11)
Gantt chart
- 1. Gantt Chart