Download to read offline


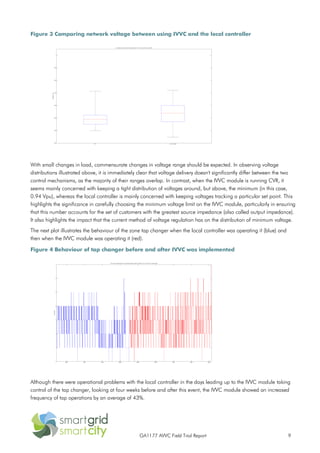


This document summarizes a field trial of an Active Volt-VAr Control (AVVC) system on a distribution network. Key findings include: 1) The AVVC module achieved a small reduction in power flow compared to the local controller over 9 days; 2) The AVVC module kept voltages tighter around the minimum voltage vs the local controller; 3) The AVVC module increased tap operations on the zone transformer by an average of 43% compared to the local controller. Constraints on the trial included limitations of the network model and load conditions tested. The objective was to understand how AVVC can improve network performance and the relevance of measurement points.


