
More Related Content
Similar to G6 m3-a-lesson 3-t
Similar to G6 m3-a-lesson 3-t (20)
More from mlabuski
More from mlabuski (20)
G6 m3-a-lesson 3-t
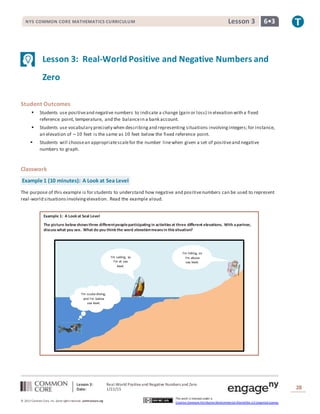
- 1. Lesson 3: Real-World Positiveand Negative Numbers and Zero Date: 1/22/15 28 © 2013 Common Core, Inc. Some rightsreserved. commoncore.org This work is licensed under a Creative Commons Attribution-NonCommercial-ShareAlike 3.0 Unported License. NYS COMMON CORE MATHEMATICS CURRICULUM 6•3Lesson 3 Lesson 3: Real-World Positive and Negative Numbers and Zero Student Outcomes Students use positiveand negative numbers to indicate a change (gain or loss) in elevation with a fixed reference point, temperature, and the balancein a bank account. Students use vocabulary precisely when describingand representing situations involvingintegers;for instance, an elevation of −10 feet is the same as 10 feet below the fixed reference point. Students will choosean appropriatescalefor the number linewhen given a set of positiveand negative numbers to graph. Classwork Example 1 (10 minutes): A Look at Sea Level The purpose of this example is for students to understand how negative and positivenumbers can be used to represent real-world situationsinvolvingelevation. Read the example aloud. Example 1: A Look at Seal Level The picture below showsthree differentpeopleparticipating in activitiesat three different elevations. With apartner, discusswhat you see. What do you think the word elevationmeansin thissituation? I’m hiking, so I’m above sea level. I’m sailing, so I’m at sea level. I’m scuba diving, and I’m below sea level.
- 2. Lesson 3: Real-World Positiveand Negative Numbers and Zero Date: 1/22/15 29 © 2013 Common Core, Inc. Some rightsreserved. commoncore.org This work is licensed under a Creative Commons Attribution-NonCommercial-ShareAlike 3.0 Unported License. NYS COMMON CORE MATHEMATICS CURRICULUM 6•3Lesson 3 Teacher should pose questions to the class and defineelevation. Students will gain additional practicewith elevation by completing Exercise1 independently. PossibleDiscussion Questions: Looking at the picture, if you were to draw a vertical number lineto model elevation, which person’s elevation do you think would be at zero? Explain. Sea level should represent an elevation of zero. So, the person sailing would be at zero because they are sailing on the surface of the water, which is neither above nor below the surface. On a number line, zero is the point or number separating positive and negative numbers. On the same vertical number line,which person’s elevation would be represented above zero? The elevation of the person hiking would be above zero because she is moving higher above the water. On a vertical number line, this is represented by a positive value abovezero because she is above the surface. On the same vertical number line,which person’s elevation do you think would be below zero? The elevation of the person diving would be below zero because he is swimming below the surface of the water. On a vertical number line, this is represented by a negative value below zero because he is below the surface. What does zero represent in this situation? Zero represents the top of the water (the water’s surface). In this example, which numbers correspond to elevations abovesea level? Above sea level means to be above zero, which are positive numbers. In this example, which numbers correspond to elevations belowsea level? Below sea level means to be below zero, which are negative numbers. On a number line,what does itmean to be at sea level? To be at zero. Elevation is the height of a person, place,or thing above a certain reference point. In this case,what is the reference point? The reference point is sea level. Exercises1–3 (5 minutes) Exercises Refer back to Example 1. Use the following information toanswer thequestions. The diver is 𝟑𝟎feet below sealevel. The sailor isat sea level. The hiker is 𝟐miles(𝟏𝟎,𝟓𝟔𝟎feet)above sealevel. 1. Write an integer torepresent eachsituation. Diver : −𝟑𝟎 Sailor: 𝟎 Hiker: 𝟐 miles or 𝟏𝟎,𝟓𝟔𝟎feet
- 3. Lesson 3: Real-World Positiveand Negative Numbers and Zero Date: 1/22/15 30 © 2013 Common Core, Inc. Some rightsreserved. commoncore.org This work is licensed under a Creative Commons Attribution-NonCommercial-ShareAlike 3.0 Unported License. NYS COMMON CORE MATHEMATICS CURRICULUM 6•3Lesson 3 𝟐𝟎 𝟏𝟓 𝟏𝟎 𝟓 𝟎 −𝟓 −𝟏𝟎 −𝟏𝟓 −𝟐𝟎 2. Use an appropriate scale to graph each ofthefollowing situations on thenumber line tothe right. Also, write an integer to represent both situations. a. A hiker is 𝟏𝟓feet above sealevel. 𝟏𝟓 b. A diver is 𝟐𝟎feet below sealevel. −𝟐𝟎 Students should identify common misconceptions of how to represent an answer, based on the phrasingof a question. Students will practicethis skill in Exercise 3. How many feet below sea level is the diver? Students should answer using a positive number, such as 70 feet, because “below” already indicates that the number is negative. Which integer would represent 50 feet below sea level? Students should answer by saying “−50” and not”−50 below sea level.” 3. For each statement thereare two related statements: i and ii. Determine which related statement isexpressed correctly (i and ii), and circleit. Then correctthe otherrelated statement so that bothparts, i and ii, are stated correctly. a. A submarine issubmerged 𝟖𝟎𝟎feet below sealevel. i. The depth ofthe submarineis −𝟖𝟎𝟎feet below sealevel. The depth ofthesubmarine is 𝟖𝟎𝟎feet below sea level. ii. 𝟖𝟎𝟎feet below sealevel can berepresented by theinteger −𝟖𝟎𝟎. b. The elevation ofacoral reefwith respect tosealevelisgiven as −𝟐𝟓𝟎feet. i. The coral reefis 𝟐𝟓𝟎feet below sealevel. ii. The depth ofthe coral reefis −𝟐𝟓𝟎feet below sealevel. The depth ofthecoral reefis 𝟐𝟓𝟎feet below sea level. MP.6
- 4. Lesson 3: Real-World Positiveand Negative Numbers and Zero Date: 1/22/15 31 © 2013 Common Core, Inc. Some rightsreserved. commoncore.org This work is licensed under a Creative Commons Attribution-NonCommercial-ShareAlike 3.0 Unported License. NYS COMMON CORE MATHEMATICS CURRICULUM 6•3Lesson 3 Exploratory Challenge (20 minutes) Materials: Copies (one per student) of the Challenge Exploration Station Record Sheet (See attached template.) Sheets of loose-leaf paper (one per group) for the answer key for their poster Rulers or Meter Stick or Yard Stick (one per group) Construction Paper or Wall-sized Grid Paper (1 sheet for each group) Markers (one set or a few for each group) Students will work in groups of 3–4 to create their own real world situations involving money, temperature, elevation and other real world scenarios. Theteacher gives each group a sheet of wall-sized grid-paper (or construction paper) numbered one to five, markers, and a ruler. Usingthese materials,each group will presentits situation on the paper by including thecomponents in the bulleted listbelow. Allow students 10 minutes to create their posters and hang them on a wall in the room. Title (e.g., Sea Level, Temperature) A written situation based on the title(using at leasttwo points) A blank vertical number line Picture(optional if time permits) Answer key (on a separatesheet of paper stapled to the top back right corner) Groups will rotate every 5 minutes to complete the three tasks on the Station Record sheet of paper while viewingeach poster. Write the integer for each situation. Determine the appropriatescaleto graph the points. Graph the pointon the number line. Closing(3 minutes) How did we record measures of elevation on a number line? Elevations above sea level are positive numbers, and they are above 𝑧𝑒𝑟𝑜. Elevations below sea level are negative numbers, and they are below 𝑧𝑒𝑟𝑜 . Is “−90 feet below sea level” an appropriateanswer to a question? Why or why not? No. You do not need the negative sign to write 90 feet below zero because the word “below” in this case means a negative number. Exit Ticket (7 minutes) Scaffolding: Allowgroups to present their posters to the class, and the classwill answer the questions duringthe presentation.
- 5. Lesson 3: Real-World Positiveand Negative Numbers and Zero Date: 1/22/15 32 © 2013 Common Core, Inc. Some rightsreserved. commoncore.org This work is licensed under a Creative Commons Attribution-NonCommercial-ShareAlike 3.0 Unported License. NYS COMMON CORE MATHEMATICS CURRICULUM 6•3Lesson 3 Name ___________________________________________________ Date____________________ Lesson 3: Real-World Positive and Negative Numbers and Zero Exit Ticket 1. Write a story problem usingsea level that includes both integers −110 and 120. 2. What does zero represent in your story problem? 3. Choose an appropriatescaleto graph both integers on the vertical number line. 4. Graph and label both points on the vertical number line.
- 6. Lesson 3: Real-World Positiveand Negative Numbers and Zero Date: 1/22/15 33 © 2013 Common Core, Inc. Some rightsreserved. commoncore.org This work is licensed under a Creative Commons Attribution-NonCommercial-ShareAlike 3.0 Unported License. NYS COMMON CORE MATHEMATICS CURRICULUM 6•3Lesson 3 𝟏𝟐𝟎 𝟎 −𝟏𝟏𝟎 Exit Ticket Sample Solutions 1. Write astory problem using sealevelthat includesbothintegers −𝟏𝟏𝟎and 𝟏𝟐𝟎. (Answers may vary.) On thebeach, a man’s kiteflies at 𝟏𝟐𝟎feet abovethewater’s surface. In theocean, a whiteshark swims at 𝟏𝟏𝟎feet below thewater’s surface. 2. What doeszero represent in yourstory problem? Zero represents thewater’s surface level. 3. Choose and label an appropriatescale tograph both integerson theverticalnumber line. I chosea scaleof 𝟏𝟎. 4. Graph and label both pointson the vertical number line Problem Set Sample Solutions 1. Write an integer tomatch thefollowing descriptions: a. A debit of $𝟒𝟎 −𝟒𝟎 b. A deposit of $𝟐𝟐𝟓 𝟐𝟐𝟓 c. 𝟏𝟒,𝟎𝟎𝟎feet above sealevel 𝟏𝟒,𝟎𝟎𝟎 d. A temperatureincrease of 𝟒𝟎 degrees 𝟒𝟎 e. A withdrawal of $𝟐𝟐𝟓 −𝟐𝟐𝟓 f. 𝟏𝟒,𝟎𝟎𝟎feet below sealevel −𝟏𝟒,𝟎𝟎𝟎 For questions 2–4, read each statementabout a real-world situation and thetwo relatedstatementsin parts (a)and (b) carefully. Circlethe correctway to describe each real-world situation; possibleanswers include either (a), (b), or both (a) and (b). 2. A whale is 𝟔𝟎𝟎feet below the surfaceofthe ocean water. a. The depth ofthe whale is 𝟔𝟎𝟎feet from thewater’ssurface. b. The whale is −𝟔𝟎𝟎feet below thesurface ofthe ocean water.
- 7. Lesson 3: Real-World Positiveand Negative Numbers and Zero Date: 1/22/15 34 © 2013 Common Core, Inc. Some rightsreserved. commoncore.org This work is licensed under a Creative Commons Attribution-NonCommercial-ShareAlike 3.0 Unported License. NYS COMMON CORE MATHEMATICS CURRICULUM 6•3Lesson 3 3. The elevation ofan iceberg withrespect tosealevelisgiven as −𝟏𝟐𝟓feet. a. The iceberg is 𝟏𝟐𝟓above sealevel. b. The iceberg is 𝟏𝟐𝟓feet below sealevel. 4. Alex’sbody temperaturedecreased by 𝟐°𝑭. a. Alex’sbody temperaturedropped 𝟐°𝑭. b. The integer −𝟐representsthe change in Alex’sbody temperaturein degreesFahrenheit. 5. A credit of$𝟑𝟓and adebit of $𝟒𝟎are applied to your bank account. a. What isan appropriate scale to graph acredit of$𝟑𝟓and adebit of $𝟒𝟎? Explain your reasoning. I would count by 𝟓’𝒔becauseboth numbers aremultiples of 𝟓. b. What integer represents“acredit of$𝟑𝟓” ifzero representstheoriginal balance? Explain. 𝟑𝟓; a credit is greater than zero, and numbers greater than zero arepositivenumbers. c. What integer describes“debit of $𝟒𝟎” ifzero representstheoriginal balance? Explain. −𝟒𝟎; a debit is less than zero, and numbers less than 𝒛𝒆𝒓𝒐arenegativenumbers. d. Based on your scale, describethelocation ofbothintegerson the number line. 𝟑𝟓would be 𝟕units to theright ofzero, and −𝟒𝟎wouldbe 𝟖units to theleft ofzero. e. What doeszero represent in thissituation? Zero represents no change being madeto theaccount balance. In other words, no amount is either subtracted or added totheaccount.
- 8. Lesson 3: Real-World Positiveand Negative Numbers and Zero Date: 1/22/15 35 © 2013 Common Core, Inc. Some rightsreserved. commoncore.org This work is licensed under a Creative Commons Attribution-NonCommercial-ShareAlike 3.0 Unported License. NYS COMMON CORE MATHEMATICS CURRICULUM 6•3Lesson 3 Name ___________________________________________________ Date____________________ ExploratoryChallenge Station Record Sheet #1 # 2 #3 # 4 #5 Poster # _______ Integer(s): ___________________ Number Line Scale ________ Poster # _______ Integer(s): ___________________ Number Line Scale ________ Poster # _______ Integer(s): ___________________ Number Line Scale ________ Poster # _______ Integer(s): ___________________ Number Line Scale ________ Poster # _______ Integer(s): ___________________ Number Line Scale ________