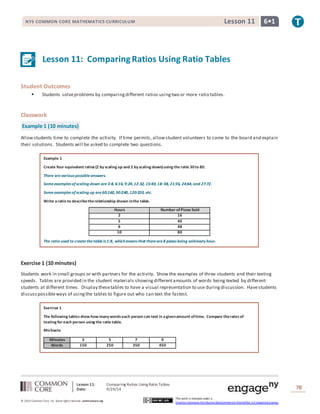
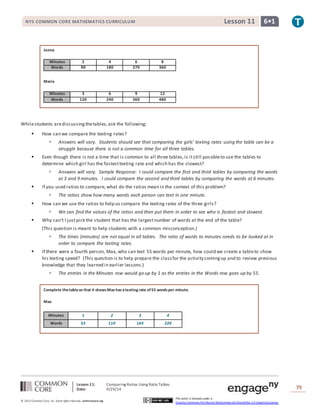
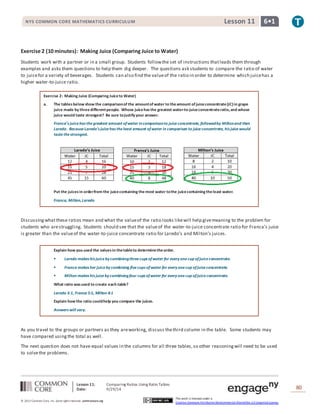
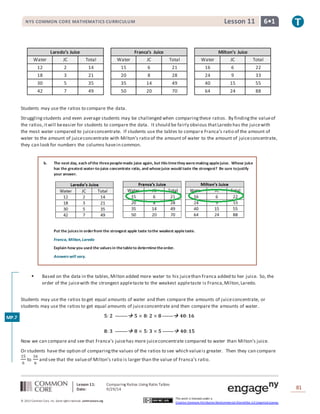
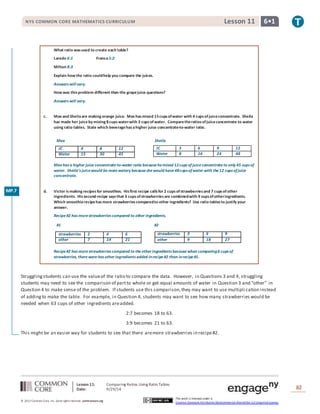
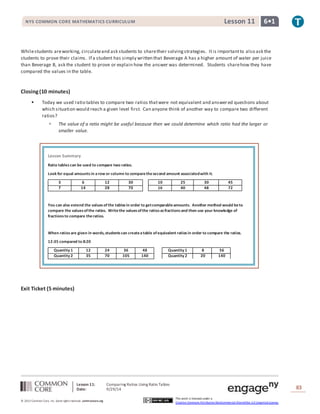
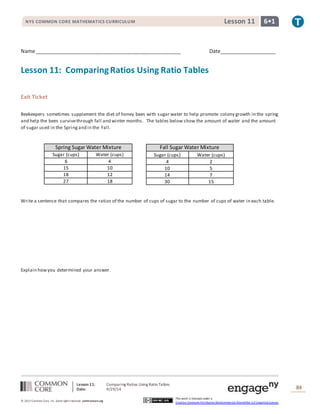
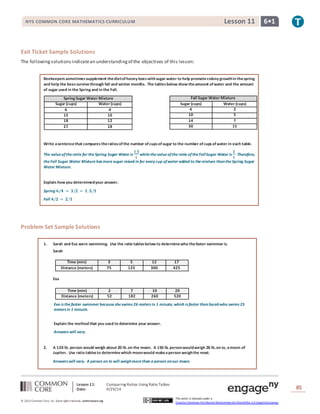
This document describes a mathematics lesson that teaches students how to compare ratios using ratio tables. The lesson begins with two examples that ask students to create equivalent ratios and write a ratio to describe a relationship shown in a table. Students then work in groups to compare the texting speeds of three individuals using ratio tables. The tables do not have a common time value, so students must determine another way to compare the ratios. Subsequent exercises ask students to compare ratios involving juice mixtures and smoothie recipes using ratio tables. The lesson concludes with a summary of how to compare ratios with ratio tables and an exit ticket problem involving comparing sugar to water ratios in beekeeper mixtures.
This document contains notes from a mathematics lesson on comparing ratios using ratio tables. It includes examples of creating ratio tables with different units and using the tables to determine which ratio represents a larger amount. Students practiced comparing ratios for situations like texting speed, juice mixing, and smoothie recipes. The document demonstrates how to set up, read, and analyze ratio tables to determine the relationship between quantities and compare two different ratios.
This document contains a mathematics lesson on comparing ratios using ratio tables. It includes examples of creating ratio tables to compare rates of texting between students and amounts of water and juice concentrate in homemade juices. Students are asked to use ratio tables to determine which juices have the strongest or weakest taste, which swimmer is faster, and which moon would make a person weigh the most. The lesson demonstrates how to set up, extend if needed, and compare ratio tables to determine relationships between quantities.
- The document describes a lesson on comparing ratios using ratio tables. It includes examples of creating ratio tables to compare the texting speeds of three students and comparing the water-to-juice ratios in drinks made by different people.
- Students work through exercises to practice using ratio tables to determine which student can text the fastest and which drinks have the highest water-to-juice ratios and would therefore taste the weakest.
- The lesson emphasizes that comparing the values of the ratios is necessary, rather than just looking at the total numbers, because the time periods or amounts are not equal across the different tables.
This document is a lesson plan on creating tables of equivalent ratios. It includes examples of setting up ratio tables to solve problems involving mixing ingredients, calculating pay rates, and fish tank sizes. The lesson emphasizes that a ratio table lists all possible equivalent ratios for describing a given ratio relationship, and that all ratios in the table will have the same value. Students practice setting up ratio tables and using them to answer questions about converting between units and determining quantities.
This document provides a lesson on creating tables of equivalent ratios to solve problems. It includes two examples of setting up ratio tables based on real-world scenarios involving mixing ingredients and earning money. Students then complete two exercises creating ratio tables for situations involving spraying plants and setting up a fish tank. The lesson emphasizes that a ratio table displays equivalent ratios and can be used to answer questions about the relationship between quantities.
This document provides a lesson on ratio tables that can be constructed additively or multiplicatively. It includes an example of creating three ratio tables to show amounts of blueberries and strawberries needed for fruit salads serving different numbers of people. The lesson examines patterns in the tables and relationships between the values in each column. It also identifies mistakes in sample ratio tables and shows how to correct them.
The document describes a lesson on ratio tables that have both additive and multiplicative structures. Students create three ratio tables showing amounts of blueberries and strawberries needed for fruit salads serving different numbers of people. The tables all use a 1:3 ratio of blueberries to strawberries. Students analyze patterns in the tables, such as entries increasing by addition or multiplication. They also describe how the blueberry and strawberry columns relate both to each other and within themselves.
The document provides examples and definitions related to ratios, proportions, and percents. It defines a ratio as a comparison of two quantities by division, which can be expressed as a fraction. It gives examples of writing ratios as fractions and finding unit rates. Unit rates compare quantities in different units and allow comparing values such as price per ounce when shopping. The document also discusses converting between rates and ratios using dimensional analysis.
The document describes a lesson on ratio tables that have both additive and multiplicative structures. It includes three examples of ratio tables showing amounts of blueberries and strawberries. Students are asked to identify patterns in the tables and use the tables to determine unknown values. The lesson emphasizes that ratio tables must maintain a constant ratio between corresponding values and can be extended using addition or multiplication.
This document outlines a lesson on ratios for 6th grade students. It includes student learning outcomes, lesson notes, examples, exercises and a lesson summary. Students will understand that a ratio is an ordered pair of non-negative numbers and is written with a colon or "to". They will use ratios to describe relationships between quantities. Examples include setting up tables to represent ratios and writing ratios to describe classroom and everyday situations.
This document describes a lesson on tables of equivalent ratios. It includes two examples of creating ratio tables to represent relationships between quantities. The lesson notes indicate that the teacher should model using tables to solve problems, without explanation, so that students learn tables are a useful tool. The student outcomes are that students understand ratios can describe relationships between quantities and that a ratio table displays equivalent ratios.
- The document discusses ratios and equivalent ratios. It explains that two ratios are equivalent if they have the same value, where the value of a ratio is the quotient of the two terms.
- Students work through examples to understand that the values of equivalent ratios are always equal. They also try unsuccessfully to provide counter-examples to the theorem that if two ratios are equivalent, they have the same value.
- An example problem asks students to use the value of a ratio to determine if ratios describing a student's training are equivalent or not.
- The document discusses ratios and equivalent ratios. It defines the value of a ratio as the quotient of the two terms in the ratio.
- It states that if two ratios are equivalent, then they have the same value. Several examples are provided to illustrate this concept.
- Students are asked to identify equivalent ratios, calculate the value of ratios, and use ratio values to determine if ratios are equivalent in word problems. The goal is for students to understand that equivalent ratios have the same value.
This document provides lesson materials for teaching ratios to students. It includes examples of using ratios to describe real-world situations like the gender makeup of a soccer team. Students practice writing ratios in different forms and describing ratio relationships using words. They come up with their own ratios to represent comparisons in the classroom. The lesson emphasizes that a ratio is an ordered pair of numbers and that the order matters in conveying the correct relationship. Exercises give students practice interpreting and expressing ratios verbally and numerically.
This document presents a lesson on ratio tables that relate the amounts of blueberries and strawberries added to fruit salads for different numbers of people. Students are asked to create three ratio tables showing the amounts of blueberries and strawberries needed if more than 10, less than 50, and more than 100 quarts of blueberries are added. They are then asked questions to analyze patterns in the tables and use the tables to determine amounts given certain criteria.
This document describes a mathematics lesson on converting between rates, unit rates, and ratios. The lesson includes examples of writing rates as ratios, determining unit rates from ratios, and representing a given rate with different equivalent ratios. Students practice these skills on examples involving rates of cleaning pools, typing pages, and swimming distances. The lesson aims to help students recognize that all ratios associated with a given rate are equivalent, although different representations are possible.
This lesson teaches students about representing ratios using double number line diagrams. Students will:
1) Create equivalent ratios using ratio tables and represent them on double number line diagrams.
2) Use double number line diagrams to solve real-world ratio problems.
3) Learn that double number lines use two scales, as ratios often involve two different units that are not equivalent.
Here are some real-world examples of relationships that have a constant rate of change:
- The speed of a car traveling at a constant velocity - As time passes, the car's position changes at a steady rate.
- Interest accumulating in a bank account - The interest earned each time period is a constant percentage of the current balance.
- Population growth over time - If the birth and death rates remain steady, the population will increase at a constant percentage each year.
- Depreciation of an asset - Most assets lose value at a steady rate each year due to age and wear.
- Temperature change from heating or cooling an object - The temperature will change at a steady rate until the object reaches equilibrium with its
This document outlines a lesson on equivalent ratios defined through the value of a ratio. The lesson begins with exercises to determine if ratios are equivalent based on their values. It is established that if two ratios are equivalent, then they have the same value. Word problems are then presented to apply the concept, including one about a student training for a duathlon. Students are asked to identify ratios, find their values, and use the values to determine if ratios are equivalent in different scenarios.
This document contains a mathematics lesson on equivalent ratios. It includes exercises that have students identify equivalent ratios based on their values, provides a theorem stating that equivalent ratios have the same value, and gives word problems for students to practice applying the concept of ratio value. The lesson defines equivalent ratios as ratios that have the same value, with value defined as the quotient of the two ratio terms.
This document outlines a mathematics lesson on ratios for 6th grade students. It includes learning objectives, classroom activities and exercises for students to practice ratios. Students reinforce their understanding of ratios as ordered pairs of numbers and use precise ratio language and notation. They also create ratios from real-world contexts and consider whether ratios are the same if the order of numbers is changed.
This document provides information about a 6th grade math unit on ratios and equivalent ratios. The unit focuses on developing an understanding of ratios and rates through representing them with models, fractions, decimals and solving real-world problems. Students will learn to identify and write ratios, represent them in multiple ways, generate equivalent ratios, and use ratio reasoning to solve rate and percent problems. The document outlines standards, objectives, key concepts, vocabulary, examples and lesson plans to teach these skills.
(7) Lesson 1.4 - Proportional and Nonproportional Relationshipswzuri
This document provides examples and explanations for identifying proportional and nonproportional relationships between quantities. It begins with examples of converting between different measurement units. The next sections explain how to identify if two quantities have a proportional relationship by checking if their ratios are equivalent. Examples are provided of proportional relationships where the ratios are constant, as well as nonproportional relationships where the ratios differ. The document emphasizes using tables and graphs to determine if ratios between quantities simplify to the same value, indicating a proportional relationship.
Using the data in the file named Ch. 11 Data Set 2, test the resea.docxdaniahendric
Using the data in the file named Ch. 11 Data Set 2, test the research hypothesis at the .05 level of significance that boys raise their hands in class more often than girls. Do this practice problem by hand using a calculator. What is your conclusion regarding the research hypothesis? Remember to first decide whether this is a one- or two-tailed test.
Using the same data set (Ch. 11 Data Set 2), test the research hypothesis at the .01 level of significance that there is a difference between boys and girls in the number of times they raise their hands in class. Do this practice problem by hand using a calculator. What is your conclusion regarding the research hypothesis? You used the same data for this problem as for Question 1, but you have a different hypothesis (one is directional and the other is nondirectional). How do the results differ and why?
Practice the following problems by hand just to see if you can get the numbers right. Using the following information, calculate the
t
test statistic.
Using the results you got from Question 3 and a level of significance at .05, what are the two-tailed critical values associated with each? Would the null hypothesis be rejected?
Using the data in the file named Ch. 11 Data Set 3, test the null hypothesis that urban and rural residents both have the same attitude toward gun control. Use IBM
®
SPSS
®
software to complete the analysis for this problem.
A public health researcher tested the hypothesis that providing new car buyers with child safety seats will also act as an incentive for parents to take other measures to protect their children (such as driving more safely, child-proofing the home, and so on). Dr. L counted all the occurrences of safe behaviors in the cars and homes of the parents who accepted the seats versus those who did not. The findings: a significant difference at the .013 level. Another researcher did exactly the same study; everything was the same—same type of sample, same outcome measures, same car seats, and so on. Dr. R’s results were marginally significant (recall Ch. 9) at the .051 level. Which result do you trust more and why?
In the following examples, indicate whether you would perform a
t
test of independent means or dependent means.
Two groups were exposed to different treatment levels for ankle sprains. Which treatment was most effective?
A researcher in nursing wanted to know if the recovery of patients was quicker when some received additional in-home care whereas when others received the standard amount.
A group of adolescent boys was offered interpersonal skills counseling and then tested in September and May to see if there was any impact on family harmony.
One group of adult men was given instructions in reducing their high blood pressure whereas another was not given any instructions.
One group of men was provided access to an exercise program and tested two times over a 6-month period for heart health.
For Ch. 12 Data Set 3, comput.
This document discusses using ratio tables to determine the value of a ratio and write equations to model relationships. It provides examples of ratio tables for mixing paint, ratios of men to women in military training, and minutes spent running versus walking during training for a half marathon. Students are asked to complete ratio tables, determine ratio values, and write equations to represent different relationships.
This document contains materials for a mathematics lesson on ratios and proportions. It includes examples of writing ratios using fractions and colons, forming proportions, and finding missing terms in proportions. Activities guide students to form ratios, write proportions, solve word problems involving ratios, and evaluate their understanding through questions and applications using visual representations. Cooperative learning strategies and using various tools like charts and presentations are suggested for instruction.
This document contains information about ratios, proportions, and using proportional relationships to solve problems:
1. It provides examples of writing and solving proportions to determine unknown values. Proportions can be written as fraction or ratio equations and solved using cross products.
2. It discusses how to identify if a relationship is proportional by determining if the graph is a straight line that passes through the origin, and how to write an equation to represent a proportional relationship using a unit rate.
3. It contains lessons on recognizing and representing proportional relationships between quantities, identifying constants of proportionality, and using proportional relationships to solve multi-step ratio and percent problems.
This document provides a lesson plan on understanding the relationships between rates, unit rates, and ratios. It includes examples of converting between rates and ratios. Key points covered are:
- A rate can be represented by multiple equivalent ratios that have the same value.
- All ratios associated with a given rate are equivalent.
- Everyone will have the same unit rate for a given ratio because the unit rate only has one value.
- A unit rate can represent multiple rates since it does not specify the quantities involved.
The lesson concludes by explaining the similarities and differences between rates, unit rates, and ratios.
This document is a study guide for nouns created by Mrs. Labuski. It contains vocabulary terms related to nouns and lists 21 lessons on different types of nouns including concrete nouns, abstract nouns, common nouns, proper nouns, singular nouns, plural nouns, and possessive nouns. For each lesson, it provides links to online interactive activities and practice exercises related to the noun topic. It also lists additional grammar resources for further practice.
This document contains a quiz on nouns with questions about identifying different types of nouns such as proper, concrete, abstract, and plural nouns. It also contains exercises on forming plural nouns and possessive nouns as well as a short story and questions to identify nouns in the story. The key provides the answers to the quiz and exercises.
This document outlines the curriculum, expectations, and supplies for a 6th grade social studies class. It includes:
- An overview of the course content which will cover the geography and history of the Eastern Hemisphere, including major ancient and modern civilizations.
- A list of required supplies and materials for classwork and homework assignments.
- Classroom expectations which emphasize being prepared, respectful, and asking questions.
- Details on grading, homework policies, absences, units to be covered, and contact information for the teachers and website.
The document is a supply list for Team Orion's sixth grade class for the 2015-2016 school year. It lists the required supplies for the team binder and various subjects including science, social studies, English Language Arts (ELA), and math. Some common required items across subjects are binders, loose-leaf paper, dividers, and tissues. Supplies are tailored to individual teachers for ELA and math. Students are only allowed to carry two binders between classes and will have time to go to lockers between periods.
This document provides an outline for writing a book report with 4 paragraphs: an introduction summarizing the book's events and setting, a character description paragraph with evidence, an excerpt explanation paragraph, and a conclusion discussing the author's purpose and theme. The book report format emphasizes including textual evidence and explaining the relevance and significance of key moments in the story.
The document outlines the supply list for Team Orion's sixth grade students for the 2015-2016 school year. It details the supplies needed for a team binder to be carried between all classes, as well as subject-specific supplies for science, social studies, English language arts, and math. Students are asked to have a team binder, subject binders, loose-leaf paper, dividers, notebooks, folders, and other classroom supplies such as tissues and post-it notes. They are not allowed to carry backpacks between classes.
This document provides an outline for writing a business letter summarizing a recently read book. The letter should include an introduction paragraph with the title, author, genre, and brief summary. A second paragraph should make a claim about a main character and provide textual evidence. A third paragraph should include a scene excerpt, its relevance, and why it was chosen. The conclusion paragraph should discuss the author's purpose and theme. A bibliography is required at the end. The letter must follow proper formatting guidelines.
This document contains a review sheet for a math final exam. It includes two parts - a multiple choice section with 37 questions covering various math concepts, and a short answer section with 7 word problems requiring calculations and explanations. The review sheet provides the questions, space to write answers, and an answer key in the back to check work.
This document contains a multi-part math exam review with multiple choice and short answer questions. It provides practice problems covering topics like geometry, ratios, equations, expressions, and word problems. The review is designed to help students prepare for their math final exam.
This document contains a review sheet for a math final exam. It includes multiple choice and short answer questions covering topics like geometry, algebra, ratios, and word problems. It also provides the answers to the multiple choice section. The short answer questions require showing work and include problems finding areas, writing equations, comparing ratios, and solving word problems involving money.
This document contains a math lesson on calculating the volume of rectangular prisms. It provides examples of three rectangular prisms with different heights but the same length and width, and has students write expressions for the volume of each. It then has students recognize that these expressions all represent the area of the base multiplied by the height. Students are asked to determine the volumes of additional prisms using this area of base times height formula.
This document contains notes from a math lesson on volume. It discusses determining the volume of composite figures using decomposition into simpler shapes. Students will practice finding the volume of various objects. The document contains examples of area problems and notes for students to solve.
1) This lesson teaches students the formulas for calculating the volume of right rectangular prisms and cubes. It provides examples of using the formulas to find the volume when given the length, width, height or area of the base.
2) Students complete exercises that explore how changes to the lengths or heights affect the volume. They discover that if the height is doubled, the volume is also doubled, and if the height is tripled the volume is tripled.
3) No matter the shape, when the side lengths are changed by the same fractional amount, the volume changes by that fractional amount cubed. For example, if the sides are halved, the volume is one-eighth of the original.
This document provides examples and exercises about calculating the volumes of cubes and rectangular prisms using formulas. It begins with examples of calculating the volume of a cube with sides of 2 1/4 cm and a rectangular prism with a base area of 7/12 ft^2 and height of 1/3 ft. The exercises then involve calculating volumes of cubes and prisms when dimensions are changed, identifying relationships between dimensions and volumes, and writing expressions for volumes.
This lesson teaches students about calculating the volume of rectangular prisms using two different formulas: 1) length × width × height and 2) area of the base × height. Students work through examples calculating the volume of various rectangular prisms using both formulas. They learn that it does not matter which face is used as the base, as the volume will be the same. The lesson reinforces that volume can be expressed in multiple equivalent ways and emphasizes using the area of the base times the height.
This document provides examples and problems about calculating the volume of rectangular prisms. It begins by showing different rectangular prisms and having students write expressions for the volume of each using length, width, and height. It explains that the volume can also be written as the area of the base times the height. Students then practice calculating volumes using both methods. Later problems involve calculating volume when given the area of the base and height or vice versa. The goal is for students to understand that the volume of a rectangular prism is the area of its base multiplied by its height.
1) The document outlines a math lesson plan for a week in May that includes topics on polygons, area, surface area, and volume.
2) On Tuesday, students will work on problem sets for Lesson 9 and 13, which cover finding the perimeter and area of polygons on the coordinate plane.
3) On Thursday, students will work on a Lesson 15 worksheet, and on Friday they are asked to bring in a rectangular prism from home to create a net and label edge lengths.
Lesson 9 focuses on determining the area and perimeter of polygons on the coordinate plane. Students will find the perimeter of irregular figures by using coordinates to find the length of sides joining points with the same x- or y-coordinate. Students will also find the area enclosed by a polygon by composing or decomposing it into polygons with known area formulas. The lesson provides examples of calculating perimeter and area, as well as exercises for students to practice these skills by decomposing polygons in different ways.
This lesson teaches students how to determine the area and perimeter of polygons on a coordinate plane. It includes examples of calculating area and perimeter of polygons. Students are given exercises to calculate the area of various polygons, determine both the area and perimeter of shapes, and write expressions to represent the area calculated in different ways. The lesson aims to help students practice finding area and perimeter of polygons located on a coordinate plane.
This document discusses a lesson on drawing polygons on the coordinate plane. The lesson objectives are for students to use absolute value to determine distances between integers on the coordinate plane in order to find side lengths of polygons. The document includes examples of polygons drawn on the coordinate plane and questions about determining their areas and shapes. It closes by asking students to complete an exit ticket to assess their understanding of determining areas of polygons using different methods, and how the polygon shape influences the area calculation method.